Embed Size (px)
Citation preview

Application note
Received: 3 April 2012 Revised: 16 July 2012 Accepted: 22 July 2012 Published online in Wiley Online Library
(wileyonlinelibrary.com) DOI 10.1002/jms.3069
Investigation and reduction of sub-microgrampeptide loss using molecular weightcut-off fractionation prior to massspectrometric analysisRobert Cunningham,a Jingxin Wang,b Daniel Wellnera and Lingjun Lia*
This work investigates the introduction of methanol and a salt modifier to molecular weight cut-off membrane-based centrif-ugal filters (MWCO) to enrich sub-microgram peptide quantities. Using a neuropeptide standard, bradykinin, sample loss was
reduced over two orders of magnitude with and without undigested protein present. Additionally, a bovine serum albumintryptic digestion was investigated. Twenty-seven tryptic peptides were identified from MALDI mass spectra after enrichingwith methanol while only two tryptic peptides were identified after MWCO separation using H2O. The strategy presented hereenhances recovery from MWCO separation for sub-mg peptide samples. Copyright © 2012 John Wiley & Sons, Ltd.Supporting information may be found in the online version of this article.
Keywords: mass spectrometry; peptides; molecular weight cut-off fractionation; sample preparation
* Correspondence to: Lingjun Li, Department of Chemistry & School ofPharmacy, University of Wisconsin-Madison, 777 Highland Ave., Madison, WI53705. E-mail: [email protected]
a Department of Chemistry and School of Pharmacy, University of Wisconsin-Madison, Madison, WI 53705
b Neuroscience Training Program, University of Wisconsin-Madison, Madison,WI 53705
13
Introduction
Molecular weight cut-off membrane-based centrifugal filterdevices (MWCO) are commonly used to desalt and concentratelarge molecular weight proteins.[1] Greeing and Simpson recentlyinvestigated various MWCO membranes for large amounts ofstarting material (~6 mg), focusing on optimal conditions forthe sub 25 kDa protein fraction.[2] The authors recovered 200mgto 2.9 mg of protein from multiple MWCO experiments anddemonstrated that a 10:90 acetonitrile (ACN):H2O elution solventproduced optimal results.[3] In addition, Manza et. al. providedan alternative approach to isolate proteins with a 5 kDa MWCOby using NH4HCO3 and recovering the retained proteins.[4]
Alternatively, the elution fromMWCOs can be collected to recoveronly low molecular weight peptides. Multiple peptidomic studieshave utilizedMWCOs for peptide isolation during the first few stepsof sample preparation.[5,6] When sample amount is limited orpeptide content is below 1mg, sample loss is a significant concernwhen using MWCOs to isolate endogenous peptides. Optimizedprotocols have been investigated using ACN,[3,7] salt [4,8], SDS [5]
or native sample,[6,9,10] but these experiments primarily focusedon large sample amounts rather than sub-microgram peptidequantities.
MWCOs separate large molecules from small molecules. Thesmall molecule fraction may be rich with signaling peptides (SP),cytokines and other small molecules involved in cell-cell signaling.SP perform various functions in the body, including cell growth,cell survival and hormonal signaling between organs.[11] IndividualSP contributes to different aspects of behavior, such as pain(enkephalins),[12] feeding (neuropeptide Y)[13] and blood pressure(bradykinin).[14] MWCO separations can be used to enrich biologi-cally important SP and explore the peptide content from biologicalfluids with relatively low peptide concentration like blood or
J. Mass Spectrom. 2012, 47, 1327–1332
cerebrospinal fluid (CSF). In a recent investigation, the detectionof neuropeptides and standards in crustacean hemolymph wasimproved when methanol and protease inhibitors were presentbefore performing MWCO neuropeptide isolation. The impact ofmethanol on MWCO sample loss was not investigated in thestudy.[15] In another study, a large-scale mass fingerprintingprotocol of endogenous peptides from CSF used a combinationof salts before MWCO fractionation, but the impact of adding saltswas not discussed.[16] One of the most commonly used brand ofMWCO in the publications and in peptidomic studies is Millipore.Therefore, Millipore MWCOs (using regenerated cellulose as themembrane) were used in the present study. The purpose of thiswork is to provide an optimized sample preparation techniquefor MWCO filtering to reduce sample loss and allow sub-mgdetection of peptides using MALDI mass spectrometry.
Materials and methods
Materials and chemicals
Water, ACN, methanol (optima LC/MS grade) and sodium chloride(99.5%) were purchased from Fisher Scientific (Fair Lawn, NJ). Thea-cyano-4-hydroxy-cinnamic acid (CHCA) (99%), formic acid (FA)
Copyright © 2012 John Wiley & Sons, Ltd.
27
R. Cunningham et al.
1328
(≥98%) and bovine serum albumin (BSA) (≥96%) were purchasedfrom Sigma-Aldrich (St. Louis, MO). Amicon Ultra 0.5mL 10,000MWCO centrifugal filters and ZipTips packed with C18 reversed-phase resin were purchased from Millipore (Billerica, MA).Trypsin-digested BSA was purchased from Waters (Milford, MA).Bradykinin was purchased from American Peptide Company(Sunnyvale, CA).
MALDI MS Instrumentation
An AutoFLEX III MALDI TOF/TOF mass spectrometer (BrukerDaltonics, Billerica, MA) was operated in positive ion reflectronmode. The MALDI MS instrument is equipped with a proprietarysmart beam (Bruker Daltonics, Billerica, MA) laser operating at200 Hz repetition rate. The instrument was internally calibratedover the mass range of m/z 500–2500 using a standard peptidemix. Two thousand laser shots were collected per sample spotat an accelerating voltage of 19 kV and a constant laser powerusing random shot selection. The acquired data were analyzedusing FlexAnalysis software (Bruker Daltonics, Billerica, MA).Mass spectrometry data acquisition was obtained by averaging2000 laser shots.
Molecular weight cut off separation procedure
The MWCO separations were performed using Amicon Ultra 0.5mL10,000 MWCO centrifugal filters (Billerica, MA). Before MWCOseparation, three washing steps were performed to removecontaminants from the filter. The three washes were 500mL of50:50 H2O:MeOH, 500mL of H2O and 400mL of the solution usedfor MWCO separation. For the 100% H2O solution, 1mg of BSA or
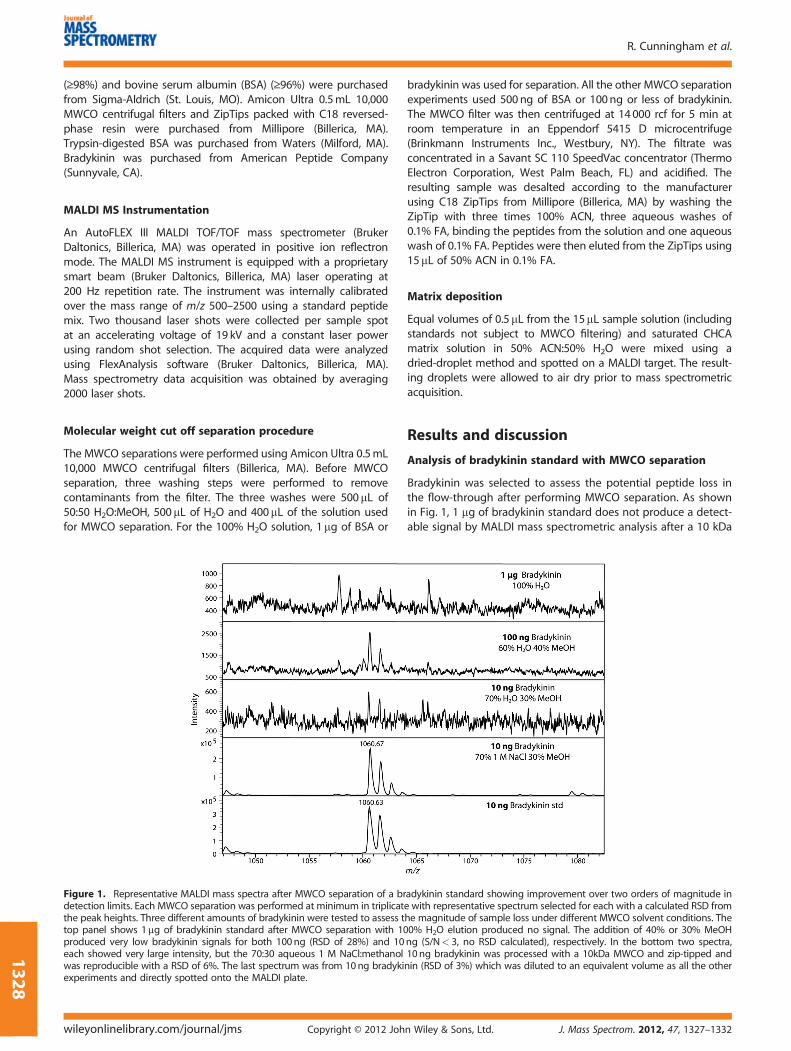
Figure 1. Representative MALDI mass spectra after MWCO separation of a brdetection limits. Each MWCO separation was performed at minimum in triplicatthe peak heights. Three different amounts of bradykinin were tested to assess ttop panel shows 1mg of bradykinin standard after MWCO separation with 1produced very low bradykinin signals for both 100ng (RSD of 28%) and 10each showed very large intensity, but the 70:30 aqueous 1 M NaCl:methanolwas reproducible with a RSD of 6%. The last spectrum was from 10ng bradykiexperiments and directly spotted onto the MALDI plate.
wileyonlinelibrary.com/journal/jms Copyright © 2012 Joh
bradykinin was used for separation. All the other MWCO separationexperiments used 500ng of BSA or 100ng or less of bradykinin.The MWCO filter was then centrifuged at 14000 rcf for 5 min atroom temperature in an Eppendorf 5415 D microcentrifuge(Brinkmann Instruments Inc., Westbury, NY). The filtrate wasconcentrated in a Savant SC 110 SpeedVac concentrator (ThermoElectron Corporation, West Palm Beach, FL) and acidified. Theresulting sample was desalted according to the manufacturerusing C18 ZipTips from Millipore (Billerica, MA) by washing theZipTip with three times 100% ACN, three aqueous washes of0.1% FA, binding the peptides from the solution and one aqueouswash of 0.1% FA. Peptides were then eluted from the ZipTips using15mL of 50% ACN in 0.1% FA.
Matrix deposition
Equal volumes of 0.5mL from the 15mL sample solution (includingstandards not subject to MWCO filtering) and saturated CHCAmatrix solution in 50% ACN:50% H2O were mixed using adried-droplet method and spotted on a MALDI target. The result-ing droplets were allowed to air dry prior to mass spectrometricacquisition.
Results and discussion
Analysis of bradykinin standard with MWCO separation
Bradykinin was selected to assess the potential peptide loss inthe flow-through after performing MWCO separation. As shownin Fig. 1, 1 mg of bradykinin standard does not produce a detect-able signal by MALDI mass spectrometric analysis after a 10 kDa
adykinin standard showing improvement over two orders of magnitude ine with representative spectrum selected for each with a calculated RSD fromhe magnitude of sample loss under different MWCO solvent conditions. The00% H2O elution produced no signal. The addition of 40% or 30% MeOHng (S/N< 3, no RSD calculated), respectively. In the bottom two spectra,10ng bradykinin was processed with a 10kDa MWCO and zip-tipped andnin (RSD of 3%) which was diluted to an equivalent volume as all the other
n Wiley & Sons, Ltd. J. Mass Spectrom. 2012, 47, 1327–1332
Reduction of peptide loss using MWCO
MWCO separation in water (performed in triplicate). Forcomparison, 1 ng of bradykinin standard diluted to 15 mLproduced an intense signal on the MALDI mass spectrometer,suggesting significant sample loss occurs when the targetanalyte is low in quantity (data not shown, performed intriplicate). Figure 1 shows that the addition of a salt, in this caseNaCl, improves the limits of detection and decreases sample losswhen 70:30 water:methanol was compared to 70:30 aqueous 1 MNaCl:methanol. The reproducible results gave a relative standarddeviation (RSD) of 6% for peak intensity. Figure 1 shows that evenwhen starting with 1 mg of bradykinin, too much sample is lost
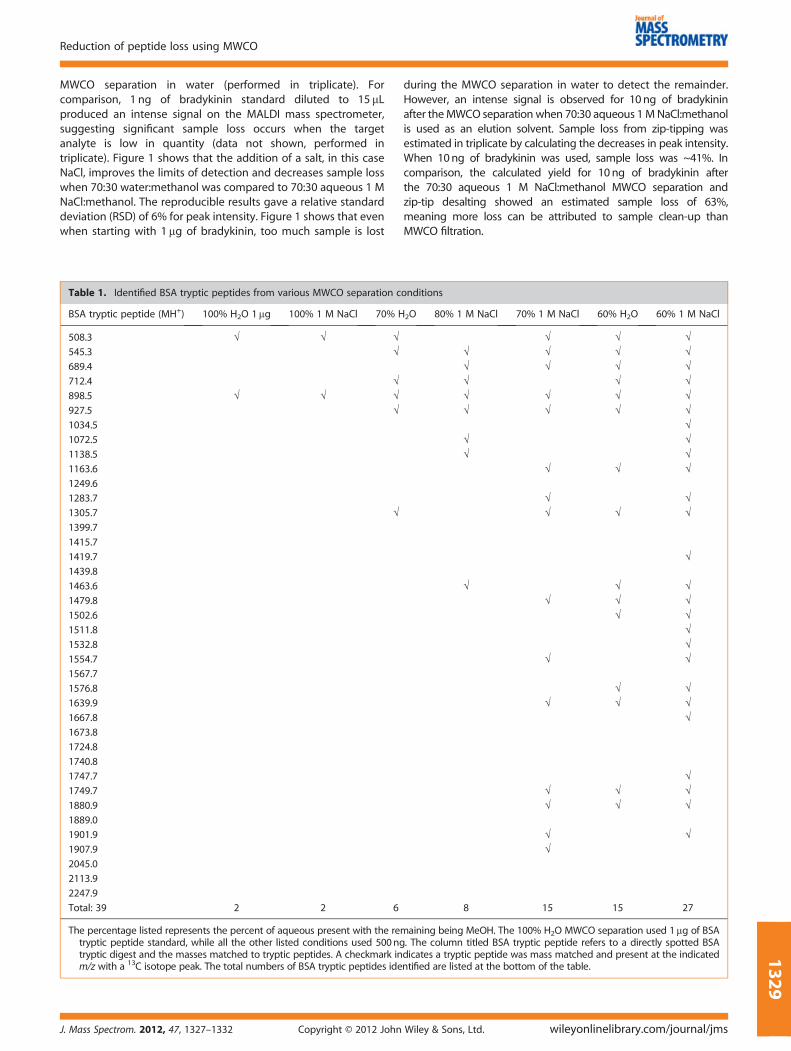
Table 1. Identified BSA tryptic peptides from various MWCO separation c
BSA tryptic peptide (MH+) 100% H2O 1mg 100% 1 M NaCl 70% H
508.3 √ √ √545.3 √689.4
712.4 √898.5 √ √ √927.5 √1034.5
1072.5
1138.5
1163.6
1249.6
1283.7
1305.7 √1399.7
1415.7
1419.7
1439.8
1463.6
1479.8
1502.6
1511.8
1532.8
1554.7
1567.7
1576.8
1639.9
1667.8
1673.8
1724.8
1740.8
1747.7
1749.7
1880.9
1889.0
1901.9
1907.9
2045.0
2113.9
2247.9
Total: 39 2 2 6
The percentage listed represents the percent of aqueous present with the remtryptic peptide standard, while all the other listed conditions used 500ngtryptic digest and the masses matched to tryptic peptides. A checkmark inm/z with a 13C isotope peak. The total numbers of BSA tryptic peptides ide
J. Mass Spectrom. 2012, 47, 1327–1332 Copyright © 2012 John
during the MWCO separation in water to detect the remainder.However, an intense signal is observed for 10ng of bradykininafter theMWCO separation when 70:30 aqueous 1MNaCl:methanolis used as an elution solvent. Sample loss from zip-tipping wasestimated in triplicate by calculating the decreases in peak intensity.When 10ng of bradykinin was used, sample loss was ~41%. Incomparison, the calculated yield for 10ng of bradykinin afterthe 70:30 aqueous 1 M NaCl:methanol MWCO separation andzip-tip desalting showed an estimated sample loss of 63%,meaning more loss can be attributed to sample clean-up thanMWCO filtration.
onditions
2O 80% 1 M NaCl 70% 1 M NaCl 60% H2O 60% 1 M NaCl
√ √ √√ √ √ √√ √ √ √√ √ √√ √ √ √√ √ √ √
√√ √√ √
√ √ √
√ √√ √ √
√
√ √ √√ √ √
√ √√√
√ √
√ √√ √ √
√
√√ √ √√ √ √
√ √√
8 15 15 27
aining being MeOH. The 100% H2O MWCO separation used 1mg of BSA. The column titled BSA tryptic peptide refers to a directly spotted BSAdicates a tryptic peptide was mass matched and present at the indicatedntified are listed at the bottom of the table.
Wiley & Sons, Ltd. wileyonlinelibrary.com/journal/jms
1329
R. Cunningham et al.
1330
A series of experiments were performed to determine if70:30 aqueous 1 M NaCl:methanol is an optimal solution torecover peptides during a MWCO separation (data not shown). A50:50 aqueous 1 M NaCl:methanol and a 50:50 water:methanolelution were performed in duplicate, but signal intensity of theresulting bradykinin was poor and numerous polymer peaks
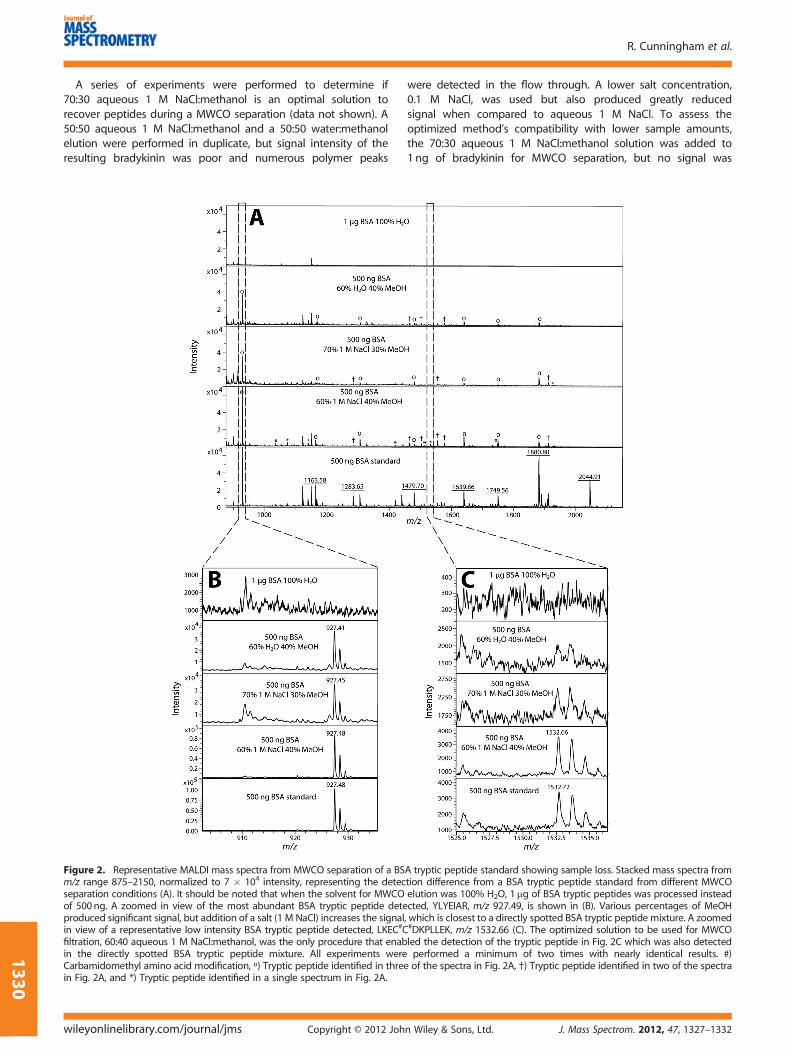
Figure 2. Representative MALDI mass spectra from MWCO separation of a BSm/z range 875–2150, normalized to 7 � 104 intensity, representing the detecseparation conditions (A). It should be noted that when the solvent for MWCOof 500ng. A zoomed in view of the most abundant BSA tryptic peptide deteproduced significant signal, but addition of a salt (1 M NaCl) increases the signalin view of a representative low intensity BSA tryptic peptide detected, LKEC#Cfiltration, 60:40 aqueous 1 M NaCl:methanol, was the only procedure that enabin the directly spotted BSA tryptic peptide mixture. All experiments wereCarbamidomethyl amino acid modification, º) Tryptic peptide identified in threin Fig. 2A, and *) Tryptic peptide identified in a single spectrum in Fig. 2A.
wileyonlinelibrary.com/journal/jms Copyright © 2012 Joh
were detected in the flow through. A lower salt concentration,0.1 M NaCl, was used but also produced greatly reducedsignal when compared to aqueous 1 M NaCl. To assess theoptimized method’s compatibility with lower sample amounts,the 70:30 aqueous 1 M NaCl:methanol solution was added to1 ng of bradykinin for MWCO separation, but no signal was
A tryptic peptide standard showing sample loss. Stacked mass spectra fromtion difference from a BSA tryptic peptide standard from different MWCOelution was 100% H2O, 1mg of BSA tryptic peptides was processed insteadcted, YLYEIAR, m/z 927.49, is shown in (B). Various percentages of MeOH, which is closest to a directly spotted BSA tryptic peptide mixture. A zoomed#DKPLLEK, m/z 1532.66 (C). The optimized solution to be used for MWCOled the detection of the tryptic peptide in Fig. 2C which was also detectedperformed a minimum of two times with nearly identical results. #)
e of the spectra in Fig. 2A, †) Tryptic peptide identified in two of the spectra
n Wiley & Sons, Ltd. J. Mass Spectrom. 2012, 47, 1327–1332

Reduction of peptide loss using MWCO
obtained (data not shown). Using a neuropeptide standard, the ad-dition of methanol and NaCl salt significantly improved the samplerecovery in sub-mg amounts.
BSA tryptic peptide mixture analysis
After demonstrating the importance of using an optimized solutionfor MWCO separations with an individual peptide, the newmethodwas applied to 500ng of BSA tryptic digest to investigate its utilitywith more complex peptide mixtures. Table 1 lists the BSA trypticpeptides identified in theMALDI MS analysis fromdifferent solutionconditions processed by MWCO separation. As shown in Table 1, adirectly spotted BSA tryptic digest peptide mixture in the absenceof any MWCO filtration enabled identification of 39 tryptic peptidesby accurate peptide mass measurements. Once again, when using100%H2O forMWCO separations, the starting amountwas doubledto 1mg (also done with 500ng, data not shown). However, manytryptic peptides were not detected due to low signal intensitiesand non-optimal elution conditions. Instead of H2O, a 1 M NaCl so-lution was used for the MWCO elution, but only two tryptic pep-tides were identified (Table 1). The addition of 30% methanol intothe sample before MWCO filtration produced the first increase inidentified BSA tryptic peptides. The remaining data from Table 1shows improved BSA tryptic peptide identifications as the sample(elution) conditions were further optimized. Figure 2 shows the ac-tual mass spectra associated with the three most promising elutionsolutions along with 100% H2O.
Figure 3. Representative MALDI mass spectra after MWCO separation of a bradtions minimized sample losses. Each experiment was performed in duplicate. Twsample loss caused by the presence of a protein. The top panel shows 10mg of Bonly 10ng of bradykininwas added. Detectable sample loss was observedwhen thwas 1� 104 greater (equivalent to 160-foldmolar excess) than bradykinin. The last3 and panel 4 using 10ng bradykinin which was diluted to an equivalent volume
J. Mass Spectrom. 2012, 47, 1327–1332 Copyright © 2012 John
The BSA tryptic peptide intensities are shown in Fig. 2A, andthe most intense tryptic peptide, YLYEIAR, m/z 927.49 wasobserved in the four different solutions shown in Fig. 2B butnot in the 100% H2O or 100% 1 M NaCl solutions (data notshown). In Fig. 2A, all mass spectra are normalized to an intensityof 7 � 104 to illustrate two points. First, the MWCO filtering stepstill produced sample loss regardless of the solvent conditionschosen. Second, there is a noticeable increase in peptide peakintensity using the optimized solvent, 60:40 aqueous 1 M NaCl:methanol (Fig. 2A). Figure 2C displays a zoomed-in view ofa BSA tryptic peptide signal, LKEC#C#DKPLLEK, m/z 1532.66(#: carbamidomethyl) observed only in the optimized solvent.The detection of the m/z 1532.66 peptide in Fig. 2C highlightsthe potential gain in sample and detectable peptides by usingan optimized salt/MeOH combination. A non-optimized salt/MeOH combination will still reduce sample loss, but furtherminimizing sample loss during sample preparation will alwaysbe desirable in any analytical protocol.
MWCO composition
The purpose of this application note is to provide evidence ofsub-mg sample loss during MWCO separations of peptide samplesand a solution to overcome this limitation. The explanation of whyadding MeOH and NaCl to the sample solution provides asignificant reduction in sample loss is beyond the scope of thisapplication note. Regardless, Supplemental Table S1 is an
ykinin standard with a BSA protein present showing optimized solvent condi-o different amounts of BSA protein were tested to assess the magnitude ofSA protein, and the second panel shows 100mg of BSA protein added whilee BSAproteinwas added, but panel two shows that the amount of BSA proteintwo spectra were controls using aMWCOwith the optimized solution in panelas all the other experiments and directly spotted onto the MALDI plate.
Wiley & Sons, Ltd. wileyonlinelibrary.com/journal/jms
1331
R. Cunningham et al.
1332
expanded version of Table 1, showing the amino acid sequence,hydrophobicity calculated using GRAVY scores, and pI of theidentified peptides in this study. No discernible trend was obtainedfrom the data. The membrane of commonly used MWCO inpeptidomics and for this study is comprised of chemically treated(regenerated) cellulose, which is a polysaccharide containingb (1! 4) linked D-glucose. Glucose has numerous free hydroxylgroups which could non-specifically adsorb peptides flowingthrough the MWCO. The addition of MeOH has the most signifi-cant effect on signal, which could be due to disrupting theinteraction between peptides and hydroxyl groups from glucose.NaCl has a less significant effect on sample recovery comparedto MeOH, but a detectable reduction in sample loss is noted. Thisimprovement in sample recovery could be analogous to the useof NaCl in immunodepletion protocols to reduce non-specificbinding, which is accomplished by adding 150mM NaCl.[17]
Analysis of bradykinin in the presence of undigested BSA
When using MWCO for peptide isolation, proteins are typicallypresent in the samples, usually in larger amounts. Figure 3 showsthe effect that adding BSA protein to a 10ng bradykinin solutionbefore MWCO fractionation has on the resulting recovery ofbradykinin. Adding 10mg of BSA to the optimized 70:30 aqueous1 M NaCl:methanol solution slightly decreased bradykinin’s signalwith a RSD of 10%. More severe signal reduction occurred afteradding 100mg BSA with a RSD of 2% (N=2). It is not unexpectedthat more signal reduction due to sample loss would occur,especially in the 100mg BSA sample because the BSA protein hasa molar ratio of 160 BSA protein molecules to one bradykininpeptide. Figure 3 shows the usefulness of the MWCO method withsamples containing large amounts of proteins.
Recommendation/conclusion
The present work provides solutions to reduce sample lossfrom the use of MWCO for sub-mg peptide isolation with or withoutnon-digested proteins in the sample. Despite its widespreadutility, significant sample loss often occurs during the MWCOfractionation step, which is particularly problematic when analyzinglow-abundance peptides from limited starting material. This applica-tion note aims to reduce sample loss during MWCO separations,specifically for sub-mg peptide isolation. If complex samples areprocessed with MWCO separation, the authors recommend elutingthe sample with 60:40 aqueous 1 M NaCl:methanol solution as astarting point tominimize sample loss. This application note providesa viable alternative for sub-mg peptideMWCO separation, circumvent-ing the need to increase the starting material by minimizing sampleloss from using a MWCO membrane-based centrifugal filter device.
Acknowledgements
The authors wish to thank Tyler Greer in the Li Laboratory for criticalreading of the manuscript and providing helpful comments. Thiswork was supported in part by the National Science Foundationgrant (CHE-0967784), University of Wisconsin Graduate Schooland Wisconsin Alzheimer’s Disease Research Center Pilot Grant. L.L. acknowledges an H. I. Romnes Faculty Fellowship.
wileyonlinelibrary.com/journal/jms Copyright © 2012 Joh
Supporting information
Supporting information may be found in the online version ofthis article.
References[1] H. M. Georgiou, G. E. Rice, M. S. Baker. Proteomic analysis of human
plasma: failure of centrifugal ultrafiltration to remove albumin andother high molecular weight proteins. Proteomics 2001, 1, 1503.
[2] D. W. Greening, R. J. Simpson. Low-molecular weight plasmaproteome analysis using centrifugal ultrafiltration. Methods Mol. Biol.2011, 278, 109.
[3] D. W. Greening, R. J. Simpson. A centrifugal ultrafiltration strategy forisolating the low-molecular weight (<or = 25K) component ofhuman plasma proteome. J. Proteomics 2010, 73, 637.
[4] L. L. Manza, S. L. Stamer, A. J. Ham, S. G. Codreanu, D. C. Liebler.Sample preparation and digestion for proteomic analyses using spinfilters. Proteomics 2005, 5, 1742.
[5] D. Theodorescu, D. Fliser, S. Wittke, H. Mischak, R. Krebs, M. Walden,M. Ross, E. Eltze, O. Bettendorf, C. Wulfing, A. Semjonow. Pilot studyof capillary electrophoresis coupled to mass spectrometry as a toolto define potential prostate cancer biomarkers in urine. Electrophoresis2005, 26, 2797.
[6] K. Antwi, G. Hostetter, M. J. Demeure, B. A. Katchman, G. A. Decker,Y. Ruiz, T. D. Sielaff, L. J. Koep, D. F. Lake. Analysis of the plasmapeptidome from pancreas cancer patients connects a peptidein plasma to overexpression of the parent protein in tumors.J. Proteome Res. 2009, 8, 4722.
[7] L. P. Aristoteli, M. P. Molloy, M. S. Baker. Evaluation of endogenousplasma peptide extraction methods for mass spectrometricbiomarker discovery. J. Proteome Res. 2007, 6, 571.
[8] A. Zougman, B. Pilch, A. Podtelejnikov, M. Kiehntopf, C. Schnabel,C. Kumar, M. Mann. Integrated analysis of the cerebrospinal fluidpeptidome and proteome. J. Proteome Res. 2008, 7, 386.
[9] X. Yuan, D. M. Desiderio. Human cerebrospinal fluid peptidomics.J. Mass Spectrom. 2005, 40, 176.
[10] X. Zheng, H. Baker, W. S. Hancock. Analysis of the low molecularweight serum peptidome using ultrafiltration and a hybrid iontrap-Fourier transform mass spectrometer. J. Chromatogr. A 2006,1120, 173.
[11] L. Li, J. V. Sweedler. Peptides in the brain: mass spectrometry-basedmeasurement approaches and challenges. Annu. Rev. Anal. Chem.2008, 1, 451.
[12] G. B. Stefano, G. Fricchione, Y. Goumon, T. Esch. Pain, immunity,opiate and opioid compounds and health. Med. Sci. Monit. 2005,11, MS47.
[13] J. Jensen. Regulatory peptides and control of food intake innon-mammalian vertebrates. Comp. Biochem. Physiol. A Mol. Integr.Physiol. 2001, 128, 471.
[14] A. Kuoppala, K. A. Lindstedt, J. Saarinen, P. T. Kovanen, J. O. Kokkonen.Inactivation of bradykinin by angiotensin-converting enzyme and bycarboxypeptidase N in human plasma. Am. J. Physiol. Heart Circ.Physiol. 2000, 278, H1069.
[15] R. Chen, M. Ma, L. Hui, J. Zhang, L. Li. Measurement of neuropeptidesin crustacean hemolymph via MALDI mass spectrometry. J. Am. Soc.Mass Spectrom. 2009, 20, 708.
[16] H. Jahn, S. Wittke, P. Zurbig, T. J. Raedler, S. Arlt, M. Kellmann,W. Mullen, M. Eichenlaub, H. Mischak, K. Wiedemann. Peptide finger-printing of Alzheimer’s disease in cerebrospinal fluid: identificationand prospective evaluation of new synaptic biomarkers. PLoS One2011, 6, e26540.
[17] N. A. Cellar, A. S. Karnoup, D. R. Albers, M. L. Langhorst, S. A.Young. Immunodepletion of high abundance proteins coupledon-line with reversed-phase liquid chromatography: a two-dimensional LC sample enrichment and fractionation techniquefor mammalian proteomics. J. Chromatogr. B Analyt. Technol.Biomed. Life Sci. 2009, 877, 79.
n Wiley & Sons, Ltd. J. Mass Spectrom. 2012, 47, 1327–1332