Embed Size (px)
Citation preview
1
Investigating perceptual biases, data reliability, and data discovery in a methodology for collecting speech errors from audio recordings John Alderete, Monica Davies Simon Fraser University
Abstract. This work describes a methodology of collecting speech errors from audio recordings and investigates how some of its assumptions affect data quality and composition. Speech errors of all types (sound, lexical, syntactic, etc.) were collected by eight data collectors from audio recordings of unscripted English speech. Analysis of these errors showed that (i) different listeners find different errors in the same audio recordings, but (ii) the frequencies of error patterns are similar across listeners; (iii) errors collected “online” using on the spot observational techniques are more likely to be affected by perceptual biases than “offline” errors collected from audio recordings, and (iv) datasets built from audio recordings can be explored and extended in a number of ways that traditional corpus studies cannot be. Keywords: speech errors, methodology, perceptual bias, data reliability, capture-recapture, phonetics of speech errors
1. Introduction Speech errors have been tremendously important to the study of language production, but the
techniques used to collect and analyze them in spontaneous speech have a number of problems.
First, data collection and classification can be rather labour-intensive. Speech errors are
relatively rare events (but see section 6.1 below for a revised frequency estimate), and they are
difficult to spot in naturalistic speech. Even the best listeners can only detect about one out of
three errors in running speech (Ferber, 1991). As a result, large collections like the Stemberger
corpus (Stemberger, 1982/1985) or the MIT-Arizona corpus (Garrett, 1975; Shattuck-Hufnagel,
1979) tend to be multi-year projects that can be hard to justify. The process of collecting speech
errors is also notoriously error-prone, with opportunities for mistakes at all stages of collection
and analysis. Errors are often missed or misheard, and approximately a quarter of errors collected

2
by trained experts are excluded in later analysis because they are not true errors (Cutler, 1982;
Ferber, 1991, 1995). Once collected, errors can be also misclassified and exhibit several types of
ambiguity, resulting in further data loss in an already time-consuming procedure (Cutler, 1988).
Beyond these issues of feasibility and data reliability, there is a significant literature
documenting perceptual biases in speech error collection that may skew distributions in large
datasets (see Bock (1996) and Pérez, Santiago, Palma, and O’Seaghdha (2007)) . Errors are
collected by human listeners, and so they are subject to constraints on human perception. These
constraints tend to favor discrete categories as opposed to more fine-grained structure, more
salient errors like sound exchanges over less salient ones, and language patterns that listeners are
more familiar with. These effects reduce the counts of errors that are difficult to detect and can
even categorically exclude certain classes, like phonetic errors.
These problems have been addressed in a variety of ways, often making sacrifices in one
domain to make improvements in another. For example, to improve data quality, some
researchers have started to collect errors exclusively from audio recordings (Chen, 1999, 2000;
Marin & Pouplier, 2016), sacrificing some of the environmental information for a reliable record
of speech. To accelerate data collection, some researchers have recruited large numbers of non-
experts to collect speech errors (Dell & Reich, 1981; Pérez et al., 2007), in this case, sacrificing
data quality for project feasibility. Another important trend is to collect speech errors from
experiments, reducing the ecological validity of the errors in order to gain greater experimental
control (see Stemberger (1992) and Wilshire (1999) for review). Below we review a
comprehensive set of methodological approaches and examine how they address common
problems confronted in speech error research.
This diversity of methods calls for investigation of the consequences of specific
methodological decisions, but it is rarely the case that these decisions are investigated in any
detail. While general data quality has been investigated on a small scale (Ferber, 1991), and
patterns of naturalistic and experimentally induced errors have been compared across studies
(Stemberger, 1992), a host of questions remain concerning data quality and reliability. For
3
example, how does recruiting a large number of non-experts affect data quality, and are speech
errors collected online different than those collected offline from audio recordings? How do
known perceptual bias affect specific speech error patterns? Are some patterns not suitable for
certain collection methods?
The goal of this article is to address these issues by describing a methodology for
collecting speech errors and investigate the consequences of its assumptions. This methodology
is a variant of Chen’s (1999, 2000) approach to collecting speech errors from audio recordings
with multiple data collectors. By investigating this methodology in detail we hope to show four
things. First, that a methodology that uses multiple expert data collectors is viable, provided the
collectors have sufficient training and experience. Second, collecting speech errors “offline”
from audio recordings has a number of benefits in data quality and feasibility that favor it over
the more common “online” studies. Third, a methodology using multiple expert collectors and
audio recordings can be explored and extended in several ways that recommend it for many
types of research. Lastly, we hope that an investigation of our methodological assumptions will
help other researchers in the field compare results from different studies, effectively allowing
them to “connect the dots” with explicit measures and patterns.
2. Background The goal of most methodologies for collecting speech errors is to produce a sample of speech
errors that is representative of how they occur in natural speech. Below we summarize some of
the known problems in achieving a representative sample and the best practices used to reduce
the impact of these problems.
2.1 Data reliability
Once alerted to the existence of speech errors, a researcher can usually spot speech errors
in everyday speech with relative ease. However, the practice of collecting speech errors
systematically, and in large quantities, is a rather complex rational process that requires much
more care. This complexity stems from the standard characterization of a speech error as “an

4
unintended, nonhabitual deviation from a speech plan” (Dell, 1986: 284). Speech errors are
unintended slips of tongue, and not dialectal or idiolectal variants, which are habitual behaviors.
Marginally grammatical forms and errors of ignorance are also arguably habitual, and so they too
are excluded (Stemberger, 1982/85). A problem posed by this definition, which is widely used in
the literature, is that it does not provide clear positive criteria for identifying errors (Ferber,
1995). In practice, however, data collection can be guided by templates of commonly occurring
errors, like the inventory of 11 error types given in Bock (2011), or the taxonomies proposed in
Dell (1986) and Stemberger (1993).
These templates are tremendously helpful, but as anyone who has engaged in significant
error collection will attest, the types of errors included in the templates are rather heterogeneous.
Data collectors must listen to words at the sound level, attempting to spot various slips of tongue
(anticipations, perseverations, exchanges, shifts), and, at the same time, attend to the phonetic
details of the slipped sounds to see if they are accommodated phonetically to their new
environment. Data collectors must also pay attention to the message communicated, to confirm
that the intended words are used, and that word errors of various kinds do not occur (word
substitutions, exchanges, blends, etc.). Adding to this list, they are also listening for word-
internal errors, like affix stranding and morpheme additions and deletions, as well as syntactic
anomalies like word shifts, phrasal blends, and morpho-syntactic errors such as agreement
attraction. One collection methodology addresses this “many error types” problem by requiring
that data collectors only collect a specific type of speech error (Dell & Reich, 1981). However,
many collection methodologies do not restrict data collection in this way and include all of these
error types in their search criteria.
This already difficult task is made considerably more complex by the need to exclude
intended and habitual behavior. Habitual behaviors include a variety of phonetic and
phonological processes that typify casual speech. For example, [gʊn nuz] good news does not
involve a substitution error, swapping [n] for [d] in good, because this kind of phonetic
assimilation is routinely encountered in causal speech (Cruttenden, 2014; Shockey, 2003). In
5
addition, data collectors must also have an understanding of dialectal variants and the linguistic
background of the speakers they are listening to. A third layer of filtering involves attending to
individual level variation, or the idiolectal patterns found in all speakers involving every type of
linguistic structure (sound patterns, lexical variation, sentence structure, etc.). Data collectors
must also exclude changes of the speech plan, a common kind of false positive in which the
speaker begins an utterance with a particular message, and then switches to another message
mid-phrase. For example, I was, we were going to invite Mary, is not a pronoun substitution error
because the speech plan is accurately communicated in both attempts of the evolving message.
What makes data collection mentally taxing, therefore, is listeners have a wide range of error
types they are listening for, and while casting this wide net, they must exclude potential errors by
invoking several kinds of filters.
It is not a surprise, therefore, that mistakes can happen at all stages of data collection.
Given the characterization of speech errors above, many errors are missed by data collectors
because the collection process is simply too mentally taxing (see estimates below). The speech
signal can also be misheard by the data collector in a “slip of the ear” (Bond, 1999; Vitevitch,
2002), as in spoken: Because they can answer inferential questions …, for heard: Because they
can answer in French … (Cutler, 1982). Furthermore, sound errors can be incorrectly
transcribed, which again can lead to false positives or an inaccurate record of the speech event.
These empirical issues have been documented experimentally on a small scale in Ferber
(1991). In Ferber’s study, four data collectors listened to a 45 minute recording of spliced
samples from German radio talk shows and recorded all the errors that they heard. The recording
was played without stopping, so the experiment is comparable to online data collection. The
author then listened again to the same recording offline, stopping and rewinding when necessary.
A total of 51 speech errors were detected using both online and offline methods, or an error
about every 53 seconds. On average, two thirds of the 51 errors were missed by each listener, but
there was considerable variation, ranging between missing 51% and 86% of the 51 errors. More
troubling is the fact that approximately 50% of the errors submitted were recorded incorrectly,

6
involving transcription errors of the actual sounds and words in the errors. In addition, one
listener found no sound errors, and two listeners found no lexical (i.e., word) errors. These
individual differences raise serious questions about the reliability of using observational
techniques to collect speech errors. It also poses a problem for the use of multiple data collectors,
since different collectors seem to be hearing different kinds of errors. For this reason, we expand
on Ferber’s experiment to investigate if this is an empirical issue with offline data collection.
2.2 Perceptual biases and other problems with observational techniques
We have seen some of the ways in which human listeners can make mistakes in speech
error collection, given the complexity of the task. A separate line of inquiry examines how
constraints on the perceptual systems of human collectors lead to problems in data composition.
An important thread in this research concerns the salience of speech errors, arguing that speech
errors that involve more salient linguistic structure tend to be over-represented. Thus, errors
involving a single sound are harder to hear than those involving larger units, such as a whole
word, multiple sounds, or exchanges of two sounds (Cutler, 1982; Dell & Reich, 1981; Tent &
Clark, 1980). It also seems to be the case that sound errors are easier to detect word-initially
(Cole, 1973), and that errors in general are easier to detect in highly predictable environments,
like … smoke a cikarette (cigarette) (Cole, Jakimik, & Cooper, 1978), or when they affect the
meaning of the larger utterance. Finally, sound errors involving a change of more than one
phonological feature are easier to hear than substitutions involving just one feature (Cole, 1973;
Marslen-Wilson & Welsh, 1978).
In sound errors, the detection of sound substitutions also seems governed by overall
salience of the features that are changed in the substitution, but the salience of these features
depends on the listening conditions. In noise, for example, human listeners often misperceive
place of articulation, but voicing is far less subject to perceptual problems (Garnes & Bond,
1975; Miller & Nicely, 1955). However, Cole et al. (1978) found that human listeners detected
word-initial mispronunciations of place of articulation more frequently than mispronunciations

7
of voicing, and that consonant manner matters in voicing: mispronunciations of fricative voicing
were detected less frequently than stop voicing. These feature-level asymmetries, as well as the
general asymmetry towards salient errors, have the potential to skew the distribution of error
types and specific patterns within these types.
Another major problem concerns a bias in many speech error corpora towards discrete
sound structure. Though speech is continuous and presents many complex problems in terms of
how it is segmented into discrete units, when documenting sound errors, most major collections
transcribe speech errors using discrete orthographic or phonetic representations. Research on
categorical speech perception shows that human listeners have a natural tendency to perceive
continuous sound structure as discrete categories (see Fowler and Magnuson (2012) for review).
The combination of discrete transcription systems and the human propensity for categorical
speech perception severely curtails the capacity for describing fine-grained phonetic detail.
However, various articulatory studies have shown that gestures for multiple segments may be
produced simultaneously (Pouplier & Hardcastle, 2005), and that speech errors may result in
gestures that lie on a gradient between two different segments (Frisch, 2007; Stearns, 2006).
These errorful articulations may or may not result in audible changes to the acoustic signal,
making some of them nearly impossible to document using observational techniques.
Acoustic studies of sound errors have also documented perceptual asymmetries in the
detection of errors that can skew distributions (Frisch & Wright, 2002; Mann, 1980; Marin,
Pouplier, & Harrington, 2010). For example, using acoustic measures, Frisch and Wright (2002)
found a larger number of z → s substitutions than s → z in experimentally elicited speech errors,
which they attribute to an output bias for frequent segments (s has a higher frequency than z).
This asymmetric pattern is the opposite of that found in Stemberger (1991) using observational
techniques. Thus, different methods for detecting errors (e.g., acoustic vs. observational) may
lead to different results.
Finally, a host of sampling problems arise when collecting speech errors. Different data
collectors have different rates of collection and frequencies of types of errors they detect (Ferber,

8
1991). This collector bias can be related to the talker bias, or preference for talkers in the
collector’s environment that may exhibit different patterns (Dell & Reich, 1981; Pérez et al.,
2007). Finally, speech error collections are subject to distributional biases in that certain error
patterns may be more likely because of the opportunities for them in specific structures are
greater than other structures. For example, speech errors that result in lexical words are much
more likely to be found in monosyllabic words than polysyllabic words because of the richer
lexical neighborhoods of monosyllables (Dell & Reich, 1981). Therefore, speech error
collections must be assessed with these potential sampling biases in mind.
2.3 Review of methodological approaches
The issues discussed above have been addressed in a variety of different research
methodologies, summarized in Table 1. A key difference is in the decision to collect speech
errors from spontaneous speech or induce them using experimental techniques. Errors from
spontaneous speech can either be collected using direct observation (online), or they can be
collected offline from audio recordings of natural speech. There can also be a large range in the
experience level of the data collector.
Table 1. Methodological approaches.
a. Errors from spontaneous speech, 1-2 experts, online collection (e.g., Stemberger 1982/1985, Shattuck-Hufnagel 1979 et seq.)
b. Errors from spontaneous speech, 100+ non-experts, online collection (e.g., Dell & Reich 1981, Pérez et al. 2007)
c. Errors from spontaneous speech, multiple experts, offline collection with audio recording (e.g., Chen 1999, 2000, this study)
d. Errors induced in experiments, categorical variables, offline with audio backup (e.g., Dell 1986, Wilshire 1998)
e. Errors induced in experiments, measures for continuous variables, offline with audio backup (e.g., Goldstein et al 2007, Stearns 2006)
While we present an argument for offline data collection in section 7, it is important to
note studies using online data collection (Table 1a-b) are characterized by careful methods and
espouse a set of best practices that address general problems in data quality. Thus, these

9
practitioners emphasize only recording errors that the collector has a high degree of confidence
in, and recording the error within 30 seconds of the production of the error to avoid memory
lapse. Furthermore, as emphasized in Stemberger (1982/1985), data collectors must make a
conscious effort to collect errors and avoid multi-tasking during collection.
To address feasibility, many studies have recruited large numbers of non-experts (Table
1b). These studies address the collector bias, and therefore perceptual bias indirectly, by reducing
the impact from any given collector. In addition, talker biases are reduced as errors are collected
in a variety of different social circles, thereby reducing the impact of any one talker in the larger
dataset. A recent website (see Vitevitch et al. (2015)) demonstrates how speech error collection
of this kind can be accelerated through crowd-sourcing.
A different way to address feasibility and data quality is to collect data from audio
recordings (Table 1c). Chen (1999, 2000), for example, collected speech errors from audio
recordings of radio programs in Mandarin. The existence of audio recordings in this study both
supported careful examination of the underlying speech data, which clearly improves the ability
to document hard to hear errors. In addition, audio recordings make possible a verification stage
that removed large numbers of false positives, approximately 25% of the original submission.
Finally, working with audio recordings helps data collection advance with a predictable
timetable.
A variety of experimental techniques (Table 1d) have been developed to address
methodological problems. The two most common techniques are the SLIP technique (Baars,
Motley, & MacKay, 1975; Motley & Baars, 1975) and the tongue twister technique (Shattuck-
Hufnagel, 1992; Wilshire, 1999). Through priming and structuring stimuli with phonologically
similar sounds, these techniques mimic the conditions that produce speech errors in naturalistic
speech. As shown in Stemberger (1992), there is considerable overlap in the structure of natural
speech errors and those induced from experiments. Furthermore, careful experimental design can
ensure a sufficient amount of specific types of errors and error patterns, a common limitation of
uncontrolled naturalistic collections. Experimentally induced errors are also typically recorded,

10
so the speech can be verified and investigated again and again with replay, which has clear
benefits in data quality.
Many of these studies employ experimental methods to improve the feasibility and data
quality, and investigate the distribution of discrete categories like phonemes. However, some
experimental paradigms have used measures that allow investigation of continuous variables
(Table 1e). For example, Goldstein, Pouplier, Chena, Saltzman, and Byrd (2007) collect
kinematic data from the tongue and lips during a tongue twister experiment, allowing them to
study both the fine-grained articulatory structure of errors, as well as the dynamic properties of
the underlying articulations.
We evaluate these approaches in more detail in section 7, but our focus here is on
investigating a particular research methodology familiar to us and examining how its
assumptions affect data composition. In the rest of this article, we describe a methodology of
collecting English speech errors from audio recordings with multiple data collectors. Based on
the variation found in Ferber’s (1991) experiment, we ask in section 4 if data collectors detect
substantively different error types. We also examine if there are important effects of the online
versus offline distinction, and section 5 gives the first detailed examination of this factor in
speech error collection.
3. The Simon Fraser University Speech Error Database (SFUSED)
3.1 General methods
Our methodology is characterized by the following decisions and practices, which we elaborate
on below in detail.
• Multiple data collectors: to reduce the data collector and talker biases, and also increase productivity, eight data collectors were employed to collect a relatively large number of errors.
• Training: to increase data reliability, data collectors went through twenty five hours of training, including both linguistic training and feedback on error detection sessions.
• Offline data collection: also to increase data quality, errors were collected primarily from audio recordings.

11
• Allowance for gradient phonetic errors: data collectors used a transcription system that accounts for gradient phonetic patterns that go beyond normal allophonic patterns.
• Data collection separate from data classification: data collectors submitted speech errors via a template; analysts verified error submissions and assigned a set of field values that classified the error.
Our approach strikes a balance between employing one or two expert data collectors, as
in many of the classic studies discussed above, and a small army of relatively untrained data
collectors (Dell & Reich, 1981; Pérez et al., 2007). The multiple data collectors decision allows
us to study individual differences in error detection (since collector identity is part of each
record), and contextualize speech error patterns to adjust for any differences. Also, the
underlying assumption is that if there are data collector biases, their effect will be limited to the
specific individuals that exhibit it. We report in section 4 these data collector differences, which
appear to be quite small.
We have collected speech errors in two ways: (i) online as spectators of natural
conversations, and (ii) offline as listeners of podcast series available on the Internet. Six data
collectors collected 1,041 speech errors over the course of approximately seven months,
following the best practices for online collection discussed above. After finding a number of
problems with this approach, we turned to offline data collection. A different team of six
research assistants collected 7,500 errors over a period of approximately 11 months, which was
reduced by approximately 20% after removing false positives.
As for the selection of audio recordings, a variety of podcasts series available for free on
the Internet were reviewed and screened so that they met the following criteria. Podcasts were
chosen with conversations largely free of reading or set scripts. Any portions with a set script or
advertisement were ignored in collection and removed from our calculations of recording length.
We focused on podcasts with Standard American English used in the U.S. and Canada. That is,
most of our speakers were native speakers of some variety of the Midland American English
dialect, and all speakers with some other English dialect were carefully noted. Both dialect
information and idiolectal features of individual speakers were noted in each podcast recording,

12
and profiles summarizing the speakers’ features were created. The podcasts also differed in
genre, including entertainment podcasts like Go Bayside and Battleship Pretension, technology
and gaming podcasts like The Accidental Tech and Rooster Teeth, and science-based podcasts
like The Astronomy Cast. Speech errors were collected from an average of 50 hours of speech in
each podcast, typically resulting in about one thousand errors per podcast.
In terms of what data collectors are listening for, we follow the standard characterization
in the literature of a speech error given above, as an “unintended nonhabitual deviation from the
speech plan” (Dell, 1986: 284). As explained previously, this definition excludes words
exhibiting casual speech processes, false starts, changes in speech plan, and dialectal and
idiolectal features. We note that the offline collection method aids considerably in removing
false positives stemming from the mis-interpretation of idiolectal features because collectors
develop strong intuitions about typical speech patterns of individual talkers, and then factor out
these traits. For example, one talker was observed to have an intrusive velar before post-alveolars
in words like much [mʌktʃ]. The first few instances of this pattern were initially classified as a
speech error, but after additional instances were found, e.g., such and average, an idiolectal
pattern was established and noted in the profile of this talker. This note in turn entailed exclusion
of these patterns in all future and past submissions. Our experience is that such idiolectal features
are extremely common and so data collectors need to be trained to find and document them.
The focus of our collection is on speech errors from audio recordings. All podcasts are
MP3 files of high production quality. These files are opened in the speech analysis program
Audacity and the speech stream is viewed as an air pressure wave form. Data collectors are
instructed to attend to the main thread of the conversation, so that they follow the main topic and
the discourse participants involved. Data collectors can listen to any interval of speech as much
as deemed necessary, and they are also shown how to slow down the speech in Audacity in order
to pinpoint specific speech events in fast speech. When a speech error is observed, a number of
record field values are assigned (e.g., file name, time stamp, date of collection, identity of
collector and talker) together with the example itself, showing the position of the error and as

13
much of the speech necessary to give the linguistic context of the error. All examples are input
into a spreadsheet template and submitted to a data analyst for incorporation into the SFUSED
database.
3.2 Transcription practice and phonetic structure
Data collectors use a transcription system that accounts for both phonological and
phonetic errors. For many errors, orthographic representation of the error word in context is
sufficient to account for the error’s properties, and so data collectors are instructed to simply
write out error examples using standard spelling if the speech facts do not deviate from normal
pronunciation of these words. Many sound errors need to be transcribed in phonetic notation,
however, because it is more accurate and nonsense error words do not have standard spellings. In
this case, data collectors transcribe the relevant words in broad transcription, making sure that
the phonemes in their transcriptions obey standard rules of English allophones. When this is not
the case, or if a non-English sound is used, a more narrow transcription is employed that simply
documents all the relevant phonetic facts. Thus, IPA symbols for non-English sounds and
appropriate diacritics for illicit allophones are sometimes employed, but both of these patterns
are relatively rare.
It is sometimes the case that this system is not able to account for all of the phonetic
facts, either because there is a transition from one sound to another (other than the accepted
diphthongs and affricates of English), or because sounds are not good exemplars of a particular
phoneme. To capture these facts, we employ a set of tools commonly used in the transcription of
children’s speech (Stoel-Gammon, 2001). In particular, we recognize ambiguous sounds that lay
on a continuum between two poles, transitional sounds that go from one category to another
without a pause (confirmed impressionistically and acoustically), and intrusive sounds, which are
weak sounds short in duration that are clearly audible but do not have the same status as fully
articulated consonants or vowels. Table 2 illustrates these three distinct types and explains the
transcription conventions we employ (SFUSED record ID numbers are given here and

14
throughout). Phonetic errors can be perseveratory and/or anticipatory, depending on the
existence and location of source words, shown in the examples below with the “^” prefix.
Table 2. Gradient sound errors (/ = error word)
Ambiguous segments [X|Y]: segments that are neither [X] or [Y] but appear to lay on a continuum between these two poles, and in fact slightly closer to [X] than [Y].
Ex. sfusedE-21: … a whole lot of red photons and a ^few ^blue /ph[u|ʊtɑ]= photons and a ^few green photons and I translate that into a colour.
Transitional segments [X-Y]: segments that transition from [X] to [Y] without a pause
Ex. sfusedE-4056: ... ^maybe it was like ^grade two or ^grade /[θreɪ-i] and … (three) Intrusive segments [X]: weak segments that are clearly audible but do not have the status of a fully articulated consonant or vowel.
Ex. sfusedE-4742: I’m January ^/[eɪntinθ]teenth and it’s typically January nineteenth.
This transcription system supports exploration of fine-grained structure that has not traditionally
been explored in corpora of naturalistic errors. For example, studies of experimentally elicited
errors have documented speech errors containing sounds that lie between two phonological types
and blends of two discrete categories (Frisch, 2007; Frisch & Wright, 2002; Goldrick &
Blumstein, 2006; Pouplier & Goldstein, 2005; Stearns, 2006). This research generally assumes
that the cases in Table 2 are phonetic errors distinct from phonological errors. Phonological
errors are pre-articulatory and involve higher-level planning in which one phonological category
is mis-selected, resulting in a licit exemplar of an unintended category. Phonetic errors, on the
other hand, involve mis-selection of, or competition within, an articulatory plan, producing an
output sound that falls between two sound categories, or transitions from one to another. In our
transcription system, phonetic errors involve one of the three types listed in Table 2. Section 6.3
documents the existence of gradient phonetic errors for the first time in spontaneous speech and
summarizes our current understanding of this type of error.
How do we know phonetic errors are really errors and not lawful variants of sound
categories? The phonetic research summarized above defines phonetic errors as errors that are
outside the normal range (e.g., two standard deviations from a mean value) of the articulation of
a sound category, but not within the normal range of an unintended category (Frisch, 2007).

15
While we do not have articulatory data for the data collected offline, we assume that phonetic
errors are a valid type of speech error. Indeed, data collectors often feel compelled to document
sound errors at this level because the phonetic facts cannot be described with just discrete
phonological categories. Furthermore, we take measures in data collection to distinguish
phonetic errors from natural phonetic processes and casual speech phenomena. In particular, our
checking procedure involves examining detailed descriptions of 29 rules of casual speech based
on authoritative accounts of English (Cruttenden, 2014; Shockey, 2003). These are natural
phonetic processes like schwa absorption and reductions in unstressed positions, assimilatory
processes not typically included in English phonemic analysis, as well as a host of syllable
structure rules like /l/ vocalization and /t d/ drop. We also exclude extreme reductions (Ernestus
& Warner, 2011) and often find ourselves consulting reference material on variant realizations of
weak forms of common words. Phonetic errors are consistently checked against these materials
and excluded if they could be explained as a regular phonetic process. In general, we believe that
most psycholinguists would recognize these phonetic errors as errors, even though they are not
straightforward cases of mis-selections of a discrete sound category.
3.3 Training
The data collectors were recruited from the undergraduate program at Simon Fraser
University and worked as research assistants for at least one semester, though most worked for a
year or more. Two research assistants started out as data collectors and then scaffolded into
analyst positions, but the majority of the undergraduates worked exclusively as data collectors.
All students had taken an introductory course in linguistics and another introduction to phonetics
and phonology course, so they started with a good understanding of the sound structures of
English.
To brush up on English transcription, research assistants were required to read a standard
textbook introduction to phonetic transcription of English, i.e., chapter 2 of Ladefoged (2006) .
They were also assigned a set of drills to practice English transcription. These research assistants

16
were then given a seven-page document explaining the transcription conventions of the project,
which also illustrated the main dialect differences of the speakers they were likely to encounter
in the audio recordings, including information about the Northern Cities, Southern, and African
American English dialects. After this refresher, they were tested twice on two separate days on
their transcription of 20 English words in isolation, and students with 90% accuracy or better
were allowed to continue. Research assistants were also given an eight-page document
describing casual speech processes in English and given illustrations of all of the 29 patterns
described in that document.
The rest of the training involved a one-hour introduction to speech errors and feedback in
three listening tests given over several days. In particular, research assistants were given a five-
page document defining speech errors and illustrating them with multiple examples of all types.
After this introduction, the research assistants were asked to spend one hour outside the lab
collecting speech errors as a passive observer of spontaneous speech. The goal of this task is to
give the data collectors a concrete understanding of the concept of a speech error and its
occurrence in everyday speech.
After this introduction, research assistants were given listening tests in which they were
asked to identify the speech errors in three 30-40 minute podcasts that had been pre-screened for
speech errors. The research assistants were instructed in how to open a sound file in Audacity,
navigate the speech signal, and repeat and slow down stretches of speech. They submitted their
speech errors using a spreadsheet template, which were then checked by the first author. The
submitted errors were classified into three groups: false positives (i.e., do not meet the
definition), correct known errors, and new unknown errors. Also, the number of missed speech
errors was calculated (i.e., errors found in the pre-screening but not found by the trainee). From
this information, the percentage of missed errors, counts of false positives and new errors were
calculated and used to further train the data collector. In particular, the analyst and trainee met
and discussed missed errors and false positives in an effort to improve accuracy in future
collection. Also, average ‘minutes per error’ (MPE), i.e., the average number of minutes elapsed

17
per error collected, was assessed and used to train the listener. We do not have a set standard for
success for trainees to continue, because other mechanisms were used to remove false positives
and ensure data quality. However, the goal of the training is to achieve 75% accuracy (or less
than 25% false positives) and an MPE of 3 or lower, which was met in most cases.
3.4 Classification
As explained above, data collectors made speech error submissions in spreadsheets,
which were then batch imported into the SFUSED database. Speech errors are documented in the
database as a record in a speech error data table that contained 67 fields. These fields are
subdivided into six field types that focus on different aspects of the error. Example fields
document the actual speech error and encode other surface-apparent facts, for example if the
speech error was corrected and if a word was aborted mid-word. Record fields document facts
about the source of the record, like the researcher who collected the speech error, what podcast it
came from, and a time stamp, etc. The data provided by the data collectors are a subset of the
example and record fields. The rest of the fields from these field types, as well as a host of fields
that analyze the properties of the error, are to be filled in by analyst. This latter portion, which
constitutes the bulk of the classification duties, involves filling in major class fields, word fields,
sound fields, and special class fields that apply to only certain classes of errors.
As for the specific categories in these fields, we follow standard assumptions in the
literature in terms of how each error fits within a larger taxonomy (Dell, 1986; Shattuck-
Hufnagel, 1979; Stemberger, 1993). In particular, errors are described at the linguistic level
affected in the error, making distinctions among sound errors, morpheme errors, word errors, and
errors involving larger phrases. As explained in section 3.2, sound errors are further subdivided
into phonological errors (mis-selection of a phoneme) and phonetic errors (mis-articulation of a
correctly selected phoneme). Errors are further cross-classified by the type of error (i.e.,
substitutions, additions, deletions, and shifts) and direction (perseveration, anticipation,
exchanges, combinations of both perseveration and anticipation, and incomplete anticipation).

18
More specific error patterns, including the effects of certain psycholinguistic biases like the
lexical bias, are explained in relation to specific datasets below.
Finally, an important aspect of classification is how it is organized in our larger work-
flow. Speech error documentation involves two parts: initial detection by the data collector,
followed by data verification and classification by a data analyst. We believe that this separation
of work, also assumed in Chen (1999), leads to higher data quality because there is a verification
stage. We also believe that it leads to greater internal consistency because classification involves
a large number of analytical decisions that are best handled by a small number of individuals
focused on just this task.
4. Experiment 1: same recording, many collectors The multiple collectors assumption in our methodology is a good one in principle, but it
introduces the potential for individual differences in data collection. In experiment 1, we
investigate these individual differences to determine the extent of collector variation.
4.1 Methods
In this experiment, nine podcasts of approximately 40 minutes in length were examined
by three data collectors. Two data collectors listened to all nine podcasts, and a pair of data
collectors split the same nine recordings because of time constraints. All of the listeners were
experienced data collectors, and had at that point collected over 200 speech errors using a
combination of online and offline collection methods. The data collectors were instructed to
collect errors of all types outlined above. They were also allowed to listen to the recordings as
many times as they wished, and could slow the recording to listen for fine-grained phonetic
detail. After submitting the errors individually, the speech errors were combined for each
recording, and all three data collectors re-listened to all of the errors as a group to confirm that
they met the definition of a speech error. False positives were then excluded by majority
decision, though the three listeners found consensus on the inclusion or exclusion of an error in
almost every case.

19
The nine recordings came from three podcast series: three recordings from an
entertainment podcast series, three from a technology and entertainment podcast series, and three
from a science podcast series. Each podcast episode was centered on a set of themes and the
talkers generally spoke freely on these themes and issues raised from them. There was a balance
of male and female talkers. Removing scripted material, the total length of the nine podcasts
came to approximately 370 minutes.
The data in both experiments were analyzed using statistical tests on frequencies of
specific error patterns. We are generally interested in determining if the characterization of
speech error patterns is associated with particular listeners (experiment 1) and collection methods
(experiment 2). Thus, by aggregating the observations by listeners and collection methods, we
can look for an association between these factors and the frequency of specific patterns.
Following standard practice in speech error research, we test for such associations using chi-
square tests (see e.g., Shattuck-Hufnagel and Klatt (1979) and Stemberger (1989) for illustrations
and justification).
4.2 Results and discussion
The data collectors found 380 speech errors in all nine podcasts, or an error about every
58 seconds. However, 94 speech errors (24.74%) were excluded because, upon re-listening, the
group decided that they were not speech errors. Thus, after exclusions, 286 valid errors were
found by all listeners in all podcasts, which amounted to an error heard every minute and 17
seconds, or an MPE of 1.29. Table 3 breaks down accuracy and MPE by listener (note that
listeners 1 and 2 split the nine podcasts, as explained above). For example, listener 3 submitted
177 errors, but only 144 (81.36%) of these were deemed true errors. While there are some
differences in MPE, it appears that listeners are broadly similar, achieving about 78% accuracy
and a mean MPE of 3.22. Another way to probe internal consistency in error detection is to count
how often listeners detected the same error. In Table 4, we see that roughly two-thirds of all
20
errors were heard by just one data collector, and independent detection of the same error by all
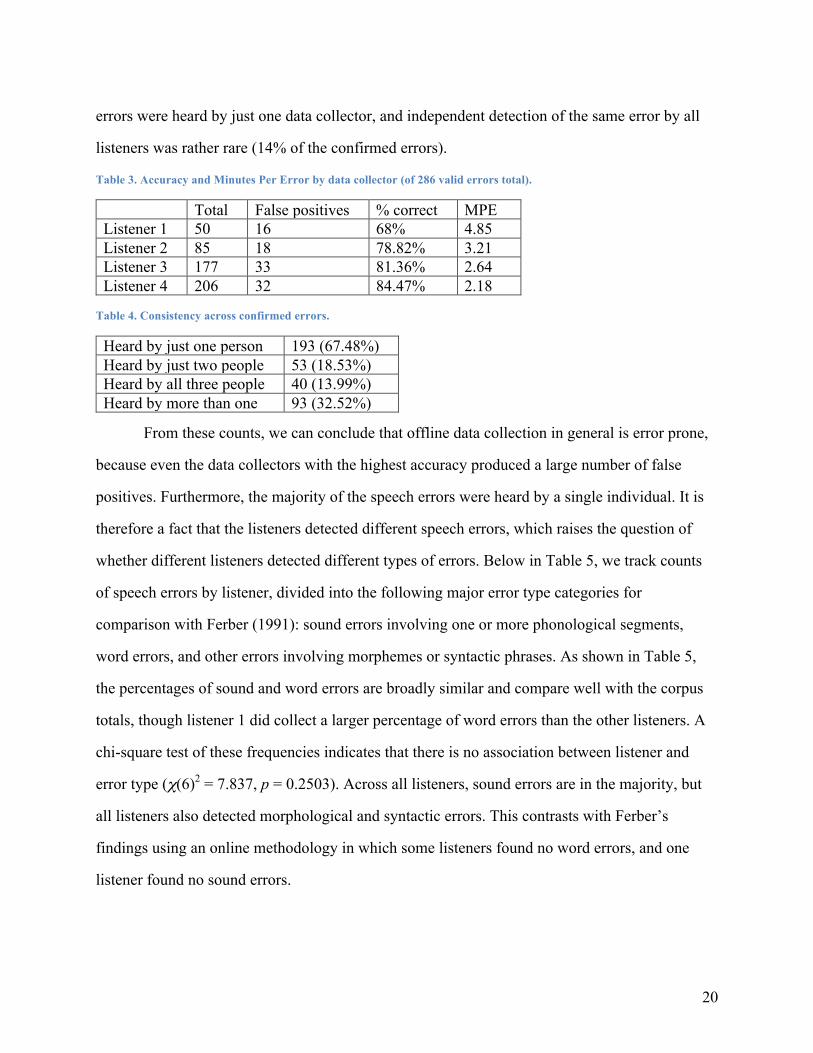
listeners was rather rare (14% of the confirmed errors).
Table 3. Accuracy and Minutes Per Error by data collector (of 286 valid errors total).
Total False positives % correct MPE Listener 1 50 16 68% 4.85 Listener 2 85 18 78.82% 3.21 Listener 3 177 33 81.36% 2.64 Listener 4 206 32 84.47% 2.18
Table 4. Consistency across confirmed errors.
Heard by just one person 193 (67.48%) Heard by just two people 53 (18.53%) Heard by all three people 40 (13.99%) Heard by more than one 93 (32.52%)
From these counts, we can conclude that offline data collection in general is error prone,
because even the data collectors with the highest accuracy produced a large number of false
positives. Furthermore, the majority of the speech errors were heard by a single individual. It is
therefore a fact that the listeners detected different speech errors, which raises the question of
whether different listeners detected different types of errors. Below in Table 5, we track counts
of speech errors by listener, divided into the following major error type categories for
comparison with Ferber (1991): sound errors involving one or more phonological segments,
word errors, and other errors involving morphemes or syntactic phrases. As shown in Table 5,
the percentages of sound and word errors are broadly similar and compare well with the corpus
totals, though listener 1 did collect a larger percentage of word errors than the other listeners. A
chi-square test of these frequencies indicates that there is no association between listener and
error type (χ(6)2 = 7.837, p = 0.2503). Across all listeners, sound errors are in the majority, but
all listeners also detected morphological and syntactic errors. This contrasts with Ferber’s
findings using an online methodology in which some listeners found no word errors, and one
listener found no sound errors.
21
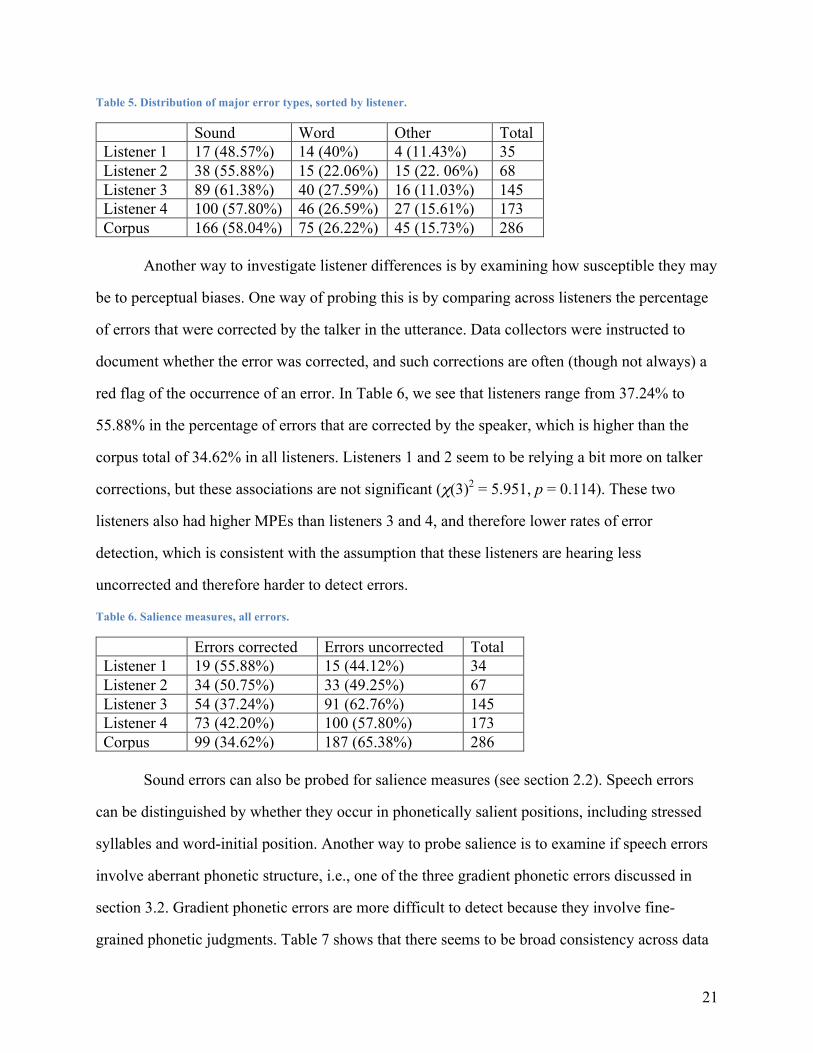
Table 5. Distribution of major error types, sorted by listener.
Sound Word Other Total Listener 1 17 (48.57%) 14 (40%) 4 (11.43%) 35 Listener 2 38 (55.88%) 15 (22.06%) 15 (22. 06%) 68 Listener 3 89 (61.38%) 40 (27.59%) 16 (11.03%) 145 Listener 4 100 (57.80%) 46 (26.59%) 27 (15.61%) 173 Corpus 166 (58.04%) 75 (26.22%) 45 (15.73%) 286
Another way to investigate listener differences is by examining how susceptible they may
be to perceptual biases. One way of probing this is by comparing across listeners the percentage
of errors that were corrected by the talker in the utterance. Data collectors were instructed to
document whether the error was corrected, and such corrections are often (though not always) a
red flag of the occurrence of an error. In Table 6, we see that listeners range from 37.24% to
55.88% in the percentage of errors that are corrected by the speaker, which is higher than the
corpus total of 34.62% in all listeners. Listeners 1 and 2 seem to be relying a bit more on talker
corrections, but these associations are not significant (χ(3)2 = 5.951, p = 0.114). These two
listeners also had higher MPEs than listeners 3 and 4, and therefore lower rates of error
detection, which is consistent with the assumption that these listeners are hearing less
uncorrected and therefore harder to detect errors.
Table 6. Salience measures, all errors.
Errors corrected Errors uncorrected Total Listener 1 19 (55.88%) 15 (44.12%) 34 Listener 2 34 (50.75%) 33 (49.25%) 67 Listener 3 54 (37.24%) 91 (62.76%) 145 Listener 4 73 (42.20%) 100 (57.80%) 173 Corpus 99 (34.62%) 187 (65.38%) 286
Sound errors can also be probed for salience measures (see section 2.2). Speech errors
can be distinguished by whether they occur in phonetically salient positions, including stressed
syllables and word-initial position. Another way to probe salience is to examine if speech errors
involve aberrant phonetic structure, i.e., one of the three gradient phonetic errors discussed in
section 3.2. Gradient phonetic errors are more difficult to detect because they involve fine-
grained phonetic judgments. Table 7 shows that there seems to be broad consistency across data

22
collectors in terms of the salience of sound errors. Roughly 80% of all errors are heard in
stressed syllables (syllable boundaries are established from surface segments and standard
phonotactic rules, without ambisyllabic consonants). And while some listeners heard a few more
gradient errors and errors in non-initial position, no data collector stands out as head and
shoulders above the others on any single measure.
Table 7. Salience measures, sound errors.
Total Error in stressed syllable Error in initial segment Gradient errors Listener 1 17 14 (82.35%) 7 (41.18%) 4 (23.53%) Listener 2 38 29 (76.32%) 13 (34.21%) 8 (21.05%) Listener 3 89 73 (82.02%) 31 (34.83%) 25 (28.10%) Listener 4 100 77 (77%) 44 (44%) 25 (25%)
Finally, it is useful to examine the excluded errors to see what kinds of false positives
listeners are finding. Of the 94 excluded errors, the largest class, at approximately 32% (30
cases), involved apparent sound errors that, upon closer examination, are casual speech
phenomena and acceptable phonetic variants that fall within the normal range of a sound
category. These include cases like final t deletion or stops realized as fricatives because of a
failure to reach complete oral closure (see section 3.2). The next most common class included 15
cases (16%) in which the analyst could not rule out a change of the speech plan. Listeners also
proposed that 12 (13%) false starts were errors, but these were removed because the attempt at
an aborted word did not involve an error. Six cases (6%) also involved errors of transcription
that, once corrected, did not constitute an error. The remaining 33% of the false positives
involved small numbers of acceptable lexical variation (4), phonological variation (3), syntactic
variation (2), idiolectial features (5), and stylistic effects (7). There was also one slip of ear and
nine cases in which uncertainty of the intended message made it impossible to determine error
status. These facts underscore the importance of explicit methods for grappling with phonetic
variation and potential changes to the speech plan in running speech. We examine the potential
impact of false positives on speech error analysis in section 7.3.
23
Let us summarize the principal findings of experiment 1. First, regardless of their
accuracy or error detection rate, all data collectors produced a large number of false positives:
between 16% and 32% of the errors collected by individual listeners had to be excluded. Second,
data collectors detected different speech errors. After excluding false positives, two-thirds of all
the errors collected were heard by only one of the three listeners. And yet, upon re-examination,
the other listeners agreed that the errors that they missed were indeed errors.
Despite these differences in the actual errors found, we did find broad consistency across
the four listeners in terms of their collection rate, error salience, and the major error types found.
Section 6 continues this discussion by drilling down into collection rates and error frequency in
the general population. However, other speech error collections may not be characterized by a
similar degree of consistency, as Ferber’s (1991) findings suggest. We discuss in the final section
some of the practical implications of these findings, but it should be noted that a major factor in
the variation found across our data collectors is likely to be the open-ended nature of the
collection task. Data collectors were instructed to re-listen as many times as they felt necessary,
and so some collectors may have spent more time on certain portions of the recordings than
others. Given this freedom to select different portions of the recording and re-listen at will, a
certain degree of variation is to be expected.
5. Experiment 2: online versus offline collection How does offline data collection differ from the more commonly used online collection method?
Below we probe the effects of collection method by comparing data that we collected online
using traditional observational techniques with data collected offline from audio recordings.
5.1 Methods
Our research team began collecting speech errors in 2015 using traditional observational
techniques characteristic of classic speech error studies. In particular, six research assistants were
given an hour long introduction to speech errors, phonetic training, and instructed in best
practices in speech error collection described in sections 2.3 and 3.3. They were then asked to

24
find set time intervals in their daily lives to collect speech errors, documenting the time, date,
speaker information, and as much of the linguistic context of the error as possible. A total of
1,058 errors were collected by the six data collectors in this way.
During this period, a subset of the research assistants also collected speech errors from
audio recordings, and two new research assistants were trained to collect speech errors
exclusively from audio recordings. The benefits of offline collection in terms of data reliability
led the entire team to switch to exclusive offline collection. This logistical decision, however, led
to a problem with comparing online and offline errors because many of the offline errors were
collected after the collectors had become more experienced with data collection. To balance for
this, we examined a subset of the data submitted from each data collector so that they matched in
experience level. In particular, a set of 100-215 errors were taken for each collector after they
had successfully completed the training and submitted their first 30 valid speech errors. This
selection procedure resulted in a total of 533 offline errors and 839 online errors, since more data
collectors were trained initially to collect errors online. While a small effect of experience is
possible for some of the data collectors, many of the statistical effects discussed below are so
strong that an effect of experience seems highly unlikely. Finally, the online and offline datasets
came from different talkers, so it is possible that individual differences among them could
account for some of the differences that we find below. However, we think that this is unlikely,
because there is a balance of men and women talkers and at least 12 distinct individuals in both
datasets, which reduces the impact of any specific talker on the distribution of error patterns.
5.2 Results and discussion Below we investigate the online and offline datasets with the facts of data quality, reliability, and
perceptual bias from section 2 in mind. In particular, we investigate sound and word errors with
an eye towards the properties that contribute to perceptual salience, like the effects of position in
a word, speech rate, and conformity to grammatical rules. We also investigate differences in the
traditional categories used in speech error classification, e.g., part of speech labels, because these

25
also reveal important differences in the structure of our datasets and can lead to new discoveries
about the impact of perceptual bias.
5.2.1 Differences in sound errors
We begin with some baseline data to give a general sense of pattern frequencies.
Breaking down errors by their linguistic level, as done in Table 8, we find broad similarity
between the two collection types. The percentage of sound errors and word errors are
comparable (though note the actual counts are not comparable because there were more online
collectors). The only real difference observed is that errors involving individual morphemes are a
bit more common in online errors, while phrase errors like phrasal blends and substitutions are a
little less common.
Table 8. Error levels, sorted by collection method.
Offline Online Morpheme 18 (3.38%) 51 (6.08%) Phrase 24 (4.5%) 19 (2.26%) Sound 315 (59.1%) 506 (60.31%) Word 176 (33.02%) 263 (31.35%)
Table 9, which breaks down the sound errors by type, again shows similar percentages
across types between the two collection methods. Gradient errors are of course far more common
with offline collection, but this is simply due to the fact that they are extremely difficult to
collect online without an audio recording. Once gradient errors are removed, as well as shifts
(which are too small in number to assess), there is no significant association between error type
and collection method (χ(2)2 = 4.02, p = 0.134).
Table 9. Sound errors, sorted by type and collection method.
Offline Online Addition 55 (17.46%) 72 (14.23%) Deletion 19 (6.03%) 36 (7.11%) Gradient 39 (12.38%) 3 (0.59%) Shift 1 (0.32%) 4 (0.79%) Substitution 201 (63.81%) 391 (77.27%)

26
Sound errors can be distinguished by two salience measures, namely the percentage of
errors that occur in the stressed syllable and the percentage of corrected errors. In these, we again
find only small insignificant differences, as shown in Table 10 and Table 11. We might have
expected a larger difference in percentage of corrected errors than the 3% difference reported in
Table 11, but there is reason to believe that this difference is greater because of differences in
reporting. We find in practice that the fact that an error was corrected is an afterthought that is
easy to miss with online errors. Therefore, we expect this difference to be greater, with online
errors having an even higher percentage of corrected errors.
Table 10. Sound errors sorted by stress and collection method.
Offline Online Error in main stressed syllable 240 (76.19%) 370 (73.12%) Not in main stressed syllable 75 (23.81%) 136 (26.88%)
Table 11. Sound errors, sorted by correction and collection method.
Offline Online Corrected 129 (58.65%) 192 (61.68%) Not corrected 183 (41.35%) 309 (38.32%)
A more subtle measure, however, reveals an important difference between the two
collection methods because it relates to speech rate. Research has shown that sound errors are
subject to a repeated phoneme effect (Dell, 1984; MacKay, 1970; Wickelgren, 1969), or the
tendency for the phonetic environment of the intruding sound to be the same in both the source
and error word. For example, in “… they’re /plas= passing over the ^plains of the …”
(sfusedE-10), the intruding sound [l] occurs after the phoneme [p] in both the source plains and
intended passing. This effect seems to be stronger in online errors than offline errors, as shown
in Table 12 (χ(1)2 = 6.854, p = 0.0088), with Yates correction to mitigate upward bias, used
throughout in two by two contingency tables).
Table 12. Sound errors, repeated phoneme effect sorted by collection method.
Offline Online Repeated phoneme 51 (16.19%) 122 (24.11%) No repeated phoneme 264 (83.81%) 384 (75.89%)

27
In terms of perceptual biases, one may conjecture that errors exhibiting the repeated
phoneme effect are more salient, perhaps due to priming from the phonetic context in the source
word. However, we think a more likely explanation is that the repeated phoneme effect is
affected by speech rate. In online collection, our data collectors are instructed to only collect
errors with a high degree of confidence. As a result, online collectors are likely to have collected
errors that were produced at a slower rate, because these are naturally easier to detect and
document with confidence. Offline collectors, however, have the ability to replay errors as much
as possible. The fact that the repeated phoneme effect is stronger in online errors can therefore be
seen as a consequence of the general fact that this effect is stronger at slower speech rates (Dell,
1986).
Another related speech rate effect is the lexical bias, or the greater than chance tendency
for sound errors to result in lexical words (Baars, Motley & MacKay, 1975; Dell & Reich, 1981;
Stemberger, 1984; see Garrett (1976) for a contrasting different view). Experimentally elicited
errors have been shown to have a stronger lexical bias at slower rates (Dell, 1986), so if the
online data is collected from speech at a slower overall rate, we expect a stronger lexical bias in
the online errors. We have examined the lexical bias in all sound errors, and indeed found a
difference between sound errors that result in lexical words in the predicted direction: 29.13%
for online errors (slower speech, so stronger effect) versus 24.88% for offline errors (faster
speech, weaker effect). However, this difference is not significant, and is also confounded by
additional factors, including the finding that offline errors have many more aborted words, the
lexical status of which is difficult to determine, as well as the fact that both patterns seem to be
somewhat below chance levels of sound errors resulting in lexical words reported elsewhere
(Dell & Reich, 1981; Garrett, 1976). Thus, while directly relevant to perceptual biases and
speech rate, the lexical bias facts are not conclusive at this time.
Another subtle measure of perceptual bias involves phonotactic violations. Speech errors
tend to obey phonotactics, or the rules governing legal sound combinations, but this is not always
the case. Stemberger (1983) documents 37 errors with clear phonotactic violations, which

28
amount to roughly 1% of his corpus. A number of researchers (Cutler, 1982; Dell, Juliano, &
Govindjee, 1993; Shattuck-Hufnagel, 1983) have noted that it is possible that the percentage of
violations is greater than this because the perceptual systems of human collectors may regularize
errors, or simply fail to detect errors that violate phonotactics. It appears that this is the case,
because phonotactic violations are about three times more common in the offline dataset than the
online dataset, as shown below in Table 13. This association is significant ((χ(1)2 = 7.902, p =
0.0049).
Table 13. Phonotactic violations.
Offline Online Violations 17 (3.19%) 8 (0.95%) No violation 516 (96.81%) 831 (99.05%)
In assessing violations, we employed standard phonotactic principles based on syllable structure
(Giegerich, 1992). The specific examples from both datasets resemble each other, with the
majority of cases involving illicit onsets, as in [vr]iral marketing (viral, sfusedE-1236, offline).
The larger finding therefore provides direct evidence for Cutler and others’ conjecture that
phonotactic violations are affected by perceptual bias, and further supports the contention that
online data collection is more prone to perceptual bias than offline collection.
Next we examine some differences stemming from the context, location, and direction of
sound errors. Table 14 gives the relative frequencies of contextual and non-contextual errors,
where contextual errors are standardly defined as errors that contain a source word with the
phonological content of the intruder. Online errors are more likely to be contextual than offline
errors (χ(1)2 = 23.037, p < 0.0001).
Table 14. Sound errors: contextual versus non-contextual.
Offline Online Contextual 192 (60.95%) 389 (76.88%) Non-contextual 123 (39.05%) 117 (23.12%)
It could be that the phonological content in the source word effectively primes the recognition of
an error, and therefore non-contextual are less salient than contextual errors.

29
The location of an error within a word is also relevant to perceptual bias (section 2.2),
and it appears that error location interacts with the contextual/non-contextual distinction. Table
15 distinguishes sound errors in word-initial and non-initial positions and cross-classifies them
by collection method and the contextual/non-contextual distinction. Separate chi-square tests on
the two datasets show that context and initialness are not associated. However, a test on the row
totals in Table 15 reveals an association between method and initiality: (χ2(1) = 5.268, p =
0.0217). The reason for this association seems to be the rather low frequency of initial non-
contextual errors in the online data, which are less than half of the corresponding non-initial
errors.
Table 15. Sound errors, word onset effect, contextual versus non-contextual (percentages of offline/online totals).
Offline Online Contextual Non-contextual Totals Contextual Non-contextual Totals Initial segment
62 31 93 (40.26%) 115 27 142 (31.14%)
Non-initial segment
99 39 138 (59.74%) 258 56 314 (68.86%)
Totals 161(69.7%) 70 (30.3%) 231 373 (81.8%) 83 (18.2%) 456
These facts are broadly inconsistent with the idea that initial positions are more
perceptually salient, because we would expect a difference in the opposite direction, with a
higher percentage of initial errors with online collection. Table 16 confirms this fact by drilling
down into the syllablic role of intruder sounds and distinguishing initial and non-initial syllables,
i.e., sound errors inside the initial/non-initial syllable of a word as opposed to the initial/non-
initial segment. There are no associations between method and syllabic positions, but a test on
row totals shows a significant association of method and initiality (χ2(1) = 7.184, p < 0.0074). It
appears again that there are a higher percentage of errors in initial syllables in the offline data
(approximately 76/24%) as opposed to the online data (68/32%).

30
Table 16. Sound errors, initial/non-initial syllables by syllable position and collection method.
Offline Online
Onset Nucleus Coda Totals Onset Nucleus Coda Totals
Initial syllable
123 53 36 212 (75.71%) 202 60 50 312 (68.42%)
Non-initial syllable
50 8 10 68 (24.29%) 90 26 28 144 (31.58%)
Totals 173 (61.79%)
61 (21.79%)
46 (16.43%)
280 292 (64.04%)
86 (18.86%)
78 (17.11%)
456
While these findings are not consistent with our expectations about perceptual bias (see e.g.,
Marslen-Wilson and Welsh (1978)), they can be interpreted in a way that is consistent with our
other findings if we assume that the higher number of errors in initial positions is due to a
psycholinguistic bias for such errors, and that offline collection simply gives a more accurate
sample of this asymmetric distribution. As discussed in section 2.2, many researchers have
argued for a word-onset asymmetry (see e.g., Wilshire (1998)), so we do not need to invoke such
an assumption to interpret this data. We note, however, that our findings are not consistent with
the findings of a similar study on German errors collected from audio recordings (Marin &
Pouplier, 2016), which found that collection from audio recordings had no such word-onset
preference.
Within the set of contextual errors, there are important differences that stem from the
direction of the source sound. In Table 17, we show the relative directions of contextual sound
errors. “Anticipations and perseveration” errors are simply errors in which the intruding sound
can be found in both a prior (perseveration) and following word (anticipation), and
“incompletes” are errors that are ambiguous between anticipations and exchanges because there
is a break between the error word and the source word downstream. There is a significant
association between direction and collection type (χ(4)2 = 28.661, p < 0.0001).

31
Table 17. Sound errors, direction sorted by collection type.
Offline Online
Anticipation 54 (27.98%) 119 (30.36%)
Anticipation + Perseveration 53 (27.46%) 52 (13.27%)
Incompletes (broken anticipation) 29 (15.03%) 47 (11.99%)
Perseveration 56 (29.02%) 149 (38.01%)
Exchange 1 (0.52%) 25 (6.38%)
The two most salient differences here seem to be that the offline dataset has more than
twice as many anticipation + perseveration errors than the online dataset, and the clear difference
in incidence of exchanges and perseverations. The frequency of anticipation + perseveration
errors in the online data is comparable with other online datasets (8.6% in Stemberger (2009),
and approximately 10% in García-Albea, del Viso, and Igoa (1989)), so the real focus is on why
it is so high in the offline data. This is almost certainly the result of the availability of more
context in the offline dataset. Because of the availability of replay, the transcription of the entire
example includes many more words in the offline data. A step sample of the two datasets shows
that the mean word count for online examples is 7.44 words but 17 words for offline examples.
As a result, it is possible to find more potential source words in the offline data because of the
availability of more contextual information than in the online data. This is not to say that the two
datasets differ in the interval of speech that can provide source words; only that the availability
of the source information differs immensely, and so it is an artifact of the collection method.
The difference in exchange errors is striking, however, and clearly related to perceptual
bias. Exchange errors are far more salient than other errors because there are two intruders, and
in practice they can create problems in comprehension (see Stemberger 1982/1985: 22). Because
attentional resources are more limited in online collection, these rare but easier to hear errors
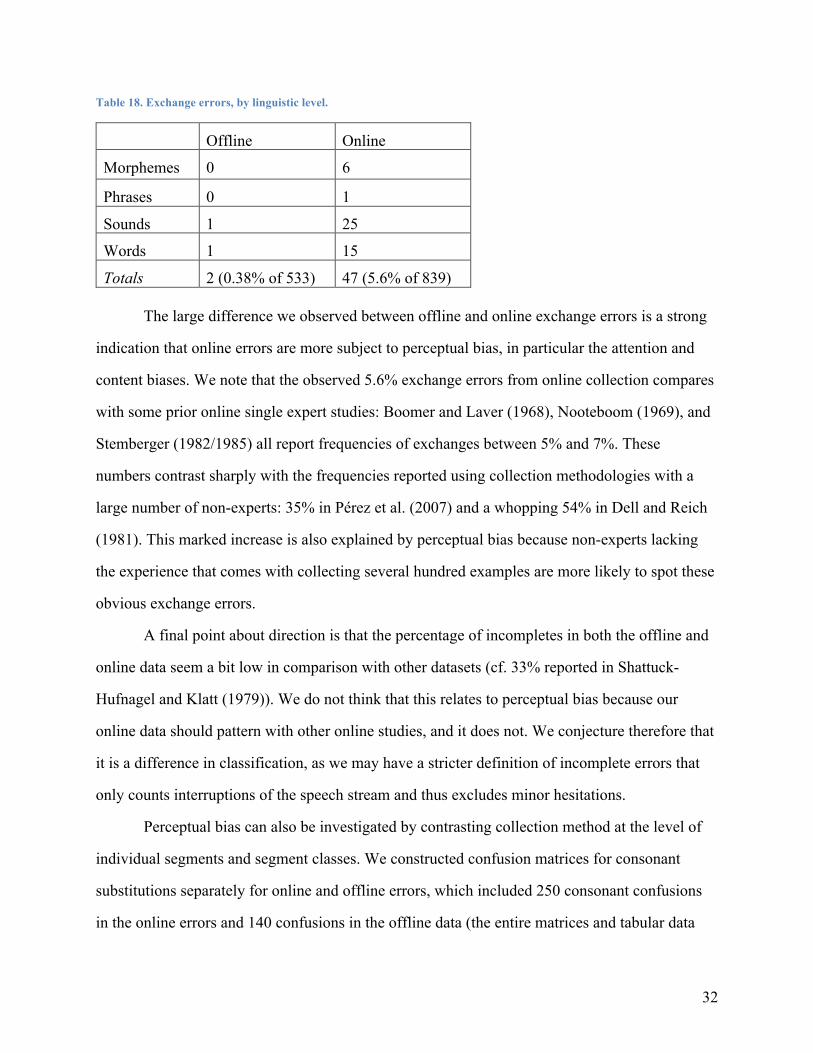
have a much higher frequency. As shown in Table 18, the difference between online and offline
exchanges is not limited to sound errors: we find important differences at all linguistic levels.
32
Table 18. Exchange errors, by linguistic level.
Offline Online
Morphemes 0 6
Phrases 0 1
Sounds 1 25
Words 1 15
Totals 2 (0.38% of 533) 47 (5.6% of 839)
The large difference we observed between offline and online exchange errors is a strong
indication that online errors are more subject to perceptual bias, in particular the attention and
content biases. We note that the observed 5.6% exchange errors from online collection compares
with some prior online single expert studies: Boomer and Laver (1968), Nooteboom (1969), and
Stemberger (1982/1985) all report frequencies of exchanges between 5% and 7%. These
numbers contrast sharply with the frequencies reported using collection methodologies with a
large number of non-experts: 35% in Pérez et al. (2007) and a whopping 54% in Dell and Reich
(1981). This marked increase is also explained by perceptual bias because non-experts lacking
the experience that comes with collecting several hundred examples are more likely to spot these
obvious exchange errors.
A final point about direction is that the percentage of incompletes in both the offline and
online data seem a bit low in comparison with other datasets (cf. 33% reported in Shattuck-
Hufnagel and Klatt (1979)). We do not think that this relates to perceptual bias because our
online data should pattern with other online studies, and it does not. We conjecture therefore that
it is a difference in classification, as we may have a stricter definition of incomplete errors that
only counts interruptions of the speech stream and thus excludes minor hesitations.
Perceptual bias can also be investigated by contrasting collection method at the level of
individual segments and segment classes. We constructed confusion matrices for consonant
substitutions separately for online and offline errors, which included 250 consonant confusions
in the online errors and 140 confusions in the offline data (the entire matrices and tabular data

33
below are available as a spreadsheet from the first author’s website). The online matrix is larger
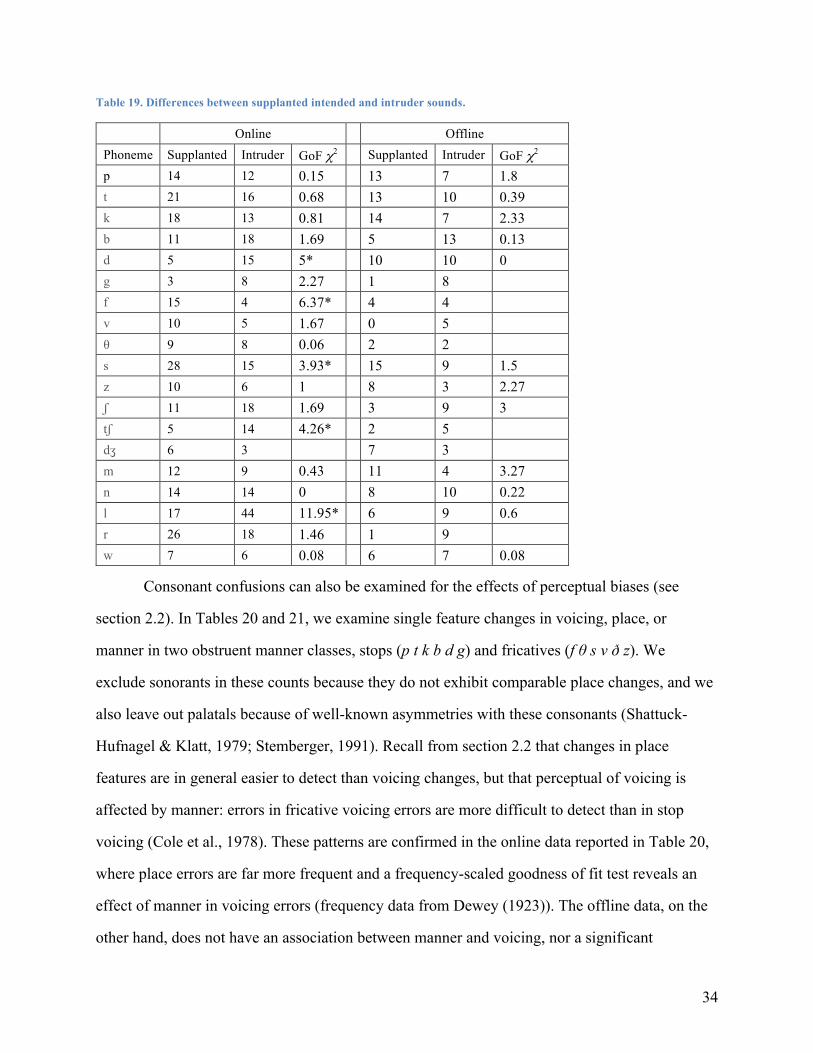
because, as explained in section 5.1, there were more online data collectors. Table 19
investigates the differences between counts of supplanted intended phonemes (i.e., target
phonemes that were not pronounced) and intruder phonemes, or the row and column totals in a
standard confusion matrix. These comparisons have been used in the literature to understand
asymmetries in consonant confusion matrices and the anomalies observed in specific sounds
(Shattuck-Hufnagel & Klatt, 1979; Stemberger, 1991). Chi-square goodness of fit tests (GoF)
applied to each phoneme are reported below.
The striking difference between the two matrices is that five out of 18 tests in the online
matrix reached .05 significance (shown with a “*” suffix), while none of the 11 tests in the
offline matrix showed any significant effects. For example, d was three times more likely to be
an intruder than a supplanted intended (5-to-15) in the online matrix, but the 20 offline
substitutions involving d are evenly distributed between supplanted intended phonemes and
intruders. Some of the patterns in the online matrix resemble patterns found in Shattuck-
Hufnagel and Klatt (1979), like the palatal bias favoring tʃ as an intruder and s as an supplanted
intended. However, the complete absence of any such effects in the offline matrix again strongly
supports the claim that these matrices have a different underlying structure.
34
Table 19. Differences between supplanted intended and intruder sounds.
Consonant confusions can also be examined for the effects of perceptual biases (see
section 2.2). In Tables 20 and 21, we examine single feature changes in voicing, place, or
manner in two obstruent manner classes, stops (p t k b d g) and fricatives (f θ s v ð z). We
exclude sonorants in these counts because they do not exhibit comparable place changes, and we
also leave out palatals because of well-known asymmetries with these consonants (Shattuck-
Hufnagel & Klatt, 1979; Stemberger, 1991). Recall from section 2.2 that changes in place
features are in general easier to detect than voicing changes, but that perceptual of voicing is
affected by manner: errors in fricative voicing errors are more difficult to detect than in stop
voicing (Cole et al., 1978). These patterns are confirmed in the online data reported in Table 20,
where place errors are far more frequent and a frequency-scaled goodness of fit test reveals an
effect of manner in voicing errors (frequency data from Dewey (1923)). The offline data, on the
other hand, does not have an association between manner and voicing, nor a significant
Online Offline Phoneme Supplanted Intruder GoF χ2 Supplanted Intruder GoF χ2 p 14 12 0.15 13 7 1.8 t 21 16 0.68 13 10 0.39 k 18 13 0.81 14 7 2.33 b 11 18 1.69 5 13 0.13 d 5 15 5* 10 10 0 g 3 8 2.27 1 8 f 15 4 6.37* 4 4 v 10 5 1.67 0 5 θ 9 8 0.06 2 2 s 28 15 3.93* 15 9 1.5 z 10 6 1 8 3 2.27 ʃ 11 18 1.69 3 9 3 tʃ 5 14 4.26* 2 5 dʒ 6 3 7 3 m 12 9 0.43 11 4 3.27 n 14 14 0 8 10 0.22 l 17 44 11.95* 6 9 0.6 r 26 18 1.46 1 9 w 7 6 0.08 6 7 0.08

35
difference in the number of place versus voicing errors (see below). Thus, it appears that these
perceptual biases have a stronger impact in the online data.
Table 20. Place and voicing feature changes in obstruents: stops versus fricatives.
Offline Online Stop Fricative GoF Stop Fricative GoF Place 15 3 5.95* 32 18 1.73 Voicing 15 7 1.61 13 3 4.54*
We can also probe differences within online and offline data by examining the rank of
voicing, place, and manner changes (see e.g., Stemberger (1992)). The expected frequencies for
the GoF test in these broader classes are based on the logically possible changes within the 44
single feature changes we examined. For example, there are many more place feature changes
because there are twice as many possible place substitutions (24/44) as there are voicing
substitutions (12/44). As shown in Table 21, the online matrix shows the expected order from
highest to lowest: place > voicing > manner, but the offline matrix reverses the expected order of
place and voicing, with a surprisingly high number of voicing changes. These differences again
support the contention that the underlying data is rather different, and that offline data collection
is less prone to perceptual bias.
Table 21. Single feature changes in obstruents.
N/44 Expected Offline Online Place 24/44 54.5% 18 (41%) 50 (64.93%) Voicing 12/44 27.3% 22 (50%) 16 (20.78%) Manner 8/44 18.2% 4 (9.09%) 11 (14.29%)
GoF 11.83* 3.36
5.2.2 Differences in word errors
Let’s move now to a set of comparisons within word errors. The frequencies of different
types of word errors classified in our corpus are shown in Table 22. Errors in stress and
intonation are typically very rare, and nearly impossible to document online. If we remove these
errors and also the low frequency additions, we find a significant association between error type
and collection method (χ(3)2 = 16.817, p = 0.0007). Thus, while word substitutions dominate

36
both online and offline errors, there is a higher percentage of substitutions and blends in online
errors, offset by a higher number of additions and deletions in offline errors. Blends, because
they produce rather odd nonsense words, compare with exchanges in their overall salience. It is
not a surprise, then, that we find more than twice as many blends in online errors than offline
errors.
Table 22. Word errors, sorted by type and collection method.
Offline Online Additions 7 (3.98%) 3 (1.15%) Blends 9 (5.11%) 30 (11.45%) Deletions 17 (9.66%) 8 (3.05%) Stress/Intonation 3 (1.70%) 0 Substitutions 140 (79.55%) 221 (84.35%)
Word errors can also be distinguished by the word class of the intended word. Table 23
shows the word class of the intended word in word substitution errors. The term “Functional
items” in this table refers collectively to prepositions, adverbs, complementizers, conjunctions
and determiners, i.e., word types whose counts are individually too low to assess but together
form a natural class of functional categories. It is clear for these data that there is a strong
preference for nouns in online errors, where offline errors make up for the difference in noun
substitutions with a greater number of substitutions with names, pronouns, and functional items
(χ2(5) = 30.16, p = 0.00001).
One concern with this conclusion is that the larger counts for names and pronouns in the
offline errors could be a sampling effect, perhaps due to a possibly higher frequency of names
and pronouns in entertainment podcasts focusing on characters in TV and film. However, there is
still a significant association between word class and collection method (χ2(3) = 7.864, p =
0.04891) when these three classes are collapsed into an umbrella nominal class: offline (58 or
54.21%) versus. online (124 or 61.08 %). Furthermore, it is not the case that names and pronouns
are over-represented in the podcasts. We have conducted a step sample of 100 nominals in two
entertainment podcasts and found that nouns and pronouns have comparable frequency (about
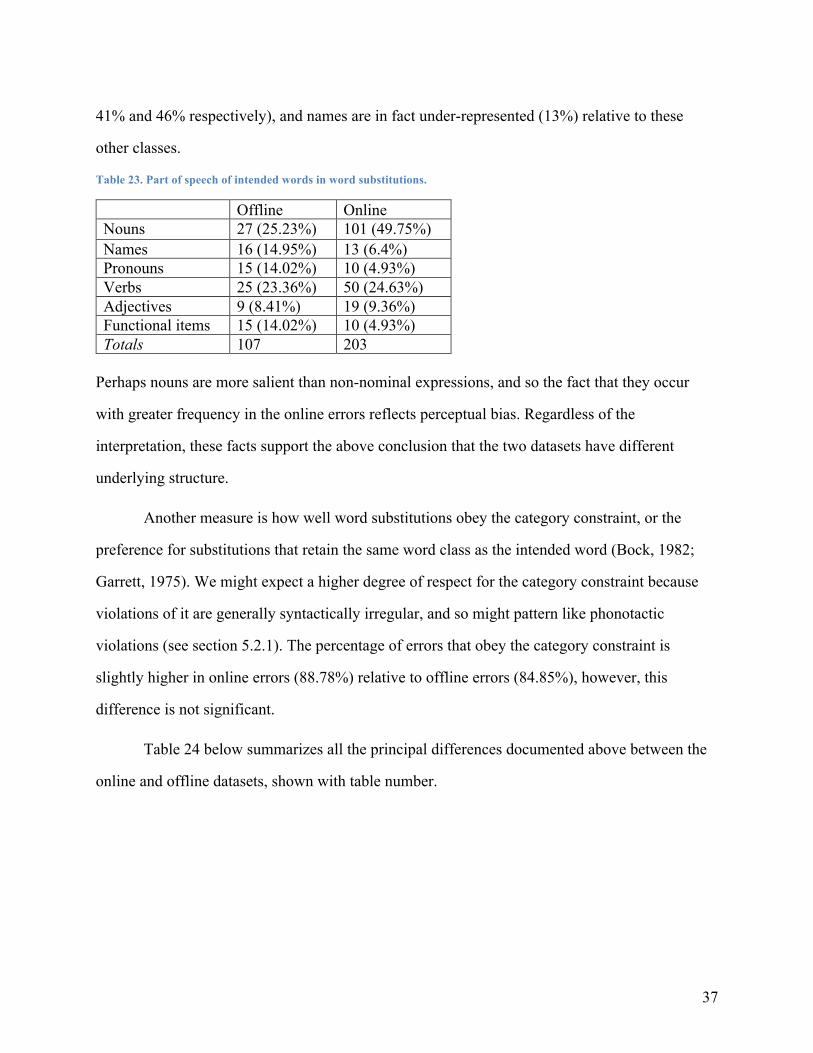
37
41% and 46% respectively), and names are in fact under-represented (13%) relative to these
other classes.
Table 23. Part of speech of intended words in word substitutions.
Offline Online Nouns 27 (25.23%) 101 (49.75%) Names 16 (14.95%) 13 (6.4%) Pronouns 15 (14.02%) 10 (4.93%) Verbs 25 (23.36%) 50 (24.63%) Adjectives 9 (8.41%) 19 (9.36%) Functional items 15 (14.02%) 10 (4.93%) Totals 107 203
Perhaps nouns are more salient than non-nominal expressions, and so the fact that they occur
with greater frequency in the online errors reflects perceptual bias. Regardless of the
interpretation, these facts support the above conclusion that the two datasets have different
underlying structure.
Another measure is how well word substitutions obey the category constraint, or the
preference for substitutions that retain the same word class as the intended word (Bock, 1982;
Garrett, 1975). We might expect a higher degree of respect for the category constraint because
violations of it are generally syntactically irregular, and so might pattern like phonotactic
violations (see section 5.2.1). The percentage of errors that obey the category constraint is
slightly higher in online errors (88.78%) relative to offline errors (84.85%), however, this
difference is not significant.
Table 24 below summarizes all the principal differences documented above between the
online and offline datasets, shown with table number.

38
Table 24. Summary of statistically significant differences between online and offline datasets.
Table Difference
12 Online sound errors have higher rates of repeated phonemes in source words
13 Online sound errors have a lower rate of phonotactic violations than offline errors
14 Online sound errors are more likely to be contextual than offline errors
15 Online errors have lower rates of word-initial non-contextual sound errors than offline errors
16 Online errors have fewer errors in the initial syllable than offline errors
17 Online sound errors have higher rates of perseverations and exchanges than offline errors
18 Exchanges of all kinds have higher rates in online errors than offline errors
19 Online errors have five consonant substitution anomalies not found in offline errors
20 Online voicing errors are affected by manner in ways that offline errors are not
21 Online errors are skewed towards place errors relative to voicing, but online errors are not.
22 Online word errors have higher rates of word blends than offline errors.
23 Online word errors show a higher rate of noun substitutions than offline errors
While the above investigation showed that there are some differences due to artifacts of
collection method (e.g., higher rates of Anticipation & Perseveration), the most salient contrasts
relate to differences in the attentional resources intrinsic to collection method. Online errors
exhibit a strong repeated phoneme effect, which suggests errors are taken from slower more
careful speech. They also have a much larger number of online errors that require less attention,
like exchange errors and word blends. In addition, there are a number of rather subtle measures
that indicate offline collection is less prone to bias: it has more phonotactic violations, it is less
affected by manner biases on voicing and place, and consonant confusions are less asymmetrical.
Other differences, such as frequencies of corrected errors, noun substitutions, and other
consonant confusions, support the the contention that offline and online datasets have different
underlying distributions. We investigate some of the implications of these differences for
language production research in section 7.3.

39
6. Data discovery In this section, we investigate some of the new directions that speech error research can take with
our methodology. The existence of an audio recording provides the direct benefit of allowing
another pass at the speech facts to confirm empirical observations. In addition, it gives the
researcher a chance to “dig deeper” into the data. One example where such an opportunity would
be of value involves a finding from Ferreira and Swets (2005) that more errors are found in
longer utterances and more complex speech. Citing this study, MacDonald (2016) notes that the
lack of linguistic context typically recorded in online speech error collections precludes full
assessment of this claim. Likewise, Bock (2011) bemoans the lack of an audio recording in prior
work because of a need to study the prosodic structures in word shifts. Such requests for more
linguistic context are not uncommon in the speech error literature, and access to an audio
recording allows the researcher to find the necessary additional information. Below we survey a
number of new opportunities for data exploration created by this methodological approach.
6.1 Data collection metrics and the frequency of speech errors
Because audio recordings have a specific duration, we can assess how frequently, on
average, a data collector is observing errors and making corrections accordingly. In particular,
we use the measure of minutes per error (MPE) to gauge if a data collector is collecting errors at
a reasonable rate. After some experimentation, our team has settled on a rate of MPE of 3.0 or
lower (i.e., a speech error collected every three minutes or less). Error submissions with higher
MPEs, meaning that more errors have been missed, can prompt the data collector to re-listen to
the recording or the project manager to assign the recording to a different data collector in order
to achieve a more representative sample.
Our methodology also makes it possible to provide better estimates of speech error
frequency in the general population. Estimates of the frequency of speech errors are typically
based on counts of attested errors relative to some baseline. For example, Ferber (1991)’s team
collected 51 speech errors in a 45 minute interval composed of 15 separate samples stitched
together. Though the sample is small, and somewhat artificial given the disjointedness of the
40
speech, it yields a MPE of 51/45 or 0.88, which is equal to an error about every 53 seconds.
Chen’s (1999) corpus of Mandarin speech errors is larger, with 987 errors collected from
approximately 4,800 minutes of speech. This sample produces a much larger MPE of 4.86, but
Ferber’s team had two additional data collectors, and also Chen threw out many errors because
they did not meet his stricter definition of a speech error. The London-Lund corpus (Garnham,
Shillcock, Brown, Mill, & Cutler, 1981) recorded 191 errors out of approximately 17,000 words.
If we take 2.5 words a second as the average speaking rate (Maclay & Osgood, 1959), or 150
words a minute, that converts to an MPE of 5.93, which compares with Chen’s rate. The
important point is that these frequency estimates are based only on actually observed errors,
despite the fact that researchers freely acknowledge errors have been missed. For example,
Garnham et al. (1981: 806) note, “There can be no pretence that all slips of the tongue in the
corpus have been listed. Thus the estimate of the frequency of speech errors in conversation is a
conservative one.”
Multiple listeners working with audio recordings can make multiple samples from the
same recording. By using multiple samples, a more realistic estimate of the total number of
errors can be made by using capture-recapture methods. Capture-recapture methods are
commonly used in ecology to estimate animal populations when it is not practical to attempt a
count of all members of the population. Capture-recapture involves multiple samples of the
population and marking the individuals found in different samples. Estimates of the total
population are then calculated as a function of the proportion of individuals found in all samples
(see Chao (2001) for an overview).
The collection of speech errors is parallel in many ways with the kinds of problems
investigated with capture-recapture methods. The difficulty in exhaustively counting the number
of speech errors makes complete counts impractical. At first blush, it might seem possible for a
researcher to collect all of the errors in a given recording. After all, they can listen and re-listen
to every second of speech. However, the facts of experiment 1, as well as Ferber (1991)’s
findings, strongly suggest this is not the case. When the same recording is heard by multiple
41
listeners, most errors are only heard by one listener. It is simply impractical to exhaustively
count the speech errors in any sizable speech corpus, as attested by Garnham et al. (1981)’s
statement above.
The availability of an audio recording allows for the creation of multiple samples that are
needed for capture-recapture techniques. However, recent work on capture-recapture (Mao,
Huang, & Zhang, 2017) argues that it is not possible to estimate the population size when the
items being counted are heterogeneous in nature, because there can be arbitrarily many hard to
find items. Instead, Mao et al. recommend estimating the lower bound and provide a formula for
doing so (their equations (22-23)). As discussed in detail in section 2, speech errors are
heterogeneous because they occur with different levels of linguistic structure, and they also
clearly differ in detection difficulty. As a result, we can estimate the lower bounds of the number
of speech errors for a given recording, but not the actual population.
Table 25 below shows the count data from the nine recordings from experiment 1. In
particular, it shows the recording duration in seconds, the specific number of unique errors found
only by the three listeners A, B, and C, as well as the counts of unique errors by all possible
groupings (AB, AC, BC, ABC), e.g., “AB” is the number of errors found only by both A and B.
n is the total number of actually observed errors, and ṽ is the estimated lower bound using Mao
et al.’s formulas, which is equal to m̃ (estimated lower bound of missed errors) + n. These
estimates bring us into the time scale of seconds, so we report seconds per error (SPE). While
there is some variation in the podcasts, averaging across these nine recordings gives an SPE of
48.5, which is a bit lower than the frequency of attested errors from Ferber’s recordings (though
recall that this estimate did not calculate missed errors). It should also be noted that this number
is conservative. It is a lower bound estimate, so the actual population of errors will likely be
larger, and consequently, the average SPE will be smaller. For example, the 2,377 second
recording in Table 25 (second from bottom) has been used in our training regime for new
listeners, and after four new listeners have examined this recording, 24 additional errors have
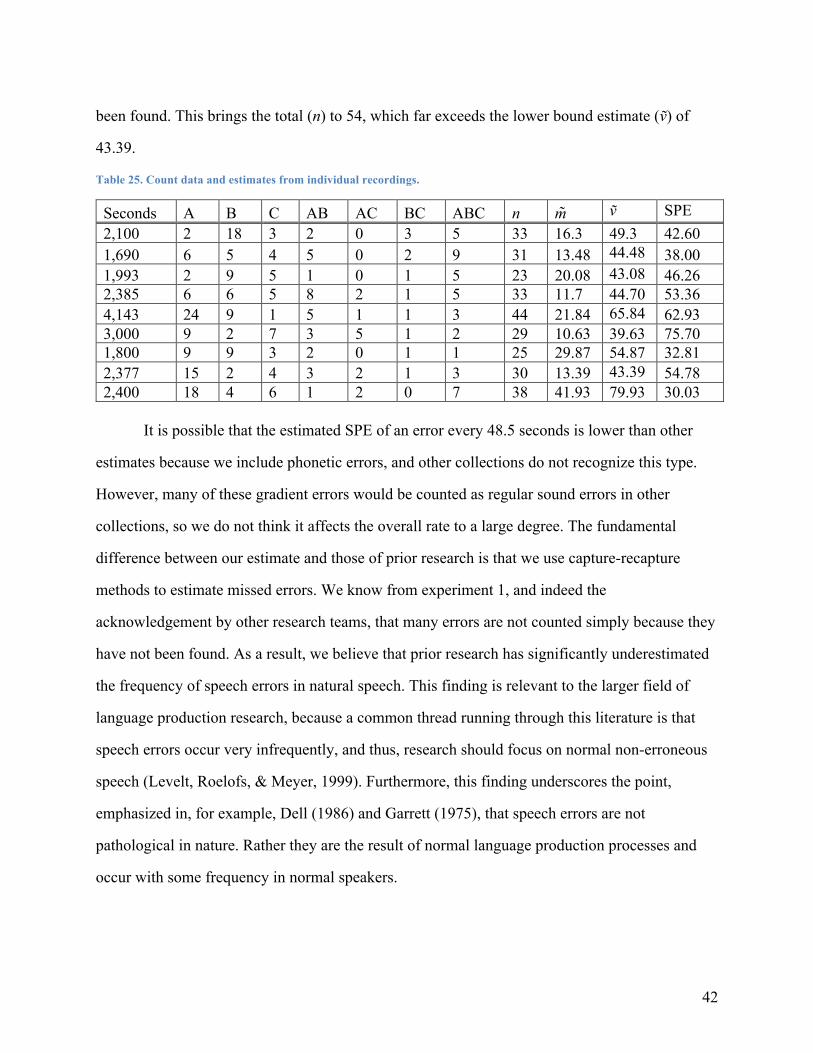
42
been found. This brings the total (n) to 54, which far exceeds the lower bound estimate (ṽ) of
43.39.
Table 25. Count data and estimates from individual recordings.
Seconds A B C AB AC BC ABC n m̃ ṽ SPE 2,100 2 18 3 2 0 3 5 33 16.3 49.3 42.60 1,690 6 5 4 5 0 2 9 31 13.48 44.48 38.00 1,993 2 9 5 1 0 1 5 23 20.08 43.08 46.26 2,385 6 6 5 8 2 1 5 33 11.7 44.70 53.36 4,143 24 9 1 5 1 1 3 44 21.84 65.84 62.93 3,000 9 2 7 3 5 1 2 29 10.63 39.63 75.70 1,800 9 9 3 2 0 1 1 25 29.87 54.87 32.81 2,377 15 2 4 3 2 1 3 30 13.39 43.39 54.78 2,400 18 4 6 1 2 0 7 38 41.93 79.93 30.03
It is possible that the estimated SPE of an error every 48.5 seconds is lower than other
estimates because we include phonetic errors, and other collections do not recognize this type.
However, many of these gradient errors would be counted as regular sound errors in other
collections, so we do not think it affects the overall rate to a large degree. The fundamental
difference between our estimate and those of prior research is that we use capture-recapture
methods to estimate missed errors. We know from experiment 1, and indeed the
acknowledgement by other research teams, that many errors are not counted simply because they
have not been found. As a result, we believe that prior research has significantly underestimated
the frequency of speech errors in natural speech. This finding is relevant to the larger field of
language production research, because a common thread running through this literature is that
speech errors occur very infrequently, and thus, research should focus on normal non-erroneous
speech (Levelt, Roelofs, & Meyer, 1999). Furthermore, this finding underscores the point,
emphasized in, for example, Dell (1986) and Garrett (1975), that speech errors are not
pathological in nature. Rather they are the result of normal language production processes and
occur with some frequency in normal speakers.
43
6.2 Speech rate effects
Speech rate has long been a factor of interest in speech production research. The spreading-
activation model of language production proposed in Dell (1986), for example, predicts a trade-
off between speech and accuracy, with more errors in faster speech. Furthermore, some
psycholinguistic effects are known to be stronger at slower rates, including the lexical bias effect
and the repeated phoneme effect discussed in section 5. These speech rate effects have been
documented in speech errors collected in experimental settings (Dell, 1985, 1986, 1995;
MacKay, 1971), but they remain to be corroborated in natural speech.
The luxury of having an audio recording makes testing these hypotheses a tractable
problem. By adopting an accepted measure of speech rate, either phonemes per time unit
(Cucchiarini, Strik, & Boves, 2002) or syllables per time unit (Kormos & Dénes, 2004), relative
speech rate can then be assigned to an interval of the recording, a procedure made considerably
more efficient by the existence of automatic tools for assessing speech rate (de Jong & Wempe,
2009). Assigning a speech rate measure to speech chunks in turn makes it possible to test speech
rate effects in natural corpora. For example, to test the general speech-accuracy trade off, long
intervals of speech can be segmented and measured for speech rate. If speech rate affects
incidence of speech errors, we expect faster speech rates to have lower MPEs (=more errors)
than regions with slower rates. Moreover, specific psycholinguistic effects can also be tested by
assigning speech rate values to smaller intervals. Individual speech errors can be associated with
the speech rate, e.g., syllables per second inside a ten second envelop, and then compared in a
larger test. To test the effect of speech rate on the lexical bias, for example, one can bin errors
into qualitatively distinct rate types, and then test for known rate effects. Thus, the ability to
situate specific errors in a system for measuring speech rate opens up new doors for empirical
investigation.
6.3 Gradient errors
Another opportunity supported by our methodology is exploration of gradient phonetic
errors. As discussed in section 2.2, critical assessment of speech error collection and analysis has
44
led to a growing interest in the phonetic structure of speech errors (see Pouplier and Hardcastle
(2005) and Goldrick and Blumstein (2006) for review). Whereas classic speech error studies
focused largely on categorical sound errors, and indeed lacked the tools to describe fine-grained
phonetic structure, new research paradigms have emerged that probe the articulatory, acoustic,
and perceptual structures of speech errors (Frisch & Wright, 2002; Goldrick & Chu, 2014;
Goldstein et al., 2007; Marin et al., 2010; Mowrey & MacKay, 1990; Pouplier & Goldstein,
2005; Slis & Van Lieshout, 2016).
The examination of gradient phonetic errors has in large part been conducted with
experimentally elicited speech errors. While some speech error collections acknowledge the
existence of phonetic errors (e.g., Stemberger (1993)’s taxonomy recognizes sound blends), the
practice of most speech error collections has been to focus on categorical errors, and indeed,
transcription practice in the past has tended to require this. Our experience with data collection
from audio recordings, however, is that many errors on closer investigation are indeed gradient
in nature and fall between two sound categories. As described in section 3.2, we adapt a
transcription commonly used in child language research (Stoel-Gammon, 2001) that recognizes
ambiguous segments and other indeterminate sound categories. In particular, categorical errors
involve discrete sound categories, typically an addition, deletion, or substitution of a phoneme of
English. Gradient errors, on the other hand, may be ambiguous between two poles (A|B),
transitional between two poles (A-B), or intrusive (see Table 2 for explicit examples). We
acknowledge that there will be aberrant speech that cannot be collected from listening to audio
recordings because they involve phonetic structures that are imperceptible (Mowrey & MacKay,
1990). However, we believe that the distinction made in prior research, e.g., Frisch (2007),
between categorical phonological errors and gradient phonetic errors is a viable one, and that
acknowledging it in perceptible errors will lead to a better understanding of both types.
The results below offer a preliminary look at the structure of phonetic errors collected
from audio recordings of natural speech. From a sample of 1,393 offline errors, 839 (60.23%) of
which are sound errors, our team has collected 163 gradient errors, or 19.43% of all sound errors.

45
As explained in detail in section 3.2, these phonetic errors are true errors and not casual speech
phenomena or the results of normal phonetic processes. The results are shown below in Table 26,
sorted by gradient error type (see Table 2) and whether or not the error is contextual. Ambiguous
errors are by far the most common, followed by transitional, then intrusive.
Table 26. Gradient sound errors, sorted by type and contextual/non-contextual.
Ambiguous Transitional Intrusive Contextual 44 (38.26%) 24 (57.14%) 1 (16.67%) Non-contextual 71 (61.74%) 18 (42.86%) 5 (83.33%) Totals 115 42 6
Interestingly, the percentage of contextual transitional errors is rather close to the percentage of
contextual errors in phonological sound errors, which is 60.95% (Table 14). But the percentage
of contextual ambiguous errors is much lower at 38.26%. Therefore, while many of the phonetic
errors seem to be tied to production planning of nearby segments, at least some ambiguous errors
seem to require a different mechanism.
Of the 115 ambiguous errors, 76 (66.09%) are C|C errors between two consonantal poles,
and 39 (33.91%) are between two vowel poles. To flesh out these patterns, Table 27 below lists
all ambiguous errors with three or more observations. For ambiguous C|C errors, it seems that
voicing and nasality in stops are the most salient dimensions, though these counts are too small
to make any conclusion on the direction of these changes. In all of the ambiguous sound errors
reported below, the difference between the two poles can be described with a single phonological
feature, something that is not always true with categorical phonological errors.
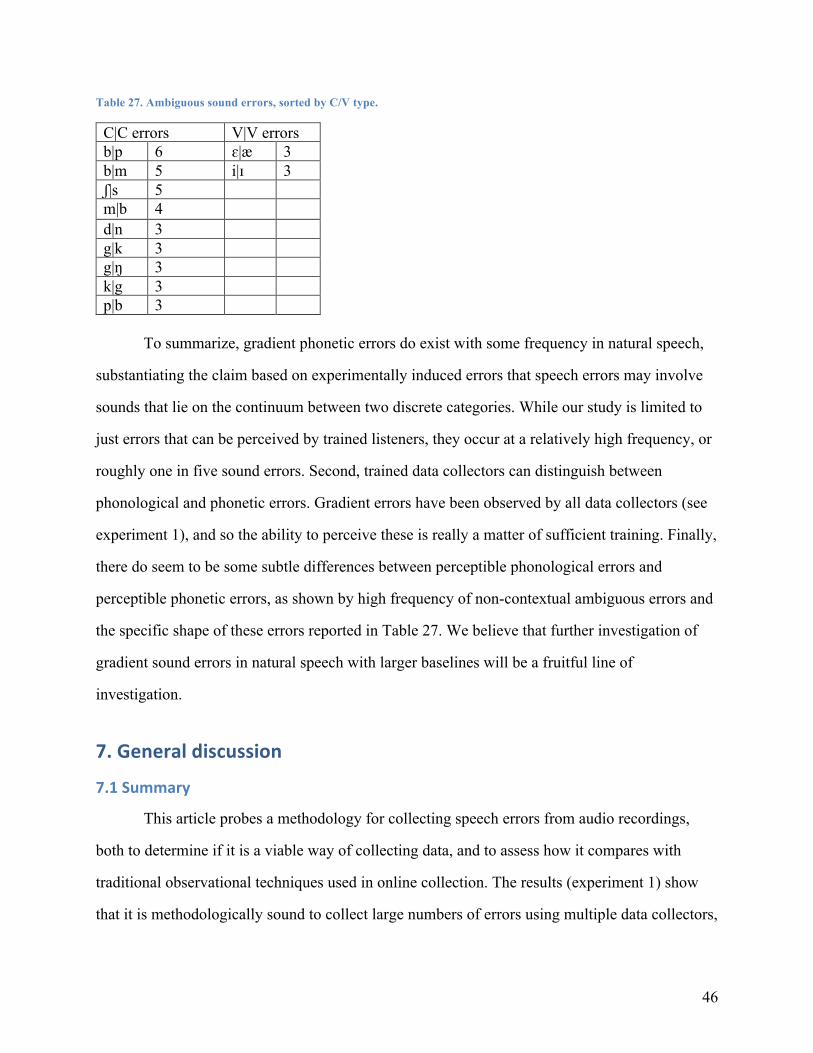
46
Table 27. Ambiguous sound errors, sorted by C/V type.
C|C errors V|V errors b|p 6 ɛ|æ 3 b|m 5 i|ɪ 3 ʃ|s 5 m|b 4 d|n 3 g|k 3 g|ŋ 3 k|g 3 p|b 3
To summarize, gradient phonetic errors do exist with some frequency in natural speech,
substantiating the claim based on experimentally induced errors that speech errors may involve
sounds that lie on the continuum between two discrete categories. While our study is limited to
just errors that can be perceived by trained listeners, they occur at a relatively high frequency, or
roughly one in five sound errors. Second, trained data collectors can distinguish between
phonological and phonetic errors. Gradient errors have been observed by all data collectors (see
experiment 1), and so the ability to perceive these is really a matter of sufficient training. Finally,
there do seem to be some subtle differences between perceptible phonological errors and
perceptible phonetic errors, as shown by high frequency of non-contextual ambiguous errors and
the specific shape of these errors reported in Table 27. We believe that further investigation of
gradient sound errors in natural speech with larger baselines will be a fruitful line of
investigation.
7. General discussion
7.1 Summary
This article probes a methodology for collecting speech errors from audio recordings,
both to determine if it is a viable way of collecting data, and to assess how it compares with
traditional observational techniques used in online collection. The results (experiment 1) show
that it is methodologically sound to collect large numbers of errors using multiple data collectors,

47
because different data collectors are broadly consistent in the types of errors they collect, even
though they find different specific errors. Also, speech error collection requires a mechanism to
verify speech errors, because even trained and experienced data collectors produce a large
number of false positives (16-32%). Experiment 2 compared online and offline data collection
and found a host of differences (see Table 24), supporting the general conclusion that offline
collection is less prone to perceptual bias. Below we situate these findings in a larger comparison
across methodologies.
7.2 Comparison of methodological approaches
For new studies, researchers may wish to understand the benefits and trade-offs of the
different approaches to collecting and analyzing speech errors. Also, a broad comparison across
methodological approaches can help researchers understand apparently conflicting evidence
reported in prior studies. Table 28 below classifies studies into four principal types from section
2.3 and summarizes a variety of advantages and disadvantages.
Table 28. Comparing methodologies.
Online 100+ non-experts Dell & Reich 1981, Perez et al. 2007
Online 1-2 experts MIT-Arizona corpus, Stemberger corpus
Offline multiple experts Chen 1999, 2000, this study
Offline experimental Motley & Baars 1975, Dell et al. 2000
Perceptual bias strongly susceptible
weakly susceptible least susceptible least susceptible
Verification - - + + Data quality poor good excellent excellent Natural data + + + - Re-purposable + (with limits) + (with limits) + - Experimental control - - - + Acoustic analysis - - + + Timeframe long very long medium short Extendable - - + - Limitations context, prosody,
discourse context, prosody,
discourse talker thoughts, visual effects
some processes not suitable
We believe a strong argument can be made for offline collection over online collection
based on this comparison. Experiment 2 documented a host of perceptual biases that likely skew
distributions by favoring easier to hear errors. A diverse range of differences, including rate
48
differences, incidence of contextual errors, exchanges, perception of voicing changes, word
blends, and the dominance of noun substitutions, all point in the direction that offline data
collection is less prone to perceptual bias. It is possible that online studies with just expert
collectors are less susceptible to bias, but examination of the differences in our online/offline
comparison strongly suggests that even experts with lots of experience are impacted by these
biases. Furthermore, errors collected from audio recordings can be verified, which is
tremendously important in ensuring data quality (experiment 1). Another benefit of an audio
recording is researchers can dig deeper into the data and extend the dataset to new structures not
anticipated at the outset of research. In contrast, errors collected online tend to have much less
contextual information because of the imperative to give an accurate record of the speech event.
This results in limitations in the investigation of linguistic context before and after the speech
error, with obvious constraints on examining the impact of factors like prosodic and discourse
structure which require such information.
Offline studies are not without their own limitations. For example, offline collection
generally does not allow introspection into a talker’s thoughts, and recordings secured from third
parties do not always allow the investigation of the impact of visual information on speech.
However, it is doubtful if this kind of data is tremendously important to speech error analysis.
While some are careful to ask talkers about intended utterances when they are unclear (Harley,
1984; Meringer & Mayer, 1895; Vousden, Brown, & Harley, 2000), procedures that investigate
talker intuitions about the occurrence of an error have been found to be unnecessary (Dell, 1984).
Our practice in constructing SFUSED is to accept that we may not be able to pin down all of a
talker’s intentions, and simply assign a “low confidence” attribute when this indeterminacy is
found in an error. Only 2% of our errors require this attribute. As for visual input, many studies
recognize environmental errors, but they are rather rare in all the corpora we are familiar with.
Also, the studio environments where podcasts are produced lack rich visual stimuli, so the data
for SFUSED can be assumed to have a relatively controlled visual environment. These factors
are minor in comparison to the significant disadvantages mentioned above for online collection.

49
Perhaps the most pertinent question for new researchers is whether they will collect data
from natural speech or experiments. There is the obvious trade-off here between ecological
validity and experimental control that may be important to some; see e.g., Stemberger
(1982/1985). On the one hand, collecting speech errors from audio recordings is a major sacrifice
in terms of manipulating variables of interest, and so it is not a direct approach to investigating
some questions. This is particularly acute with research investigating specific linguistic
structures, because even large collections can come up short in the counts of some patterns. On
the other hand, experimentally elicited errors are not produced from natural speech, and there are
also clear limitations to experimentally elicited errors. For example, the theoretically interesting
question of the frequency of exchanges is not suitable for study via experiments because they
have an artificially high frequency in experimentally elicited datasets (Stemberger, 1992).
For these reasons, we believe that the adoption of a methodological approach should be
largely driven by the research questions. If the focus requires experimental measures that simply
cannot be collected from listening to audio recordings, e.g., articulatory measurements, then an
experimental setup is really the only option. Equally necessary is the selection of an appropriate
way of inducing errors (see section 2.3 on the various procedures employed in the past). If the
research focus involves phenomena that may be skewed by the experimental setup and
procedures, then naturalistic data collection is more suitable. Stemberger (1992) reports that the
following patterns may be skewed in experimentally elicited error data: incidence of exchanges
(and therefore error direction in general), lexical bias, non-native segments, impact of phoneme
frequency, and phonological error types (e.g., addition vs. substitution).
Of course, another major factor in this decision is the amount of time to collect the
necessary data. For most studies, experimentally induced errors will be faster and more efficient
than offline collection of naturalistic errors. However, the offline methodology does produce
large amounts of data with predictable timetables that compare with the time budget allotted to
learn an experimental methodology and carry out an experiment with it.

50
7.3 Implications for speech error research
Given the improvements in data quality and the striking differences between online and
offline datasets, a natural question to ask is if the distinct patterns uncovered in our investigation
will have an impact on our understanding of the structure of speech errors. Speech errors are
patterned, and psycholinguistic theory has a long history of developing models to account for
and explain these specific patterns. Our focus here has been on probing methodological
decisions, but there are some early indications that this approach has potential to create new
knowledge in language production research.
In order to study these impacts, it is important to understand some of the reasons for the
differences between the data we have collected and the data from other studies. One of the main
reasons is that offline data collection with multiple listeners provides much better sample
coverage. The frequency estimates from section 6.1 indicate that three listeners working with
audio recordings have an MPE of 1.28, i.e., an error was detected every minute and 17 seconds.
This contrasts sharply with the estimated MPE of 5.93 from Garnham et al.’s (1981) study.
Offline data collection does not always obtain an MPE this low, but the upper bound of 3.0 used
in practice is still nearly twice as low as Garnham et al.’s rate. These calculations give
plausibility to the findings in section 5.2 showing that the offline dataset has far fewer easy to
hear errors, like sound exchanges, and correspondingly, far more hard to hear errors.
The methodology laid out in section 3 also results in far fewer false positives than online
collection methods. Data collection in experiment 1 had a false positive rate of 24.74%, which
compares to the rate of 25.06% documented in Chen’s (1999) study (330 false positives from the
total of 1,317 examples). We do not know if online collections will have the same rate of false
positives, but it is hard to imagine it would be lower than these rates because listeners have no
recourse to the original speech sample. This strongly suggests that a large portion of the errors in
online collections are not truly errors and therefore may distort the actual error patterns reported
in these studies.

51
We cannot know the exact nature and composition of false positives in online datasets
because we cannot re-examine them without audio backup. However, our description of the 94
false positives found in experiment 1 (section 4.2) provides an empirical background for
assessing how these may affect online datasets. Approximately a third of the false positives
involve mistaking linguistic variants as errors, e.g., marginally grammatical phrases or sound
patterns deemed on closer inspection to be in the normal range for a given speaker. It is possible
that these false positives are randomly distributed across linguistic levels, and if this is true, they
will only add random noise to the larger patterns. However, if they are patterned, e.g., affect a
specific class of words or phonemes, they can lead to asymmetries. Another third of the false
positives are false starts and other changes of the speech plan, which seem a good candidate for
randomly distributed patterns. The final third of the false positives involve casual speech
phenomena in which a natural phonetic rule has been interpreted as an error, like [t] deletion in a
compound word like hot pot [hɑ pɑt]. We believe these have significant potential to skew speech
error patterns because English casual speech phenomena lead to substitutions and deletions that
are richly patterned (Shockey, 2003). Given their dominance in the false positives
(approximately 32%), we think they are a potential source of asymmetries in the online datasets
and therefore natural phonetic processes need to be carefully considered when assessing
phonological errors in these datasets.
Another related question is, given the differences in data composition, do these
differences have significant implications for formal models? One speech error pattern with clear
implications is the overall rate of exchanges, like torn korkilla (corn tortilla, sfusedE-1495).
Models differ in their predictions of the rate of exchanges. For example, the copy-scan model of
Shattuck-Hufnagel (1979) predicts that exchanges are the most common type of direction
because they involve one malfunction, i.e., mis-selection, as opposed to two malfunctions for
anticipations and perseverations, which involve both mis-selections and a failure of the so-called
check-off monitor. Since the probability of two malfunctions is far less than just one, exchanges
should be much more frequent (Shattuck-Hufnagel, 1979; Shattuck-Hufnagel & Klatt, 1979). It

52
is only by comparing our approach with the methodologies discussed above that we can make a
conclusion about this prediction. As shown in Table 29, online studies with large numbers of
non-experts have very high rates of sound exchanges, which indeed are the dominant type in Dell
and Reich (1981) and the contextual errors reported in Perez et al. (2007). This finding contrasts
sharply with the other two approaches, especially SFUSED English, which have much lower
rates of exchanges.
Table 29. Rate of exchanges, by methodology.
Rate 35-54% 5-7% 0.38% Methods Online, 100+ non-experts Online, 1-2 experts Offline, multiple experts Studies Dell & Reich 1981;
Perez et al. 2007 Nooteboom 1969; Stemberger 1982/1985
SFUSED English
This prediction can be hedged somewhat by merging exchanges in online datasets with so-called
incompletes (which are ambiguous between exchanges and anticipations), as suggested in
Shattuck-Hufnagel and Klatt (1979). Thus, the rate of potential exchanges can be raised
considerably by combining unambiguous exchanges at a rate of 5-7% in online datasets with
some fraction of incompletes (which Shattuck-Hufnagel and Klatt put at a rate of 33%). This
assumption allows one to maintain the claim that exchanges are the most common, or at least as
common as anticipations and perseverations. However, the revised rates given here simply do
not support such a conclusion. Sound exchanges are exceedingly rare, and even by including all
of our observed incompletes (from Table 17), they do not exceed the rate of anticipations.
Another context where attention to methodology has implications for theory is the rate of
phonotactic violations found in sound errors. Since at least Wells (1951), it has been remarked
that sound errors tend to respect the phonological rules of legal sound combinations. Stemberger
(1983) showed that this claim is true as a statistical tendency, but not as an absolute, because he
found that many sound errors do indeed violate English phonotactic rules, as in …in a first floor
dlorm—dorm room (p. 32). Dell et al. (1993) develop a simple recurrent network designed to
account for this high rate of phonological regularity, pinned at 99% of all sound errors based on

53
Stemberger’s findings. However, the best version of this network undershoots the 99% standard
considerably, casting some doubt on the viability of such a model for explaining phonological
regularity in English. Our findings in section 5.2 present a different view. They show that
phonotactic violations are much more prevalent in the data when using an offline methodology,
which lowers the bar of phonological regularity to about 96-97%. It turns out that this gives a
much better fit with Dell et al.’s modeling results, which predict phonological regularity under
specific model parameters to be at 96.5%. This goodness of fit is not of trivial importance,
because the impetus for Dell et al.’s model is specifically to ask if phonological regularity can be
accounted for with the frequency structure encoded in a connectionist network. Our findings
suggest that this is indeed the case, but this conclusion was not apparent from the online datasets
available at the time.
Psycholinguistic theory has also had much to say about consonant substitutions and the
role of markedness and frequency in speech production (see Goldrick (2011) for review), and
this is another area where we think new discoveries can be made. As demonstrated in section 5.2,
consonant confusion matrices in online and offline data differ substantially. Thus, consonant
confusions in the online datasets are clearly affected by perceptual biases for detecting voicing
and place changes (see Table 20 and Table 21) in ways that do not seem to affect the offline data.
Furthermore, certain segments, e.g., [s] and [tʃ], have asymmetrical distributions in online
substitutions (see Table 19 and weblinked spreadsheet) that resemble the same asymmetries
documented in other online datasets (Shattuck-Hufnagel & Klatt, 1979; Stemberger, 1991), but
these distributions are not asymmetrical in the offline data. Given the facts of sample coverage
and false positives discussed above, these differences are important. Offline data collection
method provides a more accurate sample of consonant substitutions, and thus allows one to re-
examine theoretical claims based on them. For example, substitutions involving coronals like [s]
and the palatal [tʃ] have been used to argue for a negative effect of frequency, that is, that low
frequency sounds replace high frequency sounds much more often than substitutions in the
opposite direction (Stemberger (1991), cf. Levitt and Healy (1985)). If, as suggested by our

54
offline data, this turns out not to be the case, this would undermine this theoretical claim. While
our focus here has been on documenting the empirical consequences of our methodological
decisions, we believe that these findings will lead to new theoretical conclusions about how
language production processes really work.
Acknowledgements We are grateful to Stefan Frisch, Alexei Kochetov, and Paul Tupper and for audiences at the
Vancouver Phonology Group (April 2016) and the Phonetics and Experimental Phonology Lab
at New York University (May 2015) for helpful comments and suggestions. We are also
indebted to Rebecca Cho, Gloria Fan, Holly Wilbee, Jennifer Williams, and two other research
assistants for their tireless work collecting speech errors. This work has been funded in part by a
standard SSHRC research grant awarded to the first author. Any errors or omissions that remain
are the sole responsibility of the authors.
References Baars, B. J., Motley, M. T., & MacKay, D. G. (1975). Output editing for lexical status from
artificially elicited slips of tongue. Journal of Verbal Learning and Verbal Behavior, 14, 382-391.
Bock, K. (1982). Toward a cognitive psychology of syntax: Information processing contributions to sentence formulation. Psychology Review, 89, 1-47.
Bock, K. (1996). Language production: Methods and methodologies. Psychonomic Bulletin and Review, 3, 395-421.
Bock, K. (2011). How much correction of syntactic errors are there, anyway? Language and Linguistic Compass, 5, 322-335.
Bond, Z. S. (1999). Slips of the ear: Errors in the perception of casual conversation. San Diego: Academic Press.
Boomer, D. S., & Laver, J. D. M. (1968). Slips of the tongue. International Journal of Language and Communication Disorders, 3, 2-12.
Chao, A. (2001). An overview of closed capture-recapture models. Journal of Agricultural, Biological, and Environmental Statistics, 6, 158-175.

55
Chen, J.-Y. (1999). The representation and processing of tone in Mandarin Chinese: Evidence from slips of the tongue. Applied Psycholinguistics, 20, 289-301.
Chen, J.-Y. (2000). Syllable errors from naturalistic slips of the tongue in Mandarin Chinese. Psychologia, 43, 15-26.
Cole, R. A. (1973). Listening for mispronunciations: A measure of what we hear during speech. Perception and Psychophysics, 1, 153-156.
Cole, R. A., Jakimik, J., & Cooper, W. E. (1978). Perceptibility of phonetic features in fluent speech. Journal of the Acoustical Society of America, 64, 45-56.
Cruttenden, A. (2014). Gimson's pronunciation of English (Eighth edition). London: Routledge. Cucchiarini, C., Strik, H., & Boves, L. (2002). Quantitative assessment of second language
learners' fluency: Comparisons between read and spontaneous speech. Journal of the Acoustical Society of America, 111, 2862-2873.
Cutler, A. (1982). The reliability of speech error data. In A. Cutler (Ed.), Slips of the tongue and language production (pp. 7-28). Berlin: Mouton.
Cutler, A. (1988). The perfect speech error. In L. M. Hyman & C. N. Li (Eds.), Language, speech, and mind: Studies in honour of Victoria A. Fromkin (pp. 209-233). London: Routledge.
de Jong, N. H., & Wempe, T. (2009). Praat script to detect syllable nuclei and measure speech rate automatically. Behavior Research Methods, 41, 385-390.
Dell, G. S. (1984). Representation of serial order in speech: Evidence from the repeated phoneme effect in speech errors. Journal of Experimental Psychology: Learning, Memory and Cognition, 10, 222-233.
Dell, G. S. (1985). Positive feedback in hierarchical connectionist models. Cognitive Science, 9, 3-23.
Dell, G. S. (1986). A spreading-activation theory of retrieval in sentence production. Psychological Review, 93, 283-321.
Dell, G. S. (1995). Speaking and misspeaking. In L. R. Gleitman & M. Liberman (Eds.), An invitation to cognitive science, Language, Volume 1 (pp. 183-208). Cambridge, MA: The MIT Press.
Dell, G. S., Juliano, C., & Govindjee, A. (1993). Structure and content in language production: A theory of frame constraints in phonological speech errors. Cognitive Science, 17, 149-195.
Dell, G. S., & Reich, P. A. (1981). Stages in sentence production: An analysis of speech error data. Journal of Verbal Learning and Verbal Behavior, 20, 611-629.
Dewey, G. (1923). Relative frequency of English speech sounds. Cambridge, MA: Harvard University Press.
Ernestus, M., & Warner, N. (2011). An introduction to reduced pronunciation variants. Journal of Phonetics, 39, 253-260.
Ferber, R. (1991). Slip of the tongue or slip of the ear? On the perception and transcription of naturalistic slips of tongue. Journal of psycholinguistic research, 20, 105-122.
Ferber, R. (1995). Reliability and validity of slip-of-the-tongue corpora: A methodological note. Linguistics, 33, 1169-1190.
Ferreira, F., & Swets, B. (2005). The production and comprehension of resumptive pronouns in relative clause "Island" contexts. In A. Cutler (Ed.), Twenty-first century psycholinguistics: Four cornerstones (pp. 263-278). Mahwah, NJ: Erlbaum.

56
Fowler, C. A., & Magnuson, J. S. (2012). Speech perception. In M. J. Spivey, K. McRae, & M. F. Joanisse (Eds.), The Cambridge handbook of psycholinguistics (pp. 3-25). Cambridge: Cambridge University Press.
Frisch, S. A. (2007). Walking the tightrope between cognition and articulation: The state of the art in the phonetics of speech errors. In C. T. Schutze & V. S. Ferreira (Eds.), The State of the Art in Speech Error Research, MIT Working Papers in Linguistics, Vol. 53 (pp. 155-171). Cambridge, MA: The MIT Press.
Frisch, S. A., & Wright, R. (2002). The phonetics of phonological speech errors: An acoustic analysis of slips of the tongue. Journal of Phonetics, 30, 139-162.
García-Albea, J. E., del Viso, S., & Igoa, J. M. (1989). Movement errors and levels of processing in sentence production. Journal of psycholinguistic research, 18, 145-161.
Garnes, S., & Bond, Z. S. (1975). Slips of the ear: Errors in perception of casual speech Proceedings of the 11th regional meeting of the Chicago Linguistics Society (pp. 214-225).
Garnham, A., Shillcock, R. C., Brown, G. D., Mill, A. I., & Cutler, A. (1981). Slips of the tongue in the London-Lund corpus of spontaneous conversation. Linguistics, 19, 805-818.
Garrett, M. (1975). The analysis of sentence production. In G. H. Bower (Ed.), The psychology of learning and motivation, Advances in research and theory, Volume 9 (pp. 131-177). New York: Academic Press.
Garrett, M. (1976). Syntactic processes in sentence production. In R. J. Wales & E. C. T. Walker (Eds.), New approaches to language mechanisms (pp. 231-255). Amsterdam: North-Halland.
Giegerich, H. J. (1992). English phonology: An introduction. Cambridge: Cambridge University Press.
Goldrick, M. (2011). Linking speech errors and generative phonological theory. Language and Linguistics Compass, 5(6), 397-412.
Goldrick, M., & Blumstein, S. (2006). Cascading activation from phonological planning to articulatory processes: Evidence from tongue twisters. Language and Cognitive Processes, 21, 649-683.
Goldrick, M., & Chu, K. (2014). Gradient co-activation and speech error articulation: Comment on Pouplier and Goldstein (2010). Language, Cognition and Neuroscience, 29, 452-458.
Goldstein, L., Pouplier, M., Chena, L., Saltzman, E. L., & Byrd, D. (2007). Dynamic action units slip in speech production errors. Cognition, 103, 386-412.
Harley, T. A. (1984). A critique of top-down independent level models of speech production: Evidence from non-plan-internal speech errors. Cognitive Science, 8, 191-219.
Kormos, J., & Dénes, M. (2004). Exploring measures and perceptions of fluency in the speech of second language learners. System(32), 145-164.
Ladefoged, P. (2006). A course in phonetics. Boston: Thomson. Levelt, W. J. M., Roelofs, A., & Meyer, A., S. (1999). A theory of lexical access in speech
production. Behavorial and Brain Sciences, 22, 1-75. Levitt, A., & Healy, A. (1985). The roles of phoneme frequency, similarity, and availability in
the experimental elicitation of speech errors. Journal of Memory and Language, 24, 717-733.
MacDonald, M. C. (2016). Speak, act, remember: The language-production basis of serial order and maintenance in verbal memory. Current Directions in Psychological Science, 25, 47-53.
57
MacKay, D. G. (1970). Spoonerisms: The structure of errors in the serial order of speech. Neuropsychologia, 8, 323-350.
MacKay, D. G. (1971). Stress pre-entry in motor systems. American Journal of Psychology, 84, 35-51.
Maclay, H., & Osgood, C. E. (1959). Hesitation phenomena in spontaneous English speech. Word, 15, 19-44.
Mann, V. A. (1980). Influence of preceding liquid on stop-consonant perception. Perception and Psychophysics, 28, 407-412.
Mao, C. X., Huang, R., & Zhang, S. (2017). Petersen estimator, Chapman adjustment, list effects, and heterogeneity. Biometrics, 73, 167-173.
Marin, S., & Pouplier, M. (2016). Spontaneously occurring speech errors in German: BAS corpora analysis. In A. Gilles, V. B. Mititelu, D. Tufis, & I. Vasilescu (Eds.), Errors by humans and machines in multimedia, multimodal and multilingual data processing (pp. 75-90). Bucharest: Romanian Academy Press.
Marin, S., Pouplier, M., & Harrington, J. (2010). Acoustic consequences of articulatory variability during productions of /t/ and /k/ and its implications for speech error research. The Journal of the Acoustical Society of America, 127(1), 445-461.
Marslen-Wilson, W., & Welsh, A. (1978). Processing interactions and lexical access during word recognition in continuous speech. Cognitive Psychology, 10, 29-63.
Meringer, R., & Mayer, K. (1895). Versprechen und Verlesen. Stuttgart: Gbschensche Verlagsbuchhandlung.
Miller, G. A., & Nicely, P. (1955). An analysis of perceptual confusions among some English consonants. Journal of the Acoustical Society of America, 27, 338-352.
Motley, M. T., & Baars, B. J. (1975). Encoding sensitivities to phonological markedness and transitional probability: Evidence from spoonerisms. Human Communication Research, 1, 353-361.
Mowrey, R., & MacKay, I. R. A. (1990). Phonological primitives: Electromyographic speech error evidence. Journal of the Acoustical Society of America, 88, 1299-1312.
Nooteboom, S. G. (1969). The tongue slips into patterns. In A. J. van Essen & A. A. van Raad (Eds.), Leyden studies in linguistics and phonetics (pp. 114-132). The Hague: Mouton.
Pérez, E., Santiago, J., Palma, A., & O'Seaghdha, P. G. (2007). Perceptual bias in speech error data collection: Insights from Spanich speech errors. Journal of psycholinguistic research, 36, 207-235.
Pouplier, M., & Goldstein, L. (2005). Asymmetries in the perception of speech production errors. Journal of Phonetics, 33, 47-75.
Pouplier, M., & Hardcastle, W. (2005). A re-evaluation of the nature of speech errors in normal and disordered speech. Phonetica, 62, 227-243.
Shattuck-Hufnagel, S. (1979). Speech errors as evidence for a serial-ordering mechanism in sentence production. In W. E. Copper & E. C. T. Walker (Eds.), Sentence processing: Psycholinguistic studies presented to Merrill Garrett (pp. 295-342). Hillsdale, NJ: Erlbaum.
Shattuck-Hufnagel, S. (1983). Sublexical units and suprasegmental structure in speech production planning. In P. F. MacNeilage (Ed.), The production of speech (pp. 109-136). New York: Springer Verlag.
Shattuck-Hufnagel, S. (1992). The role of word structure in segmental serial ordering. Cognition, 42, 213-259.

58
Shattuck-Hufnagel, S., & Klatt, D. H. (1979). The limited use of distinctive features and markedness in speech production: Evidence from speech error data. Journal of Verbal Learning and Verbal Behavior, 18, 41-55.
Shockey, L. (2003). Sound patterns of spoken English. Malden, MA: Blackwell Publishing. Slis, A., & Van Lieshout, P. H. H. M. (2016). The effect of phonetic context on the dynamics of
intrusions and reductions. Journal of Phonetics, 57, 1-20. Stearns, A. M. (2006). Production and Perception of Articulation Errors. (MA thesis),
University of South Florida. Stemberger, J. P. (1982/1985). The lexicon in a model of language production. New York:
Garland. Stemberger, J. P. (1983). Speech errors and theoretical phonology: A review. Bloomington:
Indiana University Linguistics Club. Stemberger, J. P. (1991). Apparent antifrequency effects in language production: The addition
bias and phonological underspecification. Journal of Memory and Language, 30, 161-185.
Stemberger, J. P. (1992). The reliability and replicability of naturalistic speech error data. In B. J. Baars (Ed.), Experimental slips and human error: Exploring the architecture of volition (pp. 195-215). New York: Plenum Press.
Stemberger, J. P. (1993). Spontaneous and evoked slips of the tongue. In G. Blanken, J. Dittmann, H. Grimm, J. C. Marshall, & C.-W. Wallesch (Eds.), Linguistic disorders and pathologies. An international handbook (pp. 53-65). Berlin: Walter de Gruyter.
Stemberger, J. P. (2009). Preventing perseveration in language production. Language and Cognitive Processes, 24, 1431-1470.
Stoel-Gammon, C. (2001). Transcribing the speech of young children. Topics in Language Disorders, 21, 12-21.
Tent, J., & Clark, J. E. (1980). An experimental investigation into the perception of slips of the tongue. Journal of Phonetics, 8, 317-325.
Vitevitch, M. S. (2002). Naturalistic and experimental analyses of word frequency and neighborhood density effects in slips of ear. Language and Speech, 45, 407-434.
Vitevitch, M. S., Siew, C. S. Q., Castro, N., Goldstein, R., Gharst, J. A., Kumar, J. J., & Boos, E. B. (2015). Speech error and tip of the tongue diary for mobile devices. Frontiers in Psychology, 13, Article 1190.
Vousden, J. I., Brown, G. D. A., & Harley, T. A. (2000). Serial control of phonology in speech production: A hierarchical model. Cognitive Psychology, 41, 101-175.
Wells, R. (1951). Predicting slips of the tongue. Yale Scientific Magazine, 3, 9-30. Wickelgren, W. A. (1969). Context-sensitive coding, associative memory, and serial order in
(speech) behavior. Psychological Review, 76, 1-15. Wilshire, C. E. (1998). Serial order in phonological encoding: An exploration of the "word onset
effect" using laboratory-induced errors. Cognition, 68, 143-166. Wilshire, C. E. (1999). The "tongue twister" paradigm as a technique for studying phonological
encoding. Language and Speech, 42, 57-82.