Embed Size (px)
Citation preview

Investigating Travel Behavior of Blind and Vision Impaired People: The Role of Public Transit
by
James R. Marston*
Reginald G. Golledge*
and
C. Michael Costanzo**
*Department of Geography
and
Research Unit in Spatial Cognition and Choice
University of California at Santa Barbara
Santa Barbara, California 93106
**Costanzo Associated Consultants
P.O. Box 60808
Goleta, California 93160
Acknowledgment: The material in this paper was collected as part of a grant funded by
The University of California Richmond Field Station and CalTrans PATH Grant
#MOU167.

Our purpose is to explore the travel behavior of blind or vision-impaired people, focusing
in particular on travel by bus. We differentiate the sample depending on the availability
of a household car. We examine perceptions of and attitudes toward existing transit and
various transit characteristics, highlighting features that seem to be frustrating or
difficult. Finally, we have travelers evaluate the potential usefulness of various assistive
devices, including electronic information that gives navigational assistance. Key Words:
blind or vision impaired, public transit, user survey, electronic aids, nondriving.
The findings of a 1986 a Harris poll of disabled people bolstered support for legislation
to better this disadvantaged group. The Americans With Disability Act of 1990 (ADA)
was designed to help improve quality of life for disabled people. Part of that
improvement has been an increased potential for mobility as public transit and its many
complements (such as EZ-Lift vans; van pools; institutional van and vehicle services; and
route-free vehicles with door-to-door pick up and delivery) have been made more user
friendly for disabled people. A Harris poll in 1994, updating the earlier poll, found
remarkable changes. The new poll indicated that school dropouts among disabled people
decreased from 40 % to 25 %; the %age of respondents with some college increased from
29 % to 44 %; 75 % said that access to public facilities has improved; 63 % saw an
improved attitude towards disabled people; and 60 % said that access to public transit
was better. However, continued problems with transportation still ranked in the top three
of all problems faced by those with a disability.
ADA established the rights of disabled people to have equal access and equal opportunity
to use public facilities, including transportation systems. Since that time a considerable
effort has been expended to ensure these rights. Much of the effort has been directed
towards assisting the disabled group with the most obvious disability—those who lack
personal mobility and are wheelchair bound. Retrofitting of trains, buses, mini-vans, and

limousines has enlarged the travel horizons of many who are wheelchair bound.
However, this group only represents about two % of all disabled people. Little attention
has been paid to the needs of other disabled groups, including those who are blind or
visually impaired and thus very constrained in terms of mobility. To highlight these
constraints, we examine travel behavior of a selection of blind and vision impaired
people, discuss the modes of transportation which they elect to use or are forced to use,
and briefly discuss some attitudes towards public transit.
Who Are The Disabled?
1990 Census figures show that nationwide there are over 50 million disabled people in
the United States. Of these, over three million report severe vision impairment or are
legally blind. Another three to four million are visually impaired to the degree that they
cannot drive and/or have difficulty reading signs or printed matter.
Census reports also indicate that the elderly make up a disproportionate share of the
disabled population, that those with a functional disability tend to have achieved lower
education levels, and that severe disability significantly reduces employment chances and
income potential. Early census figures also show that nationwide less than 23 % of
disabled people who are of working age are employed in the labor force. Many believe
this dismal statistic is, at least in part, the result of the difficulties non-drivers have in
gaining access to places of employment. Approximately 4.6 million people over the age
of 65 report a mobility limitation. Many of these people are denied their independence
and freedom of movement, a privilege most Americans take for granted. A post census
study, Americans with Disabilities 1991-1992, showed that for people with vision
deficits aged 21 to 64, only 45.6 % of those who had difficulty reading newsprint are
employed, and of those unable to read newsprint, only 25.6 % are employed. These
numbers do not include those who are underemployed. It is obvious that disability is a

substantial nationwide problem. The population on which we focus, those who are
severely vision impaired or blind, is around 5 million people, (about 10 % of all people
with disabilities in the United States).
The process of vision is complex and there are many problems that can affect sight.
Therefore, there are many degrees of vision loss that complicate accurate estimates of
this population. Congenital blindness means blind since birth, and adventitiously
blindness occurs later in life. Some people see no light or shape and are totally blind;
there are about 120,000 totally blind people in the United States. The rest are vision
impaired to some degree. Of these, about 1 million are legally blind. Legal blindness is
defined as 20/200 vision or worse in the best eye after correction (i.e., an individual with
a vision problem can, using a corrective device such as glasses, see at 20 feet what those
with clear vision can see at 200 feet). Legal blindness is also defined as a peripheral field
restricted to a diameter of 20 degrees or less. Of the 54 subjects in our survey, 50 were
considered legally blind and four were considered vision impaired, i.e., they have
difficulty seeing letters or words in ordinary newsprint.
Apart from the problem of communicating by reading and writing, the most significant
handicap produced by loss of vision is restricted independent travel (Golledge, 1994).
People who cannot drive a car, safely cross a street, or read street or transit information
experience a different geography than do the sighted. Therefore, we investigated travel
activities of this population to see how their vision loss has affected their mobility and
quality of life. This type of study can help our understanding of the relationship between
people’s behavior and the urban environment, and also clarify how behavior shifts with
changes in the environment (Hanson and Hanson, 1993).

Activity and Travel Behavior
An activity-based approach is needed to assess the interaction between information and
travel behavior, and to examine decision and policy making required to meet the
mandates of the ADA. Of special interest in this paper are constraints on activities
encountered by the vision impaired. Unlike an aggregate approach, the activity approach
treats each individual separately and tries to identify the limits on choices available to
that person.
The activity approach studies travel behavior and the trip as a result of a multitude of
decisions. These decisions are constrained in three areas: capacity constraints are limits
on physical abilities or the tools (like a car) available; coupling constraints are produced
by having to be at certain activities at specific times or by meeting with other people at
arranged times; and authority constraints describe the temporal and spatial authority one
has over a place, like a home or the times at which a bank is open for business.
The activity approach treats the trip as a derived demand and focuses on activities that
lead to trips. Travel behavior is influenced by accessible locations where activities can
take place and the cost and availability of transportation. Activity patterns are also
influenced by household structure through both interactions and constraints involving
household members. These interactions change over time, so constraints and interactions
are different at various household stages. Households and individuals adapt to new
situations, and activities and travel behavior are not static but involve changes in attitude,
preference, perception, and behavior. Previous work on human activity patterns has
shown that the socioeconomic makeup of the household and socio-demographic and
work characteristics affect travel activity (Damm and Lerman, 1981; Kitamura, 1988).
Finally, activity and travel behavior are constrained by the experience and knowledge of
the individual (Jones, Dix, Clarke and Heggie, 1983).

Travel behavior is thus constrained by the activities of others, the structure and
accessibility of the physical environment and potential locations, and activity and
locational opportunities in both time and space.
To evaluate why people make travel choices, a utility measure is used. Utility is gained
through the performance of an activity, and it is assumed that an individual will try to
maximize the utility gained from the various activities he/she wishes (or needs to
perform). Winston (1987) and others describe two types of utility, one which is gained by
the pleasure of performing the activity and one from the goal or results of that activity.
This difference is important to understanding the travel behavior of the disabled. Our
mass media, advertisements, and indeed “car culture” have stressed the pleasure to be
derived from making trips by car and the pleasant experiences to be found at the
destination. Thus, lacking access to a car means that, for many disabled people, the trip
can be long and arduous, full of fear and uncertainty. Many destinations can be confusing
and stressful to people with limited physical capabilities. For example, grocery and
clothes shopping can be quite time consuming and physically taxing to many people with
disabilities. They achieve little or no utility from performing the activity, and some
would rate their utility as negative and try to avoid the activity. For many people, then,
the only utility is in having performed the activity in order to gain the required goal.
According to Axhausen (1990), “the time-space regime covering both life-cycle and life-
style decisions have been the focus of a large amount of work by researchers in the
tradition of the Activity Approach”. Jones et. al (1983) were able to show the strong
influence of the household life-cycle status on travel behavior. The role of the household
in shaping the daily life of its members is well documented. However, the disabled are
much more likely to be at or below the poverty level, to have less education, and to live

alone or without a spouse than the population as a whole (U.S. Bureau of Census, 1990).
These factors contribute to many of the constraints on their activity choices and travel.
Life-style choices have a great effect on travel behavior. Especially important are driver’s
license acquisition, car acquisition, and home and work location. Although it can be
implied, we also must look at the effect of losing a driver’s license and the effect of non-
driving. Housing location choices are also quite restricted for the disabled. A study by
Corn and Sacks (1994) of 110 active but blind non-drivers researched found “choice of
location for housing” as the most frustrating item. A study by Golledge, Costanzo &
Marston (1995) on attitudes and frustration of blind and vision impaired subjects
confirmed this frustration with residential location choice. Both papers also reported
frustration with coupling constraints such as having to ask for and wait for rides and
having to rely on others for transportation. The most mentioned constraint, however, was
the lack of easy access to information about the route and schedule information.
An activity-based approach is thus a good way to examine travel behavior and access by
disabled groups, with an emphasis on the increased constraints shared by these
populations. The inability to drive constrains the mode choice, household makeup
constrains activity opportunities, and relying on others adds excessive coupling
constraints. Relatively little is known about the travel behavior of the blind or vision
impaired group and about their mode choice and mobility patterns, in large part because
few data are available on either of these matters. Therefore, this study relies on a special
survey of blind and vision impaired people.
The Survey
The survey sought information on: daily activity, including trip purposes, transportation
modes, frequency of public transit use, waiting times for transit rides, types of assistance

usually required when traveling, location of home with respect to nearest transit stops,
and personal and household characteristics such as age, educational background, sex, and
details of onset of blindness or vision impairment; and attitudes and perceived problems
of transit use, frustration levels both with respect to one’s personal disability and to the
transit system, types of technical assistance used or desired, and suggestions for those
characteristics that should be embedded in an ideal transit system for blind or vision-
impaired people. The results of the first part of the survey relating to travel behavior are
given below. The much longer attitudinal questions are being analyzed in a separate
paper (Golledge, et al., forthcoming).
Conducting a survey of disabled people poses problems not encountered in other surveys.
It is hard to get an accurate count of disabled people in an area because many are
“hidden” from view and there is no central place to get population estimates on which to
base a sample. Some disabled live in institutions or other group housing which make
many types of survey techniques unusable. We used various sources to estimate the
number and percentage of blind and visually impaired in our area. The Braille Institute
(personal communication, 1994) estimated that 0.7 % of the general public have severe
vision loss. The best estimate that we could find for use of public transit by disabled
people indicated that approximately 45 % of them used public transit (Kirschner, et al.
1992), and Corn and Sacks (1994) report that 49 % of employed blind or vision impaired
persons used mass transit for work trips. In our study area, the City of Santa Barbara and
vicinity, there were 9,589 disabled people, of whom 4,672 were unemployed. Of these
disabled people, there would be approximately 900 blind or vision impaired people if
Santa Barbara had a prorated share (based on national percentages) of the country’s blind
and vision impaired population. Adopting an assumption that only half of the disabled
people use transit, and considering the 0.7 % occurrence figure provided by the Braille
Institute, we estimated we would have to make 14,000 random digit dialing (RDD) calls

to get a sample of only 50 blind or vision impaired public transit users. Since this
approach was not feasible, we used four agencies as the sources of potential blind or
vision impaired transit users: the Santa Barbara Braille Institute, the University of
California Santa Barbara Disabled Students Program, the State Department of
Rehabilitation, and the Santa Barbara Metropolitan Transit District.
Survey Design and Procedures
Requests to participate in our survey were forwarded to a sample of the clients of
cooperating institutions by representatives attached to each of these sources. Our
response rate was surprisingly high. Even though possible participants were told the
survey took about an hour, the response rates for two of the agencies we used were about
50 %. Our final responding population totaled 54. Two of the agencies told us how many
request forms were sent out, but the other two agencies only had an estimate of the
number distributed because different people sent requests out on different days. Our
estimate was that, overall, about 120 people received the request to participate. The
relatively high response rate (47%) indicates a strong interest regarding the use of public
transit by our chosen group.
Even after targeting a sample, there are problems involved in making the survey available
in suitable form. In an attempt to reach the greatest number of people possible, we
offered a survey by mail (large print), telephone interview, in-home interview, or Braille.
No one chose the Braille option, but 33 % elected a telephone interview, 53 % a large
print mailed survey, and 15 % an in-home interview.
The procedure consisted of multiple mailings or multiple calls. During the initial contact,
we merely established whether or not the individual used public transit, and whether or
not they were willing to participate in the survey. We indicated that the survey would

take about an hour and that participants would be paid for completing the survey. If the
individual indicated a willingness to do so, then either a large print survey was mailed to
them or an appropriate time for a telephone or in-home interview was established. Along
with the survey, participants received a stamped, addressed envelope for mailing material
back. Surveys were coded so that we could keep track of the number of people who
completed each different type of survey and which agency contacted them. Once a survey
had been returned, another letter consisting of a receipt and a check was sent to the
individual. A stamped, addressed envelope was again included for the return of the
signed receipt. Only one person did not return a signed receipt.
Results
Frequency of Transit Use
Nationwide, about 5 or 6 % of able-bodied individuals use public transit. Recent surveys
have shown that nearly half, about 45 %, of disabled travelers use transit (Kirschner, et
al., 1992).. Fifty-one percent of our respondents listed a local bus as their primary mode
of travel.
Transit use can be constrained by many factors. Lack of information about the system is
often cited, and in some areas fears for personal safety can constrain travel. In our area,
buses quit running on most lines early in the evening and there were reduced hours and
coverage on the weekends. The main constraint appeared to be the distance that people
lived from a bus stop, as well as whether or not their destination was located near a bus
stop.
Approximately 28 % of our total sample used public transit five to seven days a week and
another 32 % used it two to four days per week, but almost 21 % used transit less than
every two weeks. Our sample proved to be bi-modal in its responses: those who had

access to a household car had one type of response and those who did not had a different
type of response. Of the 54 total respondents, ten had access to a household car and
showed a preference for the private automobile over all other transportation modes. None
of this group used transit five to seven times a week and only 11 % used it two to four
times a week. Sixty-seven percent used transit less than once every two weeks, and 22 %
used it about every two weeks. Thus, when a household car was available, 89 % used
transit approximately only once every two weeks (or less often) (Figure 1).
Figure 1: Frequency of transit use (household car versus no household car).
5 -7 D a y s /
W k
5 0
4 0
3 0
2 0
1 0
2 -4 D a y s /
W k
W e e k ly A b o u t e v e ry o th e r w e e k
L o n g e r th a n
2 w e e k in te rv a l
N o h o u s e h o ld c a r
D a y s U s e d
H o u s e h o ld c a r a v a ila b le
6 0
7 0

For those who had no access to a car, 36 % used transit five to seven days a week and
another 38 % used it two to four days a week. In other words, almost 75 % used it on a
regular basis. Only 14 % used it once every two weeks (or less often) compared to the 89
% for those with an available car. Of the 43 respondents with no household car available,
two-thirds listed “local bus” as their primary mode and another 7 listed walking as their
primary mode. Two people used friends’ cars and the rest used agency vans or paratransit
vehicles.
Residential Location
To determine the degree of mobility of our group, we used the same sets of activities that
are usually described in other travel studies (Kitamura, 1988; Axhausen, 1990). The
ranges of activity patterns were found to be little different from those of many able-
bodied people, but some distinct differences included the fact that Sunday travel was
significantly restricted for our survey group, as was late night travel; a significant
proportion of those traveling needed assistance; and more than 66 % of those with no
household car lived two or fewer blocks from a transit (bus) stop. For those with access
to a household car the average distance they lived from a bus stop was five blocks. We
found that our blind and vision impaired population lived closer to shopping and other
needs than is normally the case in our study area and many were thus able to walk to the
places at which they participated in different activities. In fact, more people walked than
took the bus for grocery shopping and attending religious services, while mode choices
for other activities, except work, school, and medical, were virtually split between bus
and walking. This implies a strong relationship between residential location and activity
location. Using a 5 point Lickert scale (1 = strongly agree and 5 = strongly disagree), we
asked if non-driving limited their freedom to choose a residence. Of those who reported
“bus” as their primary mode of travel the combined score was 2.2 (3 = neutral). For
those who reported a car as their primary travel mode, the mean scale score was 2.7. It

appears that those without access to a car felt the constraints of non-driving more than the
others. This trend was repeated when we asked about their desire for certain services. It
appears then that those without a car realize the importance of residential location for
their freedom, while those with car transportation at hand are not as aware and look for
other solutions to their problems of access. Many areas of Santa Barbara are not well
served by transit, and we infer that the disabled, especially those without access to
household cars, carefully consider and weigh their activity needs when choosing possible
residential locations.
Travel and Wait Times for Transit and Car Users
Recker, et al. (1986), in their computational model STARCHILD, considered utility to be
made up of three components: participating in the activity, wait time, and travel time. In
their model, utility decreased as wait and travel time increased.
Long travel times limit accessibility and constrain activity choice. Having to request a
ride from friends or family, and waiting for that ride, also constrains many travel
activities. Travel times for various purposes reported by those with access to a household
car were almost always less than for the non-car group. Sometimes non-car users
reported twice as much time for identical trip purposes (Figure 2). However, it appears
that many non-car users walked to certain types of activities (e.g., shopping, religious
activity, friends’ houses), which explains some of these higher trip times. As noted
above, seven people walked as their primary mode of travel.

Figure 2: Travel times from home to various destinations.
Work
50
40
30
20
10
Recreation Medical Financial/Legal
OtherRecreational
Shopping
No household car Household car available
Visit Family/Friends
GroceryShopping
Agency Services
Religion
Long waiting times have frequently been used to explain low use of transit. The
advantage of an available household car is clearly shown from our results that compare
the preparation and waiting time involved when using transit as opposed to preparation
and waiting times when not using transit to make a trip. Fifty percent of our sample with
access to a household car said it took less than five minutes to get a ride in the car, while
66 % said it took over thirty minutes to get a ride using transit. However, when the non-
car users were surveyed, they actually reported less time in arranging and waiting for
transit than for getting a ride in a car! Non-car users would occasionally obtain rides from
friends, relatives, or close family that did not live within their household. Using this
source of vehicle travel, preparation and waiting times were usually considerably longer
than that involved in waiting for a transit vehicle. Only 33 % of this non-car user sample
waited more than thirty minutes for transit, while 37 % waited that long for a non-transit
(car or E-Z Lift van) trip. Overall, though, those who had no access to a household car
had an average wait time that was less for transit than for non-transit rides. When there

was no convenient access to a car, it appears that transit competes well with the
automobile as a timely and effective mode of movement in our study area.
The waiting times for travelers with no available household car were less than for those
who had a household car (Figure 3a, b). Twelve percent of the no-car group waited and
walked less than five minutes for transit and another 26 % reported times less than fifteen
minutes. Sixty-five percent of those with no household car waited less than thirty minutes
compared to only 33 % of those with a household car. Sixty-six % of those with access to
a household car said that their arrangement and waiting times for transit were more than
thirty minutes. With respect to median wait times, those with no household car available
waited fifteen minutes for transit, while the median for those with a car lies between
thirty and sixty minutes. These differences are probably due to better information about
and familiarity with the transit schedule and also to their proximity to transit stops.
However, as expected, the preparation and wait times for non-transit rides shows the
advantage of having a household car available. Wait time was less than five minutes for
half of those who had such access.
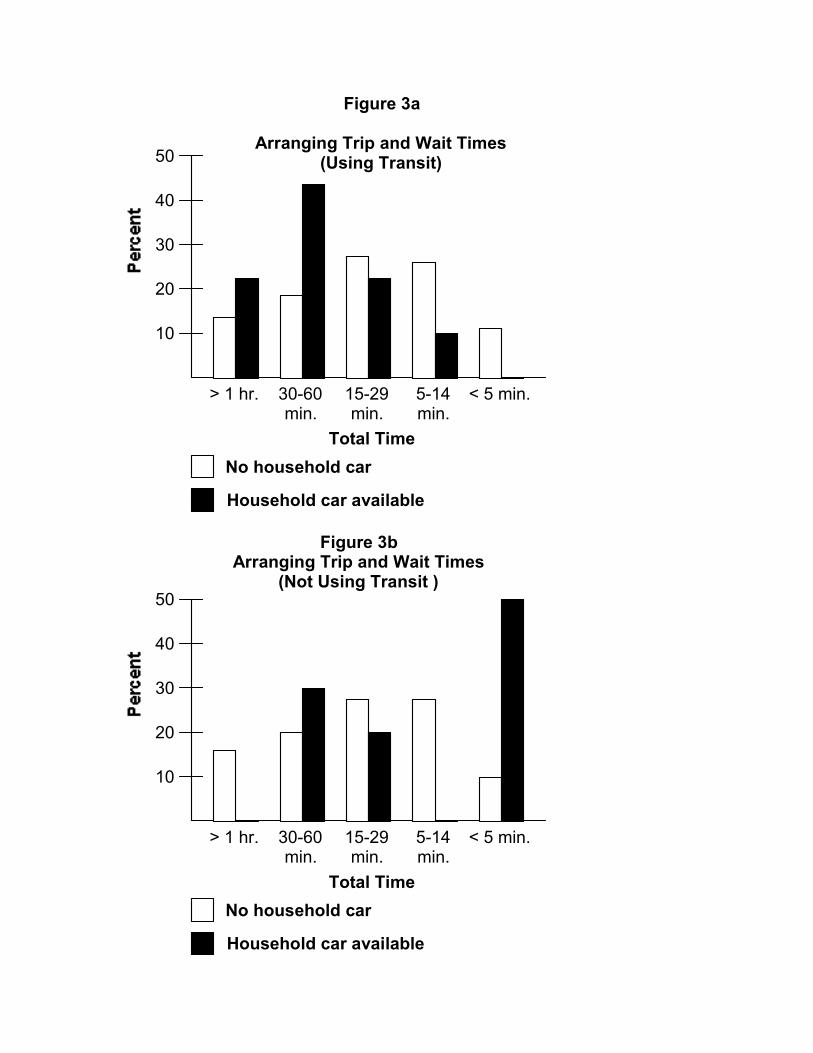
Figure 3b Arranging Trip and Wait Times
(Not Using Transit )
> 1 hr.
50
40
30
20
10
30-60 min.
15-29 min.
5-14 min.
< 5 min.
No household car
Total Time
Household car available
Figure 3a
Arranging Trip and Wait Times (Using Transit)
> 1 hr.
50
40
30
20
10
30-60 min.
15-29 min.
5-14 min.
< 5 min.
No household car
Total Time
Household car available

Reasons for Using Transit
All those completing our survey were asked to mark three reasons for their use of transit.
Of the 51 people completing this part of the survey 26 checked “service meets my
needs,” 22 marked “no alternative,” 21 cited “cost,” and 15 indicated “driver/operator
courtesy and assistance.” At least in our study area, then, the combination of household
locational choice, transit network proximity and frequency of service adequately meets
the needs of those we surveyed (Table 1).
Table 1: Why Do You Use Public Transit? (Pick Three) (Reasons Ordered by
Percentage Scores)
Non-car Users Car Users 52% Service meets my needs 57% Service meets my needs 45% No alternative 57% Cost 38% Cost 43% Coverage of service area 31% Driver/operator courtesy 29% Time of day of service 14% Ease of getting to pick up/drop off point 29% No alternative 12% On-time service 29% Ease of arranging trips 12% Ease of arranging trips 14% Driver/operator courtesy 12% Coverage of service area 12% Time of day service is available 10% Safety 10% Other 5% Security 2% Comfort
For example, when asked to rank their agreement with the statement that the “local
public transit system meets my needs,” those without a household car tended to agree,

with a scale score of 2.5 on a 5-point scale ranging from 1 = strongly agree to 5 =
strongly disagree. It is also significant that for others of our sample, no alternative to
public transit was available. This seems to be particularly true for those disabled people
who live alone. Thus, a certain part of our sample can be represented as a captured
population whose only alternative for travel outside of the immediate neighborhood
where walking was possible was to find and take a bus. Cost came up as a significant
factor because most blind or vision impaired riders of public transit in the Santa Barbara
area can obtain an identification card and ride free. For many individuals the alternative
of free travel, however inconvenient or disliked, is much preferable to paid travel. And,
finally, it is a tribute to the local Metropolitan Transit district that its driver/operator
responsibility and courtesy programs appear to be well implemented and acknowledged
at least by blind or vision-impaired travelers. We asked 12 questions about what they
thought was useful when using public transit (1 = extremely useful, 5 = not at all useful).
Assistance from transit system operators had the highest scale score of 2.0. Helpful
drivers were rated as being very useful in terms of providing information needed to
successfully undertake a bus trip.
Frustrating Situations
Our final set of questions were designed to discover degrees of frustration that
respondents felt with different social and other travel situations tied to public transit use.
Independence was highly prized among all respondents. Table 2 lists the top six causes of
frustrations in rank order. The two least frustrating items, tied for last place, are major
problems for those in wheelchairs, indicating the vast difference between the travel needs
of these two groups (Table 2).

Table 2: Most Frustrating Situation while Using Public Transit (Rank Ordered)
Rank
1 Poor clarity of voice announcements in terminals
2 Requesting rides from others after missing a transit connection
3 Exiting transit at the wrong place
5 Needing to rely on others to provide rides
5 Being unable to exit vehicles because of overcrowding
5 Cannot find a bus stop or door
*
17.5 Needing to carry special equipment
17.5 Negotiating narrow steps or doors
* Reasons from 7 – 16 are not reproduced here.
When enroute, blind and vision-impaired individuals are faced with several difficult
situations (Table 3). First and foremost, lack of vision means no access to landmarks or
other visual cues that prompt an individual to recognize an upcoming needed exit point.
Blind and vision-impaired individuals also have significant difficulty recognizing which
vehicle to enter because in most cases neither the written destination nor the route
number is written sufficiently large enough to see for those with vision deficit. Of course,
those with no vision have no access to this single source of relevant information. In the
same way, lack of vision prevents one from estimating where one is along a route. The
blind or vision-impaired person usually has great difficulty in dealing with crowded
vehicle situations and most report having trouble with transferring between vehicles,
often because there is a need to cross a busy street in order to find and board the next
connection vehicle.

Table 3: Most Difficult Situation while Using Public Transit (Rank Ordered)
Rank
1.5 Recognizing which vehicle to enter
1.5 Estimating where I am when the vehicle is in motion
4.5 Dealing with layovers with mode or route changes
4.5 Dealing with a crowded vehicle
4.5 Finding transfer points when changing vehicles
4.5 Finding the transit point when having to cross the street
*
20.5 Entering or exiting transit vehicles
20.5 Finding an empty seat
* Reasons from 7 – 16 are not reproduced here.
Summary
Other surveys have shown that people living alone make far fewer trips than those living
with others (Doyle, 1988). It is probable that this fact extends also to disabled people.
The graying of America will see many more people becoming disabled and eventually
living alone. For many of them, the major mode of travel in their local environment will
have to be public transit. Adequate transit services to serve their needs thus will become
more significant in the future. It is important at this early stage, therefore, to ensure that
any transit service changes initiated by the need for ADA compliance, or simply by the
need to provide better public service, should ensure that such changes meet the existing
and future needs of disabled people as well as their able bodied counterparts.

Travel behavior and trip making are driven by the decisions of people to obtain
satisfaction of needs and desires. The freedom and independence to satisfy these needs
are limited by constraints, many of which are caused by changes in lifestyle, such as
aging and disabilities. Capacity constraints ar limits on the physical process used to
obtain the desired benefits of travel. Physical disability, aging, living alone, economic
disadvantages, and the absence of a personal automobile all negatively affect the ability
to easily complete travel to meet basic human needs. Coupling constraints arise when
schedules must mesh with the schedules of other people. This is shown in our work by
the time our subjects spent waiting for rides, or having to be a transit stops at certain
times. People who don’t drive and who rely on transit also cannot make trips at certain
times of the day or have limited access on some days. Para-transit service must be
scheduled in advance and cannot be rescheduled when appointments or errands run late.
Authority constraints also limit access to activities. Some places are not open when
people can schedule rides or when service is available. Many of our subjects reduced the
effect of these constraints by living close to shopping and other destinations. In many
areas, especially suburban and rural, there is little ability to live near necessary
destinations. For these reasons, such constraints limit independence, and more accessible
transit is needed to enable these people to pursue a feasible set of activities for the
purpose of meeting their daily needs. Observed aggregate behavior often results from
some constraints, rather than being the result of free choice of the individuals. It is
necessary to identify to what degree these actions are the result of constrained behavior.
In our survey we asked many questions concerning existing and potential areas of
frustration, desires and needs, difficulties, and usefulness of services now available or
potentially available in the future to our vision-impaired or blind user group. Unlike the
mobility impaired or wheelchair-bound, blind or visually impaired travelers do not
require costly infrastructure and equipment modifications. What they appear to need most

of all is better access to information. This need was expressed in a desire to have drivers
call out the bus number and bus stops, clearer PA announcements in terminals, human
operated transit telephone hot lines, and auditory prompts, signals, and schedules. All
except the auditory prompts are now provided by many transit operators and just need
better enforcement. Another simple and relatively low cost request was for route
schedules to be presented in suitable format including large print or Braille. Many
visually impaired wanted larger route numbers on buses and large print signs on bus
stops to indicate route numbers and timing information.
Obviously there is much room for improvement in terms of the provision of
transportation for disabled people. But, even with the best intentions, able-bodied
engineers, planners, and other decision makers may not develop remedies acceptable to
disabled people. To ensure successful innovation, it is necessary to find out more about
existing behaviors, existing and future preferences, sources of discomfort and frustration
(physical and social), and particularly to find out those things most requested by groups
with different disabilities. Solutions for those relying on wheelchairs for mobility may
not be favorable to those without sight (e.g., location and gradients of curb cuts);
solutions for those with vision deficits may not help those with hearing difficulties (e.g.,
auditory traffic signals or tactile warning tiles at bicycle crossings); and solutions for
those with hearing deficits may not help those with cognitive impairments (such as
blinking signs).
In this paper we have presented some findings concerning a group rarely studied by
geographers, planners, and traffic engineers. We hope that this report will stimulate
others to delve deeply into the spatial patterns of daily activity, other episodic events like
mobility and migration, and spatial choices such as those involving location, destination,
and other significant characteristics, by blind or vision impaired persons or other disabled

groups. Perhaps we can eventually pursue the solutions for the special problems facing
these groups with the same intensity that we seek solutions to problems facing able-
bodied persons.
References
Americans with Disabilities Act of 1990 (1990) Law and Explanation. Chicago, IL: Commerce
Clearing House, Inc.
Axhausen, K.W. (1990) An introduction to the “activity approach.” Lecture notes. TSU
Working Paper 533. Transport Studies Unit, Oxford University.
Braille Institute Newsletter, 1994
Corn, A., and Sacks, S.Z. (1994) The impact of non-driving on adults with visual
impairments. Journal of Vision Impairment and Blindness, Jan-Feb, 53-68.
Damm, D., and Lerman, S.R. (1981) A theory of activity scheduling behavior.
Environment and Planning, 13A, 703-718.
Doyle, M. (1988) The travel needs and habits of non-elderly physically handicapped
people. Department of Transport Technology, Loughborough, England.
Golledge, R.G. (1994) Disability, barriers and discrimination. Paper presented at The
New Distributional Ethics: Differentiation and Discrimination Conference, Boston,
Massachusetts, November 7-9.
Golledge, R.G., Costanzo, C.M., and Marston, J.R. (1995) The Mass Transit Needs of a
Non-Driving Disabled Population. Final Report, December. University of California
Richmond Field Station PATH Division Grant #MOU167.
-----------. Forthcoming. Attitudes of blind or vision impaired persons towards mass
transit use. Journal of Visual Impairment & Blindness.
Hanson, S., and Hanson, P. (1993) The geography of everyday life. In T. Gärling and
R.G. Golledge (Eds.), Behavior and Environment: Psychological and Geographical
Approaches. North-Holland: Elsevier Science Publishers.

Jones, P.M., Dix, M.C., Clarke, M.I., and Heggie, I.G. (1983) Understanding Travel
Behavior. Aldershot: Gower.
Kirschner, C., McBrue, L.W., Nelson, K.A., and Graves, W.H. (1992) Lifestyles of
employed legally blind people: A study of expenditures and time use. Final Report
Mississippi State. Mississippi State University Rehabilitation Research and Training
Center.
Kitamura, R. (1988) An evaluation of activity-based travel analysis. Transportation, 15, 9-34.
Recker, W.W., McNally, M.G., and Root, G.S. (1986) A model of complex travel
behavior: Theoretical development. Transportation Research, 20A, 307-318.
U.S. Bureau of the Census (1990) Americans with Disabilities Act 1991-1992.
Washington DC: Department of Commerce, Economics and Statistics Administration,
Bureau of the Census.
Winston, G.C. (1987) Activity choice: A new approach to economic behavior. Journal of
Economic Behavior and Organization, 8, 567-585.