Embed Size (px)
Citation preview

1
Investigating the Transition to Multicellular Life on Small
Scales by Physically Modifying a Chemical Signaling Channel
Kayvon Daie, Bradley Webster, Ryan Monaghan, and Carl Franck
Laboratory of Atomic and Solid State Physics
Cornell University, Ithaca NY 14853
The study of the starvation response of the social amoeba system Dictyostelium
discoideum has long been regarded as an important opportunity to learn about the
transition to multicellular life for eukaryotic organisms. Here we focus on two critical
developmental steps: the first indication that a communications network between
formerly independent cells has been established as evidenced by synchronized periodic
shape changes and the first stages of aggregation as indicated by the appearance of
streams of migrating cells. In contrast to earlier work which has stressed large scale
structures, to be interpreted with continuum theories, we focus our attention on the
smallest scales of interest for multicellular effects. In order to better understand the
means by which these developmental steps come about we study their timing from the
start of starvation as a function of a hitherto underappreciated experimental variable: the
thickness of the aqueous layer through which the chemical messages diffuse between the
cells while the cells themselves crawl about on a substrate. We also explore the
importance of sparseness in such microbial life by examining these transitions as a
function of the substrate’s coverage by cells, again with particular attention to the
smallest scale multicellular features. In contrast to earlier theoretical approaches that rely
on chemical signaling in a two dimensions, we compare these measurements with a

2
theory that explicitly takes into account the discreteness of life and the transport of
chemical signals through a three dimensional layer of finite thickness. Despite the large
fluctuations that are expected for small scale observations of these heterogeneous
systems, we observe a significant speedup to synchronized pulsation when the signaling
layer thickness is less than a micron when compared to thicker layers. Our rough theory
which focuses on the time that it takes a collection of oscillators to synchronize gives
qualitative insight into this result. Turning to the time required for stream formation: we
see an unexpected reduction in the time to pass to this stage of multicellular development
in bulk vs. thin film systems. Finally, we report how small collections of cells
(``squads’’) universally form for all densities we examined through contact accretion but
do not manage, as one might expect at low surface densities, to outrun long distance
chemical signaling as a means of building streams.
PACS Classification: 87.18.Fx, 87.18.Gh, 87.18.Ed
In preparation for Physical Review E, 10/30/11
I. Introduction
Over several exciting hours, starving colonies of the eukaryote Dictyostelium
discoideum (henceforth referred to here as Dicty) form themselves into a genomic
lifeboat containing the nuclear material of up to 510 cells1. The very first indication that
these colonies have made the jump to multicellular life is the readily recognizable
appearance of synchronized periodic shape changes over patches of adjacent cells,
typically involving as few as tens of cells. The question of how quickly Dicty colonies
3
are able to bring about this first collective behavior on the smallest length scales will be
the focus of this work. These changes in cell morphology are responsible for the vivid
large scale patterns seen in dark field microscopy of colonies on substrates2 and in the
periodic light scattering from suspensions.3 It has long been understood that such shape
changes in the form of ``cringes’’4 indicate the reception of external chemical signals, in
the form of cyclic adenosine monophosphate (cAMP) molecules. The subsequent
emission of the same signals is understood to be the means by which a signaling network
is established in collections of cells.5 In order to better understand the establishment of
such multicellular life, we sought to perturb the signaling channel itself by restricting its
vertical height (h ).6 In the following section we will describe the various preparations
we used to accomplish this. We will also describe the starvation protocols that we
followed and the manner in which the system was observed, always with the emphasis on
small scale behavior. In choosing between the many possible visual observables, we
focused on two landmark developmental events: the earliest time ( PT ) (from the
beginning of starvation) we noticed synchronized cell shape pulsing and the earliest time
( ST ) we noticed the coalescence of migrating cells into streams. Steams need not be
continuous. In fact we frequently observed streams composed of only a few cells. As has
been recently noted,7 these small scale aggregates readily move as a unit. In fact at first
glance they appear to be single cells. We christen these broken streams with the name
``squads.’’ We noted whether squads were present in the various preparations used.
Besides the thickness of the aqueous layer, we also measured a surface density variable,
f , the fraction of the substrate that was covered by cells. This is of particular interest as
we focus our attention on small scale features in contrast to the large scale averaging of

4
cellular life in earlier work that stressed wave signaling. Hence we are especially
interested in the sparse regime, i.e. low f . After presenting the observations, we will
provide a rough theory for PT for the establishment of a system of synchronized
oscillators from out of a collection of cells that spontaneously emit randomly-timed
bursts of signal molecules. We will then compare this theory and experiment for the
time to synchronized pulsing, Next, the observation of the early stages of streaming (at
the time given by ST ) are given and comparisons are made with a rough theory. We then
give a discussion of the role that squads play in the formation of large scale aggregates.
II. Experimental Methods
1. Specimen Preparation
In order to study the consequences of vertical confinement of the chemical
signaling channel for colonies of starved Dicty cells on a horizontal substrate we
prepared signaling layers in the different ways illustrated in Figure 1: as aqueous wetting
layers of different thicknesses and as soaked hydrophilic highly porous membranes.
A. Wetting Layer Preparation (Figures 1a and 1b)
In our first approach we use aqueous wetting layers on glass substrates as
signaling layers. These layers were of three types: ultrathin (less than 1 micron thick),
thin (ranging from 16-42 microns but mostly in the 20 to 30 microns thick range) and
bulk (approximately 2000 microns thick). The procedures which we followed for cell
culture and starvation (including the composition of the aqueous media used) based on
standard Dicty protocols8 were as follows: we grew our cell lines at 19-21 deg C using 25
ml rotary shaken suspension culture of the axenic cell line AX3 (the strain used was
5
Wf38 in AX39) with HL5 culture media. Cells were harvested from the exponential
growth phase and concentrated through three rounds of centrifugation and exchange of
media with development buffer (DB) prepared according to Ref. 10. The essential
property of DB is that while it provides appropriate salt concentrations for life, it is
missing nutrients, thereby starving the system and inducing development. Our
concentration procedure produced cell densities up to the 710 cell/ml range, as determined
by dilution and subsequent slide based cell counting. For substrates for starvation we
used plasma-cleaned11 glass coverslips commercially glued over holes in plastic Petri
dishes.12 The concentrated suspensions were diluted in order to achieve the desired cell
density. In order to produce thin film specimens, 1 ul of the starved cell suspension was
applied to the centers of the dishes. Immediately a 1.0 ml volume of DB-saturated13 light
mineral oil14 was then applied to prevent the preparation from drying out. This
preparation resulted in large area (typically 33 mm2) roughly circular pancake-shaped
droplets. The thicknesses of these structures were gauged by measuring their area by
matching them with a lineup of digitally drawn circular and elliptical shapes of various
areas and ellipticities. From the volume used, we compute the layer heights. These ranged
from 14 to 42 microns,15 with most specimens in the range of 20 to 30 microns.
In order to prepare ultrathin films, we added one main additional step: a cotton
thread with a DB-saturated tip was inserted through the mineral oil overlayer in order to
make contact with the droplet which was typically 5 ul in volume.16 We noticed that the
droplet would quickly lose visual contrast, indicating that DB was being wicked away. In
some cases, the wick was eventually removed. In others, it remained. We argue based on
experience with binary liquid mixtures near hydrophilic substrates that what remained on
6
the glass was an exceedingly thin film of the aqueous phase of less than a micron in
thickness.17 It might seem surprising that Dicty could function in such an environment
where except for the substrate, its surroundings are almost entirely nonaqueous. But our
preparation recalls the work of Bonner18 when he produced ``two-dimensional slugs’’
that adhered to a glass substrate by inserting developed aggregates of starved Dicty into a
bulk phase of mineral oil.
For our bulk specimens, in place of the droplet of cell suspension we used a 200
ul volume of the starved cell suspension before applying the mineral oil rich overlayer.
We typically prepared several thin layer specimens in a batch along with a bulk
specimen. In a typical run, we selected one thin or ultrathin sample for up to more than
24 hours of observation. Typically we selected for the greatest uniformity in spatial
distribution of cells. To summarize, we produced reduced-thickness signaling layers for
starved Dicty cells on glass substrates by forming wetting layers. We also used bulk
phase specimens. We observed preaggregation behavior as a function of cell surface
density. On occasions where aggregation occurred, we observed the expected19
formation of mounds and ultimately stalks and fruiting bodies, which grew up readily
through the mineral oil rich overlayer.
B. Membrane Preparation (Figure 1c)
As a second means of constructing a confined signaling channel, we prepared as
an alternative to the glass substrate, beds of thin DB-soaked hydrophilic porous
membranes,20 thin layer analogs to the familiar thick filter paper substrates used in Dicty
starvation development studies.21 Our membranes had a pore size of 0.1 microns, which
is too small for the cells (which are typically 10 microns across) to penetrate. The idea

7
was that cells would signal by diffusing signal molecules through the membranes just as
they would communicate through the wetting layers in the other preparations. We
achieved this configuration by placing the cell specimens on top of one or two
membranes that were injected with DB. The membranes were 30 microns thick. In this
manner, we provided signaling channels with a single membrane of 30 microns thickness
and with a pair of membranes on top of each other we had vertical confinement for 60
microns of height. The details for our thin membrane preparations were as follows: the
same type of glass-bottomed Petri dishes used in wetting layer preparations were plasma
cleaned as in the wetting layer preparations. For a single layer membrane preparation we
proceeded as follows: membranes which had been cut into typically 8 by 7 mm rectangles
were placed on the glass substrate. We used a limited amount (0.5 ul) of cell suspension
in DB so as not to produce an uncontrolled excess, which would ruin our establishment of
a controlled thickness signaling layer. We verified this condition by noting that the
wetted area (typically 6 mm across) of the membrane did not cover it entirely. As before
a mineral oil rich overlayer of 200 ul volume was gently applied on top of all this. For
two layer membrane preparations, the protocol was the same, except that a single
membrane was initially placed on the substrate and a volume of 0.5 ul of DB was used to
wet it before the above procedure was repeated for the second membrane. We found that
fruiting bodies atop stalks could be observed to form with these membrane preparations.
2. Observation Methods
Time lapse ( 10 seconds delay between frames for thin and ultrathin films, 20 sec
for membrane preparations, and 10 sec to 1 minute for bulk systems) recordings were

8
made of the thin, ultrathin and membrane preparations using inverted microscopes,22 over
a viewing area of 870 by 660 microns. This small area (about 0.6 mm2 ) being a factor of
1500 smaller than in typical wave signaling studies,23 allowed us to sample the behavior
of the system on the scale of individual cells. A sample frame is shown in Figure 2. For
the bulk specimens, observations were made using a noninverted microscope24 at the
same time as the recordings of a confined layer preparation. For all preparations, early
frames were printed out, highlighted for cells manually and then processed with the
ImageJ25 program in order to ascertain the fraction of the substrate that was covered by
cells, f . From repeated measurements of the same image, we estimate that our relative
uncertainty inf is about 6%. The videos were viewed at factor of 150 speedup or faster
(checked as needed by different observers) to note synchronized shape changes (PT ) of
collections of cells. We also noted the earliest time for streaming (ST ) and whether small
adherent groups of cells (squads) were present. From repeated observations of a typical
video, the uncertainty in establishing PT is 0.2 hour and for S
T is 0.1 hour. Individual
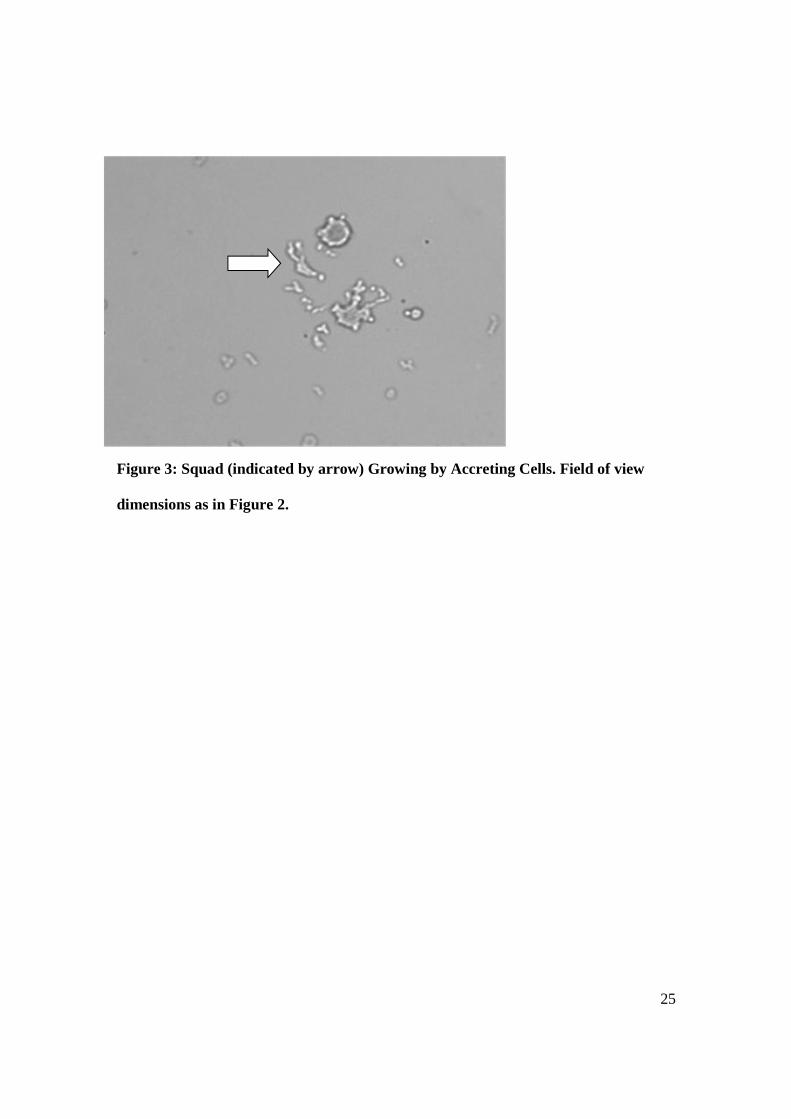
cells merged tightly to form squads such that cell boundaries were not discernable.
However, we could still differentiate large single cells from squads by witnessing their
formation, as seen in Figure 3 where a cell is joining a squad; or dissociation, where cells
are seen shedding from a squad. The process of formation and destruction of squads were
observed to be continuously ongoing.
III. Observations of Earliest Signs of Synchronized Pulsing
9
Figure 4 below shows our observations of the first signs of collective pulsing as a
function of signaling layer thickness and fraction of the substrate covered by cells for
bulk, thin and ultrathin systems. We found that for the shaded ultrathin points there was
some deviation of interest from the others: either the thread was left in the contact with
the film, or the starved preparation was left in the bulk phase for an extended period of
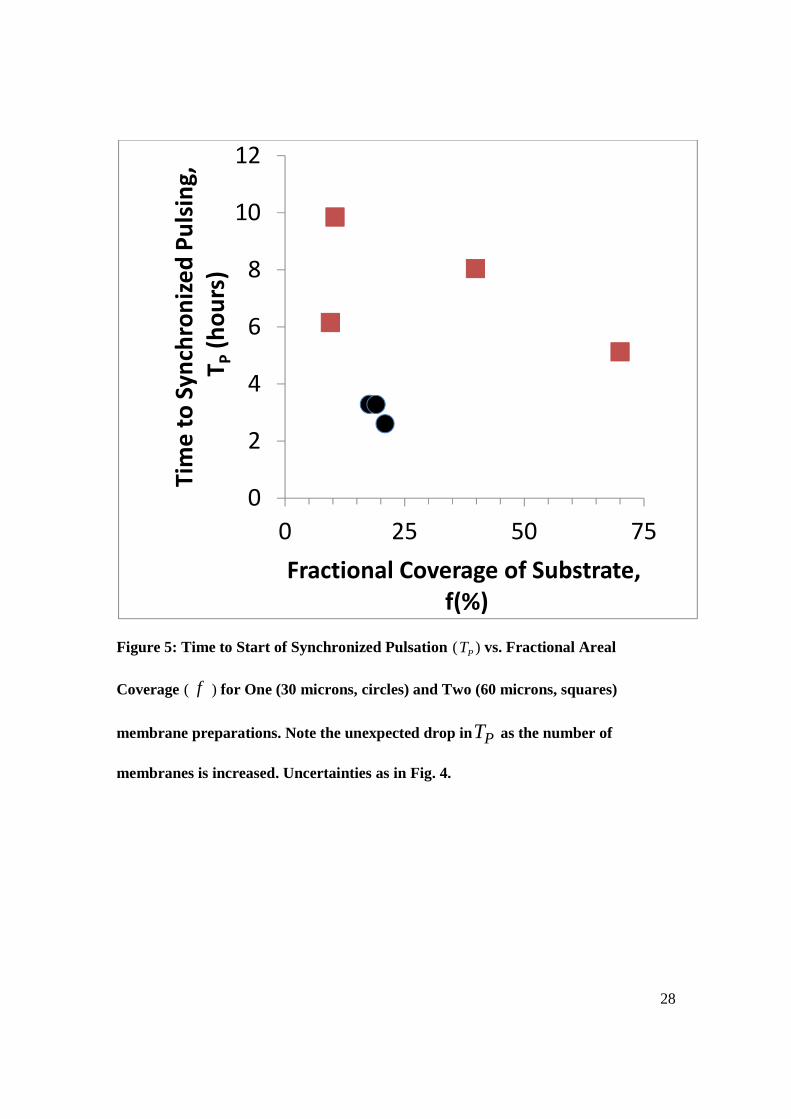
time. Figure 5 gives this same information for the membrane preparations. We note that
within the uncertainty inP
T , the results for thin films and bulk preparations are
indistinguishable. The scatter in results is considerable and much greater than our
uncertainty in establishing the onset of synchronized pulsing in a single run (0.2 hour).
The relative uncertainty inf , 0.06, is insignificant in this and all our other
measurements. Despite the scatter in the ultrathin film results, we see a good indication
of a reduction in P
T around 25% coverage in the ultrathin film results compared to the
bulk and thin film observations. We also note that there is a threshold for collective
behavior apparent in the bulk data as follows. After about 17 hours of observation, no
synchronized pulsing was in evidence for f at 2% or lower. We compare this to the
minimum surface density for aggregation of 510 cells/cm2 reported for the AX2 strain.26
Assuming that Dicty cells settle into random positions on the substrate and have an
approximately circular footprint with a 5 micron radius gives this as a fractional areal
coverage of 7.5%. We speculate that the deviation from our results might be attributed to
the different strains being compared here or uncertainty in the cell size.
The membrane measurements shown in Figure 5 tell a very different story: in
contrast to the agreement of thin film and bulk data in Figure 4 the one and two layer

10
membrane systems show a surprising trend toward shorter time to synchronization for
larger signaling channel thickness. We speculate that this might be because the transport
of the signal molecules through the membrane is not by bulk diffusion alone, but involves
surface diffusion on the porous membrane material in a manner that drastically differs
from the simple diffusive transport through the open signaling layer liquid phase of the
wetting layer systems.
IV. Theory for Earliest Signs of Synchronized Pulsing and
Comparison with Experiment
We now develop a rough prediction for the time for synchronized pulsing PT
given that starvation development has proceeded far enough to produce a collection cells
which are of spontaneously emitting bursts of signal molecules and can be triggered into
oscillation by the combined output signals of their neighbors. In this manner, we
emphasize the discreteness of cellular life on small scales, in contrast to the continuum
theories that are restricted to considering large scale signaling wave patterns in
sufficiently dense systems.27 We expect that the cells are employing short pulse signaling
since it has been observed28 in suspensions of synchronized cells that the duration of
extracellular cAMP emission is short compared to the oscillation period.29 Recognizing
that entrainment does occur, we focus attention on the additional time required to bring it
about, once the required biochemical signaling apparatus is in place. For the sake of
simplicity, we assert that an individual cell’s development time to spontaneous signal
emission and signal reception, DEVT , is fixed for all conditions we explored (i.e.

11
aqueous layer thickness and the substrate surface coverage). Our aim therefore in this
section is to predict the time to establish entrained oscillations in a collection of cells
SYNCT in order that we can find the observed time to synchronized shape changes, PT
through
DEVSYNCP TTT += . (1)
We will treat the problem self-consistently as follows: imagining the situation from the
view of a single potential oscillator in the collection, one must synchronize30 to the
combined signals of the other signal sources in the collection, which we will regard as a
master signal. We argue that in this pre-entrainment period, there is no need to invoke the
notion of a pacemaker cell31 to break the phase symmetry of the combined signal of the
collection of neighboring cells, but rather a transient signal with sufficient strength at the
required frequency emerges from the randomly phased combination of burst signals from
neighboring cells. Just as one expects a randomly phased collection of steady oscillators
to yield a combined signal with amplitude which grows as 21/N where N is the
number of individual oscillators,32 we expect that the N cells in the collection that will
eventually synchronize will produce a fluctuating chemical concentration signal with a
component at the frequency of interest whose strength will scale as 21/N .initially.33
Following Strogatz’s34 discussion of the entrainment of a slave oscillator to an imposed
master we model this lock-in phenomenon as a correction of the master-slave phase error,
φ as follows:
12
)sin(φγφ −=& . (2)
Where γ represents the strength of the master signal impressed on the slave.
Simplifying, we consider only the characteristic exponential decay limit when the slave
cell is close to synchronization. We therefore expect that the desired time to
synchronization is given by SYNCT through the relation
1−= γSYNCT . (3)
We can now express N as a function of the characteristic spatial extent of the collection
on the substrate,L , the fractional substrate coverage,f , and the radius for each Dicty
cell on the substrate, a as follows:
))a/(L(fN 22 π= . (4)
In our pursuit of the earliest signs of synchronized pulsing, we need to be aware that L
does not represent the size of the collection of cells that will ultimately be swept up into
the final aggregate. This ultimate size can be drastically adjusted by shedding groups of
cells well after the initial aggregate is formed by large scale streaming that follows the
initial period of synchronized pulsing that we are studying. Such later stage size
regulation has been extensively explored.35 Bearing this distinction between the
collection of cells that initially signal each other and those that ultimately form an
aggregate in mind, we make the simplest possible assumption here and regard the
collection size L for initial synchronized pulsing as being independent of preparation,
i.e. independent of both initial fractional surface area coverage (f ) and signaling layer

13
thickness (h ) . We now have a simple way to scale up (through our 21/N law) the signal
strength due to a single cell. We need )(A ω0 , the spectral component of the chemical
emission strength from each individual cell at the frequency of the Dicty shape
oscillations (ω ). We therefore assert that in Equation (2) we have the following
expression for the phase correction strength
)(/1 02/1 ωγ ANTSYNC ∝= . (5)
We now need to find the time course of the signal produced by a single cell. For this we
consider the concentration field that results from a point source releasing a unit dose of
signaling molecules at an instant of time. Our signaling media are slab shaped aqueous
phases with thickness h with no flux at both the bottom and top surfaces. We therefore
turn to the concentration field due to an appropriate string of point image sources36
spaced at intervals of h2 above and below the actual source along a line (the z axis)
which is perpendicular to the substrate. Placing the source at the origin on the substrate (x
= y = z = 0) we have the following expression for the concentration field for a point
release of unit concentration at time t = 0: (In the following expression l ranges over all
integers).
∑∞+
−∞=
+++−=
l tDDt
yxhlz
hzyxtc 2/3
222
)4(
])(
))2(()4/1(exp[
2),,,,(π . (6)
In this expression D is the diffusivity of the signal molecule. Since we are only
interested in the signaling to other cells on the substrate, we can take z=0 in the above
expression and for convenience, define222 yxr +≡ .

14
We therefore have
∑∞+
−∞=
+−=
l tDDt
rhl
hrtc2/3
22
)4(
])(
))2(()4/1(exp[
2),,(π . (7)
For the purposes of synchronization we must consider the received signal strength at the
oscillatory frequency. This is provided by considering the Fourier transform of ),,( hrtc
at frequencyω . We therefore have:
∫∞
∝00 ),,()sin()( dthrtctA ωω
. (8)
Since we will ultimately compare the signal strength for different signaling channel
thicknesses with that in the bulk we need not be concerned with knowing either the
amplitude of the transmitted signal at the source or the receiver sensitivity since these
quantities will not appear in the desired ratio. Combining Eqns. 7 and 8 we have
∑∫+∞
−∞=
∞ −−∝l
l dttttA0
2/30 )/exp()sin()( γωω . (9)
Where
D/]r)hl)[(/(l22241 +≡γ . (10)
From Ref. (37) we have for the integrals in Eqn. 9:
])2sin[(])2(exp[)( 2/12/12/10 ωγωγγω ll
llA −∝ ∑
+∞
−∞=
− (11)
In order to further simplify matters, we assign r to be the typical signaling range given
by the average spacing between cells on the substrate: therefore, in place of r we will use
2/12 ))/(( −= afr π (12)

15
We see that it is natural to introduce
212 /ll )( ωγθ ≡ (13)
We now consider the ratio of characteristic synchronization time SYNCT for a signaling
layer of height h normalized to that of an infinitely thick layer ( ∞=h ) (i.e. to
represent signaling in the bulk) with the substrate completely covered with
cells ( 1=f ). That is to say, we wish to know the ratio:
)f,h(T/)f,h(T SYNCSYNC 1=∞= .
Now, since ∞=∞=≠ )h(l 0θ (14)
we see that for ∞=h , the 0≠l terms in Eqn. (11) vanish.
Combining Eqns. (4, 5, and 11) and noting the symmetry ll −= θθ we find:
)]h,f(Z)f(Z[
)]f(Z[f
)f,h(T/)f,h(T
,...,,ll
/
SYNCSYNC
∑=
−
+
=
==∞=
3210
021
2
1
1
(15)
Where, using Eqns. (10, 11, 12 and 13) we have employed the functions:
)sin()exp()/(Z llll θθθ −≡ 1. (16)
Which can simplify as follows:
212
2221
0 14 //
l ]a
flh[f += −
πµθ (17)
16
by introducing
212
0 2/)
D
a(
πωµ ≡ . (18)
In order to evaluate these expressions we used the following values: for D ,
444 micron2
per second,38 for a , 5 microns39, and to find the angular frequency of
oscillationω , we used a period of 7 minutes.40
In order to produce the predictions41 drawn as lines in Figure 4, we treated
DEVT and )f,h(TSYNC 1=∞= as adjustable parameters, finding that the bulk data
of Figure 4 constrains these quantities to be about 1.5 and 1.0 hours respectively. Note
that this value for DEVT is somewhat short compared to the quoted value of 5 hours for
the development of the essential cAMP receptor car1.42
Considering the theory in Figure 4, we see that a focusing effect is predicted due
to confinement: as the channel thickness decreases, there is a quickening of the
synchronization process. We also see hastening expected as the surface coverage
increases. The theory predicts that bulk behavior is attained by any layer thickness greater
than 500 microns (the results for 500 and 1000 microns are indistinguishable). Thus we
were justified in fitting our bulk data (where we have a value of h of about 3000
microns) to give )f,h(TSYNC 1=∞=. The theory predicts that on the scale shown
the ultrathin film synchronization should be immediate and therefore independent of
surface areal coverage, in agreement with the experimental results in Figure 4. The theory
does however miss an essential feature of the observations. While the theory predicts that
the thin film (generally 20-30 microns thick) and bulk results should be distinguishable

17
even allowing for our experimental scatter, they are observed to be the same. Considering
the threshold we detected for aggregation at 2% surface areal coverage, we see from our
plots that this might be indicative of the predicted failure to synchronize in the time over
which the observations were made.
Turning to our membrane results shown in Figure 5, we see that the striking
feature that we noted earlier, namely the hastening of the time to synchronization with
increased signaling layer thickness is at odds with our theory. Again, we speculate that
this unexpected result might be due to the special possibilities for surface transport
afforded by this porous medium. To summarize, our rough theory provides semi-
quantitative agreement with the measured time to collective pulsing with our wetting
layer experiments, and reinforces our surprise with the membrane results.
V. Observations and Theory of the Time Interval between the
Onset of Synchronized Pulsing and Streaming
In Figure 6 we show the observed time interval between streaming and collective
pulsing in bulk, thin and ultrathin films. There is considerable scatter (much greater than
the uncertainty we noted in establishing the streaming and collective pulsing times in a
sample run) in the thin and ultrathin film results, which are thereby indistinguishable. We
see that the bulk values by contrast are considerably smaller, especially at the lowest
fractional areal coverage. In our simplest conception of the problem, we imagine that the
process by which cells coalesce into streams would be by direct contact and hence make
no further use of the long range signaling system. This is apparently not the case since the
layer thickness matters. Turning to our membrane preparations, by contrast Figure 7
18
shows the expected thickness independence when we compare results for different
membrane sizes. For a given surface areal coverage, the coalescence into streams occurs
as quickly on membranes as we observe it to do on glass under bulk aqueous phases.
We can give a rough prediction of the dependence on substrate coverage of the
time delay between collective pulsing and coalescence into streams as follows:
presuming the cells move at a fixed speed (s ) and that they have swept together by
accretion a critical line density of cells to form the first branch of a stream, then we can
ask over what time we might we expect this to achieved, given a surface density of cell
set by the fractional areal coverage. If we let l represent the average spacing of cells, then
we expect that:
s/lTT PS =− (19)
And since we expect
21 /fl −∝ . (20)
We predict
21/PS fTT −∝− . (21)
We see from Figure 6 that while the sparseness and scatter in the thin and ultrathin
observations do not allow for a test of this ``sweep’’ theory prediction, the bulk results
appear to rule it out (from our repeated measurements of PT and ST on the same video
our uncertainty in PS TT − , 0.2 hr., is much smaller than the scatter we see in Figure 6).
Turning to our membrane observations, Figure 7, again with limited data, shows
the agreement we had expected between one and two membrane results and this rough
theory.

19
VI. Observations of Few Cell Aggregates (``Squads”)
Our observations of squads (see Figure 3) are simply summarized. We found
them to be present in all cases observed. We had expected that they would serve as an
alternative means of aggregation when densities were too low to enable effective long
range chemical signaling. Had this been the case, we would have seen streaming without
synchronized pulsing preceding it. This was not the case in our observations. Upon
reflection, we can ask at what fractional areal coverage the mutant strains of Wang and
Kupsa43 were able to achieve aggregation with the cAMP signaling apparatus disabled
(specifically the apparatus for external cAMP secretion (the ACA transmembrane
protein) is defective) we estimated that this was essentially 100%, a higher density than
we explored.
VII. Summary and Outlook
We have presented here a first look, both experimentally and theoretically, into
the effect of physically modifying through height control the chemical signaling channel
seen as essential to bringing about aggregation as a consequence of starvation in the
social amoeba system Dictyostelium discoideum. We have observed by noting the first
indications of synchronized oscillations in cell shape the establishment of a
communications network through chemical signaling. We have noted an apparent
speedup when one passed to the thinnest signaling channels we have prepared, in
qualitative agreement with a theory we have developed which treats the system in a
manner that is able to address the sparse coverage of cellular life in the situations that are

20
of the greatest biological challenge to this system. We were surprised by the qualitatively
unexpected results we encountered in preparations which altered the thickness of the
signaling channel through the use of porous membranes. This is particularly significant
since starvation experiments are often performed on porous substrates. This suggests that
we need to better understand the passage of chemical signals in such systems. Our
observations invite exploration with larger fields of view in order to go beyond the first
signs of collective life that we have focused on here. This will permit one to pass from
these small scale collective features to what will ultimately be the catch basins for all the
cells that will form a single aggregate. In this manner one could expect to relate these
small scale structures to large scale observations.44 We have argued that by stressing
small scale features, we may have detected significant intrinsic fluctuations. Therefore a
more extensive sampling than we have completed would provide vital information for
such spatial noise effects. It would also be important to independently establish the time
that is required to initiate cell signaling. In order to achieve this, one can look forward to
the use of fluorescence reporter experiments that indicate the biochemical state of the
signaling apparatus. We also look forward to digitally automating the process by which
video is examined for dynamic features in order to identify aspects of collective order.
On the theoretical front, our rough theory for the time to the first signs of multicellular
life based on the time to the formation of synchronized cell pulsations could well be a
proper first step in the spirit of dimensional analysis toward a detailed explanation. We
expect that the results we have predicted would be valid even if the means by which
collective oscillations began were very different. For example an alternative route could
be through the synchronization of randomly phased cells which are already experiencing
21
self-oscillation as opposed to the mechanism of a collection of cells randomly releasing
shorts bursts of signal molecules that we have presented here. We feel that the
exploration of surface modes of transport in the porous membrane systems might lead to
an understanding of the surprising behavior we have encountered with membrane
systems when we consider the time to collective pulsing. We also welcome more refined
stochastic approaches that feature the effects of the discreteness of cellular life.
Turning to the coalescence into streams: the importance of the thickness of the
chemical signaling channel we observed for the time interval between earliest streaming
and the onset of collective pulsing with our droplet preparations (but not our membrane
preparation) suggests that continuous streams and their fragmented versions (squads) can
communicate via long range chemical signaling and not just by adhesive contacts. An
improved theoretical approach that takes into account the branched structure of the
streams and cell traction on different surfaces might well bring more understanding than
the simple model we presented here which is incapable of predicting the apparent effect
of the thickness of the signaling channel or its dependence on the nature of the substrate.
Finally, we recognized the ubiquity with which many-cell collections (squads) which
move as a single unit appeared throughout these preparations. Despite their universal
appearance, we did not find them providing a means of forming aggregates by contact
adhesion as the alternative pathway to aggregation through long range chemical signaling
between isolated cells in sparse systems we expected. Asking whether we can understand
the nature of these small scale life forms through cellular automata theory45 one
immediately acknowledges that while mobile multicellular structures are naturally
predicted by such theories we are concerned that squads possess additional vital

22
capabilities for sensing and behavior that are beyond what current cellular automata
theory can predict. Finally as a means of embracing all the phenomena we have focused
on here: the synchronization of individual cellular emission through the diffusion of
signaling molecules, and the coalescence of cells into squads and streams we propose that
the discrete cell, chemically coupled oscillator approach of Nagano46 be extended to
include confined signaling channel effects. It would be exciting to see what such a theory
would predict for the observations presented here, including fluctuations, since it could
be a vital improvement over our rough theory.
Acknowledgments
We appreciate the advice and assistance of Albert Bae, Duane Loh, Elijah Bogart,
Eberhard Bodenschatz, Loling Song, Jeffery Woodworth, Elisabeth Gennis, Richard Yeh,
Herbert Levine, and Zsofia Franck. We also appreciate the use of materials and
equipment provided by Eberhard Bodenschatz. This work was supported by the NIH
(P01 GM078586). We employed computing facilities provided by the Cornell Center for
Materials Research (NSF MRSEC grant DMR 0520404)

23
Figure 1: Various Schemes Used for Vertically Confining Aqueous Signaling
Channels (whose thicknesses are indicated by h) in Side View.
a) Thin Film (h = 16 to 42 microns) and Bulk (h > 2000 microns), b) Ultrathin Film
(h < 1 micron) and c) Membrane (h = 30, 60 microns). Glass substrate is green,
aqueous layer is blue or dotted blue for membrane, cells are red, and confining
mineral oil rich overlayer is yellow.
h
h
h
a) Thin and Bulk
b) Ultrathin
c) Membrane

24
Figure 2: View of Dicty Colony in a 40 micron Thick Film Before Streaming.
The field of view is approximately 900 microns wide by 700 microns tall.
25
Figure 3: Squad (indicated by arrow) Growing by Accreting Cells. Field of view
dimensions as in Figure 2.

26
Figure 4: Time to Start of Synchronized Pulsation ( PT ) vs. Fractional Areal
Coverage ( f ) for Bulk (squares), Thin (16 to 42 microns with most specimens in
the 20 to 30 microns thick range, circles) and Ultrathin (less than 1 micron thick,
diamonds, light coloring indicates that protocol followed deviated as described in
text) Signaling Layers (open squares indicate that bulk synchronized pulsing had
already begun by indicated time, triangles indicate duration of runs during which
no synchronized pulsing was observed for bulk). As discussed in the text the
uncertainty in establishing PT for any given run is insignificant compared to the
run to run scatter seen here. Our expected uncertainty in f based on repeated
0
2
4
6
8
10
12
14
16
18
0 25 50 75
Tim
e t
o S
yn
chro
niz
ed
Pu
lsin
g,
TP
(ho
urs
)
Fractional Coverage of Substrate, f (%)
1000 um
500 um
50 um
10 um
0.1 um

27
measurements for the same image are also insignificant. A notable feature is the low
value for PT for the thinnest films at intermediate coverage. The curves are
synchronization theory (layer thicknesses indicated in legend, note that 500 and
1000 micron curves are indistinguishable) based on a fit development time of 1.5
hour and a fitted value (1.0 hour) for the time to synchronization for bulk layers at
full surface coverage.
28
Figure 5: Time to Start of Synchronized Pulsation ( PT ) vs. Fractional Areal
Coverage ( f ) for One (30 microns, circles) and Two (60 microns, squares)
membrane preparations. Note the unexpected drop in PT as the number of
membranes is increased. Uncertainties as in Fig. 4.
0
2
4
6
8
10
12
0 25 50 75
Tim
e t
o S
yn
chro
niz
ed
Pu
lsin
g,
TP
(ho
urs
)
Fractional Coverage of Substrate,
f(%)

29
Figure 6: Interval between Start of Synchronized Pulsation and the Start of
Streaming ( PS TT − ) vs. Fractional Areal Coverage ( f ) for Bulk (squares), Thin
Films (circles) and Ultrathin Films (diamonds). Uncertainty in the time interval
based on repeated observations of the same video are estimated to be 0.2 hour, much
less than the observed scatter in measurements. Expected relative uncertainty in
f as discussed in the text is 0.06, which is insignificant for the work plotted here.
0
2
4
6
8
10
0 25 50 75
Tim
e t
o S
tre
am
ing
-
Tim
e t
o S
yn
chro
niz
ed
Pu
lsin
g
(TS-T
P)
(ho
urs
)
Fractional Coverage of Substrate,
f (%)

30
Sweep theory predictions as described in text plotted as curves.

31
Figure 7: Interval between Start of Synchronized Pulsation and Start of Streaming
( PS TT − ) vs. Fractional Areal Coverage ( f ) for Membrane Preparations (30
microns thick, circles and 60 microns thick, squares). Sweep Theory prediction is
given by curve. Uncertainties are as discussed in Figure 6.
0
0.5
1
1.5
2
2.5
0 25 50 75
Tim
e t
o S
tre
am
ing
-
Tim
e t
o S
yn
chro
niz
ed
Pu
lsin
g,
(Ts
-Tp
) (h
ou
rs)
Fractional Coverage of Substrate, f( %)
32
1 Richard H Kessin, Dictyostelium: Evolution, Cell Biology, and the Development of
Multicellularity (Cambridge University Press, New York, 2001), p. 27.
2 For example, Satoshi Sawai, Peter A. Thomason, and Edward C. Cox, Nature 433, 323
(2005).
3 Gunther Gerisch and Benno Hess, Proc. Natl. Acad. Sci. (U.S.A.) 71, 2118 (1974)
4 Richard H Kessin, Dictyostelium: Evolution, Cell Biology, and the Development of
Multicellularity (Cambridge University Press, New York, 2001), p. 102.
5 Richard H Kessin, Dictyostelium: Evolution, Cell Biology, and the Development of
Multicellularity (Cambridge University Press, New York, 2001), p. 103.
6 Efforts at perturbing the chemical signaling system in the Dicty system have included
the variation of cell density in all of the following experiments as well as: the application
of cAMP that served to reset wave patterns by Kyoung J. Lee, Raymond E. Goldstein,
and Edward C. Cox, Phys. Rev. Lett. 87, 0681011 (2001); fluid mixing by Colin
McCann, Paul Kriebel, Carole Parent, Erin Rericha, and Wolfgang Losert, Amer. Phys.
Soc. March 2007, Abstract U35.5; and the variation of the thickness of the signaling
layer discussed here: Carl Franck and Kayvon Daie, Bull. Amer. Phys. Soc. March 2009,
Abstract P39.6 and Carl Franck, Ryan Monaghan, Albert Bae, Duane Loh, and Eberhard
Bodenschatz, Bull. Amer. Phys. Soc. March 2007, Abstract D34.9.
7 Wolfgang Losert, Carole Parent, and Colin McCann, Bull. Amer. Phys. Soc. March
2009, Abstract W39.6; Colin McCann, Paul Kriebel, Carole Parent, and Wolfgang

33
Losert, Bull. Amer. Phys. Soc. March 2008, Abstract Q16.6; Colin McCann, Paul
Kriebel, Carole Parent, Erin Rericha, and Wolfgang Losert, Amer. Phys. Soc. March
2007 Abstract U35.5; and Carl Franck, Ryan Monaghan, Albert Bae, Duane Loh, and
Eberhard Bodenschatz, Bull. Amer. Phys. Soc. March 2007 Abstract D34.9 .
8 http://www.dictybase.org/techniques/index.html .
9 We used this particular strain with a gfp fusion protein containing plasmid (Wf38) as a
convenience in our work since it was in use in our lab for other experiments involving
fluorescence reporting at the time. We feel that the presence of the plasmid was irrelevant
to the current discussion.
10 http://www.dictybase.org/techniques/index.html .
11 The substrates were subjected to radio frequency excited glow discharge in a reduced
pressure air atmosphere for 30 to 60 sec. with a model PDC-32G Plasma
cleaner/sterilizer, Harrick Plasma, Ithaca, NY.
12 Stock number P50G-1.5-14-F, MatTek Corp., Ashland, MA.
13 We used DB saturated mineral oil since we were concerned that if we had used pure
mineral oil, the oil overlayer would upset the osmolarity of the aqueous layer in which
the cells resided. We obtained the DB-saturated mineral oil from a phase separated liquid
mixture of mineral oil and DB.
14 Stock number 0121-1 light mineral oil, Fisher Chemical, Pittsburgh, PA.
15 These quoted ranges include our uncertainty in establishing the thickness of each
particular specimen, which is approximately 5 microns.
34
16 We sometimes introduced a small clump of ground-up activated charcoal onto the
substrate in order to collect Dicty waste products.
17 One can expect monolayer coverage by adsorbed water on a glass surface underneath
bulk DB saturated mineral oil (see similar situations in Carl Franck ``Wetting
Experiments,’’ in Fundamentals of Inhomogeneous Fluids, Douglas Henderson, ed.
(Marcel Dekker, New York, 1992) p. 277). This is the liquid mixture analog of an
adsorbed water layer on a hydrophilic substrate exposed to saturated water vapor.
18 J. T. Bonner, Proc. Natl. Acad. Sci. (U.S.A.) 95, 9355 (1998).
19 Richard H Kessin, Dictyostelium: Evolution, Cell Biology, and the Development of
Multicellularity (Cambridge University Press, New York, 2001), p. 5.
20 Stock number JVWP02500 Millipore Corp., Billerica, MA.
21 Hideo Urushihara, ``Cultivation, Spore Production and Mating,’’ in Dictyostelium
discoideum Protocols, Ludwig Eichhinger and Francisco Rivero, eds. (Humana Press,
Totowa, NJ, 2006) p. 118. .
22 Olympus IMT2 and IX71 brightfield microscopes using a 2.5x objective and CCD
imaging devices.
23 For example, Satoshi Sawai, Peter A. Thomason, and Edward C. Cox, Nature 433, 323
(2005).
24 Nikon Optiphot brightfield microscope with a 4x objective and a CCD imaging device.
25 ImageJ by Wayne Rasband, National Institutes of Health, USA.
http://rsb.info.nih.gov/ij/ .

35
26 Deenadayalan Bakthavatsalam, Derrick Brazill, Richard H. Gomer, Ludwig Eichinger,
Francisco Rivero, Angelika A. Noegel, Current Biology 17, 892 (2007).
27 For example, Herbert Levine and William Reynolds, Phys. Rev. Lett. 66, 2400 (1991).
28 Richard H Kessin, Dictyostelium: Evolution, Cell Biology, and the Development of
Multicellularity (Cambridge University Press, New York, 2001), p. 102.
29 The extracellular medium is not flooded with signaling molecules because cells excrete
an enzyme, cAMP phosphodiesterase that served to degrade cAMP. We assume here that
this enzyme is uniformly distributed. Richard H Kessin, Dictyostelium: Evolution, Cell
Biology, and the Development of Multicellularity (Cambridge University Press, New
York, 2001), p. 99. Clearly a more detailed description than we offer here would
explicitly take into account its role in signaling dynamics.
30 Nagano has stressed the importance of cell synchronization as the primary means by
which Dicty establish communication links. See Seido Nagano, Phys. Rev. Lett. 80, 4826
(1998).
31 As has been introduced, for example in the cellular automata model of David A.
Kessler and Herbert Levine, Phys. Rev. E 48, 4801 (1993).
32 By summing phasors to yield a Brownian walk.
33 When all do manage to synchronize the master signal will scale asN , but we are only
interested in the startup process.
34 Steven H. Strogatz, Nonlinear Dynamics and Chaos (Addison-Wesley, Reading, MA,
1994) p.104.
35 Jason M. Brown and Richard A. Firtel, Trends in Genetics 16, 191 (2000).
36
36 With point source fields given by J. Crank, The Mathematics of Diffusion (Oxford
University Press, Oxford, U.K., 1975) p. 24.
37 A. Erdelyi, Tables of Integral Transforms (McGraw-Hill, New York, 1954), Vol. 1,
p.75.
38 Martin Dworkin and Kenneth H. Keller, J. Biol. Chem. 252, 864 (1977). 39 Richard H. Kessin, Dictyostelium: Evolution, Cell Biology, and the Development of
Multicellularity (Cambridge University Press, New York, 2001), plate 1.
40 Approximately the value given by Richard H. Kessin, Dictyostelium: Evolution, Cell
Biology, and the Development of Multicellularity (Cambridge University Press, New
York, 2001), p. 99.
41 Numerically summing the series using Mathematica, Wolfram Research Inc.,
http://www.wolfram.com .
42 Richard H. Kessin, Dictyostelium: Evolution, Cell Biology, and the Development of
Multicellularity (Cambridge University Press, New York, 2001), p.117.
43 B. Wang and A. Kupsa, Science 277, 251 (1997).
44 For example: Satoshi Sawai, Peter A. Thomason, and Edward C. Cox, Nature 433, 323
(2005).
45 David A. Kessler and Herbert Levine, Phys. Rev. E 48, 4801 (1993).
46 Seido Nagano, Phys. Rev. Lett. 80, 4826 (1998).