Embed Size (px)
Citation preview

The Pennsylvania State University
The Graduate School
Department of Chemistry
INVESTIGATING THE HYDROPHOBIC COLLAPSE AND SECONDARY
STRUCTURE FORMATION OF MODEL POLYPEPTIDES IN AQUEOUS
SALT SOLUTIONS
A Thesis in
Chemistry
by
Seung-Yi Lee
Submitted in Partial Fulfillment
of the requirements
for the Degree of
Master of Science
May 2015

ii
The thesis of Seung-Yi Lee was reviewed and approved* by the following:
Paul Cremer
Professor of Chemistry
Thesis Adviser
Carsten Krebs
Professor of Chemistry
Scott Showalter
Associate Professor of Chemistry
J. Gregory Ferry
Professor of Biochemistry and Molecular Biology
Barbara J. Garrison
Head of the Chemistry Department
Shapiro Professor of Chemistry
*Signatures are on file in the Graduate School

iii
Abstract
The first part of this thesis discusses the unique hydration of model polymers in
H2O and D2O in order to expand the understanding of the relationship between hydrophobic
hydration and solvent hydrogen bonding strength. Two model polymers, poly(dimethyl
acrylamide) (PDMA) and poly(diethyl acrylamide) (PDEA), were compared. The
uncollapsed state of PDMA was found to be more stable in H2O, while PDEA was more
stable in D2O. To examine the origin of these phenomena, the effects of pH, solvent transfer,
and ion-specificity on polymer collapse were investigated. Experiments were conducted
utilizing light scattering, differential scanning calorimetry (DSC), Fourier transform infrared
spectroscopy (FT-IR), and Raman with multivariate curve resolution (MCR). Among the
variables tested, the dominant effects were found to be highly dependent on the nature of the
model polymer and its interaction with the solvent. PDMA was found to be less
hydrophobically hydrated than PDEA and real proteins.
The second part of this thesis describes the specific effects of calcium ions on
the secondary structure of elastin-like polypeptides (ELPs). Two ELPs, V-120 and V5A2G3-
120, were employed in this study. The phase transition temperatures of these ELPs were
measured by light scattering measurements and correlated with spectroscopic signatures
from circular dichroism (CD). At molar concentrations of calcium chloride, the amount of
β-turn structure was found to increase more for V5A2G3 than V-120. This may be due to the
fact that V5A2G3 has less number of valine residues in its polypeptide sequence. These
molecular level results may contribute to the understanding of the formation of bones in the
body and may also aid in the development of the medical and bioengineer materials.
iv
TABLE OF CONTENTS
LIST OF FIGURES··········································································· iv
LIST OF TABLES·············································································
ACKNOWLEDGEMENT···································································
vi
vii
CHAPTER I: INTRODUCTION··························································· 1
1. Hydrophobic Effect ································································
2. Effects of Ions on Proteins ························································
3. H2O vs. D2O as a Solvent ························································
4. Model Polymers: acrylamides ····················································
5. Model Polymers: ELPs ····························································
1
3
4
5
7
CHAPTER II: ISOTOPE EFFECTS ON HYDRATION ······························ 9
1. Introduction ·········································································
2. Experimental········································································
3. Results and Discussion ····························································
4. Conclusion··········································································
9
9
11
37
CHAPTER III: DIVALENT CATION EFFECTS ON PROTEINS················· 38
1. Introduction·········································································
2. Experimental········································································
3. Results and Discussion·····························································
4. Conclusion···········································································
CHAPTER IV: KOSMOTROPIC EFFECTS OF PHYTIC ACID···················
1. Introduction·········································································
2. Experimental········································································
3. Results and Discussion·····························································
4. Conclusion···········································································
38
39
41
61
62
62
64
64
69
REFERENCES················································································· 70

v
LIST OF FIGURES
Figure 1-1 (a) Structure of poly(dimethyl acrylamide) (b)Structure of poly(diethyl
acrylamide)·····················································································
6
Figure 1-2 Structure of elastin-like polypeptides (VPGVG unit) ······················ 8
Figure 2-1 LCSTs of PNIPAM in Na3PO4 solutions····································· 14
Figure 2-2 LCSTs of PDEA in Na3PO4 solutions······································· 15
Figure 2-3 LCSTs of PDMA in Na3PO4 solutions······································· 16
Figure 2-4 LCSTs of PDEA in NaSCN solutions········································ 17
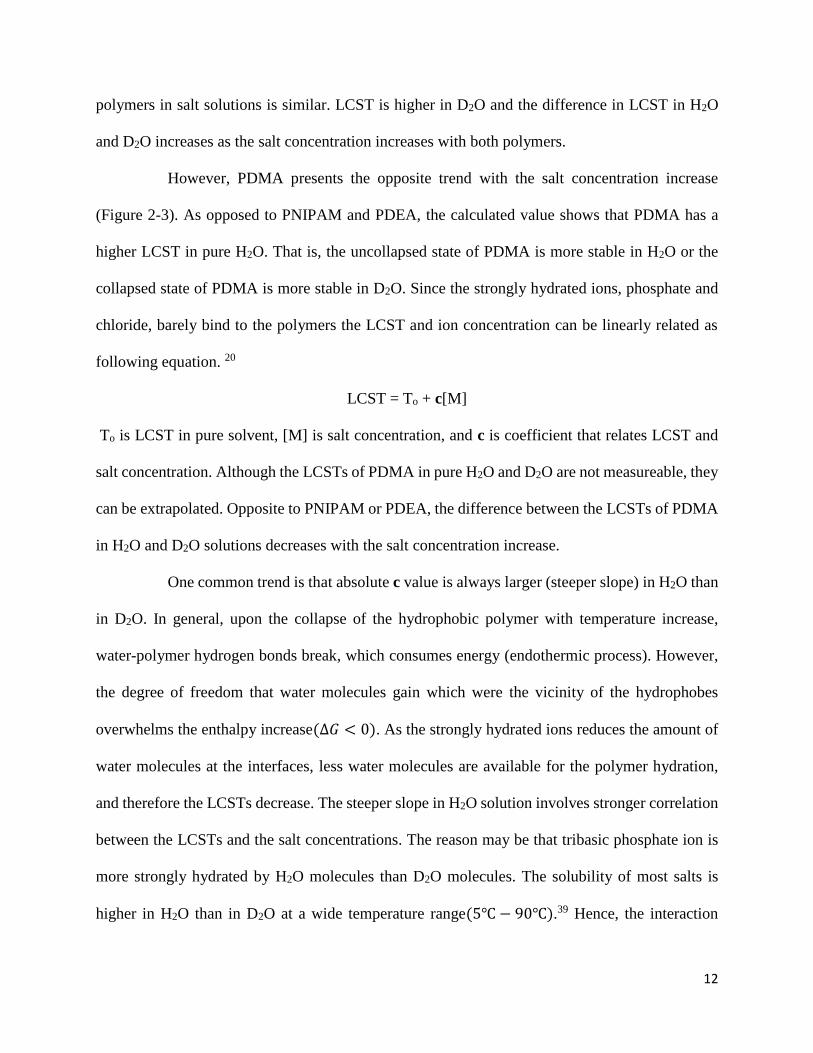
Figure 2-5 LCSTs of PDEA in NaCl solutions··········································· 18
Figure 2-6 LCSTs of PDMA in NaCl solutions··········································· 19
Figure 2-7 Differential scanning calroimetry thermograms of 10mg/mL PDEA
solutions in D2O and H2O····································································
21
Figure 2-8 Differential scanning calroimetry thermograms of 10mg/mL PDMA
solution in D2O and H2O·····································································
22
Figure 2-9 FTIR spectrum of PDEA in H2O at 20℃··································· 25
Figure 2-10 FTIR spectrum of PDEA in D2O at 20℃··································· 26
Figure 2-11 FTIR spectrum of PDMA in H2O at 20℃·································· 27
Figure 2-12 FTIR spectrum of PDMA in D2O at 20℃·································· 28
Figure 2-13 Bulk H2O Raman spectra at various temperature·························· 32
Figure 2-14 SC spectra of PDMA in H2O at various temperature······················ 33
Figure 2-15 Bulk D2O Raman spectra at various temperature·························· 34
Figure 2-16 SC spectra of PDMA in D2O at various temperature······················ 35
Figure 2-17 SC spectra of n-butanol························································ 36
Figure 3-1 The LCSTs of V5A2G3-120 in divalent cation chloride salt solutions·· 42
Figure 3-2 The LCSTs of V5-120 in divalent cation salt solutions···················· 43
Figure 3-3 The LCSTs of various model polymers in CaCl2 solutions················ 44
Figure 3-4 The LCSTs of various model polymers in MgCl2 solutions··············· 45
Figure 3-5 The LCSTs of various model polymers in SrCl2 solutions················· 46
Figure 3-6 V5-120 in different concentrations of CaCl2································· 49
Figure 3-7 V5-120 in different concentrations of MgCl2 ································ 50
Figure 3-8 V5-120 in different concentrations of SrCl2 ································· 51

vi
Figure 3-9 V5-120 in different concentrations of NaCl·································· 52
Figure 3-10 V5A2G3-120 in different concentrations of CaCl2 ························· 53
Figure 3-11 V5A2G3-120 in different concentrations of MgCl2························· 54
Figure 3-12 V5A2G3-120 in different concentrations of SrCl2 ·························· 55
Figure 3-13 V5A2G3-120 in different concentrations of urea··························· 56
Figure 3-14 V5A2G3-120 in different concentrations of NaCl·························· 57
Figure 3-15 V5A2G3-120 at various temperature········································· 58
Figure 3-16 Diagram of the hypothesis for Ca2+ binding to VPGGG unit············ 59
Figure 3-17 Diagram of the hypothesis for Mg2+ binding for V5A2G3-120···········
Figure 4-1 The structure of phytic acid. Blue figures: pKas ·····························
Figure 4-2 The LCST values at three representative pH conditions·····················
Figure 4-3 The LCST of poly(N-isopropyl acrylamide) in sodium phytate
solutions at various pH ························································
Figure 4-4 Correlation of the negative charges of phytate and the slope of the LCST
data ················································································
60
63
66
67
68

vii
LIST OF TABLES
Table 2-1 Summary of LCST measurements in Na3PO4 solution······························· 13
Table 2-2 Normalized intensity at each water peak and its ratio································ 29

viii
ACKNOWLEDGEMENT
I would like to pass many, many thanks to my advisor Prof. Paul Cremer who has been a wonderful mentor
I could ever meet. He was consistently supportive throughout the years with patience and great advising. I
appreciate my committee members as well. Dr. Krebs led me to analytical thinking in analyzing data. Dr.
Showalter taught me to critically think as a chemist. Dr. Ferry helped me to look at a bigger picture as a
scientist and gave me a chance to think how I could contribute to the society. Also, I thank the members of
Cremer group for help, cooperation, feedback, great discussion, and being together. Special thanks to the
Hofmeister family, Dr. Halil A. Okur and Dr. Kelvin Rembert II. They helped me from the first day of the
joining the group until their last day. I expand thanks to Dr. Tinglu Yang, who was always gentle and kind
as a colleague and mentor. Our philosophical discussion about life was a good refreshment out of science.
My friends, Dr. Bora Lee, Moon-Jung Kim, Minjung Chae, and Bumsoo Kim, deserve more than thanks.
They became my State College family. They took the best care of me for years. This achievement may have
not been possible without their care and love. Along with, I would like to thank Father Jaesik Yang, and
the Penn State Korean Catholic Church Community. I appreciate that you prayed for me the whole time.
I also thank my sweet American parents and friends, Dimitri Lazo and Dianne Lazo. They provided me
with home to go for holidays, hugs when I was blue, and precious moments to share (also, lots of American
food). I am grateful to have you.
I pass indescribable appreciation to my dear friend B, who has fully trusted, supported and encouraged me
along the journey.
Endless thanks and love to my dearest mother, Sujin Park, who always respects my choice, and tells me
that she has faith in me. Lastly, I thank my family back in South Korea for support.

1
CHAPTER I: INTRODUCTION
1. Hydrophobic Effect and Hydrophobic Hydration of Proteins
The hydrophobic effect is an important concept in biochemistry to understand the
environment that support the life. Since Kauzmann established the insight that protein folding is
driven by hydrophobic effect in 1959, it has been widely accepted that the hydrophobic effect is
the major force which drives the formation of membrane and micelles, and folding of proteins.1
This idea has been leading many qualitative and quantitative studies and its application.2–7
The hydrophobic effect is a phenomenon that nonpolar substances aggregate to one
another when they are transferred into aqueous solutions. A common example is an oil-water
mixture. At the interface of oil and water, oil molecules disrupt the hydrogen bonding of water.
Consequently, water excludes the oil molecules and the oil is separated from water. In contrast,
some nonpolar molecules preferentially interact with polar molecules when they are in the right
size. For instance, a noble gas is slightly soluble in water, which can be described by the term
hydrophobic hydration. One of the hydrophobic hydration feature is that it is solute size dependent.
When small molecules like noble gases interact with water, the volume of the gas molecule are
small enough to stabilize in the cavities of the water network. This results in solvation of gas in
water. Also, the hydrogen bonding of water is enhanced. In other words, water molecules around
the hydrophobic solutes are more highly ordered than the water molecules in bulk.8 Thus, the
solution becomes enthalpically stable. This hydrophobic hydration is preferred if the volume of a
solute is small enough to afford the thermodynamic cost (< 0.5nm in diameter and ideally
spherical, the curvature area < 1nm2).5,9 However, the larger scale of the solutes ruptures the
interactions between water molecules, and separates the solutes from water.

2
Another feature is that hydrophobic hydration is the temperature dependent.10 For
instance, inert gases can better dissolve in cold water than in hot water. At low temperature, water
molecules can form stronger hydrogen bonding than at high temperature, thus they are more
capable of surrounding the nonpolar solutes than the hot water molecules. As David Chandler
claimed, this argument is valid only if the nonpolar solutes are smaller than 0.5 nm in diameter.
However, proteins which are in a much larger scale undergo denaturation at a low temperature.
This phenomenon is called cold denaturation. Even though Kauzmann argued that the
hydrophobic effect stabilizes the native structure of proteins by the force that buries the
hydrophobic residues and minimizes the contact of the hydrophobic moieties to adjacent water,
he noticed that denaturation of ovalbumin by urea is negatively correlated with temperature below
20ºC. This is the opposite tendency to the experiments conducted above the room temperature.
Therefore, he concluded that the mechanism of cold denaturation is different from that of heat
denaturation.
In the early twentieth century, some models to explain cold denaturation were proposed.
Some of them declared that columbic force or inter/intra-hydrogen bonding were the major
driving forces.11 Finally, it was shown that the hydrophobic hydration is the dominant interaction
that promotes denaturation of proteins, and that ΔH (enthalpy) of protein solvation/unfolding is
positive by calorimetry and thermodynamic analyses.12–15 This proves that the hydrophobic
hydration of protein (unfolded state) is enthalpically favorable whereas dehydration of protein
(folded state) is entropically favorable at the given conditions. At the molecular level, water
molecules that are adjacent to the nonpolar residues of proteins form stronger hydrogen bonding
to each other. It results in the stronger hydration layers. Despite that the water molecules lose

3
some hydrogen bonds, the formation of stronger hydrogen bonding compensates the loss. Once
temperature is increased, the entropic effect exceeds the enthalpic effect. Continuously, it causes
protein folding and increase in entropy of the water molecules that were strictly constrained at the
interfaces. In addition, protein folding accompanies inter/intra-hydrogen bonding, which
contributes to reducing overall the enthalpy change of the system.
2. Effects of ions on proteins
Ions specifically interact with proteins in an aqueous solution, regulating salting-out or
salting-in effects. Salting-out is an effect where the solubility of a certain protein or crystal
substances decreases by salt addition. Salting-in is an effect that increases the solubility of the
substances upon salt concentration increase. The recurring effect is known as the Hofmeister
series.16
N(CH3)4+ > NH4+ > Cs+ > Rb+ > K+ > Na+ > Li+ > Ca2+ > Mg2+
CO32- > SO4
2- > S2O32- > H2PO4
- > F- > Cl- > Br - >NO3
- > I - > ClO4
- >SCN-
The species on the left have the tendency to salt-out proteins whereas the species on
the right of the series tend to salt-in proteins.17 Ions such as SCN- and ClO4- have the low charge-
to-volume ratio, which gives a smaller number of hydration and low surface tension at the
hydrophobic/water interface. In contrast, ions like SO42- and HPO4
2- have the high charge to
volume ratio, which results in a higher number of hydration and high surface tension. At the
water/hydrophobic moiety interface, weakly hydrated ions increase the phase transition
temperature by partitioning to the water/hydrophobes interface.18 Indeed, Rembert et al.
demonstrated that the weakly hydrated ions such as SCN- interact with the backbone of
polypeptide via α-carbon.19 On the other hand, the strongly hydrated ions better exclude water

4
molecules from the hydrophobes. As a result, the temperature of the phase transition of proteins
decreases with the ion concentration increase. In many studies, it has been shown that strongly
hydrated ions linearly decrease the phase transition temperature of a biomolecule as a function of
the ion concentration.14,20 In this work, PO43- was introduced for the phase transition measurement
of the model polymers.
3. H2O vs. D2O as a Solvent
D2O is a common substitute for H2O in protein stability studies. Most physical
properties such as boiling point, compressibility, dielectric constant of H2O and D2O are similar.21–
23 However, other properties between these two solvents are quite different. For example, the
viscosity of D2O is 23% higher, temperature of the maximum density is 7.25℃ higher, and the
heat capacity is 12% higher than of H2O.23–25 These indicate that D2O is more structured and
deuterium bonding is stronger than hydrogen bonding. The hydrogen bond of D2O is about 5%
stronger than hydrogen bond in H2O.25 Additionally, H2O is a better solvent than D2O for most
ions.9 In the most cases, the isotopic effects on the solubility of salts decrease with temperature
increase.
The hydrophobic effects in H2O and D2O has been compared by many experiments in
the hope of understanding hydrophobic hydration interacting with different strengths of hydrogen
bonding. Kreshechk showed that the critical micelle concentration (cmc) of
dedecyldimethylphosphine oxide, nonionic surfactant, was found to be always lower in D2O than
in H2O.26 Also, the enthalpy change of the micelle formation was always greater in D2O solutions
from 15℃ to 40℃.26 Moreover, predictably, the solubility of inert gases is higher in D2O than in
H2O.27 These results support that the hydrophobic hydration is stronger in D2O than in H2O. In

5
addition, Zhang and coworkers measured the ΔH of the phase transition of PNIPAM in H2O and
D2O by differential scanning calorimetry (DSC).20 They found that the ΔH(collapse) of poly(N-
isopropyl acrylamide) (PNIPAM) to be greater in D2O. Similarly, the ΔH upon folding of elastin-
like peptides (ELPs) was found to be greater in D2O than in H2O.14
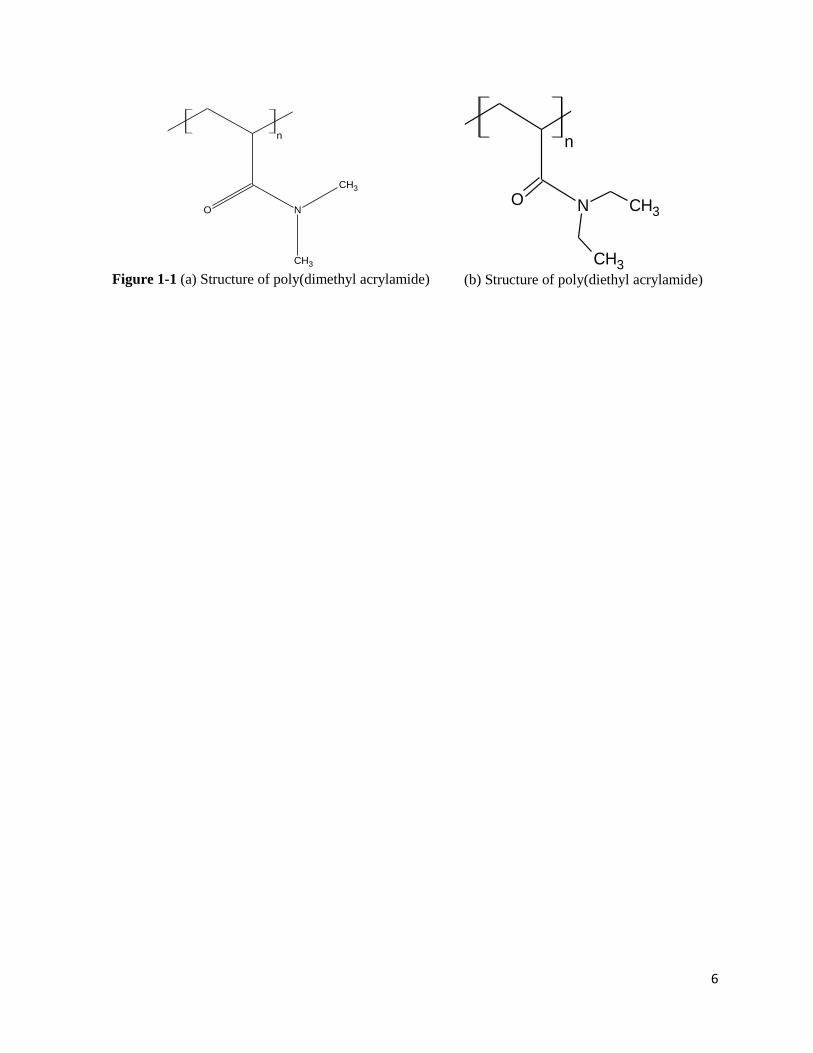
4. Model polymers: acrylmides
The model polymers are employed in order to study the isotope effects of water (solvent)
on hydrophobic collapse. They are poly(dimethyl acrylamide) (PDMA) and poly(diethyl
acrylamide) (PDEA). Their structure is depicted in Figure 1-1 (a) and (b). These models are
specifically chosen to compare their behavior base on hydrophobicity as the only difference is the
length of adjacent alkyl group to amide group.
PDEA undergoes phase transition around 31ºC in pure water. The temperature where
PNIPAM undergoes phase transition is called the lower critical solution temperature (LCST). Its
phase transition is sharp enough to be described as coil-to-globule transition.28,29 Therefore, in
this study, only uncollpased state and collapsed state of model polymers were considered.
PDMA has high solubility in pure water and its LCST is above 100 ºC.30 From the
structure and LCST, one can already find that the hydrophobicity of PDMA is much lower than
PDEA. One method to see the phase transition below 100 ºC is adding salts. Salt addition was
used in this work to lower the LCST of PDMA. Other than salts, LCST of model polymers are
also affected by the property of solvents, pressure, and its concentration.
6
CH3
N
CH3
CH3
O
CH3 n
Figure 1-1 (a) Structure of poly(dimethyl acrylamide)
NO
CH3
CH3
CH3
CH3
n
(b) Structure of poly(diethyl acrylamide)

7
5. Model Polymer: Elastin-Like Peptides (ELPs)
Elastin-like peptides are thermo-responsive proteins that consist of five amino acid
repeats, (VPGXG)n where X can be any specified amino acids except proline and n is the number
of repeats (Figure 1-2). For example, V5A2G3-120 represents polypeptides with 5:2:3 valin, aniline,
and glycine in the X position, whose total peptide number is 600.
Unlike random aggregation of PDEA and PDMA, ELPs form the specific secondary
structures upon folding. The majority of the secondary structure of ELPs is β-turn structure which
the first and fourth amides are connected through hydrogen bonding. Thus, ELPs have stronger
intra/intermolecular interactions.
The LCSTs of ELPs are also affected by the chain lengths, concentration of itself,
solvent, salt identity and concentration.31 In the past several decades, the effects of ion specificity
following the series known as the Hofmeister series on biomolecules have been extensively studied.
The specific anion effects of the Hofmeister series on ELPs were investigated by Cho and
coworkers.31,32 However, the effects of cations of Hofmeister series is not explicitly known.
Particularly, divalent cations draw our attention since they play the vital roles in human body. For
instance, calcium composes the majority of bones and teeth in body, which will be discussed in
the Chapter III.

8
Figure 1-2 Structure of elastin-like polypeptides (VPGVG unit)

9
CHAPTER II: ISOTOPIC EFFECTS ON HYDRATION
1. Introduction
The hydrophobic effect is the fundamental idea in application of drug delivery studies,
membrane bioactivity studies, and applied protein sciences.33–36 It is the driving force of micelle
formation, lipid bilayer formation, and specific three-dimensional protein folding. Hence,
understanding the hydrophobic effects has been a central issue in biophysics, pharmaceutical, and
chemistry.
Briefly, the stability of biopolymers in body is determined by hydrophobic hydration.
Hydrophobic hydration is stabilized at a low temperature on enthalpic ground of water hydrogen
bonding, whereas hydrophobic groups aggregate at high temperature on entropic ground.
In this study, two model polymers, PDMA and PDEA, with different alkyl side chain
lengths were investigated. The length of alkyl groups determines the opposite stability preference
in H2O and D2O. Molecular mechanisms were studied by spectroscopic measurement.
2. Experimental
A. Lower Critical Solution Temperature (LCST) Measurements
The turbidity of the polymer solution was measured on an automated apparatus with a
built-in digital camera that captures and records the real-time images of the light scattering of the
samples as temperature increase at the ramp rate of 0.5℃/𝑚𝑖𝑛 for PDMA 1℃/𝑚𝑖𝑛 for PDEA
(Optimelt MPA 100—automated melting point system). The Meltview software was used to
display and process the data. Each data point represents an average of the six measurements.

10
B. DSC Measurements
Differential scanning calorimeter data was taken with MicroCal VP-DSC at a
temperature ramping rate of 0.5℃/𝑚𝑖𝑛 . Each 5mg/mL, 10mg/mL, and 20mg/mL of polymer
solutions were dissolved and refrigerated at 4℃ at least for 24 hours prior to the measurements.
The 0.25M solutions of Na3PO4 in H2O and D2O were used as reference. For the PDMA, pure H2O
and D2O were used. The samples were cooled to 5℃ lower than their LCSTs and incubated for 30
minutes before each scan. The temperature range was 5℃ below the LCST to 30℃ above the
LCST to cover the wide range of phase transition. The base line of the thermogram was subtracted.
The heat capacity unit (y-aix) was converted into cal/℃ ∙ 𝑔.
C. Amide I Band ATR/FTIR Measurements
Fourier transform infrared (FTIR) spectra were taken with a Nicolet 470 FTIR
spectrometer that was equipped with a Pike Miracle attenuated total reflection (ATR) attachment
with single bounce geometry on a diamond coated ZnSe crystal (Pike Technologies, Madison WI)
and liquid nitrogen MTC detector (Thermo ElectronCorporation, Madison, WI). 20mg/mL of
PDMA and PDEA in pure H2O and D2O solutions were prepared at least 24 hours in advance of
the measurement and stored at room temperature. 64 scans were accumulated per spectrum from
4000cm-1 to 400cm-1 at 2cm-1 resolution. Background spectra were every time before the collection
of the sample spectra and automatically subtracted from the sample spectra by the software. The
D2O solution samples were covered with a plastic cap during the measurement to minimize H/D
exchange at the air/water interface.

11
D. Raman Measurements
In monomer concentration, 250mM of PDMA and PDEA were prepared in H2O and
D2O 24 hours prior to the measurements. The spectra were collected using a home-built back-
scattering micro-Raman system with an air-cooled Ar-ion laser (MellesGriot 514.532 nm). It was
fiber-coupled to an imaging spectrograph (Acton SpectraPro 300i) with a 600 gr/mm grating and
a liquid N2-cooled CCD detector (Princeton Instruments, 1024 X 256 pixel). The spectrum of
helium gas were used as the reference peaks. The spectra were collected twice each measurement
with a total scan time of five minutes per spectra. Each sample were measured 4-6 times.
Background water spectra were taken before the sample spectra each time.
PDEA was purified by inverse transition cycling (ITC). However, the purity did not
reach that the spectra contained aggravated background noise. The SMCR and thermodynamic
analysis was performed using Igor Pro 6.22A (WaveMetrics). The more detailed protocol for
Raman measurements can be found in the literature.37,38
3. Results and Discussion
A. LCST measurements
The phase transition temperatures of PNIPAM and PDEA are similar in H2O and D2O
solutions (Figure 2-1, 2-2). The LCST of PNIPAM is 1℃ higher in D2O and it is ~0.4℃ higher in
D2O for PDEA. Structurally, one would expect that PNIPAM would be more sensitive to
H2O→D2O transfer than PDEA due to the presence of the N-H group. Indeed, PDEA without the
N-H group is less sensitive to the D2O substitution. Curiously, the LCST behavior of these
12
polymers in salt solutions is similar. LCST is higher in D2O and the difference in LCST in H2O
and D2O increases as the salt concentration increases with both polymers.
However, PDMA presents the opposite trend with the salt concentration increase
(Figure 2-3). As opposed to PNIPAM and PDEA, the calculated value shows that PDMA has a
higher LCST in pure H2O. That is, the uncollapsed state of PDMA is more stable in H2O or the
collapsed state of PDMA is more stable in D2O. Since the strongly hydrated ions, phosphate and
chloride, barely bind to the polymers the LCST and ion concentration can be linearly related as
following equation. 20
LCST = To + c[M]
To is LCST in pure solvent, [M] is salt concentration, and c is coefficient that relates LCST and
salt concentration. Although the LCSTs of PDMA in pure H2O and D2O are not measureable, they
can be extrapolated. Opposite to PNIPAM or PDEA, the difference between the LCSTs of PDMA
in H2O and D2O solutions decreases with the salt concentration increase.
One common trend is that absolute c value is always larger (steeper slope) in H2O than
in D2O. In general, upon the collapse of the hydrophobic polymer with temperature increase,
water-polymer hydrogen bonds break, which consumes energy (endothermic process). However,
the degree of freedom that water molecules gain which were the vicinity of the hydrophobes
overwhelms the enthalpy increase(∆𝐺 < 0). As the strongly hydrated ions reduces the amount of
water molecules at the interfaces, less water molecules are available for the polymer hydration,
and therefore the LCSTs decrease. The steeper slope in H2O solution involves stronger correlation
between the LCSTs and the salt concentrations. The reason may be that tribasic phosphate ion is
more strongly hydrated by H2O molecules than D2O molecules. The solubility of most salts is
higher in H2O than in D2O at a wide temperature range(5℃ − 90℃).39 Hence, the interaction

13
between H2O and phosphate molecules is possibly more pronounced than between D2O and
phosphate ions. The LCST measurement comparison is summarized in Table 2-1.
Table 2-1 Summary of the LCST measurements in Na3PO4 solutions
Similar LCST behavior can be also seen in NaCl and NaSCN solutions. Therefore the
phenomenon is non-ion specific. Additionally, it shows that pH and the specific ion may not be
the dominant factors of the trend. Regardless of the specific ion effects, the difference in LCSTs
between H2O and D2O at the same concentration of a certain salt diverged with the concentration
increase. Similarly, the LCSTs of PDMA were measured in NaCl solutions. As it does in sodium
phosphate solution, the ΔLCST(H2O-D2O) decreases with the salt concentration increase.
PDEA PDMA
H2O D2O H2O D2O
LCST (℃) 31.5 < 31.9 165 > 154
| ΔΔ H2O - D2O | increases decreases
| c | (slope) H2O > D2O H2O > D2O

14
0 50 100 150 200 250
12
16
20
24
28
32L
CS
T (
OC
)
Na3PO
4 (mM)
D2O
H2O
1oC
3.5oC
Figure 2-1 LCSTs of PNIPAM in Na3PO4 solutions. PNIPAM is better hydrated in
D2O solution than in H2O solution. The difference of the LCSTs diverges more with
decrease in LCST and increase in salt concentration. c value is -13.90 ℃ 𝑚𝑀⁄ for D2O
and -15.17 ℃ 𝑚𝑀⁄ for H2O.

15
0 40 80 120 160 200
14
16
18
20
22
24
26
28
30L
CS
T (
OC
)
Na3PO
4 (mM)
D2O
H2O
Figure 2-2 LCSTs of PDEA in Na3PO4 solutions. D2O is a better solvent for PDEA as
for PNIPAM. The LCST diverges as salt concentration increases. The observed trend as a
function of temperature and salt concentration resembles that of PNIPAM. c value is -
85.02 ℃ 𝑚𝑀⁄ for D2O and -87.67 ℃ 𝑚𝑀⁄ for H2O.

16
200 220 240 260 280 300 320 340
40
48
56
64
72
80
88L
CS
T (
OC
)
Na3PO
4 (mM)
D2O
H2O
5oC
1.5oC
Figure 2-3 LCSTs of PDMA in Na3PO4 solutions. Contrary to PNIPAM and PDEA,
H2O is a better solvent for PDMA. Also, with increase in salt concentration and
temperature decrease, LCSTs in H2O and D2O solutions immerge. c value is -
362.17 ℃ 𝑚𝑀⁄ for D2O and -375.56 ℃ 𝑚𝑀⁄ for H2O.

17
0.0 0.5 1.0 1.5
26
28
30
32
34
D2O
H2O
LC
ST
(oC
)
NaSCN (M)
Figure 2-4 LCSTs of PDEA in NaSCN solution. Data points are connected with lines as
guide to the eye.
18
0.0 0.5 1.0 1.5 2.0
8
12
16
20
24
28
32
D2O
H2O
LC
ST
(oC
)
NaCl (M)
Figure 2-5 LCSTs of PDEA in NaCl solutions. Data points are connected with lines as
guide to the eye. c value is -11.66 ℃ 𝑚𝑀⁄ for D2O and -12.46 ℃ 𝑚𝑀⁄ for H2O.

19
2.5 3.0 3.5 4.0 4.5 5.0
48
56
64
72
80
88
D2O
H2O
LC
ST
(oC
)
NaCl (M)
3.6oC
1.5oC
Figure 2-6 LCSTs of PDMA in NaCl solutions. Data points are connected with lines as
guide to the eye. c value is -13.90 ℃ 𝑀⁄ for D2O and -15.17 ℃ 𝑀⁄ for H2O.

20
B. Differential scanning calorimetry Thermograms
DSC can be used to follow the enthalpy changes (ΔH) of the phase transition of
polymer collapse. PDEA in pure water and pure heavy water were scanned. The phase transition
temperature were 31.9℃ in D2O, and 31.5℃ in H2O. The higer phase transition temperature in
D2O agrees well with the LCST measurements. The ΔH(collpase) is positive and is ~0.5℃ higer
in H2O (161.0 cal/g in H2O, 155.3 cal/g in D2O). The endothermic process occurs mainly due to
the dissociation of more ordered water molecules around the hydrophonic groups. It indicates that
the hydrophobic collapse of PDEA is entropically driven.
The thermograms in Figure 2-7 have asymmetric profiles. Since Cp is mostly detected
by breaking the hydrogen-bonds around hydrophobic groups the decay of Cp seems to be greatly
engaged in hydrogen bond breaking rate. In this perspective, the dueterium bonds break faster with
the temperature incrase than hydrogen bond. It was claimed in the early 1960s that the number of
deuterium bonds change faster with temperature change than that of hydrogen bonds.25 The
relationship between temperature and the number of hydrogen/deuterium bonds are also seen in
MCR-Raman spectra in Figure 2-13 and 2-15 where strongly hydrogen bonded D2O clusters
diminish faster than H2O with temperature increase.
Strikingly, the PDMA thermograms (Figure 2-9) present ΔH (collapse) ≈0 when the
aggregation of PDMA were observed by the light scattering measurements (LCST measurements).
Hence, the aggregation of PDMA is much less hydrophobic effect than PDEA. It even possibly
implies that PDMA is hydrated not primarily by the hydrophobic hydration of the methyl groups.
Other functional groups such as the carbonyl groups and backbones could play a bigger role in
PDMA, which manipulates the dynamics of the PDMA in solutions. To verify this hypothesis,
further experiments were carried out.

21
30 35 40 45 50 55
0.00
0.05
0.10
0.15
0.20
0.25C
p (
ca
l /
OC
-g)
Temperature (OC)
PDEA (D2O)
PDEA (H2O)H= 1.55
H=1.61
Figure 2-7 Differential scanning calroimetry thermograms of 10mg/mL PDEA solutions in D2O
(green) and H2O (orange). Phase transition themperature of the polymer is slightly is higher in
D2O.

22
65 70 75 80 85 90 95
0.00
0.05
0.10
0.15
0.20
0.25
PDMA (D2O)
PDMA (H2O)
Cp
( c
al /
OC
-g)
Temperature (OC)
Figure 2-8 Differential scanning calroimetry thermograms of 10mg/mL PDMA solution in D2O
(green) and H2O (orange). 250mM tribasic sodium phosphate solution was used as solution and
reference. The phase transition is not observed by DSC under these samples’ conditions.

23
C. FT-IR Spectrum
To probe the molecular mechanisms of the hydration of PDEA and PDMA, FTIR was
employed. Amide bands contain carbonyl stretch, CN stretch, and NH bend.40 The amide I band
of PDEA and PDMA arises only from the carbonyl stretch. The amide I band of model polymers
in each pure H2O and D2O was measured by FTIR.
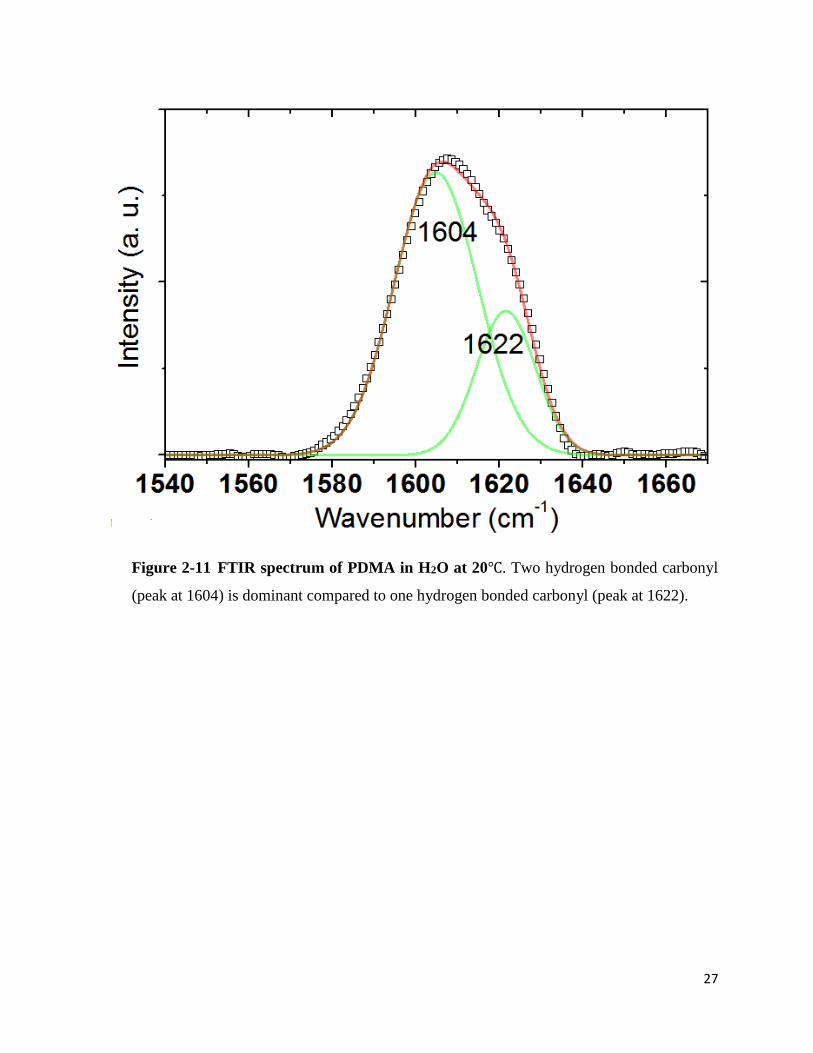
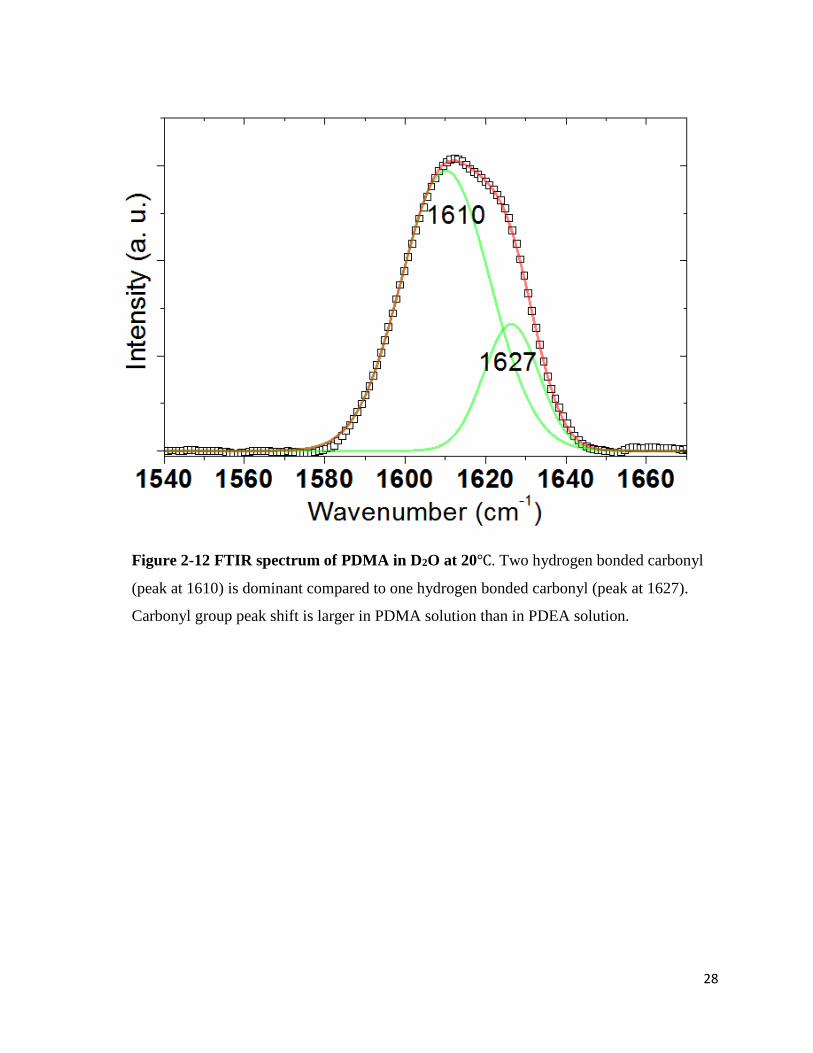
Two peaks were seen in the PDMA spectrum in D2O at 1610cm-1 and 1627cm-1. The
first peak can be assigned to the 2-hydrogen bonded carbonyl and the second peak can be assigned
to the 1-hydrogen bonded carbonyl. In pure H2O, two major peaks appeared at 1604cm-1 and
1622cm-1. One would expect that D2O would form stronger hydrogen bonding with the carbonyl
group since it forms stronger hydrogen bonds in general. Unexpectedly, however, red-shift of
carbonyl stretch in H2O indicates stronger hydrogen bonding between the PDMA carbonyl group
and H2O molecules than D2O molecules. The peak shift was 4cm-1 and 5cm-1 respectively. The
dominant peak was 2-hydrogen bonded carbonyl stretch both in H2O and D2O.
Likewise, two peaks were observed in the PDEA spectrum in D2O at 1600cm-1,
1617cm-1. In pure H2O, two peaks appeared at 1598cm-1 and 1615cm-1. The spectrum also showed
the red-shift upon D2O→H2O solvent transfer. The ratio of two peaks was about 50:50 and the
peak shift was 2cm-1 for both peaks.
Earlier, I hypothesized that the hydrophobic hydration would play a minor role in
PDMA hydration based on the DSC scan result. From the PDMA results, the first peak (2-
hydrogen bonded carbonyl stretch) shift is greater than the shift in PDEA. Besides, the fact that
the first peak dominates in the PDMA spectrum corresponds with the LCST measurements
opposite to PDEA. The LCST of PDMA is presumably higher in pure H2O than D2O. The first
peak shift is smaller in the PDEA spectrum and it is not the most dominant peak or factor in the
24
hydration of the carbonyl group of the polymer. The shift of the second peak, on the other hand, is
about the same in the PDMA and PDEA spectra. Thus, the isotope effects on carbonyl group
hydration is more pronounced in between the carbonyl group and two hydrogen bonded water
molecules.
So far, several experimental results imply that the PDMA has some unique features in
the light of the hydration. However, PDEA and PDMA were not compared in the same condition
in the experiments described above due to the diverse physical properties. The biggest challenge
was to experiment two polymers in pure water at the same temperature. Thus, IR spectrum
collection was not sufficient to illuminate isotope effects of water on hydrophobic hydration of the
model polymers. In the next section, PDMA were examined at various temperature in pure water.

25
Figure 2-9 FTIR spectrum of PDEA in H2O at 20℃. Two hydrogen bonded carbonyl
(peak at 1598) and one hydrogen bonded carbonyl (peak at 1615) arise at similar intensity.
26
Figure 2-10 FTIR spectrum of PDEA in D2O at 20℃. Two hydrogen bonded carbonyl
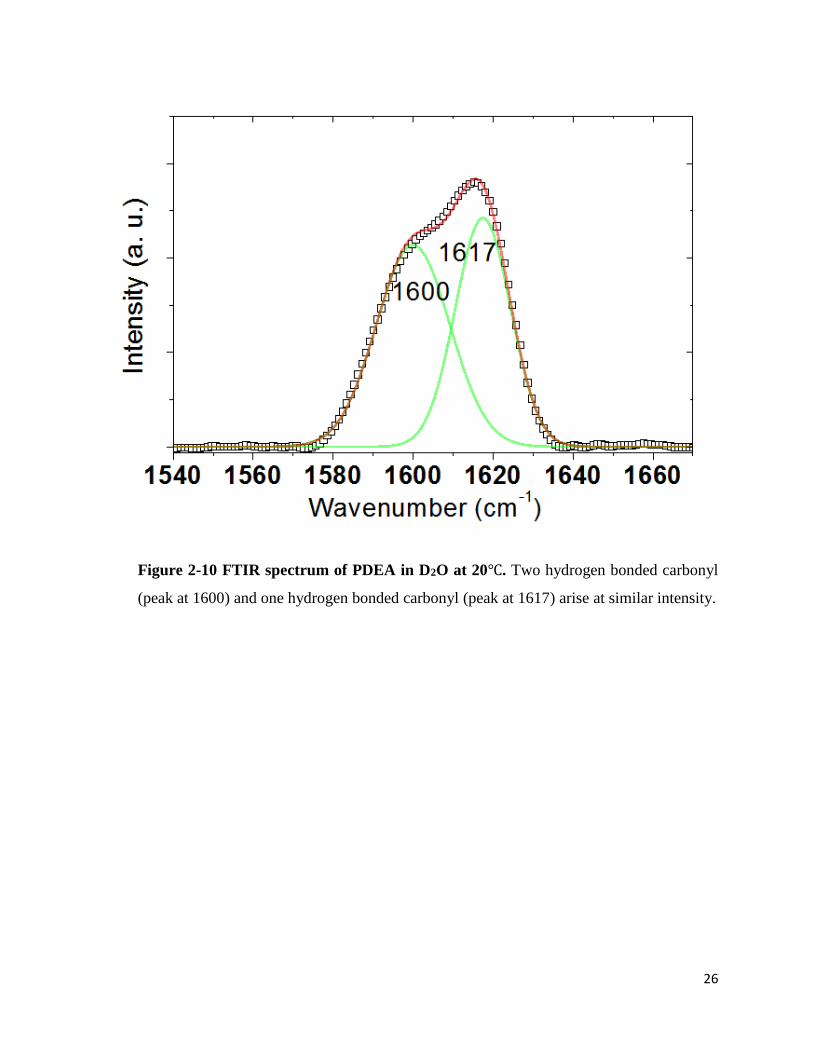
(peak at 1600) and one hydrogen bonded carbonyl (peak at 1617) arise at similar intensity.
27
Figure 2-11 FTIR spectrum of PDMA in H2O at 20℃. Two hydrogen bonded carbonyl
(peak at 1604) is dominant compared to one hydrogen bonded carbonyl (peak at 1622).
28
Figure 2-12 FTIR spectrum of PDMA in D2O at 20℃. Two hydrogen bonded carbonyl
(peak at 1610) is dominant compared to one hydrogen bonded carbonyl (peak at 1627).
Carbonyl group peak shift is larger in PDMA solution than in PDEA solution.

29
D. Raman-MCR Spectrum
Raman scattering measurements with multivariate curve resolution (Raman-MCR)
measurements provides solute-correlated spectra which arises from solute-induced perturbation
of water vibrations.41 This new technique allows to produce spectra of not only perturbed water
molecules by small ions but also of hydrophobic hydration shell.37 The hydration shell of PDMA
was investigated at various temperatures in pure water.
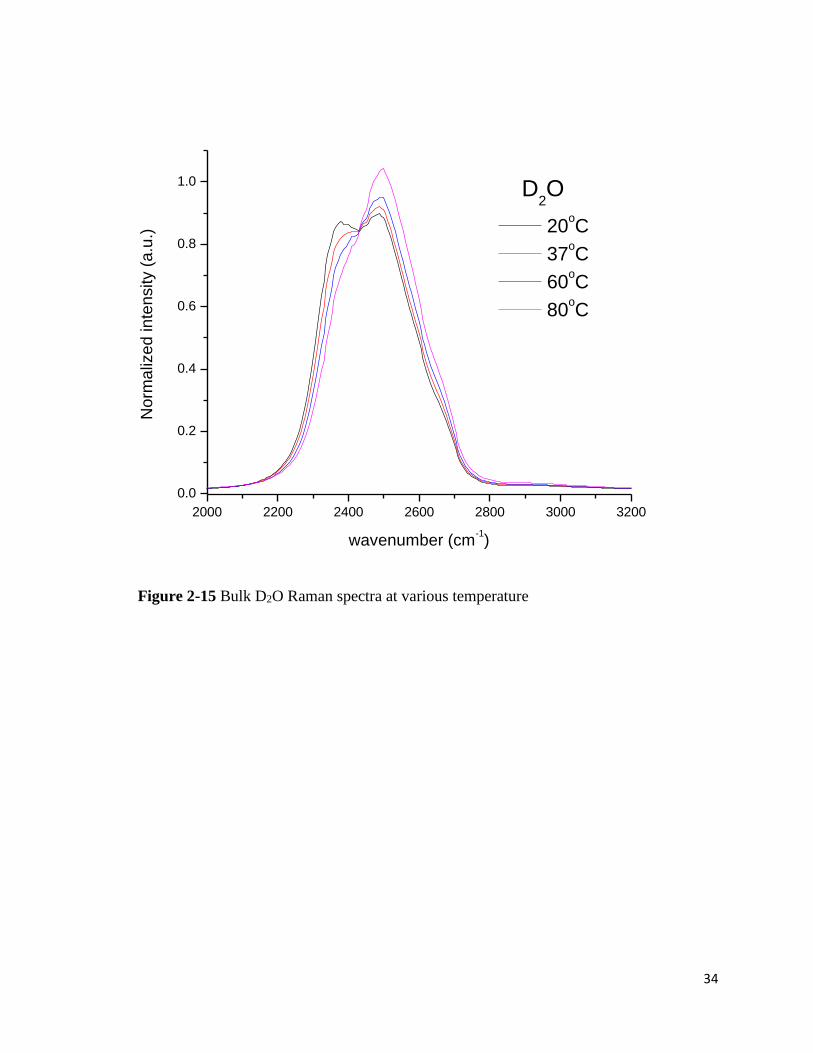
Firstly, pure water isotope effects were compared as a function of temperature. (Firgure
2-13, 2-15). The low frequency component arises from more ordered water clusters. The peak at
higher frequency is attributed to less ordered water clusters42,43. The normalized intensity at each
peak was compared for quantitative analysis (Table 2-2). The ratio of the more ordered water
cluster over less ordered water cluster as functions of temperatures is presented as ΔW. At 20℃
ΔW of D2O is higher than of H2O as D2O has stronger hydrogen bonding. As the temperature
increases, ΔW decreases faster in D2O. In other words, the hydrogen bonding in D2O appear to
break faster than H2O. Also, the peaks slightly blue-shift with temperature. Therefore, temperature
may play an important role in isotope effects of water on the hydrophobic hydration.
Table 2-2 Normalized intensity at each water peak and its ratio
H2O D2O H2O D2O
*Intesity at
more ordered
water peak
* Intesity at
less ordered
water peak
* Intesity at
more ordered
water peak
* Intesity at
less ordered
water peak
ΔW ΔW
𝟐𝟎℃ 0.7525 0.9486 0.8730 0.8993 0.7933 0.9707
𝟑𝟕℃ 0.7324 0.9795 0.8203 0.9203 0.7476 0.8914
𝟔𝟎℃ 0.6859 1.008 0.7730 0.9508 0.6803 0.8130
𝟖𝟎℃ 0.6419 1.068 0.7059 1.0438 0.6010 0.6762
*Intensity is scaled to isobathic point.

30
Sequentially, solute correlated (SC) spectra of PDMA and PDEA were compared at
four temperature. Specifically, the perturbed hydration shell in 2200cm-1 – 2800cm-1 for D2O and
3000cm-1 – 3700cm-1 in H2O were analyzed. Since water spectra were subtracted from the solution
sample spectra, the spectra obtained in the range is presumably caused by the polymer hydration.
The spectra were scaled to CH stretch band area. Hence, the hydration shell area implies the degree
of perturbation by the molecule per C-H in the solution. It is unexpected yet intriguing that the
hydration shell of PDMA is positively correlated with temperature. It is because lately Dor Ben-
Amotz reported SC spectrum of n-butanol in both H2O and D2O as a function of temperature41. As
n-butanol is a hydrophobic molecule, the hydration shell area decreased with temperate increase.
Instead, a new peak arises at a higher frequency than both of the water peaks.
Looking into the spectra of PDMA in H2O, ΔW varies roughly from 0.79 to 0.45 over the
temperature range. In comparison, ΔW in the bulk H2O steadily decreases from 0.79 to 0.60, which
falls in the similar range. Secondly, the solute-correlated (SC) spectra transform at higher
temperatures. A new peak arises at ~3550cm-1, indicating the formation of the more loosely
interacting water molecules around the hydration shell. Besides, the intensity of the hydration shell
increases with temperature, which contrasts to the traditional understanding of the cold
denaturation.5,8,10,44 The hydrophobic hydration is enthalpically stable at lower temperatures. The
hydration water separates from the hydrophobes upon temperature increases due to the entropy
increase.
ΔW of PDMA solution in D2O was also calculated. The peak at the low frequency
rapidly diminishes and the peak of more loosely bound water clusters seem to rise at ~2635cm-1
from 37℃ (Figure 2-15). Compared to the bulk water spectra, the intensity fraction of more
ordered water around PDMA decreases more quickly in D2O.

31
Overall, more structured water clusters at the hydration shell are better maintained in
the presence of PDMA compared to the bulk water. Yet, in D2O/PDMA solution, more structured
water clusters seem to disappear fast with temperature. In turn, the peak of less structured water
clusters rises rapidly. The hydrophobic hydration can be stabilized by the strengthened hydrogen
bonding of water molecules surrounding the hydrophobes. D2O with the stronger hydrogen bonds
stabilizes the uncollapsed/unfolded states of biopolymers in many cases. However, the spectrum
shows that structured D2O molecules stay less at the hydration shell than in bulk. It also shows that
the methyl groups of the model polymer are better stabilized by less structured water clusters of
H2O with temperature increase.
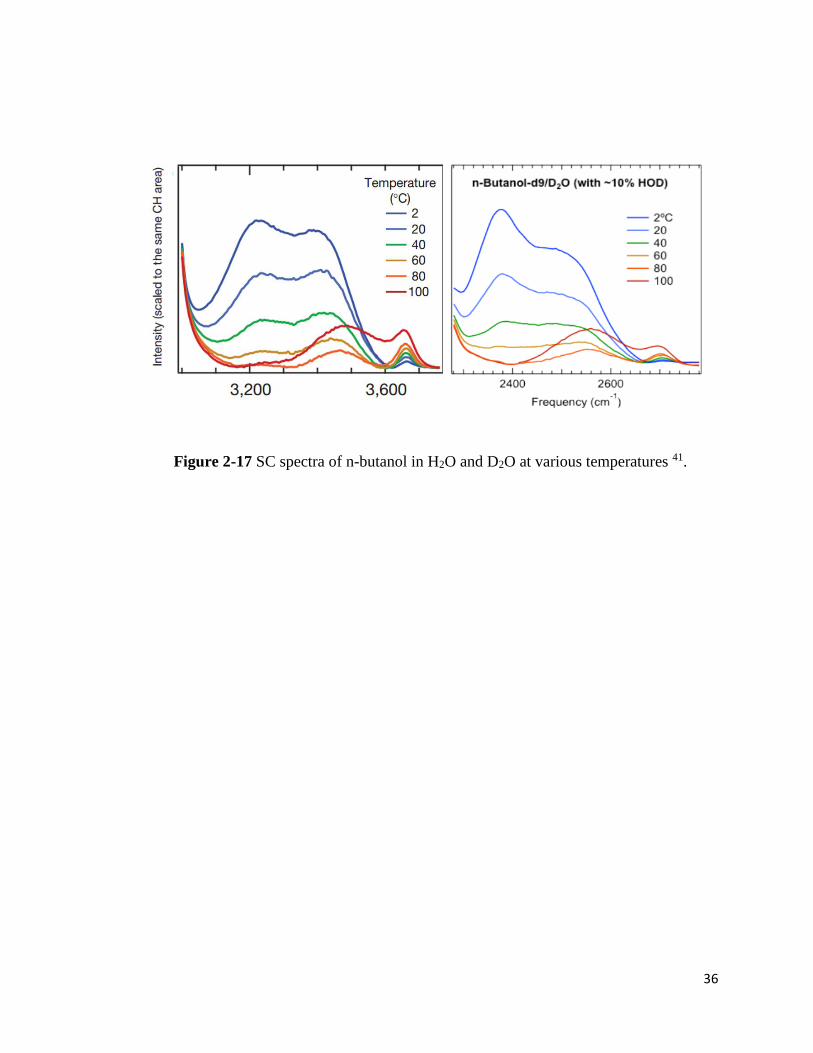
The PDMA spectra were compared with the n-butanol SC spectra from the literature
due to the experimental challenge of the PDEA solution spectrum collection and the current lack
of Raman-MCR data (Figure 2-17).41 When PDMA is less hydrophobic, n-butanol could represent
a hydrophobic molecule. In the SC spectra of n-butanol (in H2O), the hydration water peaks,
especially less ordered water peak at 3200cm-1, are quenched with the temperature increase.
Quickly, it transforms and produces a new peak that suggests loosely bound water clusters at the
hydration shell. The Raman scattering measurement of PDEA contained the strong background
noise which overlaps with the intensity of water.
In the future, the spectra of PDMA with improved signal to noise should be taken. Also,
collecting SC-spectra of acrylamide with longer di-alkyl group would give the direct evidence of
the different hydration aspect of PDMA and PDEA. However, it is dubious that whether the driving
force of the isotope effect of water on hydrophobic hydration could be explained by this method.

32
2800 3000 3200 3400 3600 3800
0.0
0.2
0.4
0.6
0.8
1.0
No
rma
lize
d in
ten
sity (
a.u
.)
wavenumber (cm-1)
20oC
37oC
60oC
80oC
H2O
Figure 2-13 Bulk H2O Raman spectra at various temperature

33
2800 3000 3200 3400 3600 3800
0.0
0.2
0.4
0.6
0.8
1.0
PDMA in H2O
No
rma
lize
d in
ten
sity (
a. u
.)
wavenumber (cm-1)
20oC
37oC
60oC
80oC
Figure 2-14 SC spectra of PDMA in H2O at various temperature
34
2000 2200 2400 2600 2800 3000 3200
0.0
0.2
0.4
0.6
0.8
1.0 D2O
No
rma
lize
d in
ten
sity (
a.u
.)
wavenumber (cm-1)
20oC
37oC
60oC
80oC
Figure 2-15 Bulk D2O Raman spectra at various temperature

35
2000 2200 2400 2600 2800 3000 3200
0.0
0.2
0.4
0.6
0.8
1.0 PDMA in D2O
No
rma
lize
d in
ten
sity (
a. u
.)
wavenumber (cm-1)
20oC
37oC
60oC
80oC
Figure 2-16 SC spectra of PDMA in D2O at various temperature
36
Figure 2-17 SC spectra of n-butanol in H2O and D2O at various temperatures 41.

37
4. Conclusion
The isotope effects of water on hydrophobic hydration of the PDMA and PDEA were
investigated. I suspect that the overall hydration difference originates from the nature of polymers
and isotope effect from temperature. Regardless of the identity of ions and pH, the trend of the
isotope effects remained the same. PDMA seemed to be the less hydrophobic polymer than PDEA.
I speculate that the uncollapsed state of PDMA is better stabilized in H2O at a high temperature
due to the low sensitivity of hydrogen bond strength to heat than deuterium bond. On the other
hand PDEA stabilizes in water mainly through the hydrophobic hydration. The hydrophobic
hydration enhances hydrogen bonding at the hydration shell, resulting in the better uncollapsed
state in D2O. However, the series of data neither advocate nor disprove my hypothesis. Comparing
PDMA and PDEA may not reveal why some hydrophobic hydration is more stable in H2O than in
D2O. Also, the conditions of the experiment need to be simplified. In the future, polyethylene
glycol (PEG) could be used. PEG with 900K shows phase transition at high temperature without
salts, but its LCST is higher in H2O. PEG will be an interesting polymer to study in order to figure
out the relationship between hydrophobic effect and hydrogen bonding strength.
38
CHAPTER III: DIVALENT CATIONS EFFECTS ON PROTEINS
1. Introduction
Calcium is one of the most abundant inorganic element in human body. An adult
contains approximately 1kg of calcium in body.45 99% of calcium is stored in bones and teeth as
hard tissue. The rest is in serum, plasma and cells. Calcium ion in plasma is only about 1.7mM
and [extracellular]/[intracellular]=104-105 in the scale of micro to nanomolar.46 Approximately
60 - 70 % of bone is inorganic calcium deposits which are hydroxyapatite (Ca10(PO4)6(OH)2) and
some amorphous calcium phosphate. 30 - 40 % is organic component which is mostly collagen
protein.47–49 Even though the majority of calcium is in skeleton form, calcification, the process of
accumulation of calcium salts in a body, is not clearly understood at the molecular level.
Abnormal calcification is a critical issue since it can occur on soft tissues and can cause health
issues such as kidney stones, gall stones, and heterotopic ossification. Besides, calcium related
diseases are becoming more common these days50.
Abnormal biological calcification can be caused by the interaction of imbalanced
calcium and proteins in serum. It is known that calcium ions can be caught by elastic fibers or
mucopolysarccharides. However, the mechanism of abnormal calcification also remains elusive.
In order to provide fundamental insight of calcification in human body, it is necessary to
understand calcification in a molecular level. Besides, understanding the mechanisms may allow
chemistry to contribute to biomedical and bioengineering applications.
It is believed that bone is formed by the following process through osteoblast, involving
collagen and matrix proteins by the following reaction: 51
6 HPO42- + 2 H2O + 10 Ca2+ ⇌ Ca10(PO4)6(OH)2 + 8 H+

39
Nonetheless, this mineralization course cannot rationalize the hydronium ion removal
and pH maintenance in osteoblast.
Herein, I am interested in investigating the effect of ion on the hydrophobic collapse
and the secondary structure formation of ELPs specific interactions between calcium ion and
elastin-like polypeptides (ELPs). ELPs contain type II β-turn structure with which every first and
fourth residues are hydrogen bonded. ELP is an appropriate model protein in this study as β-turn
structured collagen in body is preferred on the aspect of proline hydroxylation.
Recently, Okur et al. spectroscopically and quantitatively demonstrated that
Hofmeister series cations such as Ca2+, Mg2+ and Li+ can only weakly bind to carbonyl group of
butyamide monomer in an aqueous solution.52 However, application of the knowledge from this
study to biology has limitation since their biomolecule is a simple monomer. In addition, at the
interface where calcium phosphate inorganic mineral is formed, calcium is perhaps locally greatly
concentrated from millimolar possibly up to molar range.
Accordingly, in this work I investigated specific divalent cations effects on ELPs
by using high concentration of salt solutions. Surprisingly, I found distinct interactions between
ELPs and divalent cations.
2. Experimental
A. ELP Preparation
The pET-25b(+) plasmids were employed to construct ELPs by directional recursive
ligation (RDL) as described above and literature.53 In the solutions of supplemented medium
(TBdry) culture with ampicillin, the plasmids in BLR/DE3 E. coli was expressed at 37℃ for 24

40
hours. The E. coli was sonicated twice and ELPs underwent inverse transition cycling (ITC) twice
to be further purified. The concentration of purified ELP solutions were determined by measuring
absorbance at 280nm where ɛ =5690 M-1 cm-1. The ELP solutions were dialyzed in deionized
water for two days with fresh water twice a day to remove residual salts in the solution. The
samples were dried by speed vacuum concentrator at 54℃ for 2 hours and stored at room
temperature until use.
B. LCST Measurements
The LCSTs were measured as described in Chapter II experimental section. The
concentration of V5A2G3-60, V5A2G3-120, V5A2G3-330, VG-128, V5-120 was 10ml/mL.
measurements were made from 4 to 6 time for each data point. Each concentration of CaCl2,
MgCl2, and SrCl2 solution was added to the dry ELP sample to make the ELP concentration
10mg/mL.
C. Circular Dichroism Spectra Measurements
The measurement was performed on a Jasco-1500 between 200nm-270nm. Data interval was
0.025nm, band width was 1nm, and scanning speed was 50nm/min with 4 accumulation signals.
The ELP concentration was 1mg/ml. The measurement was made up to 5 times. The conversion
of CD signal was done by following the equation below.
[𝜃]𝑜𝑏𝑠𝑑 =100∆𝑚°
𝐶𝑛𝑙
∆𝑚° is sample CD signal-background CD signal, C is the polypeptide concentration (mM), n is
the number of residues in the polypeptide, and l is the path length (cm).54

41
3. Results and Discussion
A. LCST Measurements
With high concentration of CaCl2, MgCl2, and SrCl2 solutions, the LCST trend of ELPs
is significantly different from what has been shown in literature to date. As expected, high
concentration of ions causes a salting-out effect on polymers by hydrating water molecules around
water/biopolymer interfaces and promoting hydrophobic effect collapse. In CaCl2 solutions, the
LCST steadily decreases and sharply drops after 2.8M (Figure 3-1, 3-3). In MgCl2 solutions, the
LCST of V5A2G3-120 decreases with salt concentration up to 1.6M (Figure 3-1, 3-4). Surprisingly,
in the range of 1.6M – 4.0M LCST increases back, which indicates salting-in effect. The LCST
trend linearly decreases with concentration in SrCl2 solutions (Figure 3-1, 3-5). The effect of
chloride is not attributed to abrupt drop and increase of LCST in CaCl2 and MgCl2 solutions since
chloride binding to biopolymer is negligible and it only linearly decreases the LCSTs.19,20,32 Also,
linear behavior is an indicator of non-specific behavior of Sr2+ on ELPs. Hence, this data is the
macroscopic evidence of that Mg2+ and Ca2+ have specific effects on ELPs. More interestingly,
Mg2+ specific effect was not distinguished from Ca2+ with V5-120 which is more hydrophobic
polypeptides than V5A2G3-120 (Figure 3-2). Hydrophobicity of the two polypeptides can be
measured and compared by circular dichroism. More hydrophobic ELP, V5-120 has more random
coil and less secondary structure upon collapse than V5A2G3-12014. To study cation specific effects
on the secondary structure of the ELPs, circular dichroism spectra were collected.

42
0.0 0.5 1.0 1.5 2.0 2.5 3.0 3.5 4.0
22
24
26
28
30
32
34
36
38
40
42
44LC
ST
(OC
)
Salt Concentration (M)
CaCl2
MgCl2
SrCl2
wild-120
Figure 3-1 The LCSTs of V5A2G3-120 in divalent cation chloride salt solutions. Data
points are connected with lines as a guide to the eye.
V5A2G3 -120

43
0.0 0.5 1.0 1.5 2.0 2.5 3.0 3.5 4.0 4.5
0
5
10
15
20
25
30
LC
ST
(OC
)
Salt Concentration (M)
CaCl2
MgCl2
SrCl2
V5-120
Figure 3-2 The LCSTs of V5-120 in divalent cation salt solutions. Data points are
connected with lines as a guide to the eye.

44
0.0 0.5 1.0 1.5 2.0 2.5 3.0 3.5
15
20
25
30
35
40
45
50 VG-128
V5A
2G
3-60
V5A
2G
3-120
V5A
2G
3-330
V5-120
LC
ST
(oC
)
CaCl2 concentration(M)
Figure 3-3 The LCSTs of various model polymers in CaCl2 solutions. The LCST
behavior is similar in V5A2G3 type ELPs regardless of the chain length, and VG-128. Only
V5-120 displays different trend.

45
0.0 0.5 1.0 1.5 2.0 2.5 3.0 3.5 4.0
10
15
20
25
30
35
40
45
50
VG-128
V5A
2G
3-60
V5A
2G
3-120
V5A
2G
3-330
V5-120
LC
ST
(oC
)
MgCl2 concentration (M)
Figure 3-4 The LCSTs of various model polymers in MgCl2 solutions. The LCST behavior is
similar in V5A2G3 type ELPs regardless of the chain length, and VG-128. Only V5-120 displays
different trend.

46
0.0 0.5 1.0 1.5 2.0
5
10
15
20
25
30
35
40 V5-120
V5A
2G
3-120
LC
ST
(oC
)
SrCl2 concentration (M)
Figure 3-5 The LCSTs of various model polymers in SrCl2 solutions. Since the LCST behavior
is similar in V5A2G3 type ELPs regardless of the chain length, and VG-128, only V5-120 and
V5A2G3-120 were measured to observe LCST trend with SrCl2.
V5A2G3-120 and V5-120 were chosen in order to investigate the relation of specific
cation effects on polymers with different degree of hydrophobicity. V5A2G3 type ELPs showed the
same trend in salt solutions regardless of the chain length.
47
B. Circular Dichroism Spectra
The secondary structure of the ELPs was probed by circular dichroism in 200nm-
240nm range. Type II β-turn gives rise to an absorbance peak around 212nm as a positive band.
This peak comes from 𝑛 → п ∗ transition of the amide bond.
V5-120 spectra is similar in trend in all salt solutions (Figure 3-6 ~ 3-9). As the Ca2+
concentration increases, the peak at 212nm increases. The more ions are hydrated around the
ELP/water interface, the ELPs collapse and the more β-turn structure is pronounced. This appear
to accord with the LCST measurements. In the MgCl2 and SrCl2 solutions, the peak at 212nm
increases, which indicates that more β-turn is formed with the LCST decrease. The solution of V5-
120 with more than 2M salt concentration are not shown since they produced poor signal to noise
spectra due to the high salt concentration.
V5A2G3-120 in CaCl2, however, shows the incredible secondary structure increase as
Ca2+ concentration increases (Figure 3-10). When the Mg2+ concentration increases, the β-turn
peak seems to disappear (Figure 3-11). The peak at 212nm is lost and it flattens out with more
salts. The rise of β-sheet or the increase of random coil portion may give a flat feature to the
spectrum. However a clear interpretation is difficult since the peak is lost. What is obvious in these
spectrum is that high Mg2+ concentration does not promote β-turn structures in V5A2G3-120.
Correlating this to the LCST data, it is a reasonable since the LCSTs increase with the
MgCl2 concentration increase. From LCST data, it seems that ELPs salt-in by Mg2+. Like
mentioned earlier, well-hydrated metal ions only weakly binds to carbonyl group of amide of
butyramide monomer.52 However, my preliminary aresult implies a possibility that Ca2+ and Mg2+
may specifically bind to V5A2G3-120 at high concentrations. My hypothesis is that Ca2+ binds to
the multiple carbonyl groups of the backbone. The diagrams of hypothesis are shown in Figure 3-
16 and 3-17. When the bulk concentration is increased, the number of ions at the polypeptide

48
backbone/water interface also increases. Hence, ions like Ca2+ are more likely to interact with the
carbonyl groups. Moreover, Ca2+ can ligate with 6 to 8 ligands, preferably oxygen atoms in body.55
Mg2+ has the smaller coordination number than Ca2+ at all cases. Also, Mg2+ requires higher energy
to be dehydrated. When Ca2+ would be more easily dehydrated and more likely to interact with
multiple carbonyl groups and promotes the salting-out effect, Mg2+ would be more difficult to
dehydrate and tend to interact with one carbonyl group and promotes the salting-in effect.

49
200 205 210 215 220 225 230 235 240
-22
-20
-18
-16
-14
-12
-10
-8
-6
-4
-2
0
θ x
10
3 (
de
g. cm
2/d
mo
l)
wavelength (nm)
Ca 0.0M
Ca 0.5M
Ca 1.0M
Figure 3-6 V5-120 in different concentrations of CaCl2

50
200 205 210 215 220 225 230 235 240
-22
-20
-18
-16
-14
-12
-10
-8
-6
-4
-2
0
θ x
10
3 (
de
g. cm
2/d
mo
l)
wavelength (nm)
Mg 0.0M
Mg 0.5M
Mg 1.0M
Figure 3-7 V5-120 in different concentrations of MgCl2

51
200 205 210 215 220 225 230 235 240
-20
-18
-16
-14
-12
-10
-8
-6
-4
-2
0θ
x1
03 (
de
g. cm
2/d
mo
l)
wavelength (nm)
Sr 0.0M
Sr 0.5M
Sr 1.0M
Sr 1.5M
Figure 3-8 V5-120 in different concentrations of SrCl2

52
200 210 220 230 240
-20
-18
-16
-14
-12
-10
-8
-6
-4
-2
0
θ x
10
3 (
de
g. cm
2/d
mo
l)
wavelength (nm)
NaCl 0M
NaCl 0.5MM
NaCl 1.0M
Figure 3-9 V5-120 in different concentrations of NaCl

53
200 205 210 215 220 225 230 235 240
-16
-14
-12
-10
-8
-6
-4
-2
0
θ x
10
3 (
de
g. cm
2/d
mo
l)
wavelength (nm)
Ca 0M
Ca 0.5M
Ca 1.0M
Ca 2.0M
Figure 3-10 V5A2G3-120 in different concentrations of CaCl2

54
200 205 210 215 220 225 230 235 240
-14
-12
-10
-8
-6
-4
-2
0
θ x
10
3 (
de
g. cm
2/d
mo
l)
wavelength (nm)
Mg 0M
Mg 0.5M
Mg 1.0M
Mg 2.0M
Mg 3.0M
Figure 3-11 V5A2G3-120 in different concentrations of MgCl2
55
200 205 210 215 220 225 230 235 240
-11
-10
-9
-8
-7
-6
-5
-4
-3
-2
-1
0θ
x1
03 (
de
g. cm
2/d
mo
l)
wavelength (nm)
Sr 0M
Sr 0.5M
Sr 1.0M
Sr 1.5M
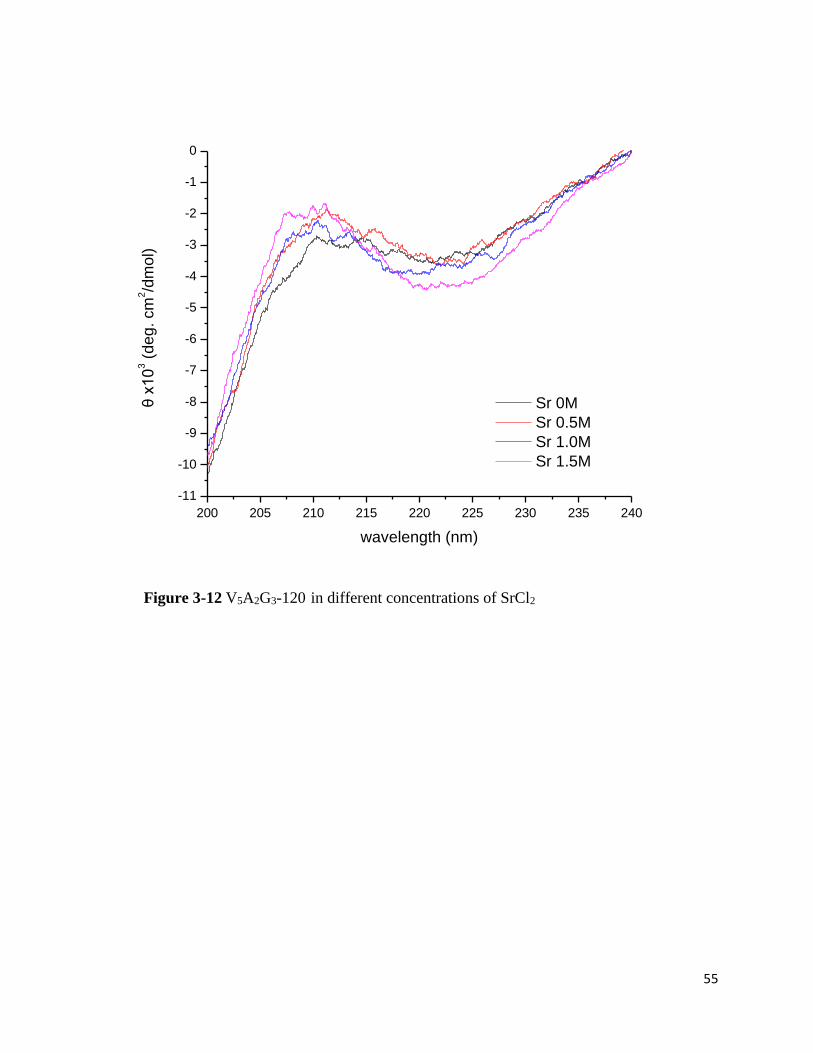
Figure 3-12 V5A2G3-120 in different concentrations of SrCl2

56
205 210 215 220 225 230 235 240 245 250 255 260
-12
-10
-8
-6
-4
-2
0
θ x
10
3 (
de
g. cm
2/d
mo
l)
wavelength (nm)
Urea 0M
Urea 1M
Urea 2M
Urea 4M
Urea 6M
Figure 3-13 V5A2G3-120 in different concentrations of urea
Urea is a well-known denaturant. It increases LCSTs with concentration increase. Peak
at 212nm steadily decreases with urea concentration.

57
200 205 210 215 220 225 230 235 240
-14
-12
-10
-8
-6
-4
-2
0θ
x1
03 (
de
g. cm
2/d
mo
l)
wavelength (nm)
NaCl 0M
NaCl 0.5M
NaCl 1.0M
Figure 3-14 V5A2G3-120 in different concentrations of NaCl
The spectrum with NaCl was measured for comparison purpose. NaCl only linearly
decreases the LCSTs. The peak at 212nm hardly shift with decrease in the LCST or increase in the
salt concentrations.

58
200 210 220 230 240 250 260
-6
-5
-4
-3
-2
-1
0θ
x1
03 (
de
g. cm
2/d
mo
l)
wavelength (nm)
20C
70C
120C
170C
220C
270C
320C
370C
420C
Figure 3-15 V5A2G3-120 at various temperature. The spectra remain fairly constant at
all temperature range. The spectra were smoothed for comparison.
198nm indicates the random coil of ELPs. This is from the п → п ∗ transition of the
amide bond. This transition usually more strongly absorbs light than the 𝑛 → п ∗ transition.
Unfortunately, this range was excluded in these measurements because chloride absorption was so
high below 200nm that signal was saturated. The spectrum below 200nm was indiscernible from
the background. The temperature effects were minimized by lowering the temperature far below
the polymer’s phase transition temperatures. The cell temperature was kept at 0℃ for all the
measurements for V5-120 and 5℃ for V5A2G3-120. The background was measured at the same
temperature and salt concentrations. The background was subtracted from the polymer spectrum.
The data is reported as mean residue ellipticity.

59
Figure 3-16 Diagram of the hypothesis for Ca2+ binding to VPGGG unit

60
Figure 3-17 Diagram of the hypothesis for Mg2+ binding for V5A2G3-120

61
4. Conclusion
The specific binding of divalent cations on ELPs with β-turn structures was
investigated. V5A2G3-120 forms more β-turn structures in a highly concentration calcium chloride
solutions. The LCST data shows salting-out effect of Ca2+ and salting-in effects of Mg2+.
Molecular level mechanism was not revealed by CD spectrum.
I hypothesize that Ca2+ binds to the multiple carbonyl groups of the proteins once the
bulk solution is saturated. Ca2+ may bind to the multiple carbonyl groups of the proteins, enhancing
the secondary structure. Mg2+may bind to the single carbonyl group due to higher emery boundary
for dehydration.
To validate the hypothesis, one can investigate whether Ca2+ is trapped in the collapsed
state. This could possibly achieved by precipitating the ELPs in a high concentration of CaCl2
solution, and by analyzing the precipitate with atomic absorption spectrometer. To examine
molecular level hypothesis, carbonyl group of the ELPs could be probed by Fourier transform
infrared spectrometer. If Ca2+ is associated with carbonyl group, amide I band should shift.

62
CHAPTER IV: KOSMTROPIC EFFECT OF PHYTIC ACID
1. Introduction
1, 2, 3, 4, 5, 6 hexakis (di-hydrogen phosphate) myo-inositol or phytic acid is an
interesting natural occurring molecule (Figure 4-1). Its primary role is known as phosphorous and
inositol storage in plant seeds, grains and animal cells56–58. It has been reported that phytic acid
has anticarcinogenic/antineoplastic properties and antioxidant functions59–61. In addition, it has
been used in many industrial applications. Most of the applications are carried out in solution forms
where phytic acid are in its salts form, phytate. Although phytic acid seems to benefit medical
community and other industries, it is anti-nutrient in agriculture62–64. It has been believed that
phytate inhibits protein digestion forming complex with metal ions65–67.
Recently, an alternative aspect of phytate is recognized, which phytate is a strong
kosmotrope ion68–70. As shown in earlier chapters, kosmotropic ions or strongly hydrated ions with
a high ratio of charge to volume decrease the solubility of proteins. More curiously, phytic acid
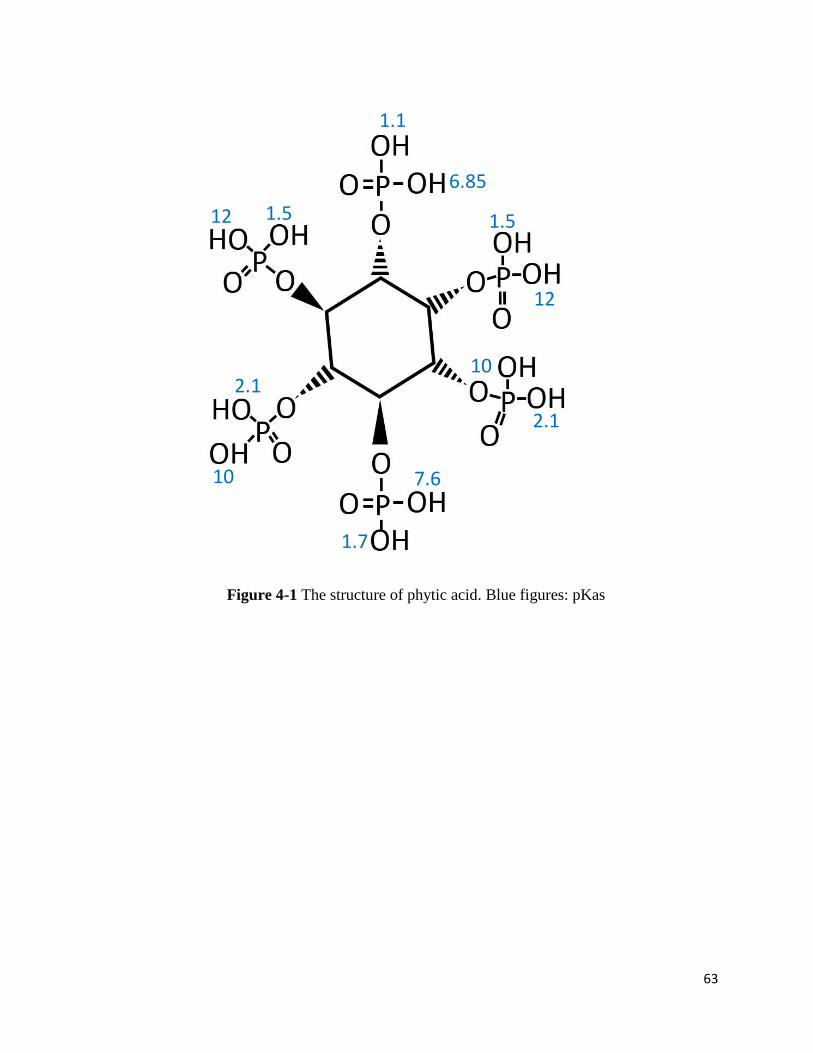
has 12 protons, therefore, 12 pKas (1.1, 1.5, 1.5, 1.7, 2.1, 6.85, 7.6, 10, 10, 12, 12)71. This property
should alter phytic acid from a weak kosmostrope to strong kosmotrope depending on pH.
In this short chapter, the kosmotropic effects of phytate as a function of pH was
investigated. At a low pH, phytate has a smaller amount of negative charges, which should result
in a weak kosmotropic effect. At a high pH, phytate is deprotonated, obtaining a large amount of
negative charges. It would manifest a stronger kosmotrope effect than any kosmotropes in
Hofmeister series.
63
Figure 4-1 The structure of phytic acid. Blue figures: pKas
1.1
1.5
1.1
1.5
1.1
2.1
1.1
1.5
2.1
1.1
1.5
1.7
1.1
1.5
6.85
1.1
1.5
7.6
1.1
1.5
10
1.1
1.5
10
1.1
1.5
12
1.1
12
1.1

64
2. Experimental
Poly(N-isopropyl acrylamide) M.W. 19,000 was lyophilized and prepared as described
in chapter I. Phytic acid sodium salt hydrate from rice (Sigma-Aldrich) was used for solution
preparation. For each pH condition, 10mL of 100mM stock solutions were prepared. They were
diluted by 10mM sodium phosphate buffer at the same pH condition. For example, 0mM sample
only contains 10mM sodium phosphate. The LCST was measured as the previous chapters at pH
1.5, 2.2, 7.2, 8.2, 9.0, 10.5, 11.5, and 12.6. Each data point represents one measurement.
3. Results and Discussion
As Expected, the LCST of PNIPAM linearly decreases as a function of sodium phytate
concentration (Figure 4-2). In the Hofmeister series, kosmotropes reduce the solubility of proteins
by dehydrating the microenviroment of proteins. The linear correlation (slope of the graph) of the
LCST and the salt concentration is a typical characteristic of a kosmotrope. Intriguingly, the
decrease in LCST becomes more rapid with pH increase. At all pH conditions, the slope does not
appear to linearly relate with the pH values (Figure 4-3). Since the pKa of phytate is also sporadic
in numbers, the number of charges at each pH were correlated with the slope of the LCST data
(Figure 4-4). Overall, the slope is steeper as the negative charge gets higher. In the pH range
between 7 and 11.5, the slope values remain constant. This could be simple fluctuation of the
measurement from the sample preparation. Also, the protonation constant may not match in the
experimental set up since the constants are sensitive to experimental conditions72–74. Another
possibility is that PNIPAM collapase mechanism at these pHs may involve the interactions among
phytate, cations, and PNIPAM. However, it is too early to picture specific interactions.

65
The result demonstrated the kosmotropic effects of phytic acid. It also showed the effects
can be modified as a function of pH. In order to confirm the trend, more measurement must be
taken. If the trend strictly agree with the amount of phytate charges, the LCST measurement can
potentially be used as a means to measure the pH of phytate. In other words, knowing the pH of a
certain protein with phytate at a given condition, it would be possible to estimate the solubility of
the protein..

66
0 10 20 30 40 5016
20
24
28
32 pH 1.5
pH 7.2
pH 12.6
LC
ST
(oC
)
Sodium Phytate Concentration (mM)
Figure 4-2 The LCST values at three representative pH conditions

67
0 10 20 30 40 5016
18
20
22
24
26
28
30
32buffer: phosphate 10mM
polymer: PNIPAM 19K 10mg/ml
pH 1.5
pH 2.2
pH 7.2
pH 8.2
pH 9
pH 10.5
pH 11.5
pH 12.6
LC
ST
(OC
)
Sodium phytate (mM)Figure 4-3 The LCST of poly(N-isopropyl acrylamide) in sodium phytate solutions at
various pH

68
Figure 4-4 Correlation of the negative charges of phytate and the slope of the LCST data
2 4 6 8 10 12 14
2
4
6
8
10
12 Negative Charges of Phytate
Ne
ga
tive
Ch
arg
es
pH
120
160
200
240
280
Pnipam-phytate slope
Pn
ipa
m-P
hyta
te S
lop
e
69
4. Conclusion
Kosmotropic effect of phytic acid on PNIPAM collapse was investigated as a function of
pH. The number of charges were correlated with the slope of the LCST data. Overall, it appears to
agree. Yet, the measurements must be repeated to confirm the result. Since the pH affects the
LCSTs of proteins by phytic acid, one information (of pH and solubility) can be used to determine
the other.
In the future, the cation effects on the ability of phytic acid to precipitate proteins should
studied. With high negative charge on one molecule, phytic acid must electrostatically attract
counter cations. Some cations in the Hofmeister series and the Irving-Williams series are crucial
element in body. Hence, exploring specific ion effects with phytic acid can also contribute to
agriculture, medical science, and industry for applications. Another interesting work is to compare
the kosmotropic effect of phytic acid inositol pentakisphosphate, inositol triskisphosphate, and
phosphate.

70
References
(1) Kauzmann, W. In Advances in Protein Chemistry; C.B. Anfinsen, M. L. A., Kenneth Bailey and John T. Edsall, Ed.; Academic Press, 1959; Vol. 14, pp 1–63.
(2) Guo, Z.; Zhou, F.; Hao, J.; Liu, W. J. Am. Chem. Soc. 2005, 127 (45), 15670–15671. (3) Wei, P.; Cook, T. R.; Yan, X.; Huang, F.; Stang, P. J. J. Am. Chem. Soc. 2014, 136 (44), 15497–15500. (4) Dill, K. A.; Truskett, T. M.; Vlachy, V.; Hribar-Lee, B. Annu. Rev. Biophys. Biomol. Struct. 2005, 34 (1),
173–199. (5) Chandler, D. Nature 2005, 437 (7059), 640–647. (6) Némethy, G.; Scheraga, H. A. J. Chem. Phys. 1962, 36 (12), 3401–3417. (7) Sharp, K. A.; Madan, B. J. Phys. Chem. B 1997, 101 (21), 4343–4348. (8) Dill, K. A. Biochemistry (Mosc.) 1990, 29 (31), 7133–7155. (9) Stillinger, F. H. Science 1980, 209 (4455), 451–457. (10) Dill, K. A.; Bromberg, S. Molecular Driving Forces: Statistical Thermodynamics in Biology, Chemistry,
Physics, and Nanoscience, 2nd Edition, 2nd edition.; Garland Science: London ; New York, 2010. (11) Privalov, P. L. Crit. Rev. Biochem. Mol. Biol. 1990, 25 (4), 281–306. (12) Pl, P.; Sj, G. Adv. Protein Chem. 1987, 39, 191–234. (13) Makhatadze, G. I.; Privalov, P. L. J. Mol. Biol. 1993, 232 (2), 639–659. (14) Cho, Y.; Sagle, L. B.; Iimura, S.; Zhang, Y.; Kherb, J.; Chilkoti, A.; Scholtz, J. M.; Cremer, P. S. J. Am.
Chem. Soc. 2009, 131 (42), 15188–15193. (15) Streicher, W. W.; Makhatadze, G. I. Biochemistry (Mosc.) 2007, 46 (10), 2876–2880. (16) Hofmeister, F. Arch. Für Exp. Pathol. Pharmakol. 1888, 25 (1), 1–30. (17) Collins, K. D. Methods 2004, 34 (3), 300–311. (18) Jungwirth, P.; Tobias, D. J. Chem. Rev. 2005, 106 (4), 1259–1281. (19) Rembert, K. B.; Paterová, J.; Heyda, J.; Hilty, C.; Jungwirth, P.; Cremer, P. S. J. Am. Chem. Soc. 2012,
134 (24), 10039–10046. (20) Zhang, Y.; Furyk, S.; Bergbreiter, D. E.; Cremer, P. S. J. Am. Chem. Soc. 2005, 127 (41), 14505–
14510. (21) Fernandez-Prini, R.; Harvey, A. H.; Palmer, D. A. Aqueous Systems at Elevated Temperatures and
Pressures: Physical Chemistry in Water, Steam and Hydrothermal Solutions; Academic Press, 2004. (22) Rodnikova, M. N. J. Mol. Liq. 2007, 136 (3), 211–213. (23) Greenwood, N. N.; Earnshaw, A. Chemistry of the Elements 2nd Edition; Butterworth-Heinemann,
1997. (24) Hardy, R. C.; Cottington, R. L. J. Res. Natl. Bur. Stand. 1949, 42, 573–578. (25) Némethy, G.; Scheraga, H. A. J. Chem. Phys. 1964, 41 (3), 680–689. (26) Kresheck, G. C. J. Phys. Chem. B 1998, 102 (34), 6596–6600. (27) Maczynski, A.; Shaw, D. G.; Goral, M.; Wisniewska-Goclowska, B.; Skrzecz, A.; Owczarek, I.; Blazej,
K.; Haulait-Pirson, M.-C.; Hefter, G. T.; Maczynska, Z.; Szafranski, A.; Young, C. L. J. Phys. Chem. Ref. Data 2005, 34 (2), 657–708.
(28) Wang, X.; Qiu, X.; Wu, C. Macromolecules 1998, 31 (9), 2972–2976. (29) Farasat, R.; Vyazovkin, S. Macromol. Chem. Phys. 2014, 215 (21), 2112–2118. (30) Aseyev, V.; Tenhu, H.; Winnik, F. M. In Self Organized Nanostructures of Amphiphilic Block
Copolymers II; Müller, A. H. E., Borisov, O., Eds.; Advances in Polymer Science; Springer Berlin Heidelberg, 2010; pp 29–89.
(31) Meyer, D. E.; Chilkoti, A. Biomacromolecules 2004, 5 (3), 846–851. (32) Cho, Y.; Zhang, Y.; Christensen, T.; Sagle, L. B.; Chilkoti, A.; Cremer, P. S. J. Phys. Chem. B 2008, 112
(44), 13765–13771.
71
(33) Mou, F.; Chen, C.; Zhong, Q.; Yin, Y.; Ma, H.; Guan, J. ACS Appl. Mater. Interfaces 2014, 6 (12), 9897–9903.
(34) Wang, H.; Sun, D.; Zhao, N.; Yang, X.; Shi, Y.; Li, J.; Su, Z.; Wei, G. J. Mater. Chem. B 2014, 2 (10), 1362.
(35) Phan, H. T. T.; Yoda, T.; Chahal, B.; Morita, M.; Takagi, M.; Vestergaard, M. C. Biochim. Biophys. Acta BBA - Biomembr. 2014, 1838 (10), 2670–2677.
(36) Chang, Y.-C.; Bowie, J. U. Proc. Natl. Acad. Sci. 2014, 111 (1), 219–224. (37) Davis, J. G.; Rankin, B. M.; Gierszal, K. P.; Ben-Amotz, D. Nat. Chem. 2013, 5 (9), 796–802. (38) Perera, P.; Wyche, M.; Loethen, Y.; Ben-Amotz, D. J. Am. Chem. Soc. 2008, 130 (14), 4576–4577. (39) Rabinovich, I. B. Influence of Isotopy on the Physicochemical Properties of Liquids; Springer: New
York, 1995. (40) Barth, A.; Zscherp, C. Q. Rev. Biophys. 2002, 35 (04), 369–430. (41) Davis, J. G.; Gierszal, K. P.; Wang, P.; Ben-Amotz, D. Nature 2012, 491 (7425), 582–585. (42) Santucci, S. C.; Fioretto, D.; Comez, L.; Gessini, A.; Masciovecchio, C. Phys. Rev. Lett. 2006, 97 (22),
225701. (43) Cammarata, L.; Kazarian, S. G.; Salter, P. A.; Welton, T. Phys. Chem. Chem. Phys. 2001, 3 (23),
5192–5200. (44) Wiggins, P. M. Phys. Stat. Mech. Its Appl. 1997, 238 (1–4), 113–128.
(45) Emsley, J. The Elements, 3 edition.; Oxford University Press: Oxford : New York, 1998. (46) Hofer, A. M.; Brown, E. M. Nat. Rev. Mol. Cell Biol. 2003, 4 (7), 530–538. (47) University of Cambridge. Structure and composition of bone
http://www.doitpoms.ac.uk/tlplib/bones/structure.php. (48) Tamburro, A. M.; Guantieri, V.; Daga-Gordini, D.; Abatangelo, G. Biochim. Biophys. Acta 1977, 492
(2), 370–376. (49) Tamburro, A. M.; Guantieri, V.; Daga-Gordini, D.; Abatangelo, G. J. Biol. Chem. 1978, 253 (9), 2893–
2894. (50) Scales, C. D.; Smith, A. C.; Hanley, J. M.; Saigal, C. S.; Urologic Diseases in America Project. Eur.
Urol. 2012, 62 (1), 160–165. (51) Brown, W. E.; Chow, L. C. Annu. Rev. Mater. Sci. 1976, 6 (1), 213–236. (52) Okur, H. I.; Kherb, J.; Cremer, P. S. J. Am. Chem. Soc. 2013, 135 (13), 5062–5067. (53) Meyer, D. E.; Chilkoti, A. Nat. Biotechnol. 1999, 17 (11), 1112–1115. (54) Myers, J. K.; Nick Pace, C.; Martin Scholtz, J. Protein Sci. 1998, 7 (2), 383–388. (55) Bertini, I.; Gray, H. B.; Valentine, J. S.; Lippard, J. Bioinorganic Chemistry; University Science Books:
Mill Valley, Calif, 1994. (56) Konietzny, U.; Jany, K.; Greiner, R. J. Fuer Ernaehrungsmedizin 2006, 8, 18–28. (57) Raboy, V. Phytochemistry 2003, 64 (6), 1033–1043. (58) Crea, F.; De Stefano, C.; Milea, D.; Sammartano, S. Coord. Chem. Rev. 2008, 252 (10–11), 1108–
1120. (59) Marie Minihane, A.; Rimbach, G. Int. J. Food Sci. Technol. 2002, 37 (7), 741–748. (60) Doria, E.; Galleschi, L.; Calucci, L.; Pinzino, C.; Pilu, R.; Cassani, E.; Nielsen, E. J. Exp. Bot. 2009,
ern345. (61) Fox, C. H.; Eberl, M. Complement. Ther. Med. 2002, 10 (4), 229–234. (62) Grases, F.; Costa-Bauzá, A. Anticancer Res. 1999, 19 (5A), 3717–3722. (63) Kumar, V.; Sinha, A. K.; Makkar, H. P. S.; Becker, K. Food Chem. 2010, 120 (4), 945–959. (64) Woyengo, T. A.; Nyachoti, C. M. Can. J. Anim. Sci. 2013, 93 (1), 9–21. (65) Martin, C. J.; Evans, W. J. J. Inorg. Biochem. 1986, 27 (1), 17–30. (66) Bohn, T.; Davidsson, L.; Walczyk, T.; Hurrell, R. F. Am. J. Clin. Nutr. 2004, 79 (3), 418–423.
72
(67) Kim, O.-H.; Kim, Y.-O.; Shim, J.-H.; Jung, Y.-S.; Jung, W.-J.; Choi, W.-C.; Lee, H.; Lee, S.-J.; Kim, K.-K.; Auh, J.-H.; Kim, H.; Kim, J.-W.; Oh, T.-K.; Oh, B.-C. Biochemistry (Mosc.) 2010, 49 (47), 10216–10227.
(68) Moraes, M. L.; Maki, R. M.; Paulovich, F. V.; Rodrigues Filho, U. P.; de Oliveira, M. C. F.; Riul, A.; de Souza, N. C.; Ferreira, M.; Gomes, H. L.; Oliveira, O. N. Anal. Chem. 2010, 82 (8), 3239–3246.
(69) Cowieson, A.; Cowieson, N. Proc. 22nd Annu. Aust. Poult. Sci. Symp. 2011, 22. (70) Bye, J. W.; Cowieson, N. P.; Cowieson, A. J.; Selle, P. H.; Falconer, R. J. J. Agric. Food Chem. 2013, 61
(2), 290–295. (71) Costello, A. J.; Glonek, T.; Myers, T. C. Carbohydr. Res. 1976, 46 (2), 159–171. (72) Crea, F.; Crea, P.; Milea, D.; Porcino, N.; Sammartano, S. Ann. Chim. 2007, 97 (8), 635–645. (73) Concetta De Stefano, D. M. J. Chem. Amp Eng. Data 2002, 48 (1), 114–119. (74) Crea, P.; de Robertis, A.; de Stefano, C.; Sammartano, S. Biophys. Chem. 2006, 124 (1), 18–26.