Embed Size (px)
Citation preview

INVESTIGATING THE EFFICACY OF POMEGRANATE EXTRACT AS
AN ANTIOXIDANT IN MULTIPLE HIGH-LIPID MODEL SYSTEMS
BY
CHRISTIAN THEODORE SCHEVEY
THESIS
Submitted in partial fulfillment of the requirements
for the degree of Master of Science in Food Science and Human Nutrition
with a concentration in Food Science
in the Graduate College of the
University of Illinois at Urbana-Champaign, 2012
Urbana, Illinois
Adviser:
Professor Mary Susan Brewer

ii
Abstract
Antioxidants are of paramount importance to the food industry. They confer benefits in
the form of economic savings as well as drastic quality improvements to high-lipid products.
Previous research has evaluated synthetic and natural compounds in a plethora of matrices to
compare antioxidant efficacies. Because of the intricate nature of antioxidants, their solubility
and differences in application, expansive research must be done to qualify antioxidants of similar
chemical characteristics.
Research was conducted in Urbana, IL to examine the efficacy of an industrially-derived,
natural antioxidant (pomegranate extract) using four direct analysis technqiues and three high-
lipid model systems in contrast to well-known and highly utilized antioxidants. Direct analysis
techniques evaluated several antioxidants on two highly informative parameters of antioxidant
activity: reducing capacity and hydrogen atom donating capacity. The high lipid models
evaluated antioxidant activity in visceral systems by looking at each compounds ability to
prolong the induction period of oxidation from different prooxidants (heat-, hemoglobin-, and
irradiation-induced oxidation). These results improve the understanding of antioxidant capacity
in applicable systems, as well as suggest potential mechanisms by which pomegranate extract
might work.

iii
My thesis is dedicated to my friends and family who have assisted me both physically and
mentally.

iv
Acknowledgements
There are several people who made it possible for me to accomplish my goal of receiving
a Masters. First and foremost is my gratitude to my advisor, Dr. Mary Susan Brewer. She has
provided support, direction, guidance and valuable lessons throughout the course of my
education. Her assistance in both my undergraduate career as well as graduate career has been
priceless. She’s allowed me to TA her Product Development class, as well as increasing my
funding during semesters I taught other courses. She has allowed me to moderate numerous
descriptive analysis panels, funded my presentations at IFT and involved me in all situations
during labwork and teaching.
Additionally, I need to thank Dr. Keith Cadwallader. Any questions I had that couldn’t be
answered by Dr. Brewer were discussed with Dr. Cadwallader. He has been patient,
understanding and a wealth of knowledge during multiple aspects of my research. Additionally,
he’s always been inclusive and treated me as a as a member of his graduate team, for which I am
truly grateful.
I also need to thank Dr. Graciela Padua, Dr. Nicki Engeseth and Dr. Stoyan Toshkov.
They provided guidance, help, chemicals and direction with my research projects and thesis. By
always being available to answer questions, they ensured that my knowledge was accurate and
complete.
I owe considerable gratitude to my friends and fellow graduate students in the Food
Science and Human Nutrition department. Without them, my career would have been lonely,
confusing, and incomplete. Through both the physical work of running assays or mentally
evaluating experiences and science, I was able to complete all of my research in a timely manner
with the utmost success. They are: Caitlin Baldwin, David Bloom, Gin Cox, Joey Donovan, Lina

v
Dovilas, Elizabeth Genthner, MaKayla Hellyer, Jennifer Hoeflinger, Ingrid Jorud, Bethany
Richardson, Sarah Scholl and Chad Webb.
I need to further acknowledge the undergraduates technicians and friends who assisted
with my labwork and offered me reprieve from the graduate student life. With them, I was able
to run descriptive analysis panels, utilize clean glassware, thoroughly evaluate antioxidants and
complete large trials with multiple repetitions. Furthermore, Ms. Harsh completed her own
project under my guidance and was successful in presenting her findings in the University
Undergraduate Research Symposium. The friends who were not directly related to my research
offered me solace on days experiments failed, humor to lighten my outlook, perspective to
attempt new projects and guidance in other areas of my life. They are: Adib Darwan, Anita
Gonzalez, Kathleen Harsh, Noah Roberts, Jessica and Rachel Remke, Sara Bemer, Nate Vos,
Sam Kramer, Brian Fisher, Natalie Newberg, Ryan Coventry, and Jim Antonaglia.

vi
Table of Contents
List of Tables ...................................................................................................................................x
List of Figures .............................................................................................................................. xiii
Chapter 1. Introduction ................................................................................................................1
Chapter 2. Literature Review .......................................................................................................3
2.1 Lipids ......................................................................................................................................3
2.2 Lipid Oxidation ......................................................................................................................5
2.2.1 Types of Oxidation in Lipids ...........................................................................................6
2.2.2 Initiation ..........................................................................................................................7
2.2.3 Propagation ......................................................................................................................8
2.2.4 Termination ...................................................................................................................12
2.3 Measurement of Lipid Oxidation .........................................................................................13
2.3.1 Sensory Evaluation ........................................................................................................13
2.3.2 Chemical Methodologies ...............................................................................................14
2.3.3 Instrumental Analysis ....................................................................................................19
2.4 Antioxidants: Control of Lipid Oxidation ............................................................................19
2.4.1 Type I.............................................................................................................................20
2.4.2 Type II ...........................................................................................................................21
2.4.3 Type III ..........................................................................................................................22
2.4.4 Natural Antioxidants .....................................................................................................22
2.5 Measurement of Antioxidant Potential ................................................................................25
2.5.1 Single Electron Transfer (SET) Assays .........................................................................26
2.5.2 Hydrogen Atom Transfer (HAT) Assays ......................................................................36
2.6 References ............................................................................................................................38

vii
Chapter 3. Evaluation of Antioxidant Capacity of Commercially Available and Natural
Antioxidants..................................................................................................................................46
3.1 Abstract ................................................................................................................................46
3.2 Introduction ..........................................................................................................................46
3.3 Materials & Methods ............................................................................................................51
3.3.1 Chemicals ......................................................................................................................52
3.3.2 Antioxidants .................................................................................................................52
3.3.3 Reducing Power as Determined by Folin-Ciocalteu Reagent ......................................53
3.3.4 Ferricyanide Reducing Antioxidant Capacity ...............................................................54
3.3.5 Free Radical Scavenging by 2,2-diphenyl-1-picrylhydrazyl .........................................55
3.3.6 Oxygen Radical Absorbance Capacity ..........................................................................55
3.4 Results and Discussion .........................................................................................................56
3.4.1 Reducing Power as Determined by Folin-Ciocalteu Reagent ......................................56
3.4.2 Ferricyanide Reducing Antioxidant Capacity ..............................................................57
3.4.3 Free Radical Scavenging by 2,2-Diphenyl-1-Picrylhydrazyl .......................................59
3.4.4 Oxygen Radical Absorbance Capacity .........................................................................60
3.5 Conclusion ............................................................................................................................61
3.6 References ............................................................................................................................62
Chapter 4. Effect of Temperature and Concentration on Antioxidant Activity of Natural
Antioxidants in Simplified Lipid Model Systems .....................................................................72
4.1 Abstract ................................................................................................................................72
4.2 Introduction ..........................................................................................................................72
4.3 Materials & Methods ............................................................................................................74
4.3.1 Anti- / Prooxidants ........................................................................................................74
4.3.2 Lard Model System Formation ......................................................................................74
4.3.3 Canola Oil Model System Formation ............................................................................75
4.3.4 Odor Evaluation of Canola Oil-Model System ............................................................76

viii
4.3.5 Determination of Diene Conjugation ...........................................................................76
4.3.6 Thiobarbituric Reactive Substances (TBARS) ..............................................................77
4.3.7 Statistical Analysis ........................................................................................................78
4.4 Results and Discussion .........................................................................................................78
4.4.1 Effect of Natural Antioxidants on Diene Conjugation .................................................78
4.4.2 Effect of Natural Antioxidants on TBARS ..................................................................80
4.4.3 Effect of Natural Antioxidants on Sensory Attributes in a Canola Oil-Model System ...........81
4.5 Conclusion ............................................................................................................................82
4.6 References ............................................................................................................................82
Chapter 5. Effect of Irradiation, Antioxidant and Sodium Chloride Level on the Oxidation of
High-Fat Ground Beef Patties ........................................................................................................89
5.1 Abstract ................................................................................................................................89
5.2 Introduction ..........................................................................................................................89
5.3 Materials & Methods ............................................................................................................91
5.3.1 Anti- / Prooxidants ........................................................................................................92
5.3.2 0.5%-Salt Ground Beef Patties ......................................................................................92
5.3.3 2%-Salt Ground Beef Patties ........................................................................................93
5.3.4 Instrumental Color .........................................................................................................93
5.3.5 Odor Evaluation of 0.5%-Salt Ground Beef Patties ......................................................94
5.3.6 Determination of Diene Conjugation ............................................................................96
5.3.7 Thiobarbituric Reactive Substances (TBARS) ..............................................................96
5.3.8 Statistical Analysis ........................................................................................................98
5.4 Results and Discussion .........................................................................................................98
5.4.1 Effect of Natural Antioxidants on Color of Raw Beef Patties ....................................98
5.4.2 Effect of Natural Antioxidants and Irradiation on Odor Descriptors of Beef Patties 101
5.4.3 Effect of Natural Antioxidants on Lipid Oxidation of Raw Beef Patties ...................103
5.5 Conclusions ........................................................................................................................105

ix
5.6 References ..........................................................................................................................106
Chapter 6. Conclusions ..............................................................................................................117
Appendix A. Experimental Design ..........................................................................................119
Appendix B. Sensory Testing ...................................................................................................137
Appendix C. Spectrocolorimetric Data ...................................................................................147
Appendix D. Spectrophotometric Data ...................................................................................156

x
List of Tables
Chapter 3. ........................................................................................................................................
3.1 Antioxidant Activity of Various Extracts as Determined by FCR, Ferricyanide, DPPH, &
ORAC ........................................................................................................................................71
Chapter 5. ........................................................................................................................................
5.1 Antioxidant Formulation and Code ...................................................................................101
5.2 Effects of Antioxidants over time on ΔE*94 for 0.5% salt, Irradiated Beef Patties ..........109
5.3 Effects of Antioxidants over time on ΔE*94 for 0.5%-Salt, Non-Irradiated Beef Patties .109
5.4 Effects of Antioxidants over Time on ΔE*94 for 2%-Salt Ground Beef Patties ..............112
Appendix A. Experimental Design .................................................................................................
A.2 Assay Schematics ....................................................................................................................
A.2.1 Gallic Acid Standard Curve .......................................................................................124
A.2.2 DPPH Standard Curve ...............................................................................................128
A.2.3 TBARs Standard Curve .............................................................................................132
A.2.4 TBARs Standard Curve for Meat Patties in Water vs. TCA/H3PO4 ..........................133
A.3 Solutions for TBARS Test ......................................................................................................
A.3.1 TBARs Solutions to be Prepared ...............................................................................134
A.3.2 Preparation of 500 mL of 0.02 M TEP ......................................................................134
A.3.3 Preparation of 100 mL of 25 μM TEP .......................................................................134
A.3.4 Preparation of 100 mL of 10 μM TEP .......................................................................135
A.3.5 Preparation of 250 mL of 0.02 M TBA .....................................................................135
A.3.6 Preparation of 100 mL of 0.2 mg/mL BHT ...............................................................135
A.3.7 Preparation of 1 L of 0.2 M TCA / H3PO4 .................................................................136
Appendix B. Sensory Testing ..........................................................................................................
B.1 Sensory, Chapter 4 ...................................................................................................................
B.1.1 Canola Oil-Model System Terms and Definitions ....................................................138
B.1.2 Effects of Antioxidants on Odor Descriptors in Canola Oil-Gelled Model System ..139
B.2 Sensory, Chapter 5 ...................................................................................................................
B.2.1 0.5%-salt Beef Patty Model System Terms and Definitions .....................................142

xi
B.2.2 Effects of Antioxidants on Odor Descriptors over Time in 0.5%-Salt, Non-Irradiated
Raw Beef Patties ..................................................................................................................143
B.2.3 Effects of Antioxidants on Odor Descriptors over Time in 0.5%-Salt, Irradiated Raw
Beef Patties ..........................................................................................................................144
B.2.4 Effects of Antioxidants on Odor Descriptors over Time in 0.5%-Salt, Non-Irradiated
Cooked Beef Patties ............................................................................................................145
B.2.5 Effects of Antioxidants on Odor Descriptors over Time in 0.5%-Salt, Irradiated
Cooked Beef Patties ............................................................................................................146
Appendix C. Spectrocolorimetric Data ..........................................................................................
C.1 0.5%-Salt, Unirradiated Beef patties .......................................................................................
C.1.1 Effects of Antioxidants Over Time on L*, a*, and b* values for 0.5%-Salt, non-
irradiated beef patties ..........................................................................................................147
C.1.2 Effects of Antioxidants Over Time on Hue Angle and Chroma for 0.5%-Salt, non-
irradiated beef patties ..........................................................................................................148
C.1.3 Effects and Interactions of Antioxidants on Storage Color Attributes for 0.5%-Salt,
non-irradiated beef patties ...................................................................................................149
C.2 0.5%-Salt, Irradiated Beef patties ...........................................................................................
C.2.1 Effects of Antioxidants Over Time on L*, a*, and b* values for 0.5%-Salt, Irradiated
beef patties ...........................................................................................................................150
C.2.2 Effects of Antioxidants Over Time on Hue Angle and Chroma for 0.5%-Salt,
Irradiated beef patties ..........................................................................................................151
C.2.3 Effects and Interactions of Antioxidants on Storage Color Attributes for 0.5%-Salt,
Irradiated beef patties ..........................................................................................................152
C.3 2%-Salt Beef patties ...............................................................................................................
C.3.1 Effects of Antioxidants Over Time on L*, a*, and b* values for 2%-Salt Beef
patties ....................................................................................................................................153
C.3.2 Effects of Antioxidants Over Time on Hue Angle and Chroma for 2%-Salt Beef
patties ...................................................................................................................................154
C.3.3 Effects and Interactions of Antioxidants on Storage Color Attributes for 2%-Salt, Beef
patties ...................................................................................................................................155
Appendix D. Spectrophotometric Data ..........................................................................................
D.1 Chapter 3 Raw Data ................................................................................................................
D.1.1 Comparison of Antioxidant Assays on Various Natural Antioxidants ......................156
D.1.2 Pearson Correlation Coefficients ...............................................................................156
xii
D.2 Chapter 4 Raw Data ................................................................................................................
D.2.1 Effect of Antioxidants on Diene Conjugation of gelled Lard Model System at 30oC
..............................................................................................................................................157
D.2.2 Effect of Antioxidants on TBARS of gelled Lard Model System at 30oC ................158
D.2.3 Effect of Antioxidants on Conjugated Dienes of gelled Lard System at 30oC ...........159
D.2.4 Effect of Antioxidants on TBARS of gelled Lard Model System at 30oC ................160
D.2.5 Effect of Antioxidants on Diene Conjugation of gelled Canola Oil Model System at
30oC .....................................................................................................................................161
D.2.6 Effect of Antioxidants on TBARS of gelled Canola Oil Model System at 30oC ......161
D.3 Chapter 5 Raw Data ................................................................................................................
D.3.1 Effect of Natural Antioxidants on TNARS of 2% Ground Beef Patties ...................162

xiii
List of Figures
Chapter 2. Literature Review .........................................................................................................
2.1 A Mixed Triacylglycerol ........................................................................................................4
2.2 General Chemical Structure of Glycerophospholipids ...........................................................5
2.3 Oxidation of Linoleic Acid ..................................................................................................11
2.4 Reaction Between TBA & MDA to Form TBA Pigment ....................................................15
2.5 Gallic Acid Showing a Higher Degree of Substitution than Protocatechuic Acid ..............23
2.6 Punicalagin and Punicalin Constituants of POMx ..............................................................24
2.7 Ellagic Acid .........................................................................................................................24
2.8 Potential Keggin structure of the active agent in Folin-Ciocalteu reagent ..........................28
2.9 Dissociation of Phenol to Phenolate Resonance Structure ...................................................29
2.10 Resonance Structure of DPPH ...........................................................................................30
2.11 Mechanism of FRAP Assay ...............................................................................................32
2.12 The Ferricyanide Octahedral Coordination Complex (left) & Fe-protoporphyrin IX (right)
Found in hemoglobin ................................................................................................................33
2.13 CUPRAC Mechanism ........................................................................................................35
2.14 Chemical Structure of AAPH .............................................................................................36
Chapter 3. ........................................................................................................................................
3.1 Gallic Acid Equivalents (mg L-1
of Various Antioxidants at Increasing Concentrations ....68
3.2 Ferricyanide Reducing Power (μM Gallic Acid Equivalents) of Various Antioxidants .....69
3.3 Ascorbic Acid Equivalents (mg L-1
) of DPPH Free Radical Scavenging for Various Antioxidant at
Increasing Concentration ...............................................................................................................70
Chapter 4. ........................................................................................................................................
4.1 Effect of Antioxidants on Diene Conjugation1 of Lard Model System Over Storage Time (30
oC) .85
4.2 Effect of Increasing Level of Natural Antioxidant on Diene Conjugation1 of Lard Model
System Over Time (30oC) ..............................................................................................................85
4.3 Effect of Natural Antioxidants on TBARS1 of Lard Model System Over Time (30
oC) ...............86
4.4 Effect of Increasing Level of Natural Antioxidant on TBARS1 of Lard Model System Over Time
(30oC) .........................................................................................................................................86

xiv
4.5 Effect of Natural Antioxidant on Diene Conjugation of Canola Oil Model System Over Time
(30oC) ..........................................................................................................................................87
4.6 Effect of Natural Antioxidant on TBARS of Canola Oil Model System Over Time ..........87
4.7 Effect of Antioxidants on odor Descriptors1 of Canola Oil Model System (30
oC) .......................88
4.8 Effect of Time on Odor Descriptors of Canola Oil Model System (30oC ) ..................................88
Chapter 5. ........................................................................................................................................
5.1 L*, a* and b* Values of 0.5%-Salt Ground Beef Patties Over Time .........................................110
5.2 L*, a* and b* Values of Irradiated 0.5%-Salt Ground Beef Patties Over Time ...............111
5.3 Effect of Natural Antioxidants and Irradiation on Odor Descriptors of Refrigerated Raw Beef
Patties .......................................................................................................................................113
5.4 Effect of Natural Antioxidants and Irradiation on Odor Descriptors of Refrigerated Raw Beef
Patties After Cooking .................................................................................................................114
5.5 Comparative Effect of Antioxidants on TBARS of Raw, 0.5%-Salt Ground Beef Model System
over Storage Time (4oC) ..............................................................................................................115
5.6 Comparative Effect of Antioxidants on TBARS of Raw, Irradiated 0.5%-salt Ground Beef
Model System over Storage Time (4oC) ......................................................................................115
5.7 Comparative Effect of Antioxidants on TBARS of 2%-Salt, Raw Ground Beef Model System over
Storage Time (4oC) .....................................................................................................................116
5.8 Comparative Effect of Antioxidants on Conjugated Dienes of 2% NaCl Raw Ground Beef
Model System over time (4oC) ....................................................................................................116
Appendix A. Experimental Design .................................................................................................
A.1 Experimental Design ............................................................................................................................
A.1.1 Lard Model System Flow Diagram ...........................................................................119
A.1.2 Canola Oil Model System Flow Diagram ram ..........................................................120
A.1.3 Ground Beef Model System Flow Diagram ..............................................................121
A.2 Assay Schematics .................................................................................................................................
A.2.1 Total Phenolics Determined by Folin-Ciocalteu Reagent .........................................122
A.2.2 FCR Standard Curve of Gallic Acid Schematic ........................................................123
A.2.3 Gallic Acid Standard Curve .......................................................................................124
A.2.4 Ferricyanide Reducing Antioxidant Power Schematic ..............................................125
A.2.5 Free Radical Scavenging by DPPH Schematic .........................................................126
A.2.6 DPPH Standard Curve of Ascorbic Acid Schematic .................................................127

xv
A.2.7 Ascorbic Acid Standard Curve ..................................................................................128
A.2.8 Conjugated-Dienes Extraction Procedure .................................................................129
A.2.9 TBARS Extraction Procedure ...................................................................................130
A.2.10 TBARS Standard Curve Schematic .........................................................................131
A.2.11 Malondialdehyde Standard Curve for TBARS ........................................................132
A.2.12 Solvatochromic shift for TBARs Standard Curve for Meat Patties using Water vs.
TCA/H3PO4 ............................................................................................................................133
Appendix B. Sensory Testing ..........................................................................................................
B.1.1 Canola Oil-Model System Scorecard ........................................................................137
B.1.2 0.5%-Salt Raw Beef Patty Scorecard ........................................................................140
B.1.3 0.5%-Salt Cooked Beef Patty Scorecard ...................................................................141
1
Chapter 1: Introduction
Antioxidants provide invaluable benefits to society. Their uses span from the rubber
industry into nutritional significance and extension of the shelf life of many high-lipid foods.
Because of their diversity, confusion has developed in qualifying the efficacy of antioxidants in
relation to each other. Often, industries and the media have conflated antioxidant use in food
systems with antioxidant use in living, biological systems. In 2010, POM Wonderful, LLC
received complaint charges by the Federal Trade Commission for deceptively advertising their
products (extracts, juice and POMx pills) without proper scientific validation. This confusion is
common between consumers, the media, health care professionals, academic agencies and
industry. A primary reason for the confusion originates from the unclear definition and purpose
of an antioxidant. This is further illustrated by removal of the Oxygen Radical Absorbance
Capacity (ORAC) Database for Selected Foods by the U.S Department of Agriculture’s Nutrient
Data Laboratory. ORAC values are measures of antioxidant potency that are relevant to food
matrices but, as the USDA’s Nutrient Data Lab contests, “[these values] have no relevance to the
effects of specific bioactive compounds, including polyphenols, on human health.” (USDA,
2012). This was further expounded in a June 2011 issue of Nutritional Outlook in an article
entitled, ‘The Polyphenol Paradox’. While the structure of polyphenolic compounds act
exceptionally well as antioxidants in food systems, their molecular size inhibits absorption and
the interaction in the stomach and lumen destroys their ring structure. This causes their accepted
mechanism of antioxidant activity, seen clearly in foods, to be abolished. In food systems,
antioxidants act as chemical constituents that don’t require metabolic transformation to interact
with and ultimately delay the oxidative damage that radical species create in an environment.

2
It is necessary to define antioxidants by their function. Metabolically-activated
antioxidants that reduce oxidative stress on living tissue must be distinguished from antioxidants
that reduce oxidative stress on non-living systems (food, rubber, plastics, etc.). Hence, the
evaluation of antioxidants is still of prime importance to many industries. To date, there is no
single method for determining the efficacy of an antioxidant. Methods of direct analysis have
been criticized at large (Frankel, 1993; Prior et al., 2005; Apak et al., 2007). Furthermore,
consumer interest in ‘clean labeling’ has led to preference for naturally occurring antioxidants to
replace those with more chemical-sounding names. Combining direct analysis techniques (which
can offer clues to the underlying mechanism of antioxidation) with model systems allows for a
more complete profile of a compounds antioxidant activity to be portrayed.
Meat model systems, such as ground beef, are often chosen because they have the highest
amount of fat on a weight-by-weight basis (27.4%, Rhee, Seideman & Cross, 1986) and require
antioxidants to maintain freshness. Lard and oils are also commonly mixed with antioxidants
(such as BHT/BHA) to maintain freshness. Both the tallow from beef and the lard from pork
contain similar unsaturated fatty acid profiles (Bitman, 1976). Of note, pork contains over twice
(8 g compared to 3 g) as much linoleic acid as beef (a precursor to off-flavor and odor in
oxidation), but beef contains linolenic acid (which highly prone to oxidation) while pork contain
none. Where beef and pork contain 53 and 58% unsaturated fatty acids, respectively, canola oil
contains 91% unsaturated fatty acids (USDA, 2012). Of the unsaturated and easily degraded fatty
acids in canola oil, 22% is comprised of linoleic acid while 11% comprised of linolenic acid.
Because the results of one model-system are rarely translatable among different matrices, some
authors have found it useful to test the same antioxidants among multiple matrices.

3
Chapter 2: Literature Review
2.1 Lipids
Of the macronutrients found in nature, lipids are important for a multitude of reasons. In
terms of dietary considerations, lipids provide approximately 9 kilocalories on a per gram basis.
Metabolically, lipids are necessary components for all living cells; they provide a structural basis
(i.e. phospholipid bilayer) for cellular membranes, act as carriers for fat soluble vitamins (A, D,
E and K), provide essential fatty acids to the diet (linoleic and linolenic acid), and on a larger
macro provide insulation and protection to the human body. Beyond the metabolic attributes of
lipids, they offer palatability to food, confer feelings of satiety, and offer a chemical oasis for
hydrophobic compounds in a predominantly hydrophilic environment. Because of the diametric
opposition of lipids to hydrophilic components of food products, they contain several advantages
in terms of interactions with: hydrophobic side-chains of proteins (isoleucine, valine, alanine,
and leucine), fat soluble antioxidants (vitamins A and E), formation of lipid-derived flavor
compounds (trans,cis-2,6-nonadienal from linolenic acid in cucumbers (Tressl et al., 1981), fresh
fish aroma (Josephson, Lindsay & Stuiber, 1983), etc.), and stability of select flavor compounds
and flavor release (limonene, etc.) (Roberts et al., 2003).
Edible lipids are classically distinguished by their physical structure at room temperature.
Oils are characteristically liquid at room temperature (20-25 oC) and are generally derived from
plants (although fish lipids are also primarily liquid). Fats are lipids derived primarily from
animal products that maintain a solid or semisolid structure at room temperature. The physical
structure is determined predominantly by the degree of saturation and chain length each lipid
contains; those with more unsaturated double bonds tend to be liquid, while those with high
degrees of saturation remain solid at higher temperatures. Degree of saturation also determines

4
other functional aspects of the lipids, such as melting point, dispersal in a solvent and
predominance to oxidize. Structural diversity occurs among lipids and lipid derived compounds
beyond just saturation. The scientific community has found it useful to organize lipids into
groups such as simple lipids, compound lipids and lipid derived structures (sterols, essential oils,
etc.).
Simple lipids, such as waxes and acylglycerols, are esters of fatty acids alcohols.
Figure 2.1: A Mixed Triacylglycerol.
Their characteristic hydrophobic nature and long chain length are easily seen in fatty acids
(Figure 2.1). Specifically, acylglycerols make up 99% of lipids in animals and plants. Fatty acids
can contain one, two or three acylglycerols and are described as aliphatic monocarboxylic acids.
Hydrolysis, by enzyme, heat or acid, can liberate fatty acids from the glycerol backbone. While
saturated fatty acids have no double bonds, unsaturated fatty acids may have one
(monounsaturated fatty acids, MUFAs) or more (polyunsaturated fatty acids, PUFAs). In
PUFAs, the double bonds are usually unconjugated and, more often than not, methylene
interrupted. Further characterization of lipids indicates geometric isomerization; that is, these
bonds can occur with the carbons cis- (on the same side) or trans- (across from). There is a
natural predilection for the cis- configuration, while trans-fatty acids are generated industrially
through hydrogenation.

5
Complex lipids have the same requisites as simple lipids, but differ by the addition of
another functional group. Glycerophospholipids (GLP) and sphingolipids (SL) provide excellent
examples of complex lipids. GLPs are a group of complex lipids that contain an ortho-acyl, -
alkyl, or -alkenyl group attached to the glycerol backbone. Many GLPs (phosphatidlycholine,
phosphatidylinositol) exist in the biological membranes of cells and are found in many foods.
Figure 2.2: General Chemical Structure of Glycerophospholipids
Source: http://en.wikipedia.org/wiki/Image: Phospholipid.svg
SLs differ from GLPs in that their core exists as a long-chain amino alcohol and their absence of
a glycerol backbone.
2.2 Lipid Oxidation
Oxidation is a degradation process involving lipids and a reactive species, usually oxygen
(ROS) or nitrogen (RNS). It is common in many industries, such as the rubber industry,
metabolic systems, and the deterioration of food products. Economically, it is relevant to the
food industry because of the development of off odors, off flavors, off colors, and structural
degradation via acid formation, nutrient degradation, and mutagenic/carcinogenic/teratogenic by-
products. Conversely, controlled lipid oxidation can be desirable in products like aged cheeses
and fried foods.

6
2.2.1 Types of Oxidation in Lipids
When discussing lipid oxidation, it is important to distinguish which mechanism is at
work. Autoxidation is the primary pathway of importance in the food industry, and will be
discussed momentarily. Photooxidation is similar to autoxidation but differs by a number of
features: (1) the reactive, singlet oxygen [1O2] is produced from a ‘sensitizer’ and triple oxygen
[3O2]; (2) the reaction cascade is not a radical chain process but an “ene” reaction (Bradley &
Min, 1992); (3) there is no induction period; (4) exclusion of light, O2 or inhibition of 1O2 by a
quencher are the only known methods of inhibition, conventional antioxidants used in
autoxidation show now effect; (5) it specifically attacks olefinic carbon atoms [MUFAs] and can
be seen during the cis- to trans- isomerization of the double bond; (6) it happens more quickly
than autoxidation [which can be measured by number of double bonds instead of number of
doubly activated allylic groups]; (7) the end-products are similar in nature, but different in
structure to those produced by autoxidation (Gunstone, 1999).
Enzymatic oxidation is common in many food products. Often, enzymatic oxidation is
due to a lipoxygenase system. The system bears a similarity to autoxidation when considering
the formation and degradation of 9- and 13-hydroperoxides, but differs due to the mechanistic
production of these compounds by lipoxygenases and subsequent cleavage by bond-specific
lyases (hydroperoxide lyase)(Galliard et al., 1976; Cai, 1997). These mechanistic differences
bear great importance because they also render the conventional antioxidants used in
autoxidation useless.
Autoxidation, as previously mentioned, is a radical chain process that has been studied
extensively. Radicals are highly reactive, odd electron species. They are often hard to measure
and quantify, especially in a dynamic environment. Classically, the process of oxidation is split

7
into three phases: initiation, propagation and termination. The induction period of autoxidation
can be understood in two parts: the creation of a reactive species and abstraction of an α-
methylenic hydrogen atom (initiation). While the creation of a reactive species is not fully
understood, there exist some hypotheses: (1) radical hydroperoxides are produced by metal-
catalyzed decomposition; (2) photooxidation [as described above] may produce radical
hydroperoxides; (3) heat may initiate the propagation of a radical species.
2.2.2 Initiation
To understand initiation, it is important to understand and employ molecular orbital (MO)
theory. During bonding, MO theory dictates that single bonds contain a sigma-bond, while
higher order bonds contain one sigma- and a number of pi- or delta-bonds associated with the
total number of bonds between two atoms. The strength of a sigma-bond is explained by the
mixing of s- and p-orbitals, while the pi-bond is characteristically weaker due to a more limited
overlap that the p-orbitals are allowed. However, the existence of both σ- and π-bonds in a
compound is stronger than either two alone. In terms of PUFAs, such as linoleic acid, the two
sigma- and pi-bonds interact so as to draw electron density away from adjacent carbon atoms,
making it easier to abstract a hydrogen atom from one of the carbon-hydrogen bonds next to the
double bond (which are electron-deficient). Abstraction of a hydrogen atom becomes easier
when considering the pentadiene configuration of the methylene interrupted carbon in linoleic
acid (due to the electron-rich double bonds on either side of that specific carbon). This
interaction (including the unknown sensitizer or catalyst) can be described as:
(1) RH + Initiator R▪ + H
▪
The hydroxyl (OH▪) or hydroperoxyl (HOO
▪) radical delivered by the sensitizer is
considered to be the most important initiator of unsaturated lipid autoxidation (Aikens & Dix,

8
1991; Choe & Min, 2006; Gebickie & Bielski, 1981). The mechanism involving hydroxyl
radicals and unsaturated fatty acids involve a hydrogen atom abstraction to complete the
hydrolysis reaction as follows
(2) RH + OH▪ R
▪ + H2O
Alternatively, the hydroperoxy radical can also scavenge a hydrogen atom to produce an alkyl
radical (R▪), but requires that double allylic hydrogen atoms be present for the reaction to
proceed (Bielski et al., 1983).
The substrates that have been observed to cause these highly reactive compounds have
primarily been enzymatically- or heme-formed superoxide radical anions (▪O2
-) (Kanner et al.,
1987; Aikens & Dix, 1991, Winterbourn, 1990), photo-sensitized triplet oxygen (3O2) (Haseloff,
Ebert & Roeder, 1989), hydrogen peroxide (H2O2) via fenton reactions (Kanner et al., 1987;
Watanabe et al., 2002) or metal-catalyzed Haber-Weiss reactions (Kellog & Fridovich, 1975;
MacManus-Spencer & McNeill, 2005) and water (H2O) via ionization or excitation (Choe &
Min, 2006, Schronerova et al., 2007).
In the autoxidation of meat, there are several proposed initiators. Harel and Kanner
(1985) have proposed that species are activated by the interaction of hydrogen peroxide with
metmyo- / methemoglobin. Alternatively, it has been suggested that microsomal oxidase systems
that include Fe2+
and Fe3+
could initiate the process of lipid oxidation (Rhee, Dutson & Smith,
1984). Overall, whether authors agree that heme-proteins initiate lipid oxidation in meat, there is
consensus that they continue the propagation process of meat (Ladikos, & Lougovois, 1989).
2.2.3 Propagation
Propagation is the mechanism by which oxidation both continues and exponentially
increases the rate by which reactive products are produced. Because of both effects, this is the

9
stage by which the most damage to highly unsaturated lipid-based products can occur; control of
this step can extend the induction phase previously described and greatly aid in the shelf-life and
quality of many oxidation-prone food products.
The alkyl radical previously formed under the mechanism of initiation is highly reactive
and can bond easily with triplet oxygen, forming a peroxy radical (ROO▪) as detailed below:
(3) R▪ +
3O2
ROO▪
The formation of a hydroperoxy radical is highly unstable, making it only slightly less of
an oxidizing agent than its precursor. In order to stabilize, the hydroperoxy radical abstracts a
hydrogen atom from another unsaturated lipid to give a hydroperoxide and an additional alkyl
radical (which can undergo the above mentioned reactions) (Bolland & Gee, 1946; Farmer et al.,
1942; Frankel et al., 1961).
(4) ROO▪ + R’H
ROOH + ▪R’
At this point, multiple outcomes can occur: (5) The new alkyl radical can abstract hydrogen
atoms; (6) while stable at room temperature, hydroperoxides easily degrade under heat,
ultraviolet radiation, or in the presence of a metal catalyst. These conditions can cause branching
of the hydroperoxide (ROOH) back into a hydroperoxy radical (ROO▪) and hydrogen ion (H
+), or
(7) branching can occur under the same circumstances between the oxygen couplet to form a
peroxy radical (OH▪) and an alkoxy radical (RO
▪). All of which can abstract hydrogen atoms
from nearby unsaturated fatty acids.
(5) R’▪ + R’’H
R’H + ▪R’’
(6) → ▪ ▪
▪

10
(7) → ▪ ▪
▪
The greatest issue in understanding the mechanics of oxidation results from the complexity of the
substrates (i.e. whole food systems). To more easily define, control and understand the
mechanisms by which propagation occurs, simpler systems have been modeled, such as
methylenic esters from fatty acids. Many authors (Frankel, 1980; Frankel, 1982; Frankel, 1991,
Hseigh et al., 1989) have detected the formation of hydroperoxides from methyl oleate, linoleate,
linolenate and arachidonate and polyunsaturated fatty acids through qualitative and quantitative
methods. The figure below shoes a representation of the steps in the oxidation of linoleic acid.
The 1,4-pentadiene structure makes the ester of linoleic acid roughly 10 times faster at
oxidizing than the methylenic ester of oleic acid (Labuza, 1971). Additionally, the methylene
group at position 11 (where the double bonds are often described as methylene-interrupted) is
twice as active in terms of hydrogen atom abstraction due to the adjacent double bonds. This
abstraction allows for carbon-9 and carbon-13 to form a mixture of 9- and 13-hydroperoxides.
The geometric isomerization from a cis,trans-hydroperoxide to a trans,trans-hydroperoxide has
been demonstrated through HPLC and 13
C-NMR (Labuza, 1971).

11
Figure 2.3 Oxidation of Linoleic Acid
Additional propagation can occur when alkoxy radicals can react with (8) unsaturated
fatty acids to form stable alcohols, or they can (9) undergo fragmentation to form unsaturated
aldehydes (RCHO).
(8) ▪ ▪
(9) ▪ ▪

12
Because of the formation of not just one, but in most cases two radical species, the
propagation of autoxidation becomes a cascade that threatens the quality of high-lipid matrices.
The primary byproducts of lipid oxidation are hydroperoxides. While these substrates are
tasteless and odorless, their instability begets secondary byproducts (e.g. aldehydes, ketones,
alcohols, acids, hydrocarbons) have a great impact on flavor. Aldehydes are often very easy to
detect by humans, some at concentrations as low as 1 ppm. Ultimately, the degradation of
hydroperoxides, unsaturated aldehydes and ketones, and volatile secondary bi-products of
hydroperoxide degradation can interact with proteins, amino acids, and amines, altering sensory
characteristics, environmental pH, and the nutritional status of the foods from which they are
derived (Halliwell et al., 1990; von Sonntag et al., 1990).
2.2.4 Termination
The mechanism of termination includes a condensation reaction involving peroxy,
alkoxy, or alkyl radicals. For reactive radical species: (10) the combination of two peroxy
radicals at room temperature lead to the production of diatomic oxygen and a peroxy-linked
dimer (ROOR). Under low oxygen pressures and high temperatures, (11) ether-containing
dimers (ROR) can be produced from alkoxy radicals and (12) carbon-carbon linked dimers (RR)
can be generated from alkyl radicals. Lastly, (13) alkyl radicals can combine with peroxy
radicals to generate peroxy-linked dimers (ROOR) (Hseih et al., 1989, Frankel, 1980; Frankel,
1982).
(10) ▪ ▪
(11) ▪ ▪
(12) ▪ ▪
(13) ▪ ▪

13
In conclusion, the oxidation of lipids is a complex process that undergoes several
complex mechanisms. The environmental conditions and initial substrates often generate several
pathways that lead to a diverse assortment of primary and secondary end products. These end
products can lead to off-odors, off-flavors, nutrient degradation, environmental changes, and
possibly even toxins.
2.3 Measurement of Lipid Oxidation
Because oxidative decomposition is of economic and nutritional importance to industries
whose products have high lipid concentrations, multiple tests of lipid oxidation have been
employed to detect the degree to which a sample has oxidized. The most intuitive and useful test
of lipid oxidation is sensory analysis. The nature of the food industry is consumer-based. That is
to say, if consumers detect an inferior product, consequences can be observed in the form of
economic loss, loss of product credibility, and loss of reputable stature. Alternatively, chemical
methodologies have been long employed to detect oxidation in food products. To date, there is
no methodology or instrument that can detect all possible initial, primary (hydroperoxides),
secondary and tertiary species of the oxidation process. Even with current methodologies and
instruments, there is no perfect way to measure such species in terms of all lipids, all lipid-
containing foods, nor under all processing conditions. At best, each method or instrument can
measure a few changes under specific conditions for a specified period of time. In terms of
oxidation of high-lipid foods, primary and secondary end products are of the highest value to the
consumer and industry.
2.3.1 Sensory Evaluation
The consumer holds the power of discrimination between an acceptable product and an
unacceptable product. This axiom combines with the reality that the human senses are more

14
sensitive than any machine to explain why sensory evaluation is the ultimate method when
assessing the quality of a food product (Meilgaard et al., 1990). Humans can combine the
structural, compositional and internal physical forces of a food matrix in a near-instant manner.
At the same time, the human experience can combine physiological, psychological and cognitive
data about that matrix; this latter facet accounts for the higher-quality of results from the sensory
analysis in comparison to a machine. In fact, many attempts to use a machine to emulate a single
human sense can, at best, only show correlation (Cook et al., 2005; Kappes, Schmidt, & Lee,
2007) and, at worst, fail (Kappes, Schmidt, & Lee, 2006); Lee et al, 2005). Conversely, sensory
evaluation has its disadvantages; physiological factors (e.g. adaptation error), psychological
factors (e.g. expectation error), poor physical conditions (e.g. perfume, “supertaster” status), and
poor environmental conditions can affect human responses in addition to it being costly
(Meilgaard et al. 1990). For these factors, instrumental analysis and chemical assays have proven
superior. Many authors have found reconciliation by combining both chemical assays (TBARS,
POV, etc.) with instrumental analysis (gas chromatography, solid phase microextraction) and
sensory analysis.
2.3.2 Chemical Methodologies
2.3.2.1 TBARS
Thiobarbituric reactive substances (TBARS) is generally considered the ‘gold standard’
in the measurement of lipid oxidation, with specific appreciation held by those using a muscle-
food matrix (Gray & Monahan, 1992). The overall methodology involves the spectrophotometric
measurement of a pink chromophore giving an absorption maximum between 530 and 533 nm
(Miller, 1998). The chromophore is formed by the reaction of 2-thiobarbituric acid (TBA) with a
secondary product of lipid oxidation, generally aldehydes and ketones. Often, 1,1,3,3-

15
tetraethoxypropane (TEP) is used to create a standard curve against which a TBARS-value can
be calculated. This polymethinic pigment complexes with TBA and reacts to liberate
malondialdehyde (MDA) in a hydrolysis reaction [Figure 2.2].
Figure 2.4: Reaction between TBA and MDA to form TBA pigment (Fernández, et al. 1996)
The extent of oxidation is frequently given in milligrams of MDA equivalents per
kilogram of sample. Interfering agents have been cited as acids, esters, sugars, amino acids,
oxidized proteins, pyrimidines and pyridines (Guillén-Sans & Guzmán-Chozás, 1998). The lack
of chemical specificity of the assay has garnered the all-inclusive term “reactive substances” in
the assays’ name.
While the assay is used almost ubiquitously in the literature, it contains multiple
limitations that need to be addressed. First, the assay is extremely sensitive to operator-use.
Secondly, there may be discrepancy in the methodology of the experiment. The method
described by Tarladgis, Watts and Younathan (1960) uses steam distillate, while methods
described by Miller (1998) using acidic extracts are faster and easier. The advantage of an acidic
extract has been recommended under conditions where the sample size is large (Pikul et al.,
1989). Also, the acidic extraction is done under cold conditions, which inhibits thermally-
generated products from distillation methodology. Third, while the test is capricious in detecting
lipid oxidation products, it can falsely recognize substrates such as nitrites (e.g. cured meats)

16
(Shahidi, 1991). Lastly, the short chain carbon products that are produced (such as MDA) are not
stable and degrade to organic alcohols and acids (Fernandez et al., 1997).
Taking these cautions into consideration, it is known that iron catalyzes hydroperoxides
production in meat to MDA at physiological pH and temperature (Janero, Burghardt, 1989).
Most importantly, sensory analysis has shown that off-flavors in meat are strongly associated
with the production of TBARS, pentanal, and hexenal (Stetzer et al., 2008; Poste et al., 1986; St.
Angelo et al., 1987). In fact, panelists can detect oxidation off-flavors when the TBA values are
as low as 0.5 to 2.0 μg / g sample (Gray, Gomaa & Buckley, 1996).
2.3.2.2 Carbonyl Value
As an alternative method to measure secondary oxidation products is the determination of
carbonyls (Henick, Benca, & Mitchell, Jr., 1954). As mentioned previously, carbonyl compounds
are responsible for most deleterious flavors; specifically, volatile carbonyl compounds
participate in off-flavor production. As such, methods to determine these compounds, quantify
them, and correlate them with sensory attributes have been developed.
Most methods to quantify volatile carbonyl compounds involve vacuum or steam
distillation or extraction via hexane. The particularly well-known method by Henick, Benca &
Mitchell (1954) measures the formation of 2,4-dinitrophenyl hydrozones in the presence of an
acid catalyst (generally trichloroacetic acid) from carbonyl compounds at 340 nm under alkaline
conditions. Disadvantages to this method involve the degradation of hydroperoxides due to the
conditions of the test.
2.3.2.3 p-Anisidine value
The anisidine value is a determination of secondary oxidation products, specifically 2-
alkenyl concentration (White, 1995). As a spectrophotometric assay, the value is defined at 100

17
× Absorbance at 350 nm of 1 gram of fat per 100 mL of p-anisidine:acetic acid solvent (AOCS,
1998). The p-anisidine value has often been correlated to the headspace of volatile analysis ,
polymer content and sensory evaluation (Tompkins & Perkins, 1999), as well as FTIR
spectroscopic predictions in thermally stressed fats and oils (Dubois et al., 1996). While it hasn’t
been considered particularly valuable for determining off-flavors in products stored at ambient or
refrigerated temperatures (Holm & Ekbom-Olsson, 1972), it tends to be a rapid, widely
reproducible assay in determining secondary oxidation products of thermally-stressed matrices.
2.3.2.4 Peroxide-Oxygen Value
As primary oxidation products, hydroperoxides are formed in low levels. As such,
measurement of these products is directed towards uncooked products stored at low temperatures
(Coxon, 1987). Herein lies multiple disadvantage in the measurement of primary oxidation
products: (1) their predilection to degrade into volatile, secondary oxidation products; (2) after
maximum levels are achieved, they decay as a function of temperature, environment, etc.; (3)
any test measuring peroxides will only give values for that specific point in time, making
comparison among samples difficult; (4) the peroxide value and negative sensory attributes have
been inconsistent tend to be strictly matrix- and processing-dependent (Kanner, et al., 1992;
Fennema, 2008).
Derived from the AOAC method (1998), the peroxide value can be reported in
milliequivalents of iodine per kilogram of fat. For muscle tissue, hydrophobic solvents are
utilized to extract the lipid portion of the matrix. Caution must be taken when choosing solvents
(which must be free of reducing/interfering agents) and when evaporating the solvent from the
lipid. The most common POV method used for meat was developed by Folch et al. (1957);
however, other methods include iodometric titration and other colorimetric changes (e.g. the

18
ferric thiocyanate method). When using this method, units can be given in milliequivalents of
peroxide per kilogram fat.
In essence, POV can be used for determining early stages of oxidation, but fails as a
method of analysis for prolonged storage (or to the point of consumer dissatisfaction).
Regardless of the method, researchers must always be cognizant that values given are empirical,
and caution should be taken when making conclusions on the monitoring of oxidation.
2.3.2.5 Conjugated Dienes
Geometric isomerization is one of the first noticeable changes that occur as lipids oxidize.
Diene conjugation occurs primarily as a method of stabilization after hydrogen atom abstraction
destabilizes the lipid, and appears again during hydroperoxide formation to again offer
stabilization. This isomerization can be determined quantitatively via absorption at 232-234 nm
(Dobagarnes & Velasco, 2002). When using a complex system (such as meat), lipid needs to be
extracted using a bi-phasic solution. Hexane:Isopropanol in a 3:1 ratio is the most common
solution employed (Juntachote et al., 2006) because of its ability to remain monophasic until the
addition of a hydrophilic constituent causes separation.
There are several advantages to the conjugated diene methodology. In addition to being
faster and simpler than assays such as POV, the conjugated diene assay does not require the use
of chemical reaction and can be performed on smaller samples. Conversely, it does suffer from
the same environmental conditions as Peroxide Oxygen Value. Also, the use of nature of these
species stability causes a plateau during measurement (when the concentration of breakdown
equals the concentration of newly formed conjugated dienes).

19
2.3.3 Instrumental Analysis
The use of a gas chromatograph (GC) and tools such as gas chromatography/ mass
spectrometry (GS/MS) in characterizing and quantifying volatile compounds has been widely
appreciated. These instrumental methodologies are highly sensitive, reliable and well suited for
many organic compounds (James, 1995). Methods using these machines and techniques include
solid phase microextraction (SPME)/ static headspace, dynamic headspace, solvent assisted
flavor evaporation, in addition to direct gas chromatography. In static headspace analysis, gas
above the sample (which has come to equilibrium) is transferred directly in a GC column which
then separates compounds and quantifies them based on polarity and size. This is advantageous
because it does not destroy the sample, is convenient and rapid as a method for analyzing volatile
compounds. The disadvantage of this method is the requirement of elevated temperatures at
which the sample must be held.
2.4 Antioxidants: Control of Lipid Oxidation
A common method to inhibit lipid oxidation is to employ the use of antioxidants. No
antioxidant is capable of stopping / reversing the process of oxidation, but they can minimize the
cascade of reactions. Also, antioxidants do not function to control hydrolytic rancidity (the cause
of which is enzymatic). Compounding the issue, the variability of fats and fat composition in
foods translates to multiple problems associated with antioxidants and measurements of their
efficacy. To start, each system of lipid (plant-, monogastric-, or polygastric-based) contains
different levels of oils and fats with different levels of endogenous antioxidants. Because of this
intrinsic difference, each system must be evaluated specifically. Also, caution should be waved
against comparing results from one matrix to a separate matrix. During experimentation,
temperature variations and assays used can alter results. Depending on the nature of the species

20
being measured (geometric isomerization, primary, secondary or tertiary oxidation products),
temperature can alter the mechanism of oxidation, volatility of antioxidant or breakdown of
hydroperoxides (Gunstone, 1999). Mixtures of antioxidants have synergistic effects. Perhaps
most importantly is the influence of solubility and distribution of the antioxidant in a matrix.
From these factors, it becomes evident the complexity of the issue of qualifying and quantifying
antioxidants. Before quantifying the efficacy of an antioxidant in a specific matrix, it is helpful to
separate antioxidants based on their mechanisms of action. While many authors qualify
antioxidants differently, the scientific community at large has agreed on 6 mechanistic actions
(commonly divided into 3 categories, denoted below by the superscripts †,‡, and
§) (Ruberto et
al., 2001; Athukorala et al., 2006):
a. Scavenging species that initiate lipid oxidation†
b. Chain breaking to prevent hydrogen atom abstraction†
c. Quenching singlet O2 to prevent peroxide formation‡
d. Peroxide removal‡
e. Chelating free metal ions‡
f. Reduction of localized O2 concentration§
2.4.1 Type I † (Chain Breaking Antioxidants)
The first, and most prevalent, group of antioxidants is the chain-breaking antioxidants.
Mechanistically, this category promotes the termination process. Structurally, compounds with
high unsaturation (usually conjugated) or many phenolic components fall into this category.
These compounds act sacrificially, and only as long as the stability of their structures allow.
These free radical acceptors are known to react with hydroperoxy radicals (ROO▪) and not alkyl

21
radicals (R▪), indicating a competition between the inhibition reaction (4’) and the chain
propagation reaction (4) (Bolland & Ten Have, 1947):
(4’) ROO▪ + AH
ROOH + A
▪
The characterization of these “primary antioxidants” is governed by their activation energy (EA) ,
rate constants, red-ox potential, solubility, and length of activation. Because antioxidants of this
category can donate a hydrogen atom and retain a stable structure through resonance, they
prevent the cascade of oxidation from continuing for a modest amount of time. This is
functionally seen by an increase in the induction phase of oxidation.
Type I antioxidants are prevalent in foods. Recently, Rojas & Brewer (2008)
demonstrated that consumers have trended towards “natural” and “clean labeled” products,
opting to trade synthetic antioxidants such as BHA/BHT and TBHQ with those from natural
sources. Many plant sources contain a variety of natural phenolic antioxidants, and an enormous
amount of research has been published on antioxidant and antimicrobial activities of their
extracts. In addition to scavenging free-radicals, antioxidant components from plant sources can
chelate metals (Type II) and absorb light in the ultraviolent region (a high-energy source of free
radicals).
2.4.2 Type II ‡ (Free Radical Prevention)
The mechanisms that chelate metals or destroy hydroperoxides fall into the category of
Type II antioxidants. Largely, metal chelators such as ethylenediamine-tetraacetic acid (EDTA)
and ascorbic acid (vitamin C) are used in these functions. Their use relates to the matrix in which
they are applied. In high water foods, they can act effectively in binding metals; in proteinaceous
foods with highly bound metals, they tend to be less effective (Labuza et al., 1991). Additional

22
environmental concerns are involved with thermally processed foods, presence of enzymes, and
composition of the matrix.
Hydroperoxide destroyers also fall into the category of type II antioxidants. Tocopherol
(vitamin E) and Trolox™ (a carboxylic acid analog of vitamin E) work to reduce hydrogen
donation (Tappel, 1972). Meat-related foods also contain endogenous hydroperoxide and
hydrogen peroxide quenchers, such as glutathione peroxidase and catalase (Niki, 1987). These
enzymes are effective in reducing primary oxidation products without generating free radicals.
Finally, it is of paramount importance to acknowledge that synergy between type I and type II
antioxidants occurs.
2.4.3 Type III§ (Environmental Control)
Environmental control is a mechanism of controlling oxidation that relates more to
physical parameters than chemical modification of a matrix. Because the initiators of oxidation
are varied, type I and II antioxidants are limited by their specificity. However, altering the
environment of the matrix so that it has less unbound water, lower temperatures, exclusion of
light or reduced access to oxygen has also been shown to prolong the induction period of lipid
oxidation.
2.4.4 Natural Antioxidants
With the change in consumer perception of natural versus synthetic food additives (Rojas
et al., 2008), the food industry has had to make a drastic alteration in their methods of
antioxidant activity. In the search for natural antioxidants, many botanical and algal agents have
been researched. These biological substrates contain compounds such as sulfated
polysaccharides, phenolics, tepenoids, lactones, sterols and fatty acids. (McDermid & Stuercke,
2003; Duan et al., 2006; Qi et al., 2006). From a chemical standpoint, the major plant phenolic

23
compounds can be broken into aromatic indoles (e.g. betalain, found in beets), reducing lactones
(e.g. vitamin C), terpenes (e.g. lycopene, found in tomatoes), tocopherols (e.g. vitamin E) and
polyphenolic compounds.
Phenolic compounds are of great interest. Of the phenolic compounds, four groups can be
further subdivided: phenolic acids (gallic acid, rosmarinic acid,), phenolic diterpenes (e.g.
carnosic acid), flavonoids (chatechin, epicatechin) and volatile oils (eugenol, methnol). These
categories also dictate mechanistic antioxidative pathways. Where phenolic acids may trap free
radical species, flavonoids can inhibit oxidation by chelating metals or scavenging free radicals
(Geldof & Engeseth , 2002).Their efficacy in a system is dependent on their chemical
characteristics (number of double bonds, number and placement of hydroxyl groups, etc.) as well
as their physical location within a food (propinquity to emulsion interfaces, etc.) (Lupea et al.,
2008; Wanatabe et al., 2010). Brown and Kelly (2007) proved that the location of hydroxyl
substitutions on a compound affects the efficacy in phenolic compounds, while Gheldof and
Engeseth (2002) verified this fact in flavonoids . Specifically ortho-dihydroxy substitutions were
found to be more effective than trihydroxy-substituted compounds, potentially due to steric
hindrance of the more-substituted phenolic compound (Figure 2.5).
Figure 2.5: Gallic acid (left) showing a higher degree of substitution than protocatechuic acid
(right).

24
Of specific interest to this study is the amount of natural antioxidant compounds found in
POMx (the source of pomegranate extract in this study). Rasheed et al. (2009) and Sartippour et
al. (2008) both reported the contents of POMx to contain 86.0% ellagitannins (according to
manufacturer’s data) with 19% ellagitannins as punicalagins and punicalins (Figure 2.6), 4% free
ellagic acid, and 77% oligomers composed of 2–10 repeating units of gallic acid, ellagic acid,
and glucose in different combinations.
Figure 2.6: Punicalagin (left) and punicalin (right) constitute antioxidant components of POMx
Ellagitannins are polyphenolic derivitives of ellagic acid, formed through oxidative
reactions. The galloyl groups found in ellagitanins are formed through depside bonds.
Figure 2.7: Ellagic Acid

25
2.5 Measurement of Antioxidant Potential
Due to the variety of mechanisms that can induce oxidation (photooxidation, enzymatic
oxidation, autoxidation, etc.) and the complexity of matrices (food, cellular, etc.), comparison of
antioxidants remains a challenge in both the fields of nutrition and food science. The use of
model studies remains beneficial to both fields. However model systems are costly, labor
intensive and rarely retain applicability across matrices. While there has yet to be a method of
direct analysis that perfectly characterizes an antioxidant or can apply across all antioxidants,
there are multiple assays in the literature that have attempted to measure total antioxidant
capacity in vitro. While the ones discussed hereafter are not exhaustive, they are both common
and display the advantages and disadvantages among published methods.
Briefly, the scientific community has developed experimental methods to measure
antioxidation capability based upon mechanistic features that relate to the mechanism of
oxidation. For the duration of this overview, only food matrices will be taken into account, so as
to limit compounding issues of metabolic interconversion. Frankel and Meyer (2000), in their
review on antioxidants, encouraged a multi-dimensional analysis when evaluating antioxidants.
Furthermore, their article outlined basic considerations including the use of biologically relevant
substrates and molarly equivalent antioxidants, using various oxidation conditions, measuring
both primary and secondary oxidation products, and quantifying results based on induction
period, percent inhibition, IC50 (antioxidant concentration to achieve 50% inhibition of
oxidation) or rates of hydroperoxide formation/decomposition. From these tenets, a multitude of
antioxidant assays have been developed that can roughly be broken into two categories: single-
electron transfer (SET) assays and hydrogen-atom transfer (HAT) assays. Huang et al. (2005)
defined 8 criteria that any approach to antioxidant measurement should possess:

26
a. Measures chemistry actually occurring in potential application
b. Utilizes a biologically relevant radical source
c. Simplicity of the assay,
d. Clarity of the end-point and mechanism
e. Readily available instrumentation
f. Good intra- and inter-assay reproducibility
g. Adaptability to simultaneously assay lipo- and hydrophillic
antioxidants
h. High throughput for routine quality control analysis
2.5.1 Single-Electron Transfer Assays
The popularity and ubiquity of SET assays originates from their reproducibility, low cost,
and drastically less labor-intensive procedures. Mechanistically, assays of this type are
fundamentally based on reduction of one compound (usually a metal-alloyed species). A simple
representation of the mechanism was described by Huang, Ou, and Prior (2005) as such:
Probe (oxidant) + e- (from antioxidant) → reduced probe + oxidized antioxidant
(4’) ▪ ▪ ▪
(5’) ▪ ▪ ▪ ▪
(6’) ▪ ▪
(Apak 2007)
Often, SET assays employ the use of spectrophotometric color changes or classical redox
titrations as a quantification of reducing ability of the antioxidant in question. Reducing ability

27
has been largely linked to antioxidant activity (Nawar, 1996). From this, it would fit that
“electron based”-transfer assays would give comparable (but not identical) results. The reason
for this is due to the diverse reaction conditions: red-ox potentials, pH, and kinetics of specific
assays
2.5.1.1 Reduction by Folin-Ciocalteu Reagent
Proposed in 1912 and developed in 1927 (Ciocalteu, 1927) to measure phenolic content
in proteins, the Folic-Ciocalteu Reagent (FCR) has been used often to correlate the phenolic
profile of compounds with their antioxidant activity (on the basis of reducing capacity). Since
then, the International Organization for Standardization (2005) has set forth a methodology for
determining total polyphenols that many authors have adapted for alternate matrices. A major
use of this assay is the oxidation of mono- and vicinal diphenols, species not always reactive in
other SET assays. The assay uses an oxidant with an uncharacteristically high standard redox
potential (0.7 V) and appears to be a powerful, nonspecific oxidant. Singletary et al. (1999) have
indicated the assay is convenient, simple, has a large body of comparable data, and uses only
common equipment (Singleton et al., 1999). A critical look at the procedure and environmental
conditions was published in 1999 (Singleton et al.). The currently accepted mechanism is the
reduction of molybdenum in a sequence of one- and two-electron reactions on the
heteropolyphospho-tungstates/molybdates (possibly, the Keggin anion (Shown in Figure 2.8)
[PMoW11O40]4-
or Dawson anion [3H2O∙ P2O5∙13WO3∙5MoO3 ∙10H2O]) (Huang, Boxin & Prior,
2005; Apak et al.,2007). They exist as hydrated octahedral complexes of the metal oxides caged
around the central phosphate. The structure of the this compound shows a phosphorous situated
at the center of a polyoxometallate cage.

28
Figure 2.8: Potential Keggin structure of the active agent in Folin-Ciocalteu reagent; color code:
Molybdenum and Tungsten, pink; Oxygen, red; Phosphorous, orange. (Housecroft & Sharpe,
2005)
Since no alteration in the cage is observed by the addition of electrons, in lieu of the
chemistry involving molybdenum and tungsten being nearly identical, the reaction is assumed to
be described:
M6+
+ e- → M
5+
The alkaline conditions under which the procedure is run can be concerning. Even in the
methodology, the alkaline conditions destroy excess FC reagent. Without the presence of a
reducing species and sufficient time to reduce FCR, the solution turns colorless. However, any
phenolic species will dissociate into a phenolate anion, capable of reducing the FCR and creating
a blue colored species whose absorbance can be determined between 730 and 760 nm.

29
Figure 2.9: Dissociation of phenol to phenolate resonance structure.
Depending on the nature of the antioxidant extract, considerations need to be taken into
account, such as the presence of reducing sugars, phenolic amino acids, copper (I) complexes,
vitamin C, etc. Additionally, the nature of the phenolate ion makes the pH important. While a
basic environment is unusual for a food matrix, the phenolate ion requires a pH near it’s pK to
rapidly uptake oxygen to completion (Figure 2.9). Regardless, much data has been generated and
as long as samples of similar
2.5.1.2 Free Radical Scavenging by DPPH
2,2-Diphenyl-1-picrylhydrazyl (DPPH) is a stable free radical synthesized in 1922
(Goldschmidt & Renn, 1922) and used for the measurement of antioxidant activity (Blois, 1958).
The stability is determined by the delocalized electron and nature of the molecule to resist
dimerizing (as most radicals might) (figure 2.10). The overall reaction is a decolorized reduction
of the dark violet solution (which gives a characteristic absorption band at 517 nm). It is
advantageous for use over a wide pH range, while being mindful that its solubility is better in
alcoholic environments and it is highly sensitive to atmospheric oxygen and light.

30
Figure 2.10: Resonance structure of DPPH (Ionita, 2005).
While scavenging DPPH was originally presumed to be an HAT-based assay, Ionita
(2005) indicated that DPPH did not scavenge oxygen active species, and Foti et al.(2004)
determined that it occurs as a fast electron transfer assay. Authors have positively correlated the
scavenging of DPPH with antioxidant structure (namely increased hydroxyl groups and higher
activity) (Sroka & Cisowski, 2003). With the ubiquity of the assay, multiple authors have
attempted to set method parameters to follow (Molyneux, 2004; Sharma & Bhat, 2009). Abuse
by many publications has come in the form of solvent chosen and concentration of DPPH. The
extraction of an antioxidant using buffered methanol is preferred for non-polar/less polar and
polar solvents (over water and acetone) and a DPPH concentration of 25-70 μM gives the most
accurate results.
Absorbance results have been given in numerous ways, due to the ubiquity of the assay:
%DPPHrem =
Antiradical Efficiency =

31
Or in terms of a standard curve, often Trolox™, gallic acid, or ascorbic acid (Molyneux, 2004;
Szabo, Idiţoiu, Chambre & Lupea, 2006).
Certain disadvantages are inherent due to the nature of the radical. Structurally, it is
stable, which bears little resemblance to the transient and highly reactive peroxyl radicals it is
meant to imitate (Huang, Ou & Prior, 2005). Like other reductive species, antioxidants that react
with peroxyl radicals (rutin) react slowly with DPPH. Furthermore, the stoichiometry of the
antioxidant must be known, as ascorbic acid reacts much faster than sulfur-containing molecules
(Molyneux, 2004). It is also unreactive to monohydric phenols, simple sugars, purines and
pyrimidines, while it has a tendency to precipitate proteins. Because its kinetics are not linearly
correlated to DPPH concentration, results may be skewed heavily depending on the time of
measurement.
2.5.1.3 Colorimetric Determination by Iron-salts
Iron and iron complexes are advantageous in terms of direct analysis of antioxidants
because they are biologically relevant. In meat, heme-iron is a common reducing agent that
assists in the process of oxidation. Many metabolic reactions involve the reduction ferric
compounds (Fe3+
) to ferrous (Fe2+
) ones, such as ferric tripydriyltriazine [Fe(TPTZ)2, Figure
2.11] used in the popular Ferric Reducing Antioxidant Power (FRAP) assay.
Fe(TPTZ)23+
+ ArOH Fe(TPTZ)22+
+ ArO∙ + H+
(Berker et al., 2007)

32
Figure 2.11: Mechanism of FRAP Assay (Huang et al., 2005)
In the literature, there are two primary assays that utilize iron chemistry: FRAP and
reducing power as determined by ferricyanide. Both are advantageous because they are simple
colorization reaction that are speedy, inexpensive and robust (Benzie & Strain, 1999). Both use
antioxidants as reducing agents and are measured by their colorimetric change at a given
wavelength. In FRAP, the red-ox reaction between ferric 2,4,6,-tripyridyl-s-triazine (Fe3+
-TPTZ)
to its divalent form liberates an intense blue color monitored at 593 nm. The reducing power in
FRAP is determined as a μM value:
FRAP (μM)value =
The non-specificity of the assay is useful to compare multiple antioxidants, but can be
problematic regarding antioxidants of different stoichiometric reactivities (e.g. vitamin C
compared to bilirubin). Also, Pulido et al. (2000) demonstrated with carotenoids, and Cao &
Prior (1998) with thiol-containing antioxidants, that certain structures may not show reactivity
depending on the media used (i.e. albumin). Also, the production of hydroxyl radicals can be
formed when ferrous iron (Fe2+
) reacts with H2O2 during red-ox cycling, due to the unbound
nature of the iron in this assay (Ou et al., 2001; Benzie & Strain, 1999).

33
While mechanistically similar, reducing power via ferricyanide relates even more closely in
terms of biological relevance [Figure 2.12].
Figure 2.12: The ferricyanide octahedral coordination complex (left) bears structural similarity
to Fe-protoporphyrin IX (right) found in hemoglobin.
Also of note, where the FRAP assay is held under acidic conditions, reduction by
ferricyanide utilizes a buffer that carries out the reaction under neutral conditions. This is due to
the hydrolysis of iron near neutral pH conditions; Ferricyanide, however, is stable to this
hydrolysis due to the saturation of six monodentate ligands which simultaneously contribute to
its biologically relevant conditions.
The chemistry associated with this assay results from the Fe3+
cation (a high-spin
complex, where all 4 of the 5 d-orbitals are filled with lone electrons) being reduced to Fe
2+
(where 3 of the 5 orbitals are doubly occupied). In the ferri-/ferrocyanide complexes, those of
Fe2+
in [Fe(CN)6]4-
have shorter bond lengths and different stretching frequencies indicating
stronger pi-bonding in the lower oxidation state (Housecroft & Sharpe, 2005). The transfer of

34
electrons from the 2+ to the 3
+ state gives a characteristic “Prussian blue” color that is measured
at 700 nm.
Additionally, the saturation of the complex reduces the likelihood of redox cycling of
iron (since the reduced iron is always bound to a stable complex). While unlikely, redox cycling
should be addressed, because of the addition of ferric chloride.
Fe3+
+ antioxidantreduced Fe2+
+ antioxidantoxidized
Fe2+
+ Fe(CN)63-
Fe[Fe(CN)6]-
Or
Fe(CN)63-
+ antioxidantreduced Fe(CN)64-
+ antioxidantoxidized
Fe(CN)64-
+ Fe3+ Fe[Fe(CN)6]
-
These reactions give a standard redox potential of 0.77V. Berker et al. (2007) indicated that the
reduction potential can be made greater by using (for antioxidants that may require it) o- or
batho-phenanthroline.
Regardless of the method, certain drawbacks are common to iron-based assays: not all
antioxidants can be assessed; bathochromic (specifically, solvatochromic) shifts are possible;
interference of chelating agents can create synthetically-lowered values.
2.5.1.4 Cupric Ion Reducing Antioxidant Capacity
Developed to assay thiols in aqueous solution or β-carotene in dichloromethane and
conquer certain other drawbacks to other reduction assays (FRAP, Folin, etc.), CUPRAC was
designed as a low-cost and simple assay to measure dietary antioxidants. The chromogenic
species of activity is Copper2+
neocuproine (shown below) which bears great resemblance to the
conjugated prophyrin ring in hemoglobin [Figure 2.13 similar to ferricyanide, mentioned above].
Because the reactive agent contains a macrocyclic ligand (with a redox potential of 0.6 V),

35
coordination to the copper center in unlikely; only electron transfer should occur. Similar to the
ferricyanide method, this allows for the assay to be carried out at physiological condition,
applicability to both hydrophilic and –phobic compounds, completion of redox reaction for most
common flavonoids, selective oxidation of antioxidants without affecting sugar and citric acid
(chelating agent), and the ability to characterize thiol-containing antioxidants (Apak et al., 2007).
n Cu(Nc)22+
Ar(OH)n → n Cu(Nc)2+
+ Ar(=O)n + n H+
where Cu(NC) represents cupric neocuproine and Ar(OH) represents a general aromatic
antioxidant.
Figure 2.13: CUPRAC Mechanism (Apak et al., 2007)
The CUPRAC assay is done under physiological conditions, and completed within 30 minutes.
Using an ammonium acetate buffered solution controls the liberated hydrogen ions. It is often
helpful to know the structure of the antioxidant tests, as flavonoids require acid hydrolysis to
transform them into their aglycon form for complete antioxidant activity to be measured.
The advantage of using Copper over iron-based antioxidant assays stems from the mildly
basic oxide that is formed in the cupric state. Because Copper2+
is more readily reduced, it
involves faster kinetics (in comparison with the ferric state of iron). Apak et al. (2007)
determined a high correlation with results between CUPRAC, ABTS / TEAC, reduction by FCR,

36
FRAP, reduction by ferricyanide and other antioxidant assays. Potentially the most important
aspect of the CUPRAC assay is its attempt to solve the ‘antioxidant polarity paradox’1. By being
able to assess antioxidants of either –philicity, CUPRAC offers a unique view towards qualifying
antioxidant activity.
2.5.2 Hydrogen Atom Transfer Assays
In contrast to SET-based assays, most HAT-based assays are competitive reactions
focused on the kinetic competition between the antioxidant and the substrate for peroxyl radicals.
More simply, they qualify antioxidant activity by a species ability to quench free radicals via
Figure 2.14: Chemical Structure of AAPH
hydrogen atom donation. These radicals are generated through the decomposition of azo-
compounds, such as 2,2’-azobis[2-amidinopropane] dihydrochloride (Figure 2.14). Assays of
this mechanism work very similarly, such as the Oxygen Radical Absorbance Capacity (ORAC)
assay, Total Radical Antioxidant Parameter (TRAP) assay and Crocin bleaching assay. As such,
they also all suffer from a relevance-perspective, as they apply a radical reaction without a
proper chain-propagation step (Prior et al., 2005). Similar to SET assays, the basic mechanism is
defined as:
(4’)
1 Antioxidant Polarity Paradox: hydrophilic antioxidants are often less effective than lipophillic antioxidants in oil-in-water emulsions; lipophillic are less effective than hydrophilic in bulk oil.

37
2.5.2.1 ORAC
The hydrogen-atom transfer that occurs during the Oxygen-Radical Absorbance Capacity
(ORAC) assay was first proposed by Glazer (1988, 1990). Since then, it has been modified and
is currently a gold standard for identifying antioxidant activity in medical, nutritional, and
industrial facilities. The most recent method proposed by Davalos et al. (2004) proceeds by the
following theoretical schematic: a free radical generator (commonly AAPH) reacts with an
indicator (fluorescein) to reduce its color over time. The addition of an antioxidant acts anti-
catalytically and inhibits the effects of the generator. The more hydrogen atoms the antioxidant
can donate, the longer the indicator remains active. Qualitative comparisons can be made by
measuring the area under the curve (AUC) of any given antioxidant. The AUC is an attempt to
measure the reaction rate and efficiency through the combination of inhibition percent and
inhibition time as a single value (Davalos, Gomez-Cordoves, Bartolome, 2004). The advantage
of in vivo antioxidant evaluation of antioxidants reflects the nature of oxidation and the nature of
antioxidants (i.e. compounds capable of extending the induction period of oxidation). Similarly,
the use of spectrofluorimetry is advantageous to spectrophotometry in that the former only
‘excites’ specific compounds, leaving other interfering agents at a ground-level ‘excitation’.
Often, authors find similarity between results from ORAC and results from other antioxidant
assays: ABTS (Simonetti, Pietta & Testolin, 1997; Frankel et al., 1995), DPPH (De Beer et al.,
2003; Larrauri et al., 1999), and lipid oxidation (Kondo, Ohnishi & Kawaguchi, 1999).
Part in parcel with the advantages ORAC has (in terms of ambiphilicity) is the fact that
fluorescein (the indicator and species on which the reaction is measured) is relatively polar,
while the overall solvent is not. Furthermore, the environment reacts with an artificial radical
initiator, while food systems have oxidation initiated by light, metals, heat and enzymes.

38
2.6 References
Aikens, J. & Dix, T.A. 1991. Perhydroxyl radical (HOO▪) initiated lipid peroxidation. Journ.
Bio. Chem., 266(23): 15091-15098.
AOCS. 1998. AOCS Official method Ti 1a-64. Spectrophotometric Determination of Conjugated
Dienoic Acid. Champaign, IL: Official Methods and Recommended Practices of the American
Oil Chemists Society.
AOCS. 1998. AOCS Official method Cd 8-53. Peroxide Value Acetic Acid-Chloroform Method.
Champaign, IL: Official Methods and Recommended Practices of the American Oil Chemists
Society.
Apak, R.G., Kubilay, G., Demirata, B., Özyürek, M., Ḉelik, S.E., Bektaşoǧlu, B., Berker, K.I. &
Özyurt, D. 2007. Comparative evaluation of various total antioxidant capacity assays applied to
phenolic compounds with the CUPRAC assay. Molecules, 12: 1496-1547.
Benzie, I.F.F & Strain, J.J. 1999. Ferric reducing / antioxidant power assay: direct measure of
total antioxidant activity of biological fluids and modified version for simultaneous measurement
of total antioxidant power and ascorbic acid concentration. Meth in Enzym., 299(2): 15-27.
Berker, K.I., Güҫlü, K., Tor, I., Apak, R. 2007. Comparative evaluation Fe(III) reducing power-
based antioxidant capacity assays in the presence of phenanthroline, batho-phenanthroline,
tripyridyltriazine (FRAP), and ferricyanide reagents. Talanta, 72: 1157-65.
Bitman, J. 1976. Fat content and composition of animal products: proceedings of a symposium.
Status report on the alteration of fatty acid and sterol composition in lipids in meat, milk, and
eggs. Board of Agriculture. pp 203.
Bielski, B.H.J., Arudi, R.L. & Sutherland, M.W. 1983. A study of the reactivity of HO2 / O2-
with unsaturated fatty acids. Jour Bio. Chem., 258(8): 4759-61.
Blois, M.S. 1958. Antioxidant determinations by the use of a stable free radical. Nature, 4517:
1199-1200.
Bolland, J.L. & Gee, G. 1946. Kinetic studies in the chemistry of rubber and related materials. II.
The kinetics of oxidation of unconjugated olefins. Transactions of the Faraday Society, 42: 236-
52.
Bolland, J.L. & Ten Have, P. 1947. Kinetic studies in the chemistry of rubber and related
materials. IV. The inhibitory effect of hydroquinone on the thermal oxidation of ethyl linoleate.
Transactions of the Faraday Society, 43: 201-10.

39
Bradley, G.G. & Min, D.B. 1992. Singlet oxygen oxidation in foods. Critical Reviews in Food
Sci. and Nutr., 31(3). 211-236.
Brown, J.E. & Kelly, M.F. 2007. Inhibition of lipid peroxidation by anthocyanins,
anthocyanidins and their phenolic degradation products. European Jour. Lipid Sci. Tech., 109(1):
66-71.
Cai, M. 1997. Biogeneration of watermelon aroma compounds. MS Thesis. Starkville, MS.
Mississippi State. 138 p.
Cao, G., & Prior, R.L. 1998. Serum antioxidant capacity is increased by consumption of
strawberries, spinach, red wine or vitamin C in elderly women. Clin. Chem., 44: 1309.
Choe, E. & Min, D.B. 2006. Chemistry and reactions of reactive oxygen species in foods.
Critical Reviews in Food Sci. and Nutr., 46: 1-22.
Cook, D.J., Hollowood, T.A., Linforth, R.S.T., &Taylor, A.J. 2005. Correlating instrumental
measurements of texture and flavor release with human perception. Int. Jour. Of Food Sci.
Tech.40 (6): 631-41.
Coxon, D. 1987. Measurement of Lipid Oxidation . Food Sci & Tech. 1: 164-6.
Davalos, A., Gomez-Cordoves, C. & Bartolome, B. 2004. Extending applicability of the oxygen
radical absorbance capacity (ORAC-fluorescein) assay. Jour. Agric. Food Chem., 52: 48-54.
De Beer, D., Joubert, E., Gelderblom, W.C.A. & Manley, M. Antioxidant activity of South
African red and white cultivar wines: free radical scavenging. Jour. Agric. Food Chem., 51: 902-
9.
Dobagarnes, M.C. & Velasco, J. 2002. Analysis of lipid hydroperoxides. Euro. Jour. Lipid Sci.
& Tech., 104: 420-8.
Dubois, J., van de Voort, F.R., Sedman, J., Ismail, A.A., & Ramaswamy, H.R. 1996.
Quantitative fourier transform infrared analysis for anisidine value and aldehydes in thermally
stressed oils. Jour. Am. Oil. Chem. 76: 787-98.
Farmer, E.H., Bloomfield, G.F., Sundralingam, A., & Sutton, D.A. 1942. The course and
mechanism of autoxidation reactions in olefinic and polyolefinic substances, including rubber.
Trans Faraday Society, 38:348-56.
Fennema, O.R. 2008. Food Chemistry. 4th
ed. New York: Marcel Dekker, Inc.
Fernández, J., Pérez-Álvarez, J.A., & Fernández-López, J.A. 1997. Thiobarbituric acid test for
monitoring lipid oxidation in meat. Jour. Food Chem. 59: 345-53.

40
Folin, O. & Ciocalteu, V. (1927) Tyrosine and tryptophan determinations of proteins. J. Biol.
Chem.73: 627-50.
Foti, M.C., Daquino, C. & Geraci, C. 2004. Electron-transfer reaction of cinnamic acids and their
methyl esters with the DPPH radical in alcoholic solutions. Jour Org. Chem., 69: 2309-14.
Frankel, E.N., Evans, S.C.D., McConnell, D.G., Selke, E. & Dutton, H.J. 1961. Autoxidation of
methyl linolenate. Isolation and characterization of hydroperoxides. Jour. Org Chem., 26: 4663-
9.
Frankel, E.N. 1980. Lipid oxidation. Prog. in Lipid Research, 19: 1-22.
Frankel, E.N. 1982. Volatile lipid oxidation products. Prog. in Lipid Research, 22: 1-33.
Frankel, E.N. 1991. Review. Recent advances in lipid oxidation. Jour. Sci. Food Agric., 54: 495-
511.
Frankel, E.N., Waterhouse, A.I. & Teissedre, P.L. 1995. Principal phenolic phytochemicals in
selected California wines and their antioxidant activity in inhibiting oxidation of human low –
density lipoproteins. Jour. Agric. Food Chem., 43: 890-4.
Frankel, E.N., Meyer, A.S., 2000. The problems of using-one dimensional methods to evaluate
multifunctional food and biological antioxidants. Jou. Sci. Food Agric. 80: 1925-41.
Galliard, T., Phillips, D.R. and Reynolds, J. 1976. The formation of cis-3-nonenal and hexanal
from linoleic acid hydroperoxide isomers by a hydroperoxide cleavage enzyme system in
cucumber (Cucumis sativa) fruits. Biochem. et Biophys. Acta. 441: 181-2.
Gebicki, J.M. & Bielski, B.H.J. 1981. Comparison of the capacities of the perhydroxyl and the
superoxide radicals to initiate chain oxidation of linoleic acid. Jour. Am. Chem. Soc., 103: 7020-
22.
Geldof, N. & Engeseth, N.J. 2002. Antioxidant capacity of honeys from various floral sources
based on the determination of oxygen radical absorbance capacity and inhibition of the in vitro
lipoprotein oxidation in human serum samples. Jour. Agric. Food Chem., 50(10): 3050-5.
Glazer, N. 1988. Fluorescene-based assay for reactive oxygen species: a protective role for
creatinine. FASEB J., 2: 2487-91.
Glazer, A.N. 1990. Phycoerythrin fluorescene-based assay for reactive oxygen species.Method
Enzymol., 186: 161-8.
Goldschmidt, S. &Renn. K. 1922. Zweiwertiger stickstoff: über das α,α-diphenyl-β-
trinitrophenyl-hydrazyl. IV. Mitteilung über amin-oxydation. Ber., 55: 628.

41
Gray, J.I., Gomaa, E.A. & Buckley, D.J. 1996. Oxidative quality and shelf life of meats. Meat
Sci. 43:S111-23.
Gray, J.I & Monahan, F.J. 1992. Measurement of lipid oxidation in meat and meat prodcuts.
Trends Food Sci. & Tech., 3: 315-9.
Guillén-Sans, R. & Guzmán-Chozás, M. 1998. The thiobarbituric acid (TBA) reaction in foods:
a review. Critical Review in Food Sci. and Nutr., 38: 315-330.
Gunstone, F. (1999). Fatty acid and lipid chemistry. 2nd
ed. Gaithersburg, MD: Aspen
Publications.
Halliwell, B. & Gutteridge, J.M.C. 1990. Role of free radical and catalytic metal ions in human
disease: an overview. Meth. In Enzym., 186: 1-85.
Harel, S. Kanner, J. 1985. Muscle membranal lipid peroxidation initiated by H2O2-activated
metmyoglobin. Jour. Agric. Food Chem., 33: 1188-92.
Haseloff, R.F., Ebert, B. & Roeder, B. 1989. Generation of free radicals by photoexcitation of
pheophorbide a, haematoporphyrin and protoporphydrin. Jour. Photochem. and Photobio.,
B:Biology, 3: 593-602.
Henick, A.S., Benca, M.F., & Mitchell, J.H. Jr. 1954. Estimating carbonyl compounds in rancid
fats and foods. Jour. Am. Oil Chem. Soc., 31:88-91.
Holm, U. & Ekbom-Olsson, K. 1972. P-Anisidine as a reagent of secondary oxidation products.
Int. Soc. For Fat Research. 11th
Congress. Goteborg, Sweden.
Housecroft, C.E. & Sharpe, A.G. 2005. Inorganic Chemistry. 2nd
Ed. Gosport, England: Pearson
Education, LLD.
Huang, D., Boxin, O., & Prior, R.L. 2005. The chemistry behind antioxidant capacity assays.
Jour. Agric. Food Chem., 53: 1841-56.
Huang, D., Ou, B. & Prior, R.L. (2005). The chemistry behind antioxidant capacity assays. Jour.
Agric. Food Chem. 53: 1841-56.
Hsieh, R.J. & Kinsella, J.E. 1989. Oxidation of polyunsaturated fatty acids: mechanisms,
products and inhibition with emphasis on fish. Adv. in Food and Nutr. Research, 33: 233-341.
Ionita, P. 2005. Is DPPH stable free radical a good scavenger for oxygen active species?
Institute of Physical Chemistry, Romania. Chemical Papers, 59(1): 11-16.
ISO / IEC 14502-1. (2005). Determination of substances characteristic of green and black tea
Part 1: Content of total polyphenols in tea – colorimetric method using Folin-Ciocalteu reagent.
International Organization for Standardization, Geneva, Switzerland.

42
James, C.S. 1995. Analytical Chemistry of Foods. 1st Ed. New York, NY: Blackie Academic &
Professional.
Josephson, D.B., Lindsay, R.C., Stuiber, D.A. 1983. Identification of compounds characterizing
the aroma of fresh whitefish (coregonus clupeaformis). Jour. Agric. Food Chem. 31: 326-30.
Juntachote, T., Berghofer, E., Siebenhandl, S., & Bauer, F. 2006. The antioxidative properties of
Holy basil and Galangal in cooked ground pork. Meat Sci., 72(3):446-56.
Kanner, J., German, J.B., & Kinsella, J.E. 1987. Inititation of lipid peroxidation in biological
systems. CRR Critical Reviews in Food Sci. and Nutri., 25(4): 317-64.
Kanner, J. & Rosenthal, I. 1992. An assessment of lipid oxidation in foods. Pure and Applied
Chem., 64(12):1964-69
Kappes, S.M., Schmidt, S.J., & Lee, S.-Y. 2006. Mouthfeel detection threshold and instrumental
viscosity of sucrose and high fructose corn syrup solutions. Jour. Food Sci. 71 (9): S597-S602.
Kappes, S.M., Schmidt, S.J. & Lee, S.-Y. 2007. Relationship between physical properties and
sensory attributes of carbonated beverages. Jour. Food Sci.72 (1): S001-S011.
Kellogg, E.W. & Fridovich, I. 1975. Superoxide, hydrogen peroxide and singlet oxygen in lipid
peroxidation by a xanthine oxidase system. Jour. Bio. Chem., 250(22): 8812-17.
Kondo, Y., Ohnishi, M. & Kawaguchi, M. 1999. Detection of lipid peroxidation catalyzed by
chelated iron and measurement of antioxidant activity in wine by a chemiluminescence analyzer.
Jour. Agric. Food Chem., 47: 1781-85.
Labuza, T. 1971. Kinetics of lipid oxidation in foods. CRC Critical Reviews in Food Tech., 2:
355-405.
Labuza, T.P., Heidelbaugh, N.D., Silver, M. & Karel, M. 1971. Oxidation at intermediate
moisture contents. Jour. Am. Oil Chem. Soc., 48(2): 86-90.
Ladikos, D. & Lougovois, V. 1989. Lipid oxidation in muscle foods: a review. Jour. Food Chem.
35: 295-314.
Larrauri, J.A., Sanchez-Moreno, C., Ruperez, P. & Saura-Calixto, F. 1999. Free radical
scavenging capacity in the aging of selected red Spanish wines. Jour. Agric. Food Chem., 47:
1603-06.
Lee, Y.-S., Luna-Guzmán, I., Chang, S., Barrett, D.M. & Guinard, J.-X. 1999. Relating
descriptive analysis and instrumental texture data of processed diced tomatoes. Food Qual. Pref.,
10(6): 447-55.

43
Lupea, A.X., Pop, M. & Cacig, S. 2008. Structure-radical scavenging activity relationships of
flavonoids from Ziziphus and Hydrangea extracts. Revista de Chimie, 59(3): 309-313.
MacManus-Spencer, L.A. & McNeill, K. 2005. Quantification of singlet oxygen production in
the reaction of superoxide with hydrogen peroxide using a selective chemiluminescent probe.
Jour. Am. Chem. Soc., 127: 8954-55.
Meilgaard, M., Civille, G.V. & Carr, B.T. 1990. Sensory Evaluation Techniques. 3rd
Edition.
Boca Raton, FL: CRC Press. 1-7.
Miller, D.D. 1998. Food Chemistry a laboratory manual. 1st edition. New York : John Wiley &
Sons, Inc. p. 57-67.
Molyneux, P. 2004. The use of stable free radical diphenylpicrylhydrazyl (DPPH) for estimating
antioxidant activity. Songklanakarin Jour. Sci. Technol. 26(2): 211-9.
Nawar, W.F. 1996. Lipids. In: Fennema O., editor. Food Chemistry. 3rd
edition. New York:
Marcel Dekker, Inc. pp. 225-320.
Niki, E. 1987. Antioxidants and relation to lipid oxidation. Chem. and Phys. Lipids, 44: 227-253
Ou, B., Hampsch-Woodill, M. & Prior, R.L. 2001. Development and validation of an improved
oxygen radical absorbance capacity assay using fluorescein as the fluorescent probe. Jour. Agric.
Food Chem. 49: 4619.
Pikul, J. Leszczynski, D.E. & Kummerow, F.A. 1989. Evaluation of three modified TBA
methods for measuring lipid oxidation in chicken meat. Jour. Agric. Food Chem. 37: 1309-13.
Poste, L.M., Willemot, C., Butler, G. & Patterson, C. 1986. Sensory aroma scores and TBA
values as indices of warmed-over flavor in pork. Jour. Food Sci. 51: 886-888.
Pulido, R., Bravo, L., & Saura-Calixto, F. 2000. Antioxidant activity of dietary polyphenols as
determined by a modified ferri reducing / antioxidant power assay. Jour. Agric. Food Chem., 48:
3396.
Rasheed, Z., Akhtar, N., Anbazhagan, A.N., Ramamurthy, S., Shukla, M., & Haggi, T.M. 2009.
Polyphenol-rich pomegranate fruit extract (POMx) Suppresses PMACI-induced expression of
pro-inflammatory cytokines by inhibiting the activation of MAP kinases and NF-kB in human
KU812 cells. Jour. Inflammation, 6(1):1-12.
Rhee, K.S., Dutson, T.R., Smith, G.C. 1984. Enzymic lipid peroxidation in microsomal fractions
from beef skeletal muscle. Jour. Food Sci. 49: 675-679.

44
Roberts, D.D., Pollien, P. and Watzke, B. 2003. Experimental and modeling studies showing the
effect of lipid type and level on flavor release from milk-based liquid emulsions. Jour. Agric.
Food Chem. 51: 189-195.
Rojas, M.C. & Brewer, M.S. 2008. Consumer attitudes towards issues in food safety. Jour. Food
Safety, 28(1): 1-22.
Ruberto, G., Baratta, M.T., Biondi, D.M. & Amico, V. 2001. Antioxidant activity of extracts of
the marine algal genus Cystoseira in micellar model system. Jour. Appl. Phycol., 13: 403-407.
Sartippour, M.R., Seeram, N.P., Rao, J.Y., Moro, A., Harris, D.M. Henning, S.M., Firouzi, A.,
Rettig, M.B., Aronson, W.J., Pantuck, A.J. & Heber, D. 2008. Ellagitannin-rich pomegranate
extract inhibits angiogenesis in prostate cancer in vitro and in vivo. International Jour. Oncology.
32: 475-480.
Shahidi, F., Pegg, R.B. & Harris, R. 1991. Effects of nitrite and sulfanilamide on the 2-
thiobarbituric acid (TBA) values in aqueous model and cured meat systems. Jour. Musc. Foods.
2 (1): 1-9.
Sharma, O.P. & Bhat, T.K. 2009. DPPH antioxidant assay revisited. Food Chem. 113: 1202-
1205.
Simonetti, P., Pietta, P. & Testolin, G. 1997. Polyphenol content and total antioxidant potential
of selected Italian wines. Jour. Agric. Food Chem., 45: 1152-1155.
Singleton, V.L., Orthofer, R., & Lamuela-Raventos, R.M. (1999). Analysis of total phenols and
other oxidation substrates and antioxidants by means of the Folin-Ciocalteu reagent. Meth. In
Enzy. 299: 152-178.
Sroka, Z. & Cisowski, W. 2003. Hydrogen peroxide scavenging, antioxidant and antiradical
activity of some phenolic acids. Food and Chem. Tox.., 41: 753-758.
St. Angelo, A.J., Vercellotti, J.R., Legendre, M.G., Vinnett, C.H., Kuan, J.W., James, C., et al.
1987. Chemical and instrumental analyses of warmed over flavor in beef. Jour. Food Sci., 52(5):
1163-1168.
Stetzer, A.J., Cadwallader, K., Singh, T.K., McKeith, F.K., & Brewer, M.S. 2008. Effect of
enhancement and aging on flavor and volatile compounds in various beef muscles. Jour. Meat
Sci. 79 (1):13-9.
Szabo, M.R., Idiţoiu, C., Chambre, D. & Lupea, A.X. 2006. Improved DPPH determiniation for
Antioxidant activity spectrophotometric assay. Institute of Chemistry, Slovak Academy of
Sciences, 61(3): 214-216.
Tappel, A.L. 1972. Vitamin E and free radical peroxidation of lipids. Annals of the New York
Academy of Science, 203: 12-28.

45
Tarlagdis, B.G., Watts, B.M. and Younathan, M.T. 1960. A distillation method for the
quantitative determination of malonaldehyde in rancid foods. Jour. Am. Oil Chem. Soc. 37: 44-
48.
Tompkins, C. & Perkins, E.G. 1999. The evaluation of frying oils with the p-anisidine value.
Jour. Agric. Food Chem. 44: 654-660.
Tressl, R., Bahri, D. and Engel, K.-H. 1981. Lipid oxidation in fruits and vegetables. Amer.
Chem. Soc. 16: 213-232.
von Sonntag, C. & Schuchmann, H.-P. 1990. Radical-mediated DNA damage in presence of
oxygen. Meth in Enzym. 186: 511-520.
Watanabe, T., Teranishi, H., Honda, Y. & Kuwahara M. 2002. A selective lignin-degrading
fungus, Ceriporiopsis subvermispora, produces alkylitaconates that inhibit the production of the
cllulolytic acive oxygen species, hydroxyl radical in the presence of iron and H2O2. Biochem.
and Biophys. Research Comm., 297: 918-923.
Watanabe, Y. Nakanishi, H., Goto, N., Otsuka, K., Kimura, T. & Adachi, S. 2010. Antioxidative
properties of ascorbic acid and acyl ascorbates in ML/W emulsion. Jour. Am. Oil Chem. Soc.,
87(12): 1475-80.
White, P.J. 1995. Conjugated diene, anisidine value, and carbonyl value analyses. Methods to
Assess Quality and Stability of Oils and Fat Containing Foods, edited by K. Warner and N.A.
Eskin. Am. Oil Chem. Soc,. 1:159-178.
Winterbourn, C.C. 1990. Oxidative reactions of hemoglobin. Meth in Enzym., 186: 265-272.

46
Chapter 3. Evaluation of Antioxidant Capacity of Commercially Available and Natural
Antioxidants
3.1 Abstract
The antioxidant activity of several natural less-common antioxidants extracts (pomegranate and
grape seed) were studied in contrast to common natural antioxidants (d,l-α-tocopherol, ascorbic
acid, and gallic acid) and butylated hydroxyanisole (BHA), a synthetic antioxidant. The
antioxidants were dissolved in a methanolic solvent (0.01 g / 100 mL) for single electron transfer
assays and acetone:water:acetic acid (0.5:70:29.5) for the hydrogen atom transfer assay.
Antioxidants were evaluated via the reducing capacity as determined by the Folin-Ciocalteu
reagent and ferricyanide method, free radical scavenging of 2,2-diphenyl-1-picrylhydrazyl
(DPPH), and oxygen radical absorbance capacity (ORAC). For each antioxidant, there was a
high correlation between reducing ability and phenolic content. Reductive capacity for
pomegranate and grape seed extract showed comparable antioxidant activity to two natural
antioxidants (gallic acid and ascorbic acid) and always showed statistically significantly higher
antioxidant activity than the synthetic antioxidant (BHA). Hydrogen atom donating ability of the
synthetic antioxidant was significantly higher than all natural antioxidants. d,l-α-Tocopherol
showed extremely low reductive activity while dietary selenium (produced by yeast metabolism)
showed no antioxidant activity as measured by any of the assays.
Keywords: antioxidant activity; pomegranate extract; grape seed extract
3.2 Introduction
Lipid oxidation continues to be a problem for the food industry. Since 1994, multiple
sources have indicated consumer rejection of synthetic, chemical-sounding food additives
(Hillman, 2010) in favor of those that are familiar and “natural” (Jopin, 2006) in favor of those

47
that are familiar and “natural”. While many synthetic antioxidants (BHT, BHA, TBHQ, EDTA,
etc.) have been engineered to maximize their efficacy at lower doses, plants are abundant with
endogenous antioxidants, such as polyphenols and vitamin E (Lee, Koo & Min, 2003).
Considering consumer trends, it becomes increasingly important to find sources of concentrated
antioxidants that function at the same capacity of their synthetic counterparts.
Pomegranates (Punica granatum ) are a concentrated source of natural polyphenolic
compounds, which can be further concentrated through solid-phase extraction. Rasheed et al.
(2009) and Sartippour et al. (2008) both reported the contents of pomegranate extract (POMx) to
have high antioxidant potency and contain 86% ellagitannins (according to manufacturer’s data -
Paramount Farms, CA, USA) with 19% ellagitannins as punicalagins and punicalins, 4% free
ellagic acid, and 77% oligomers composed of 2–10 repeating units of gallic acid, ellagic acid,
and glucose in different combinations. Ellagitannins are polyphenolic derivatives of ellagic acid,
formed through oxidative reactions with galloyl groups formed through dipeptide bonds.
Rasheed et al.(2009) noted that pomegranate extract suppressed inflammatory response in human
cells, while Shukala et al.(2008) found the same extract worked to reduce inflammation in
patients with rheumatoid arthritis. Both authors suggested reduction in inflammation was
associated with suppression of reactive oxygen species. To date, there have been no studies on
the use of pomegranate extract to delay the onset of oxidation in a high-lipid food matrix.
Phenolic compounds in grapes (Vitis vinifera) and their seeds have been shown to
promote antioxidant activity when incorporated to reduce peroxidation in vitro (Jayaprakasha,
Singh & Sakariah, 2001). The high amount of proanthocyanadins are continually credited for the
antioxidant activity of grape seeds. Rojas & Brewer (2007, 2008) indicated that industrially-
concentrated grape seed extract was highly effective in inhibiting oxidation in both cooked,

48
refrigerated and frozen, vacuum-packaged beef and pork. Furthermore, hydroperoxide and
propanol formation was inhibited in an emulsion system due to grape seed extract, as shown by
Hu & Skibsted (2002). In both plant extracts, the highly ringed structures that form polymeric
compounds are composed of gallic or ellagic acid; both are highly effective reductants that are
commonly employed in chemical assays utilized to show antioxidant activity. These constituents,
which can make up anthocyanin fractions as well, have been found to be responsible for the
antioxidant capacity (Rivero-Parez et al., 2008). Additionally, these ringed-compounds are
mechanistically correlated with electron transfer processes.
In both plant extracts, the highly ringed structures that form polymeric compounds are
composed of gallic or ellagic acid. Both are highly effective reductants that are commonly
employed in chemical assays utilized to show antioxidant activity. These constituents, which can
make up anthocyanin fractions as well, are responsible for the antioxidant capacity (Rivero-Parez
et al., 2008). Additionally, these ringed-compounds are mechanistically correlated with
stabilized radical species (e.g. phenolate anions) during electron transfer processes.
Selenium has been routinely proven to show antioxidant activity in vivo, through
metabolic biotransformation. Its status as an essential trace mineral in the human diet has been
well established (Holben & Smith, 1999). Mechanistically, it is well understood that
selenomethionine (a metabolic configuration of selenium) can be incorporated with glutathione
peroxidase to reduce hydrogen and organic peroxides during phase I metabolism. Because the
efficacy of antioxidants as nutritional supplements does not have to be evaluated by the Food and
Drug Administration, wholesale corporations often market and sell compounds, like selenium,
without educating consumers about which metabolic forms are active and promote antioxidant
activity. Many factors can destroy antioxidant activity, such as processing parameters, storage

49
conditions, and metabolically-inactive byproducts. This misnomer in education makes it
imperative to compare the presumed antioxidant activity in certain “natural” antioxidants, such
as dietary selenium, grape seed and pomegranate extract, with conventional and well-accepted
antioxidants like gallic acid, l-ascorbic acid (vitamin c), and d,l-α-tocopherol (vitamin E).
Multiple authors (Frankel &Meyer, 2000; Huang, et al., 2005; Apak et al., 2007) have
discussed the inability of a single methodology to evaluate antioxidant activity. While model
systems appear to be the best method for testing antioxidant activity in vivo, they remain
expensive, time-consuming, and untranslatable to other matrices. In an attempt to correct this
problem, multiple approaches towards a direct analysis have been suggested. These approaches
are commonly separated by their mechanisms into single-electron transfer (SET) and hydrogen-
atom transfer (HAT) assays. SET-based assays measure a proposed antioxidants ability to reduce
a chromogenic substrate (a literal definition of an antioxidant); HAT-based assays measure the
capability of an antioxidant to donate a hydrogen atom and quench a free radical species
(competition kinetics representative of the mechanism in lipid oxidation).
Multiple studies have taken an integrated SET/HAT assay or a multi-SET based approach
to evaluate the antioxidant potential of extracted algae and plant material (Thaipong, et al., 2006;
Yildrim, A. et al., 2001; Shon, M.-Y. et al., 2003; Anesini, C. et al. 2008; Huo, L. et al., 2011).
In each of these studies, the authors compared some or all of the antioxidant results from
reduction by FCR, reduction by ferricyanide, radical scavenging ability of DPPH, or oxygen-
radical absorbance capacity (ORAC) to denote antioxidant capacity. While the first three assays
are considered SET assays based on deprotenation and ionization potential, their experimental
conditions and substrates provide benefits useful in comparing antioxidant reductive capacity.
Conversely, ORAC measures the relative bond-dissociation energy and hydrogen donating

50
ability of a species, another important parameter of antioxidants. The Folin-Ciocalteu reagent is a
non-specific oxidizer originally intended for polyphenol characterization that uses an unknown
poly-molybdotungstate species to generate a chromogenic end-product characterized by its dark
blue hue commonly read spectrophotometrically at 760 nm. This method, along with ORAC, has
been standardized. Three methods have been standardized at the First International Congress on
Antioxidant Methods in June 2004 (Orlando, FL) and are considered a method of
standardization for antioxidant quantification: ORAC, Folin-Ciocalteu and ABTS/TEAC (Apak,
2007). The large amount of data generated from these assays make them ideal candidates in a
multi-dimensional approach for comparing antioxidant potential.
It is important to note the deficiencies of these assays, to utilize alternative assays to
partially resolve these issues. The Folin-Ciocalteu reagent is a non-specific oxidizer originally
intended for polyphenol characterization that uses an unknown poly-molybdotungstate species to
generate a chromogenic end-product characterized by its dark blue hue. The large amount of data
generated from this assay makes it an ideal candidate in a multi-dimensional approach to
comparing antioxidant potential. Additionally, the standardized procedure is simple, reproducible
and minimizes matrix interference by being read at 760 nm. However, the assay is intrinsically
laden with problems: its non-specificity measures non-antioxidant species, it doesn’t evaluate
thiol-related antioxidants in addition to inhibiting the measurement of certain compounds (such
as flavonoids-glycosylates which require acid hydrolysis to measure full activity), and the
alkaline pH required to generate the colored species enhances the reducing capacity of phenolic
compounds. Measurement by ferricyanide reduction is comparable to reduction by the FC
reagent as both SET assays have similar standard redox potentials (0.7 V and 0.77 V,
respectively). In addition, the ferricyanide reduction can offset the problems associated with

51
alkalinity. Because the ferric ion is complexed with six monodentate ligands, the reduction of the
assay can work at physiological conditions without concern of iron hydrolysis. Furthermore, the
biologically-relevant environment and structural similarity the ferricyanide substrate shares
structural with the heme-B structure in hemoglobin (which contrasts the molybdotungstate-
complex used in FCR) promote this assay as tantamount to FCR reduction. .
In contrast to these metal-catalyzed, colorization reactions, free radical scavenging by
DPPH uses an organic, stable free radical in a decolorization assay. Where the prior two assays
utilize aqueous enviornments (selecting for hydrophilic antioxidants), DPPH is soluble in organic
solvents, allowing for expanded measurement of hydrophobic antioxidants. In addition to its
simplicity, Thaipong et al. (2006) found the assay to give more reproducible results than other
assays (such as FCR). Floegel et al. (2011) found that DPPH had a high correlation (ρ = 0.949)
with other antioxidant assays (ABTS) in regards to fruit and beverage matrices, while Huang
(2005) found that reduction via ferricyanide and DPPH shared similar results in wild mushroom
extracts. The DPPH assay has been used extensively in conjunction with ORAC (mentioned
earlier as a standard method of antioxidant quantification) and shown comparative results in tea
infusions (Roy, M.K. et al., 2010) and honeys (Gheldof & Engeseth, 2002). The purpose of this
study is to compare and validate the antioxidant potency of three “natural” consumer
antioxidants (pomegranate and grape seed extracts and dietary selenium) in a multi-dimensional
direct analysis approach against accepted natural antioxidants (gallic acid and vitamins C and E)
and a synthetic antioxidant (BHA).
3.3 Materials and Methods
Reduction of Folin-Ciocalteu reagent, reduction by ferricyanide and free radical
scavenging by 2,2-diphenyl-1-picrylhydrazyl assays were designed as 7 (antioxidants:

52
pomegranate extract, grape seed extract, dietary selenium, butylated hydroxyanisole, l-ascorbic
acid, d,l-α-tocopherol, and gallic acid) one way analysis of variance with three replications.
Standard curves were run in duplicate and controls (containing distilled water) were used as
blanks. Oxygen Radical Absorbance Capacity assay was treated as a randomized, complete block
design with seven antioxidant treatments and eight replications. Standard curves were run in
quadruplicate and controls (containing acetone : water : acetic acid) were used as blanks.
3.3.1 Chemicals
Reagent-grade 2,2’-azobis(2-amidino-propane)dihydrochloride [AAPH] was purchased
from Wako Chemical (Richmond, VA). Folin-Ciocalteu’s phenol reagent, anhydrous sodium
carbonate (purity 99%), 2,2-diphenyl-1-picryl hydrazyl [DPPH] (purity 90%,), methanol (HPLC
grade), and trichloroacetic acid [TCA] were purchased from Sigma Aldrich Co. (St. Louis, MO,
USA). All other reagents (sodium phosphate, mono- and di-basic; Trolox™; fluorescein; ferric
chloride; potassium ferricyanide) were purchased from Thermo-Fisher Scientific, Inc. (Fair
Lawn, NJ, USA).
3.3.2 Antioxidants
Pomegranate extract and grape seed extract were donated by their respective
manufacturers. Pomegranate extract (POMx, Punica granatum L., Wonderful variety; Paramount
Farms, CA, USA) contained 86.0% ellagitannins (according to manufacturer’s data). Preparation
was a two-step process: first, fruit residue was extracted after pressing for juice; this was
followed by a solid-phase extraction of the residue to produce a powder with a high
concentration of polyphenols. This powdered extract was reported by the manufacturer to
contain on average 86.0% ellagitannins, 2.5% ash, 3.2% sugars, 1.9% organic acids as citric acid
equivalents, 0.8% nitrogen, and 1.2% moisture. The approximate percent distribution of

53
pomegranate polyphenols in POMx is as follows: 19% ellagitannins as punicalagins and
punicalins, 4% free ellagic acid, and 77% oligomers composed of 2–10 repeating units of gallic
acid, ellagic acid, and glucose in different combinations. Grape seed extract (Gravinol Super™,
Kikkoman, Tokyo, Japan) contained 98% total flavanols (89% proanthocyanidins) based on
manufacturer’s data; Dietary selenium (Nature’s Bounty™, Bohemia, NY, USA) containing 200
μg of selenium (selenomethionine) was derived from yeast origin. All further chemicals were
reagent-grade: d,l-α-Tocopherol (purity 89%, Alpha Aeser, Ward Hill, MA, USA;), ascorbic acid
(purity 99.2%, Fisher); gallic acid (99%, sigma); butylated hydroxyanisole (sigma); Standard
solutions were made by dissolving all antioxidants in respective solvents (methanol or
70:29.5:0.5 acetone:water:acetic acid) at a concentration of 0.010 g Antioxidant per 100 mL
solvent.
3.3.3 Reducing Power as Determined by Folin-Ciocalteu Reagent
The reducing capacity was determined by the antioxidant reduction of Folin-Ciocalteu
(FC) reagent. For the given antioxidants, this was determined spectrophotometrically (Lambda
950 UV/Vis/NIR spectrophotometer, Perkin Elmer, Inc.), using gallic acid as a standard,
according to the method described by the International Organization for Standardization (ISO)
14502-1. Each antioxidant extract was run in triplicate at 3 concentrations: 6.25, 10 and 20 mg
antioxidant per liter methanol. Briefly, 0.4 mL of the diluted sample extract was transferred in
triplicate to separate tubes containing 1.6 mL of dH2O. To the samples, a 1:10 dilution of FC
reagent in water was added. Then, 8.0 mL of sodium carbonate solution (20% w/v) was added.
The tubes were placed in a room temperature (25oC) incubator (Isotemp oven 516G; Fisher
Scientific, Pittsburgh, PA, U.S.A.) for 110 minutes before the absorbance at 760 nm was
measured against distilled water. The reducing capacity was expressed as gallic acid equivalents

54
(GAE) in mg per L solution. The concentration of polyphenols in the samples was derived from
a standard curve (run in duplicate) of gallic acid ranging from 0 – 100 mg per L solvent
(Pearson’s correlation coefficient: r2 = 0.9996).
A760 = 0.0091 C + 0.0904
where A is the absorbance and C is the gallic acid equivalents
3.3.4 Ferricyanide Reducing Antioxidant Capacity
The antioxidant activity as correlated to the species reducing capacity of ferricyanide was
performed by spectrophotometry, according to the method described by Berker et al. (2007).
Each antioxidant was run in triplicate at 3 diluted concentrations: 2.75, 11 and 22 mg antioxidant
per liter solution. Briefly, to 1 mL of methanolic extract was added 2.5 mL of 0.2 M phosphate
buffer (pH 6.6) and 2.5 mL of K3Fe(CN)6 solution (1%); the mixture was vortexed for 5 sec and
incubated at 50oC in an incubation chamber (Isotemp oven 516G; Fisher Scientific, Pittsburgh,
PA, U.S.A.) for 20 min. The incubated mixture was allowed to cool at 22oC for 20 min, after
which 2.5 mL of TCA (10%) was added. The solution was vortexed again for 5 sec and placed in
a centrifuge for 10 min at 3000 rpm. An aliquot of 2.5 mL of the mixture was removed into a
separate 15 mL screw-cap test tube and 2.5 mL dH2O was added. Following this addition, 0.5
mL FeCl3·6H2O solution (0.1%) was added to make a final volume of 5.5 mL. After a 2 min
reaction time, the resulting solution was read at 700 nm (A700) against a reagent blank. Results
were expressed by adapting an equation provided by Benzie & Strain (1999), using the 22 mg
per L gallic acid as the standard:
(FeCN)RAP (μM)value =
where [(FeCN)RAP]std was ≈ 1.29 μM gallic acid.

55
3.3.5 Free Radical Scavenging by 2,2-Diphenyl-1-Picrylhydrazyl
Three dilute concentrations of methanolic extracts (6.875, 8.25, and 9.625 mg antioxidant
per liter solution) of natural antioxidants were evaluated in triplicate for antioxidant content by
using a spectrophotometric assay described by Glavind (1963), with slight modification. Briefly,
1.0 mL of methanolic extract was added to 3.0 mL DPPH reagent (50 μM). The reaction mixture
was vortexed and incubated in the dark at 25 oC. The absorbance of the mixtures was measured
after 20 min at 517 nm against a reagent blank (pure methanol). The differences in absorbance
between a test sample and a control (DPPH in MeOH) was considered as active. Results are
expressed using ascorbic acid (0-20 mg L-1
) as a standard curve (Pearson’s correlation
coefficient: r2 = 0.9976).
A517 = -0. 387 C + 0.545
where A is the Absorbance at 517 nm and C is the ascorbic acid equivalents.
3.3.6 Oxygen Radical Absorbance Capacity.
The ORAC assay was based on the procedure described by Engeseth et al. (2007). Briefly, free
radical and indicator reagents were prepared in a 75 mM phosphate buffer (pH 7.0). Free radicals
were produced by 12 mM 2,2′-azobis(2-amidinopropane) dihydrochloride (AAPH) using 70.3
nM fluorescein as an indicator. Trolox™ was used as a standard (0-4μM) and prepared in
acetone:water:acetic acid (AWA). 10 mg antioxidant was dissolved in 100 mL (w/v) of
70:29.5:0.5 AWA. A portion of the solution (0.025 μL) was added to an eppendorf tube, where
AWA was added to give a final volume of 1.0 mL.
The ORAC assay was performed on a fluorometer (BioTek FL600, BioTek Instruments
Inc., Winooski, VT) using a 96-well black side with clear bottom plate (Corning Inc., Corning,
NY). Each well contained 120 μL fluorescein, 20 μL of AWA (blank), Trolox ™ (standard
56
curve) or sample, and 60 μL of AAPH, added immediately prior to beginning measurement. For
each run, one row consisted of a blank well followed by a Trolox™ standard curve of 1, 2, 3, and
4 μM Trolox™ (final concentration), repeated in reverse order and a second blank. Subsequent
rows contained a similar symmetrically matched blank, 1 μM Trolox ™ (internal standard), and
samples. Thus, each sample was measured in duplicate and values were averaged. Measurement
was made at an emission wavelength of 515 nm and at an excitation wavelength of 493 nm every
minute for 80 min. Results were expressed in μmol Trolox™ equivalents (TE) / L using the
Trolox™ standard curve run with each group of samples.
3.4 Results and Discussion
3.4.1 Reducing Power as determined by Folin-Ciocalteu Reagent
Reducing capacity via reduction of FC reagent can be found in Figure 3.1. An increase in
the absorption at 760 nm (visually, a dark blue color) is indicative of a high reducing potential, a
positive marker of antioxidant potential. (Benzie & Strain, 1999). The absorbance was
transformed in Gallic Acid Equivalents using a standard curve (see Appendix A, Figure A.2.3).
Antioxidant potency was positively correlated to concentration in a linear fashion. Pomegranate
showed the second highest reducing capacity of the antioxidants tested. These results are similar
to those found by Okudu, et al. (1981) who found that ellagitaninns (the primary component of
POMx) are potent reducers of copper, iron and chromium . However, these results contrast those
found by Yoshida and others (1981) (those found in POMx) showed higher antioxidant activity
than lower molecular mass polyphenols like gallic acid. The high reducing power of the plant
extracts (pomegranate and grape seed) could be environmentally related. That is to say, the
greater number of hydroxyl groups in the multi-ringed structures allow more deprotenation in the
alkaline environment than the single-ringed structures of other phenolic-based antioxidants

57
(ascorbic acid and BHA). Proanthocyanidins and flavonoids (such as the 89% comprising grape
seed extract) are known scavengers of reactive species and have the ability to chelate compounds
with their o-diphenol group (Dixon et al., 2005).
Dietary selenium showed no reductive capacity. While FCR is traditionally used to
measure phenolic constituents, its basis is assumed to be the reduction of Mo(VI) to Mo(V). It is
then expected for selenium to show little reductive capabilities. These results correlate to those
of Scharff et al. (2000) who determined selenomethionine to be an inert compound with respect
to hydrogen peroxide (a well-known, powerful oxidant). In this case, selenomethionine would
act as an oxidizing agent and oxidation of the molybdate-complex that drives the FC reduction
would not be observed. The results in Figure 3.1 also showed d,l-α-tocopherol to have low
reducing ability at the concentrations measured (0-2.5 GAE). This corresponds well to the
literature which attributes the antioxidant ability α-tocopherol to scavenging hydroxyl, alkoxyl
and peroxyl radicals, as well as quenching singlet oxygen (Nicki, 1996; Gregory, 1996; Papas,
1999; Munnè-Bosch, 2005). Also, while vitamin E was dissolved in an organic solvent, the
hydrophilic environment through which FCR is run leaves vitamin E unable to effectively
compete with the other antioxidants.
3.4.2 Ferricyanide Reducing Antioxidant Capacity.
The spectrophotometric results for reducing capacity by the ferricyanide assay was
transformed using the absorbance of gallic acid (22 mg per L) as a standard concentration. The
results, found in Figure 3.2, were statistically similar to the results from FCR (ρ = 0.9358)
(Appendix D, Table D.1.2). Reduction by ferricyanide corrected environmental limitations (by
reacting at a neutral pH) as well as utilized a more biologically-relevant metal (high-spin

58
iron).The results are similar to those of the FCR assay (ρ = 0.9358), indicating mechanistic
continuity among the antioxidants.
Figure 3.2 again displays the plant extracts having a higher reducing capacity than the
synthetic antioxidant. The mechanistically similar principles of outer-sphere electron transfer
likely account for the similarities by both metal reduction assays (Housecroft & Sharpe, 2005).
Vitamin C was the only antioxidant to have shifted order in reductive capacity between the two
assays. Tang et al. (2009) also noted the discrepancy regarding the high reducing ability of
ascorbic acid in this assay (which shows disparity with the two SET assays). This may be
explained in two ways: First, the solubility of ascorbic acid has been well documented
(Shalmashi & Eliassi, 2008). Ascorbic acid is much more soluble in methanol (initial conditions
of ferricyanide reduction) than water, and even less soluble in a co-solvent of water and
methanol (conditions of FCR). This may be extrapolated when considering the effect of
hydration status and structure of dihydroascorbate (oxidized ascorbic acid) at alkaline pH
(Perone & Kretlow, 1966; Cioffi et al., 2000). Alkaline pH induces the hydrolysis of the lactone
ring, causing an irreversible conversion (and therefore inactivity) to diketogulonate ion. When
assayed at near-neutral conditions, ascorbic acid shows significantly higher reducing ability than
most antioxidants at all concentrations, specifically the plant extracts. The chelating and reducing
effects of ascorbic acid have been well documented (Fennema, 2008; Jagota & Dani, 1982). It is
also likely that the catalytic metal has an effect, as Gregory (1996) noted that ascorbic acid is
readily oxidized in the presence of ferric iron. Lastly, the large-caged chromogenic structure of
the FC reagent (which would be able to dissipate electrical charge) is titanic compared to the
smaller octahedral chromogenic reagent, ferricyanide. This, in addition to the limited reaction
time during FCR, could inhibit ascorbic acid reduction of the M(IV) complex before
59
deactivation. The low activity of d,l-α-tocopherol was similar to the findings of Elmastas et
al.(2006) who found same trend in Figure 3.2 between BHA and α-tocopherol in their study,
likely due to the environmental conditions that select for hydrophilic antioxidants.
3.4.3 Free Radical Scavenging by 2,2-Diphenyl-1-Picrylhydrazyl
The range of concentrations used was limited by the parameters of the assay (i.e. amount
of antioxidant and reaction time to reduce/decolorize the DPPH solution). Figure 3.3 shows that
at all concentrations, each antioxidant was found to be significantly different. The results of
DPPH scavenging were found to be similar to both FCR results (ρ = 0.9268) and ferricyanide
reducing capacity (ρ = 0.9404) (Appendix D, Table D.1.2). The transformation of the data
(Appendix A, Figure A.2.7) into equivalent units of ascorbic acid (AAE) (per Chen et al., 2000;
Molyneux, 2004) rather than percent inhibition or change in optical density gives results that are
both informative and highly relevant. Authors have indicated that percent inhibition is
misleading, while the use of change in optical density hard to relate Notably, gallic acid
completely and immediately reduced the solution of DPPH; because of this, a direct comparison
with the other antioxidants cannot be substantiated. Regardless, the results in Figures 2 and 3
were very similar to the references (gallic acid, α-tocopherol, ascorbic acid and butylated
hydroxytoluene) used by Pfundstein (2010) who compared antioxidant activity of subunits of
ellagitannins (the antioxidant-specific compounds in POMx) with results from DPPH, ORAC
and FRAP. The results found in Figures 3.2 and 3.3 compared well with the DPPH and FRAP
assays. The results in Figure 3.3 also correspond to those found by Okuda et al.(1989), who
found higher DPPH scavenging by ellagitannins in comparison to ascorbic acid and α-
tocopherol..

60
Ascorbic acid has been cited as highly reactive with DPPH, due to its two adjacent sites
for hydrogen abstraction (Molyneux, 2004). The mechanism of this reaction is a single electron
transfer from the antioxidant to DPPH, causing a decoloration of the solution at 517 nm. At the
highest concentration (roughly 10 mg antioxidant per liter methanol), d,l-α-tocopherol measured
low in reducing capacity (approximately 3 AA equivalents), despite the use of an organic
solvent. BHA and grape seed extract showed nearly double the reducing power (approximately 6
AA equiv.) as vitamin E, a trend also reported by El-Baky et al. (2009) and Elmastas (2006), but
differing from those of Hassanbaglou et al. (2012). Dietary selenium continued to show no
reducing capabilities and remained identical to the blank solution (50 μM DPPH) after 20 min.
The trends of reductive capacity via free radical scavenging found in Figure 3.3 again illustrated
the antioxidant order found in the reduction of ferricyanide. At all concentrations, each
antioxidant was found to be statistically different, retaining the same trends in reducing potential
seen above. The plant extracts continued to show high reducing capacity at nearly 10 mg / L
solution.
3.4.4 Oxygen Radical Absorbance Capacity.
The results of the ORAC assay are displayed in Table 3.1. The exclusion of d,l-α-
tocopherol for the assay was the validated by Huang et al.(2002) as a result of substituting
Trolox™ (a synthetic analog of vitamin E) for the standard curve. The substitution of Trolox™
is preferred both by relevance (Trolox™ contains the active phenolic group) and kinetic speed
(Trolox reacts faster with AAPH than α-tocopherol).Often, authors find similarity between
results from ORAC and results from other antioxidant assays: ABTS (Simonetti et al., 1997;
Frankel et al., 1995), DPPH (De Beer et al., 2003; Larrauri et al., 1999), and lipid oxidation
(Kondo et al., 1999). In this study, ORAC (an HAT assay) showed no correlation to the SET

61
antioxidant assays: FCR (ρ = -0.4066), reducing capacity by ferricyanide (ρ = -0.0367) or
scavenging by DPPH (ρ = -0.3440) (Appendix D, Table D.1.2). Only dietary selenium remained
constant (showing no hydrogen atom donating capacity). Grape seed extract had three times the
hydrogen atom donating ability (102 TE per 10 mg) as pomegranate extract (32 TE per 10 mg).
Where BHA showed excellent hydrogen atom donating capacity (≈160 TE per 10 mg), gallic
acid showed low H-atom donating capacity at 60 TE per 10 mg. The low values of gallic and
ascorbic acid are similar to those found by Romero et al.(2010). The lack of h-atom donation by
ascorbic acid is well known, and therefore it is not surprising that it had the lowest ORAC value.
The low yet similar values of ascorbic and gallic acids are similar to those found by Romero et
al. (2010). He and other authors (Apak, 2007) have indicated that both the type and number of
side-chains on phenolic compounds impact a species antioxidant activity.
3.5 Conclusions
By comparing all four methods of measuring antioxidant activity, a more complete
picture of dietary selenium, pomegranate and grape seed extract is obtained. While dietary
selenium may show metabolic antioxidant activity, no assay indicated it can be used in a non-
living system to retard oxidative deterioration. Pomegranate extract showed great potential as a
reducing agent, but little potential as a hydrogen-donating species. Grape seed extract shows
excellent effects in terms of reductive capacity and hydrogen-atom donation. Additionally, grape
seed extract has been shown to reduce oxidative stress and extend the induction period of
oxidation in multiple matrices (Jayaprakasha et al,2001; Rojas et al.,2006; Kulkarni et al., 2011).
The measurement of antioxidant activity is complex, not only because of the nature of the
antioxidant (hydrophilic vs. hydrophobic, phenolic vs. conjugated, etc.), but also because of the
variety of mechanisms that can inhibit prooxidant species and delay the onset of oxidation.
62
Currently, some methods detect reduction capacity (a highly correlated parameter of
antioxidation) while others detect free radical quenching. Knowing this, it is highly unlikely that
a single approach to evaluating antioxidant activity is sufficient, making a multidimensional
approach invaluable.
Also, because these assays utilize direct analysis techniques, caution should be taken
when interpreting the results. As pointed out by multiple authors (Huang et al., 2005; Apak
2007), these measurements are taken without respect to the complex nature of food and
endogenous interfering agents. While these finding indicate promise, a multidimensional
approach must be used in a model study to appropriately qualify whether these antioxidant
extracts act in the desired nature.
3.6 References
Anesini, C., Ferraro, G.E. & Filip, R. 2008. Total polyphenol content and antioxidant capacity of
commercially available tea in Argentina. Jour. Agric. Food Chem., 56: 9225-9.
Apak, R., Guclu, K., Demirata, B., Ozyurek, M., Celik, S. E., Bektasoglu, B., Berker, K. I. &
Ozyurt, D. 2007. Comparative evaluation of various total antioxidant capacity assays applied to
phenolic compounds with the CUPRAC assay. Molecules, 12: 1496-1547
Athulkorala, Y., Nam, K. & Jeon, Y. 2006. Antiproliferative and antioxidant properties of an
enzymatic hydrolysate from brown alga, Ecklonia cava. Food Chem. Toxicol., 44 : 1065-1074.
Benzie, I.F.F., Strain, J.J. 1999. Ferric reducing / antioxidant power assay: direct measure of total
antioxidant activity of biological fluids and modified version for simultaneous measurement of
total antioxidant power and ascorbic acid concentration. Methods Enzymol., 299: 15-27.
Berker, K.I., Güҫlü, K., Tor, I., Apak, R. 2007. Comparative evaluation Fe(III) reducing power-
based antioxidant capacity assays in the presence of phenanthroline, batho-phenanthroline,
tripyridyltriazine (FRAP), and ferricyanide reagents. Talanta. 72: 1157-1165.
Chen, L., Mehta, A., Berenbaum, M., Zangerl, A. R. & Engeseth, N. J. 2000. Honeys from
different floral sources as inhibitors of enzymatic browning in fruit and vegetable homogenates.
J. Agric. Food Chem., 48: 4997-5000.

63
Cioffi, N., Losito, I., Terzano, R., & Zambonib, C.G. 2000. An electrospray ionization ion trap
mass spectrometric (ESI-MS-MSn) study of dehydroascorbic acid hydrolysis at neutral pH.
Analyst, 125: 2244-2248.
De Beer, D.; Joubert, E.; Gelderblom, W.C.A. 2003. Manley, M. Antioxidant activity of South
African red and white cultivar wines: free radical scavenging. J. Agric. Food Chem., 51: 902-
909.
Dixon, R. A., Xie, D. Y., & Sharma, S. B. 2005. Proanthocyanidins – a final frontier in flavonoid
research? New Physiologists, 165: 9-28.
Elmastas, M., Gulcin, I., Isildak, O., Kufrevioglu, O.I., Ibaoglu, K. & Aboul-Enein, H.Y. 2006.
Radical scavenging activity and antioxidant capacity of bay leaf extracts. Jour. Of Iranian Chem.
Soc., 3(3): 258-266.
El-Bakay, H.H.A., El-Baz, F.K. & El-Baroty, G.S. 2009. Natural preservative ingredient from
marine alga Ulva lactuca L. International Jour. of Food Sci. and Tech., 44: 1688-1695.
Frankel, E.N. & Meyer, A.S. 2000. The problems of using one-dimensional methods to evaluate
multifunctional food and biological antioxidants. Jour. Sci. Food Agric., 80: 1925-1941.
Frankel, E.N., Waterhouse, A.I. & Teissedre, P.L. 1995. Principal phenolic phytochemicals in
selected California wines and their antioxidant activity in inhibiting oxidation of human low –
density lipoproteins. J. Agric. Food Chem., 43, 890-894.
Floegel, A., Kim, D.-O., Chung, S.-J., Koo, S.I. & Chun, O.K. 2011. Comparison of
ABTS/DPPH assays to measure antioxidant capacity in popular antioxidant-rich foods. Jour.
Food Comp. and Anal., 24: 1043-1048.
Fennema, O.R. 2008. Food Chemistry. 4th
Edition. New York: Marcel Dekker, Inc.
Gheldof, N. & Engeseth, N.J. 2002. Antioxidant capacity of honeys from various floral sources
based on the determination of oxygen radical absorbance capacity and inhibition of in-vitro
lipoprotein oxidation in human serum samples. Jour. Agric. Food Chem., 50: 3050-3055.
Glavind, J. 1963. Antioxidants in animal tissue. Acta Chem. Scand. 17: 1635-1640.
Gregory, III J.F. 1996. Vitamins. In: Fennema O.R., editor. Food chemistry, 3rd
. ed. New York:
Marcel Dekker. p 431-530.
Hassanbaglou, B., Hamid, A.A., Roheeyati, A.M., Saleh, N.M., Abdulamir, A.S., Khatib, A. &
Sabu, M.C. 2011. Antioxidant activity of different extracts from leaves of Pereskia bleo
(Cactaceae). Jour. Medic. Plants Research, 6(15): 2932-2937.
Hillman, J. 2010. Reformulation key for consumer appeal into the next decade. Food Rev
37(1):14, 16, 18-19.

64
Holben, D.H. & Smith, A.M. 1999. The diverse role of selenium with selenoproteins (a review).
Jour. Am. Diet. Assoc., 99: 836-843.
Housecroft, C.E. & Sharpe, A.G. 2005. Inorganic Chemistry. 2nd
ed. Glossgow, England.
Pearson Education Limited. pp 777-783.
Huo, L., Lu, R., Li, P., Liao, Y., Chen, R., Deng, C., Lu, C., Wei, X. & Li, Y. 2011. Antioxidant
activity, total phenolic and total flavonoid of extracts from the stems of Jasminum nervosum
Lour. Grasas y Aceites, 62(2): 149-154.
Huang, H.-L., Xu, B., Li, Z.-X. & Wang, B.-G. 2005. Evaluation of antioxidant property of
extracts obtained from Laoshan mushroom. Food Science, 26(9): 61-66.
Huang, D., Ou, B., Hampsch-Woodill, M., Flanagan, J.A. & Deemer, E.K. 2002. Development
and validation of oxygen radical absorbance capacity assay for lipophillic antioxidants using
randomly methylated β-cyclodextrin as the solubility enhancer. Jour. Agric. Food Chem., 50:
1815-1821.
ISO 14502-1: 2005. Determination of substances characteristic of green and black tea. Part 1:
Content of total polyphenols in tea. Colorimetric method using Folin-Ciocalteu reagent
Jacob, R. A. 1987. Trace elements, in Fundamental of Clinical Chemistry, 3rd
ed., Tietz, N. W.,
Ed., W.B. Saunders, Philadelphia, PA.
Jayaprakasha, G.K., Singh, R.P., & Sakariah, K.K. 2001. Antioxidant activity of grape seed
(Vitis vinifera) extracts on peroxidation models in vitro. Food Chemistry 73: 285-290.
Jopin, L. 2006. Taking out the chemistry. Food Engineer. Ingred. 31(2): 38-39, 41.
Jagota, S. K. & Dani, H. M. 1982. A new colorimetric technique for the estimation of vitamin C
using Folin phenol reagent. Anal. Biochem.,, 127(1): 178-182.
Kondo, Y., Ohnishi, M. & Kawaguchi, M. Detection of lipid peroxidation catalyzed by chelated
iron and measurement of antioxidant activity in wine by a chemiluminescence analyzer. J. Agric.
Food Chem. 1999, 47: 1781-1785.
Kulkarni, S.S., DeSantos, F.A., Kattamuri, S.S., Rossi, S.J. & Brewer, M.S. 2011. Effect of
grape seed extract on oxidative, color and sensory stability of a pre-cooked, frozen, re-heated
beef sausage model system. Meat Science, 88(1): 139-144.
Larrauri, J.A., Sanchez-Moreno, C., Ruperez, P. & Saura-Calixto, F. 1999. Free radical
scavenging capacity in the aging of selected red Spanish wines. J. Agric. Food Chem., 47, 1603-
1606.

65
Lee, J., Koo, N. & Min, D.B. 2003. Reactive oxygen species, aging, and antioxidative
nutraceuticals. Comprehensive Reviews in Food Science and Food Safety, 3: 21-33.
Molyneux, P. 2004. The use of stable free radical diphenylpicrylhydrazyl (DPPH) for estimating
antioxidant activity. Songklanakarin Jour. Sci. Technol. 26(2): 211-219.
Nicki, E. 1996. Α-Tocopherol. In: Cadenas, E., Packer, L., editors. Handbook of antioxidants.
New York: Marcel Dekker. pp. 3-26.
Okuda, T., Mori, K., Shiota, M. & Ida, K. 1982. Reduction of heavy metal ions and
solubilization of precipitates, translation: Yakugaku Zasshi. Jour. Pharm. Soc. Japan 102(8):
735–42.
Okuda, T., Yoshida, T. and Hatano, T. 1989. Ellagitannins as active constituents of
medicinal plants, translation: Yakugaku Zasshi.. Planta Medica, 55; 117–122.
Okuda, T., Yoshida, T., Hatano, T., & Ito, H. 2009. Ellagitannins Renewed the Concept of
Tannins. In Chemistry and Biology of Ellagitannins. An Underestimated Class of
Bioactive Plant Polyphenols. editor Stéphane Quideau. New Jersey : World Scientific Publishing
Co.
Papas, A.M. 1999. Other antioxidants. In: Papas, A.M., editor. Antioxidant status, diet, nutrition,
and health. Boca Raton, FL: CRC Press. pp. 231-248.
Parker, T. L., Wang, X.-H. & Pazmino, J.; Engeseth, N. J. 2007. Antioxidant capacity and
phenolic content of grapes, sun-dried raisins, and golden raisins and their effect on ex vivo serum
antioxidant capacity. J. Agric. Food Chem., 55: 8472-8477.
Perone, S.P. & Kretlow, W.J.1966. Application ofcontrolled potential techniques to study of
rapid succeeding chemical reaction coupled to electro-oxidation of ascorbic acid. Anal. Chem.
38(12): 1760-1763.
Pfundstein, B., El Desouky, S.K., Haubner, R., Gerhard, E. & Owen, R.W. 2010. Polyphenolic
compounds in the fruits of Egyptian medicinal plants (Terminalia bellerica, Terminalia chebula
and Terminalia horrida): characterization, quantitation and determination of antioxidant
capacities. Phytochemistry, 71: 1132-48.
Rasheed, Z., Akhtar, N., Anbazhagan, A.N., Ramamurthy, S., Shukla, M., & Haggi, T.M. 2009.
Polyphenol-rich pomegranate fruit extract (POMx) Suppresses PMACI-induced expression of
pro-inflammatory cytokines by inhibiting the activation of MAP kinases and NF-kB in human
KU812 cells. Jour. Inflammation, 6(1):1-12.
Rivero Perez, M.D., Muniz, P. & Gonzalez Sanjose, M.L. 2008. Contribution of anthocyanin
fraction to the antioxidant. Food and Chem. Toxico.,46(8): 2815-2819.
66
Rojas, M.C. & Brewer, M.S. 2008. Effect of natural antioxidants on oxidative stability of frozen
vacuum-packaged beef and pork. Jour. Food Qual., 3(12): 173-188.
Rojas, M.C. & Brewer, M.S. 2007. Effect of natural antioxidants on oxidative stability of cooked
refrigerated beef and pork. Jour. Food Sci., 372: S282-S288.
Romero, M., Rojano, B., Mella-Raipan, J., Pessoa-Mahana, C.D., Lissi, E. & Lopez-Alarcon, C.
2010. Antioxidant capacity of pure compounds and complex mixture evaluated by the ORAC-
pyrogallol red assay in the presence of triton x-100 micelles. Molecules, 15: 6152-6167.
Roy, M.K., Koide, M., Rao, T.P., Okubo, T., Ogasawara, Y. & Juneja, L.R. 2010. ORAC and
DPPH assay comparison to assess antioxidant capacity of tea infusions: relationship between
total polyphenol and individual catechin content. Int. Jour. Food Sci. Nutr., 61(2): 109-124.
Scharff, A. J., Koronakis, E., Luisi, B. & Koronakis, B. 2000. Oxidation of selenomethionine:
some MADness in the method! Acta. Crystallogr. D. Biol. Crystalogr., 56(6): 785-788.
Shalmashi, A. & Eliassi, A. 2008. Solubility of l-(+)-ascorbic acid in water, ethanol, methanol,
propan-2-ol, aceton, acetonitrile, ethyl acetate, and tetrahydrofuran from (293 to 323) K. Jour.
Chem. Eng. Data, 53: 1332-1334.
Shon, M.-Y., Kim, T.-H. & Sung, N.-J., 2003. Antioxidants and free radical scavenging activity
of Phellinus baumii (Phellinus of Hymenochaetaceae) extracts. Food Chem., 82: 593-597.
Shukala, M., Gupta, K., Rasheed, Z., and Khan, K. 2008 Consumption of hydrolysable tannins-
rich pomegranate extract suppresses inflammation and joint damage in rheumatoid arthritis.
Basic Nutr. Invest., 24: 733-743.
Simonetti, P., Pietta, P. & Testolin, G. 1997. Polyphenol content and total antioxidant potential
of selected Italian wines. J. Agric. Food Chem., 45: 1152-1155.
Tang, C.-H., Peng, J., Zhen, D.-W. & Chem, Z. 2009. Physiochemical and antioxidant properties
of buckwheat (Fagopyrum esculentum Moench) protein hydrolysates. Food Chem., 115: 672-
678.
Thaipong, K., Boonprakob, U., Crosby, K., Cisneros-Zevallos, L. & Byrne, D.H. 2006.
Comparison of ABTS, DPPH, FRAP, and ORAC assays for estimating antioxidant activity from
guava fruit extracts. Jour. Food Comp. and Anal., 19: 669-675.
Yamakoshi, J., Saito, M., Kataoka, S., & Kikuchi, M. (2002). Safety evaluation of
proanthocyanidin-rich extract from grape seeds. Food and Chem. Tox., 40: 599-607.
Yildrim, A., Mavi, A., & Kara, A.A. 2001. Determination of antioxidant and antimicrobial
activities of Rumex crispus L. Extracts. Jour. Agric. Food Chem., 49: 4083-4089.
Yoshida, T., Koyama, S. & Okuda, T. 1981. Inhibitory effects of tannins on cupric

67
ion-catalyzed autoxidation of ascorbic acid, translation: Yakugaku Zasshi. Jour. Pharm. Soc.
Japan, 101(8): 695–9.
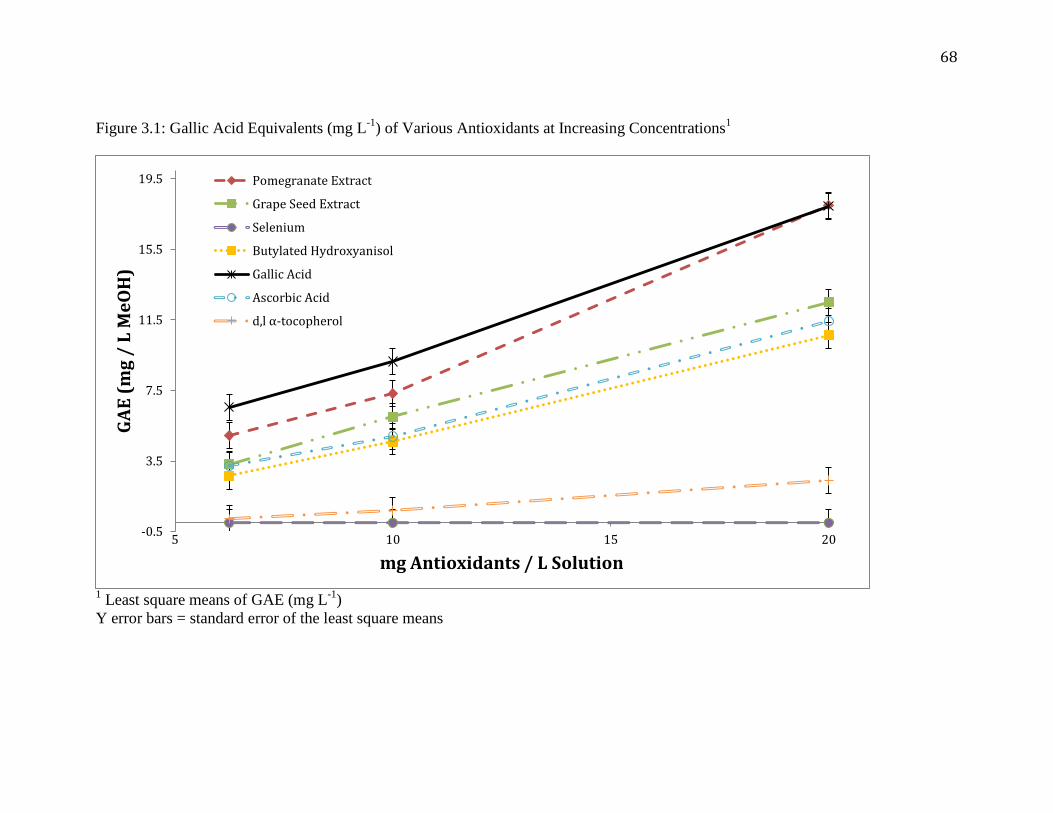
68
Figure 3.1: Gallic Acid Equivalents (mg L-1
) of Various Antioxidants at Increasing Concentrations1
1 Least square means of GAE (mg L
-1)
Y error bars = standard error of the least square means
-0.5
3.5
7.5
11.5
15.5
19.5
5 10 15 20
GA
E (
mg
/ L
Me
OH
)
mg Antioxidants / L Solution
Pomegranate Extract
Grape Seed Extract
Selenium
Butylated Hydroxyanisol
Gallic Acid
Ascorbic Acid
d,l α-tocopherol

69
Figure 3.2: Ferricyanide Reducing Power (μM Gallic Acid Equivalents) of Various Antioxidants
1 Least square means of μM GAE (mg L
-1)
Y error bars = standard error of the least square means
-0.2
0
0.2
0.4
0.6
0.8
1
1.2
1.4
0 5 10 15 20 25
GA
E (μ
M)
mg Antioxidant / L solution
Pomegranate Extract
Grape Seed Extract
Butylated Hydroxyanisol
Selenium
Gallic Acid
Ascorbic Acid
d,l α-tocopherol

70
Figure 3.3: Ascorbic Acid Equivalents (mg L-1
) of DPPH Free Radical Scavenging for Various Antioxidant at Increasing
Concentration1
1 Least square means of AA equivalents (mg L
-1).
Y error bars = standard error of the least square means
0
3
6
9
12
15
6.75 7.5 8.25 9 9.75
Asc
orb
ic A
cid
Eq
uiv
ale
nts
of
DP
PH
S
cav
en
ge
d
mg Antioxidant / L Solution
Pomegranate Extract
Grape Seed Extract
Selenium
Butylated Hydroxyanisol
Gallic Acid
Ascorbic Acid
d,l α-tocopherol

71
Table 3.1: Antioxidant Activity of Various Extracts as Determined by FCR, Ferricyanide, DPPH, & ORAC1
Antioxidant Activity
FCR Ferricyanide DPPH ORAC
(GAE / 10 mg) (μM GAE / 11 mg) (AAE / 9.7 mg) (TE / 10 mg)
Pomagranate Extract
7.32 ± 1.3 b 0.43 ± 0.017
bc 9.74 ± 0.2
b 49.11 ± 2.7
d
Grape Seed Extract
6.01 ± 0.1 c 0.37 ± 0.014
cd 6.83 ± 0.3
c 101.71 ± 13.6
b
Dietary Selenium
0.02 ± 0.7 e 0.00 ± 0.004
f 0.11 ± 0.0
f 0.02 ± 0.0
f
Butylated Hydroxyanisole
4.64 ± 0.1 d 0.34 ± 0.016
d 5.49 ± 0.2
d 171.33 ± 27.1
a
Gallic Acid
10.03 ± 0.4 a 0.56 ± 0.016
a 12.22 ± 0.0
a 30.08 ± 3.8
c
Ascorbic Acid
4.91 ± 0.1cd
0.46 ± 0.082 b 9.51 ± 0.2
b 14.71 ± 4.2
e
d,l-α-tocopherol 0.72 ± 0.3 e 0.12 ± 0.023
e 3.43 ± 0.1
e N/A
1Mean values and standard deviations not sharing letters in a row are significantly different (p<0.0001)
72
Chapter 4. Effect of Temperature and Concentration on Antioxidant Activity of Natural
Antioxidants in Simplified Lipid Model Systems
4.1 Abstract
Pomegranate and grape seed extracts were evaluated as natural antioxidants in high lipid
systems and compared to the effects of butylated hydroxyanisole (BHA, a commonly employed
synthetic antioxidant) in two gelled, 27%-lipid matrices. The lipid in the first matrix was
comprised of lard while the lipid in the second matrix was canola oil. Both matrices used food-
grade gelatin, sodium stearoyl lactylate, and distilled water to create oil-in-water gelled patties.
Hemoglobin was added as a naturally-occurring prooxidant. Both matrices were incubated at
30oC and evaluated by chemical analysis (spectrophotometric evaluation of diene conjugation
and TBARS) on days 0, 1, 2, 4, 7 and 9. The canola-oil treatment underwent descriptive analysis
by a trained panel in addition to chemical analysis. In both systems, all analysis found BHA to be
a more effective antioxidant than the natural antioxidants when used at the same concentration.
Additionally, each antioxidant was found to be statistically different than the control (gelled
patties with no added antioxidant).
4.2 Introduction
Because the definition of antioxidants is diverse, characterization of them in terms of
substrate is important. For example, the same antioxidants used to retard oxidation of rubber can
mechanistically vary greatly in comparison to those used for dietary purposes. Dietary
antioxidants, such as selenium, can reduce endogenous metabolic bi-products (such as peroxides)
through redox enzymes or cofactors to nonenzymatic antioxidants (oxidative enzyme inhibitors).
Often, investigators have tried to compare antioxidant efficacies via direct analysis, a technique

73
that has been contested by many authors (Prior et al. 2005). The use of a model system is
paramount to determining antioxidant activity in a food matrix. In the past, many authors have
created matrices through ground meat systems (Rojas & Brewer, 2007), extracted oil from fish
(King, Boyd & Sheldon, 1992; Fazel et al., 2009), and β-carotene linoleate model systems
(Jayaprakasha, Singh & Sakariah, 2000).
The use of a model system that is simple (does not contain many endogenous co-factors),
oxidizes rapidly, and contains many ubiquitous polyunsaturated fatty acids is critical to aid in
determining antioxidant efficacy. Pure canola oil and lard offer some characteristics, as shown in
the review on natural antioxidant efficacy by Frankel (1993). As such, they were investigated to
help determine their suitability as model systems. Lard is similar to ground beef in that it has low
PUFA content (≈ 6%), but is still solid at room temperature. Alternatively, canola oil is the
second most widely consumed oil in the United States, remains easy to qualify through gas
chromatography, readily oxidizes, and has a large body of data quantifying its oxidation products
(Broadbent & Pike, 2003).
Because the break down products of the autoxidation process differ from those of
photooxidation and enzymatic oxidation, it is necessary to increase the thermal environment of
each lipid model system. The employment of water (and consequently an emulsifier) is necessary
when using phenolic compounds because of their high hydrophilicity. To maintain the stability
of an oil-in-water emulsion, an inert binding agent such as a gum (Lee, Faemi, Hammond &
White, 1995) or gelatin (Brewer, Peterson, Carr, McCusker, & Novakofski, 2005) should be
employed. Gelatin can form thermo-reversible gels and is commonly used in meats between 1
and 5% (Gelatin Manufacturers Institute of America Inc., 1993).

74
4.3 Materials and Methods
Both the lard- and canola oil-model system experiments were designed as a randomized,
complete block design with seven (lard) and four (canola oil) antioxidant treatments, six storage
times and four replicates (two batches and two replicates / batch). Gelatin was food grade (J.T.
Baker Chemical Co., Phillipsburg, N.J.; 3%, w/w). Sodium stearoyl lactylate was procured from
Caravan Ingredients, Inc. (Lenexa, KS). Antioxidant treatments included a control (no
antioxidant), 100 ppm pomegranate extract (POM), 100 ppm grape seed extract (GSE), 100 ppm
dietary selenium or 100 ppm butylated hydroxyanisole (BHA) based on total weight of the batch.
Lard was procured from a local supplier (Savoy, IL).
4.3.1 Anti- / Prooxidants
Five antioxidant treatments were evaluated: Pomegranate extract (POMx, Punica
granatum L., Wonderful variety; Paramount Farms, CA, USA); Grape seed extract (GSE;
(2007)(Gravinol Super TM, Kikkoman, Tokyo, Japan) contained 98% total flavanols (89%
proanthocyanidins); Dietary selenium (Nature’s Bounty, Bohemia, NY) was received
commercially containing 200 μg organic selenium (of yeast origin) per tablet (Se;
(2012)(Nature’s Bounty, Bohemia, NY)); Butylated hydroxyanisole was reagent grade from
Sigma-Aldrich Inc. (BHA; (2007) (St. Louis, MO, U.S.A.)). All crystalline or tablet antioxidants
were ground using a mortar and pestle (pour lip diameter = 90 mm). Hemoglobin was reagent
grade (Sigma, St. Louis, MO).
4.3.2 Lard-Model System Formation
Lard purchased locally (Morrell Snow Cap Lard, John Morrell & Co., Cincinnati, OH,
USA; Savoy, IL ) was heated to 80 oC for 5 min. After complete liquefaction, 7% (
w/w) sodium
stearoyl lactylate (Caravan Ingredients, Inc.; 9% w/w;) was added and mixed with a stir-bar for

75
10 minutes. Gelatin (J.T. Baker Chemical Co., Phillipsburg, N.J.; 3%, w/w), hemoglobin (Sigma,
0.02%), and antioxidant treatment (none, 100 ppm POM, 500 ppm POM, 1000 ppm POM, 100
ppm GSE, 100 ppm dietary selenium or 100 ppm BHA) were dry-mixed before being added to a
portion, 27% (w/w) emulsified fat solution. The model was completed by adding boiling dH2O
(65% w/w). The mixture was mixed in a digital dual-range mixer (RW 20, IKA, Wilmington,
NC, USA) for 1 minute at 2000 rpm before being segmented into 12.5 g aliquots in petri dishes
(60 × 15 mm; Fisher Scientific, Pittsburgh, PA, U.S.A.). Product was stored in the dark at three
different temperatures: 4, 30 or 50oC, using either refrigeration or an incubation chamber
(Isotemp oven 516G; Fisher Scientific, Pittsburgh, PA, U.S.A.). Analysis was performed on days
0, 1, 2, 4, 7, and 9. Patties resisted oxidation at refrigerated temperature (data not shown) and
separated into a biphasic solution at 50 oC (data not shown).
Chemical analyses, including
thiobarbituric acid-reactive substances (TBARS) and conjugated dienes (CD), were conducted in
triplicate on six replicate samples. Data were statistically analyzed.
4.3.3 Canola Oil-Model System Formation
Gelatin (J.T. Baker Chemical Co., Phillipsburg, N.J.; 4% w/w), sodium stearoyl lactylate
(Caravan Ingredients, Inc.; 2% w/w) antioxidant treatment (none, 100 ppm POM, 100 ppm GSE,
or 100 ppm BHA) and hemoglobin (Sigma; 0.02%), were dry mixed before being added to
canola oil purchased locally (Meijer brand, Grand Rapids, MI). The model was completed by
adding boiling dH2O (66% w/w). The mixture was mixed (RW 20, IKA, Wilmington, NC, USA)
for 2 minute at 2000 rpm before being segmented into 12.5 g aliquots in petri dishes (60 × 15
mm; Fisher Scientific, Pittsburgh, PA, U.S.A.). Product was stored in the dark at 30 oC in an
incubation chamber (Isotemp oven 516G; Fisher Scientific, Pittsburgh, PA, U.S.A.). Sensory and
chemical analysis was performed on day 0, 1, 2, 4, 7, and 9. Chemical analyses, including

76
thiobarbituric acid-reactive substances (TBARS) and conjugated dienes (CD), were conducted in
triplicate on six replicate samples. Data were analyzed statistically.
4.3.4 Odor Evaluation of Canola Oil-Model System
Sensory testing was conducted at the University of Illinois (Urbana, IL) using nine
panelists (4 male, 5 female) ages 23 to 65 (IRB protocol number 12848) experienced in oil odor
evaluation. Training was performed during three thirty minute sessions under ambient lighting
with approximately 30% relative humidity. Training included a fresh sample and two oxidized
samples (no antioxidant and 100 ppm BHA). During training, a panel leader facilitated
discussions of product characteristics. Panelists determined odor characteristics using a 15 cm
semi-structured line scale (0 = none, 15 = extreme) (Appendix B, Figure B.1.1). Odor standards
were determined by group consensus during 3 training sessions and assigned anchor values on
the 15-cm scale. A complete list of terms, definitions, references and ratings can be found in
(Appendix B, Table B.1.1). All references were prepared within 2 hours of evaluation and were
served in lidded plastic soufflé cups (56.7 g; Solo Cup Company, Urbana, IL; Dart Container
Corporation, Mason, MI).
Two replications were performed with evaluation occurring on days 0, 1, 2, 4, 7 and 9.
Samples were macerated into 2.5 g aliquots and presented with a 3-digit random code in plastic
cups with lids. The sensory panel evaluated two sets of four samples per session, in random
order. Sensory data are reported in centimeters from the left end of the line scale.
4.3.5 Determination of Diene Conjugation
Conjugated dienes were determined as described by Juntachote, Berghofer, Siebendandl,
and Bauer (2006). Briefly, a sample (0.5 g) was suspended in 5.0 mL of deionized water in a
porcelain mortar (pour lip diameter = 90 mm). The sample was ground for 30 seconds until the

77
solution became homogeneous. A 0.5 mL aliquot of the suspension was mixed with 5.0 mL of
extraction solution (3:2 hexane: isopropanol v/v) for 1 min using a touch mixer (Model 231,
Fisher Scientific, Pittsburgh, PA, U.S.A.). After centrifugation at 2000 x g (Sorvall® RC-5B, Du
Pont Company, Wilmington, DE, U.S.A.) for 5 min, the absorbance of the supernatant was
determined at 233 nm (Lambda 950 UV/Vis/NIR spectrophotometer, Perkin Elmer, Inc.). The
concentration of conjugated dienes was calculated using the molar extinction coefficient of
25,200 M-1
cm-1
. Results are expressed as mmol / kg sample. Hexane and isopropanol were
reagent grade (Fisher Scientific, Pittsburgh, PA, U.S.A.)
4.3.6 Thiobarbituric Reactive Substances
Thiobarbituric reactive substances (TBARS) were determined as described by Miller
(1998) based on the method developed by Witte, Krause, and Bailey (1970).with the following
modifications: no antioxidants were added as the test units contained antioxidants. Absorbance
was determined at 530 nm with a UV/Vis/NIR spectrophotometer (Lambda 950 UV/Vis/NIR
spectrophotometer, Perkin Elmer, Inc.). Briefly, samples (5.0 g) were placed in a porcelain
mortar (pour lip diameter = 90 mm). 45.5 mL of extraction solution containing 10%
trichloroacetic acid in 0.02 M phosphoric acid (TCA / H3PO4) brought to 50 mL, was ground
with a pestle for 1 min. The resulting mixture was filtered through Whatman No. 1 filter paper.
One additional sample was spiked with 12 mL of 10 μM 1,1,3,3-tetraethoxypropane (TEP). Two
5 mL aliquots of each filtered sample were transferred into two separate screw-cap test tubes (15
× 200 mm). To one aliquot, 5.0 mL 0.02 M 2-thiobarbituric acid was added (test sample); to the
second aliquot, 5.0 mL deionized water was added (sample blank). Test tubes were covered in
Parafilm M, capped, inverted three times to mix and held in the dark for 18 hr. at room

78
temperature. Absorbance was determined spectrophotometrically, with sample blank absorbance
subtracted from test sample readings.
A standard curve was derived based on the procedure described by Miller (1998).
Aliquots (0.0, 0.5, 1.0, 1.5, 2.0, 2.5 μL) of 25 μM of 1,1,3,3-tetraethoxy-propane (TEP) (Sigma-
Aldrich, St. Louis, MO) were pipetted into 20 mL screw-cap test tubes, in duplicate. The total
volume of each tube was 10 mL: 5 mL with TCA / H3PO4 solution and 5 mL of TBA reagent.
The standard curve was constructed from absorbance versus concentration of malondialdehyde
(as nmol MDA / mL) (MDA, St. Louis, MO). MDA recover was calculated and is expressed as a
percentage. Concentration of TBARS was determined as μg MDA / g meat. It was assumed that
recovery of TBARS was the same as for MDA. BHT crystalline, trichloroacetic acid crystal
reagent and o-phosphoric acid were reagent grade (Sigma-Aldrich, St. Louis, MO, U.S.A.).
4.3.7 Statistical Analysis
Lard-model data were analyzed as a 7 (antioxidant treatment) × 6 (storage time) factorial
design using the PROC MIXED procedure (SAS® 2012). Canola oil-model data were analyzed
as a 4 (antioxidant treatment) × 6 (storage time) factorial design using the PROC MIXED
procedure (SAS® 2012). TBARS and conjugated dienes main effects and interactions were
considered significant at p<0.05. Sensory effects were considered significant at p<0.10.
Separation of least square means was achieved using probability of difference, adjusted with the
Tukey procedure for multiple comparisons.
4.4 Results and Discussion
4.4.1 Effect of Natural Antioxidants on Diene Conjugation
4.4.1.1 Effect of Natural Antioxidants on Diene Conjugation of Lard Model System

79
When held at 30 oC, the effect of storage time by antioxidant on diene conjugation
(measured spectrophotometrically) was considered significant among the lard samples, as shown
in Figures 4.1 and 4.2. This trend showed a small but definite increase, similar to those found by
Chang et al. (1952). While all treatments increased over time, the synthetic antioxidant (BHA)
and highest treatment of pomegranate extract (1000 ppm) showed the least increase in
conjugated dienes from day 0 to day 9 (56% increase, BHA) and day 0 to day 4 (43% increase,
POM1000 before beginning to decrease), respectively. This is indicative of high antioxidant
capacity in these antioxidants at these levels. All antioxidants were significantly different than
the control on day 9, however selenium nearly tripled in diene conjugation. These results indicate
that selenium does not promote antioxidant activity (without cellular biotransformation),
indicated by Tappel (1980). These results do not disagree with those of Tappel, however, Tappel
incorporated dietary selenium using an oil carrier in rats to study pentane (a biological oxidation
product). They do support the idea that selenium acts as an antioxidant in vitro (via selenium-
glutathione peroxidase) rather than in vivo. When the amounts of each antioxidant were kept
constant, BHA showed the lowest diene conjugation at 3.9 mmol / kg sample, while GSE had a
25% increase compared to BHA and POM which increased 59%. As expected, an increase in the
amount of pomegranate extract used showed a decrease in the amount of oxidation product
formation (in this case, diene conjugation).
4.4.1.2 Effect of Natural Antioxidants on Diene Conjugation of Canola Oil Model System
When held at 30 oC, all 4 antioxidants had significant effects on diene conjugation
(measured spectrophotometrically) as shown in Figure 4.5. The measure of diene conjugation in
the canola-oil system was drastically different than any previously seen. The pattern for all the
antioxidants appeared bimodal with a trough appearing at day 4. It is possible that this is due to

80
linolenate oxidation occurring before linoleate oxidation (Wong, 1989). Notably, between day 7
and day 9, the matrix holding together the GSE and BHA models started to break down, causing
separation of the hydrophilic and hydrophobic layers. The formation of diene conjugation did not
appear significantly different from the control for the pomegranate and grape seed extract
treatments on day 9, while the synthetic antioxidants did differ from the control (all of which
were 69% greater in diene conjugation than the control).
4.4.2 Effect of Natural Antioxidants on TBARS
4.4.2.1 Effect of Natural Antioxidants on TBARS of the Lard Model System
TBARS values of the lard model system over 9 days of 30 oC storage are presented in
Figure 4.3 and Figure 4.4. TBARS were affected by antioxidant, storage time and the interaction.
With the exception of the control, TBARS remained unchanged until day 4 of the study, then
increased over time. The results of the control were similar to those found in the pork model
system used by Hernàndez-Hernàndez et al. (2009). 1000 ppm pomegranate extract was
statistically similar to BHA, both showing the lowest values over time. In contrast, selenium and
the control were not found to be statistically different by day 9, having the highest TBARS value
recorded. Additionally, by day 9, 100 ppm pomegranate extract (while statistically different)
showed similar TBARS values to the control, indicating that it is a much poorer antioxidant than
BHA or GSE, when kept at the same concentration.
4.4.2.1 Effect of Natural Antioxidants on TBARS of the Canola Oil Model System
As is evident in Figure 4.6, the antioxidant treatment significantly affected TBARS
values of the canola oil system over 9 days at 30 oC. The control was found to be statistically
different starting on day 1, while none of the antioxidant treatments (POM, GSE, or BHA) were

81
determined to be statistically different from each other by day 9. These results (between the
control and synthetic antioxidant) are similar to those found by Wanasundara & Shahidi (1994).
4.4.3 Effect of Natural Antioxidants on Sensory Attributes in a Canola Oil-Model System
No significant differences were detected in the intensities of the off-odor characteristics
across the antioxidant treatments over time, but the control differed from the antioxidant
treatments over time for all attributes (Figure 4.7). When the data were pooled over time, by
antioxidant treatment panelists ranked all attributes as increasing over time (Figure 4.8). This
indicates that these attributes are descriptive for oxidation of canola oil. Using hexanal as a
reference for green was appropriate as many authors have found that the ratio of hexanal-to-
nonanal (Morales, Rios & Aparicio, 1997) while many other authors note that an increase in
hexanal in high-lipid matrices (especially beef) over time was positively correlated with sensory
descriptors of oxidation (Brewer & Vega, 1995; Stetzer et al., 2008; Teets & Were, 2008). The
increase in oaty odor characteristics was also found by Shuh and Schieberle (2005), who
determined that the odor active compound (2,4,6-nonatrienal) in oat flakes was also an active
compound formed by the autoxidation of linolenic acid. These results also show similar results
to the antioxidant activity of plant extracts in cooked patties reported by Nissen et al. (2004),
who found an increase in painty (using linseed oil as a standard) which was highly correlated
with TBARS, hexanal content, and a high score for the sensory term ‘rancid’. Malcomson et al.
(1996) also showed that ‘painty’ was a useful indicator of consumer acceptance in canola oil
over time (often correlated with the amount of pent-, hex- and heptanal found in oxidized canola
oil). The ‘dairy’ attribute bears similarity to the breakdown products of PUFAs into compounds
like nonadienes, which were shown by Morales, Rios & Aparicio (1997) to contribute greatly to
the oxidation profile of linoleate 9-OOH degradation.

82
All samples shared significantly similar results until day 4. However, the drastic increase
on day 7 of each attribute indicates that all antioxidants have the potential for controlling the
negative sensory characteristics often associated with oxidation of canola oil.
4.5 Conclusion
Sensory analysis of the canola-oil containing samples positively indicated a difference in
oxidation characteristics between all antioxidant treatments and the controls. However, the
sensory study failed to differentiate between the antioxidants in terms of controlling oxidation.
This could indicate no human preference in terms of antioxidant use, allowing manufacturers to
use whichever antioxidant is most economically feasible. In regards to TBARS as a measure of
antioxidant activity, BHA consistently gave lower oxidation values than the natural antioxidants
when used at the same level. Grape seed extract showed statistically lower TBARS values than
pomegranate extract in both the lard and the canola oil model systems, but higher values than
BHA. A ten-fold increase in pomegranate extract concentration showed lower TBARS values
than BHA in the lard-model system, but would need to be repeated in both systems to indicate
that these levels aren’t matrix-dependent.
4.6 References
Brewer, M.S. & Vega, J.D. 1995. Detectable odor thresholds of selected lipid oxidation
compounds in a meat model system. Jour. Food Sci., 60(3): 592-5.
Brewer, M.S., Peterson, W.J., Carr, T.C., McCusker, R. & Novakofski, J. 2005. Thermal gelation
properties of myofibrillar protein and gelatin combinations. Jour. Muscle Foods, 16: 126-140.
Broadbent, C.J. & Pike, O.A. 2003. Oil stability index correlated with sensory determination of
oxidative stability in canola oil. Jour. Am. Oil Chem. Soc., 80(1): 59-63.
Chang, I.C.L., Tchen, L.I.Y. & Watts, B.M. 1952. The fatty acid content of selected foods before
and after cooking. Jour. Am. Oil Chem. Soc., 29(9): 378-9.

83
Fazel, M., Sahari, M.A. & Barzegar, M. 2009. Comparison of tea and sesame seed oils as two
natural antioxidants in a fish oil model system by radical scavenging activity. International Jour.
of Food Sci. & Nutr., 60(7): 567-576.
Frankel, E.N. 1993. In search of better methods to evaluate natural antioxidants and oxidative
stability in food lipids. Trends in Food Sci. & Tech., 4: 220-5.
Gelatin Manufacturers Institute. 1993. Gelatin., Gelatin Manufacturers of America, New York.
Hernàdez-Hernàndez, E., Ponce-Alquicira, E., Jaramillo-Flores, M.E. & Legarreta, I.G. 2009
Antioxidant effect rosmary (Rosmarinus officinalis L.) and oregano (Origanum vulgare L.)
extracts on TBARS and colour of model raw pork batters. Meat Sci., 81: 410-7.
Jayaprakasha, G.K., Singh, R.P., & Sakariah, K.K. 2000. Antioxidant activity of grape seed
(Vitis vinifera) extracts on peroxidation models in vitro. Food Chem., 73: 285-290.
Juntachote, T., Berghofer, E., Siebenhandl, S., & Bauer, F. 2006. The antioxidative properties of
Holy basil and Galangal in cooked ground pork. Meat Sci., 72(3): 446-456
King, M.F., Boyd, L.C. & Sheldon, B.W. 1992. Effects of phospholipids on lipid oxidation of a
salmon oil model system. Journ Am. Oil Chem. Soc., 69(3): 237-242.
Lee, I., Fatemi, S.H., Hammond, E.G. & White, P.J. 1995. Quantitation of flavor volatiles in
oxidized soybean oil by dynamic headspace analysis. Journ. Am. Oil Chem. Soc., 72(5): 539-
546.
Malcolmson, L.J., Vaisey-Genser, M., Przybylski, R., Ryland, D., Eskin, N.A.M. & Armstrong,
L. 1996. Characterization of stored regular and low-linolenic canola oils at different levels of
consumer acceptance. Jour. Agric. Oil Chem. Soc., 73(9): 1153-1160.
Morales, M.T., Rios, J.J. & Aparicio, R. 1997. Changes in the volatile composition of virgin
olive oil during oxidation: flavors and off-flavors. Jour. Agric. Food Chem., 45(7): 2666-2673.
Nissen, L.R., Byrne, D. V., Bertelsen, G. & Skibsted, L.H. 2004. The antioxidant activity of
plant extracts in cooked pork patties as evaluated by descriptive sensory profiling and chemical
analysis. Meat Sci., 68: 485-495.
Rojas, M. & Brewer, M.S. 2007. Effect of natural antioxidants on oxidative stability of
refrigerated cooked beef and pork patties. Jour Food Sci., 72(4): S282-S288.
Shuch, C. & Schieberle, P. 2005. Characterization of (E,E,Z)-2,4,6-nonatrienal as a character
impact aroma compound of Oat Flakes. J. Agric. Food Chem., 53: 8699-8705.
Stetzer, A.J., Cadwallader, K., Singh, T.K., McKeith, F.K., & Brewer, M.S. 2008. Effect of
enhancement and ageing on flavor and volatile compounds in various beef muscles. Meat
Sciences, 79: 13-19.

84
Teets, A.S. & Were, L.M. 2008. Inhibition of lipid oxidation in refrigerated and frozen salted
raw minced chicken breasts with electron beam irradiated almond skin powder. Meat Sci., 80:
1326-1332.
Tappel, A.L. 1980. Vitamin E and selenium protection from in vivo lipid peroxidation. Annals of
the New York Academy of Sciences, 355(1): 18-31.
Wanasundara, U.N. & Shahidi, F. 1994. Canola extract as an alternative natural antioxidant for
canola oil. Jour. Am. Oil Chem. Soc., 71(8): 817-822.
Wong, D.W.S. 1989. Lipids. In: Mechanism and Theory in Food Chemistry. 16th
ed. New York:
Springer. pp 3- 42.

85
Figure 4.1: Effect of Antioxidants on Diene Conjugation1 of Lard Model System Over Storage
Time (30oC)
1Least Square Means (LSM) of conjugated dienes (mmol / kg sample)
Y Error bars = standard error of LSM
Figure 4.2: Effect of Increasing Level of Natural Antioxidant on Diene Conjugation1 of Lard
Model System Over Time (30oC)
1Least Square Means (LSM) of conjugated dienes (mmol / kg sample)
Y Error bars = standard error of LSM
2
4
6
8
10
0 2 4 6 8 10
Co
nju
ga
ted
Die
ne
s
Storage Time (days)
Control
Pomegranate Extract
Grape Seed Extract
Selenium
BHA
2
3
4
5
6
7
8
9
10
0 2 4 6 8 10
mm
ol
Co
nju
ga
ted
Die
ne
s /
kg
Sa
mp
le
Storage Time (days)
Control
100 ppm PomegranateExtract
500 ppm PomegranateExtract
1000 ppm PomegranateExtract
BHA
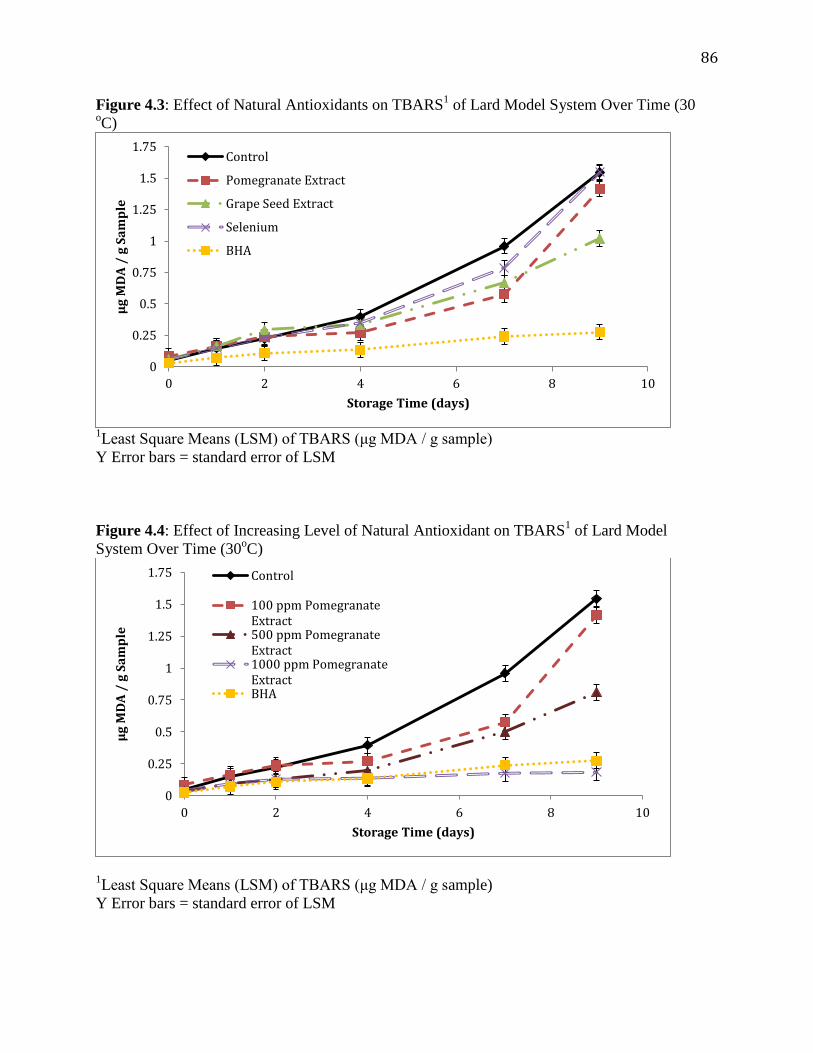
86
Figure 4.3: Effect of Natural Antioxidants on TBARS1 of Lard Model System Over Time (30
oC)
1Least Square Means (LSM) of TBARS (μg MDA / g sample)
Y Error bars = standard error of LSM
Figure 4.4: Effect of Increasing Level of Natural Antioxidant on TBARS1 of Lard Model
System Over Time (30oC)
1Least Square Means (LSM) of TBARS (μg MDA / g sample)
Y Error bars = standard error of LSM
0
0.25
0.5
0.75
1
1.25
1.5
1.75
0 2 4 6 8 10
μg
MD
A /
g S
am
ple
Storage Time (days)
Control
Pomegranate Extract
Grape Seed Extract
Selenium
BHA
0
0.25
0.5
0.75
1
1.25
1.5
1.75
0 2 4 6 8 10
μg
MD
A /
g S
am
ple
Storage Time (days)
Control
100 ppm PomegranateExtract500 ppm PomegranateExtract1000 ppm PomegranateExtractBHA

87
Figure 4.5: Effect of Natural Antioxidant on Diene Conjugation of Canola Oil Model System
Over Time (30oC)
1Least Square Means (LSM) of conjugated dienes (mmol / kg sample)
Y Error bars = standard error of LSM
Figure 4.6: Effect of Natural Antioxidant on TBARS of Canola Oil Model System Over Time
(30oC)
1Least Square Means (LSM) of TBARS (μg MDA / g sample)
Y Error bars = standard error of LSM
0
0.5
1
1.5
2
2.5
3
3.5
4
0 2 4 6 8 10
mm
ol
Co
nju
ga
ted
Die
ne
/ k
g S
am
ple
Storage Time (Days)
Control
POM
GSE
BHA
0
0.05
0.1
0.15
0.2
0.25
0.3
0 2 4 6 8 10
μg
MD
A /
g S
am
ple
Storage Time (Days)
Control
POM
GSE
BHA

88
Figure 4.7: Effect of Antioxidants on odor Descriptors1 of Canola Oil Model System (30
oC)
1 Least Square Means (LSM) of score value pooled over storage (30
oC) time.
Figure 4.8: Effect of Time on Odor Descriptors of Canola Oil Model System (30oC)
1Least Square Means (LSM) of score values pooled over treatment.
Y Error Bars = standard error of LSM
0
2
4
6
8Oxidized
Dairy
PaintyOaty
Green
Control
PomegranateExtract
Grape SeedExtract
BHA
0
1
2
3
4
5
6
7
8
9
0 2 4 6 8 10
Se
nso
ry S
core
(cm
.)
Storage Time (Days)
Oxidized
Dairy
Painty
Oaty
Green

89
Chapter 5: Effect of Irradiation, Antioxidant and Sodium Chloride Level on the Oxidation
of High-Fat Ground Beef Patties
5.1 Abstract
To determine the effect of pomegranate extract on antioxidant activity, beef patties were
subjected to multiple processing factors. Beef patties were treated with one of five antioxidants
(control, pomegranate extract (POM), grape seed extract (GSE), dietary selenium and butylated
hydroxyanisole (BHA)), one of two levels of sodium chloride (0.5% and 2%), and irradiated at 0
or 1.5 kGy. Samples were then evaluated for oxidative rancidity and antioxidant activity via
instrumental measurement of color, thiobarbituric acid reactive substances (TBARS) and/or
diene conjugation as analytical methods as well as evaluated by a trained sensory panel for
descriptive analysis over 9 days at 2 oC. Oxidation (as measured from sensory and analytical
measurements) increased as: irradiation dose increased, salt concentration increased and time
increased. From TBARS values, BHA was found to be a statistically better antioxidant under all
conditions (irradiation and salt content) than the natural antioxidants. Panelists were able to
distinguish a difference (in terms of oxidation attributes) between patty samples while they were
raw, but unable to distinguish a difference between patties after cooking.
5.2 Introduction
The advancement in shipping foods has allowed consumers to experience a plethora of
cuisine regardless of seasonal limitations or growing-region selectivity. A caveat to increased
access to food lies with pandemic concerns when animal products (such as ground beef) are
infected with antibiotic resistant, pathogenic bacteria and shipped across the continent. Recently
in late-2011, twenty individuals contracted an antibiotic-resistant strain of Salmonella
typhimurium from contaminated beef (Rothchild, 2012). Because food borne illness causes loss

90
in the form of economic loss, reputational degradation, and loss in inventory, the food industry is
consistently attempting to find effective ways to provide pathogen-free food to consumers. In
terms of ground beef, one such method that has been evaluated is the process of irradiation.
While controversial, the FDA has determined that moderate doses of irradiation (3.5 kGy for
fresh, raw meat) are effective at eliminating pathogenic microbes (Brewer, 2009). In addition to
microbial safety, Teets & Were (2008) have indicated that irradiation may assist in extending the
induction period of lipid oxidation in regards to certain antioxidants such as flavonoids.
In 2006, 19 million pounds of livestock was processed in the U.S. (Haley, 2006).
Oxidation quickly degrades high-fat, ground beef patties from a visual and odor/flavor related
context. When meat is macerated, it becomes more susceptible to oxidative rancidity, color
deterioration and pathogenic contamination. Visual interaction with meat products is the initial
method of meat preference that consumers employ. Multiple authors (Glitsch, 2000; Rasvik,
1994) have indicated consumer preference towards bright red meat over dark or discolored meat.
Secondary interactions, such development of off-odor and flavor compounds, also detract from
purchase intent. These compounds are prevalent in macerated beef products because the process
allows oxygen, a potent oxidizing agent, to interact with all aspects of the meat. Furthermore, the
process of grinding meat allows endogenous oxidizing agents to come in contact with
polyunsaturated lipids (PUFAs). PUFAs are readily oxidized (Rhee, 1988) and breakdown into
highly odorous compounds often associated with rancidity (St. Angel et al., 1990).
To counteract the negative effects of oxidation, natural and synthetic antioxidants have
been employed and studied at large. Butylated hydroxyanisole (BHA) has been widely used with
other synthetic antioxidants at low doses. However, toxological effects and consumer preference
(Rojas & Brewer, 2008; Formanek et al., 2001) have indicated a trend towards consumer

91
preference for natural antioxidants. Previous studies have examined plants and herbs as natural
antioxidants in raw meats (Chen, Jo, Lee & Ahn, 1999; Han & Rhee, 2005; Rojas & Brewer,
2008; Nicolade et al.,2006) and attributed antioxidant activity to the high amount of phenolic
compounds these plants contain. Grape seed extract has been studied extensively in reducing
lipid oxidation in ground beef when utilized at 1% (Ahn et al., 2007, Rojas & Brewer, 2008). To
date, pomegranate has been sold commercially as an extract and while authors have studied the
effects in vivo (Shakula et al., 2008), none have evaluated the extract in a meat model system.
5.3 Materials and Methods
The first experiment was designed as a randomized complete block design with four
antioxidant treatments, two irradiation levels, five storage times and four replicates (two batches
and two replicates / batch). Antioxidant treatments included a control (no antioxidant), 100 ppm
pomegranate extract ([POM], POMx, Punica granatum L., Wonderful variety; Paramount
Farms, CA, USA), 100 ppm grape seed extract ([GSE], Gravinol Super™, Kikkoman, Tokyo,
Japan), dietary selenium ([Se], Nature’s Bounty™, Bohemia, NY, USA) and 100 ppm butylated
hydroxyanisole ([BHA], Sigma, St. Louis, MO, USA) based on total weight of the batch.
Ground beef was procured from a local supplier (Urbana, IL; 27% fat, as labeled). All meat
purchased was mixed to form a uniform batch. Products were mixed by hand with the desired
amount of salt (0.5% w/w, in experiment 1; 2% (
w/w) in experiment 2) and antioxidants (none,
POM, GSE, Se and BHA) at 100 ppm (w/w). Mixed beef was then placed on parchment paper and
formed using a rolling pin and guide bars (0.375 cm). Samples were cut using a 5.5-cm (for
physical or chemical analysis) or 7.5-cm (for sensory analysis) circular cookie cutter. Individual
patties were laid on 11 × 14 cm. foam trays (Cryovac, Sealed Air Corporation, Elmwood Park,

92
NJ) and over-wrapped with commercial polyvinyl chloride (Multivac C500, Koch Supplies, Inc.,
Kansas City, MO) before being stored in the dark at 2 oC for up to 9 days.
5.3.1 Anti- / prooxidants
Five antioxidant treatments were evaluated: Pomegranate extract (POMx, Punica
granatum L., Wonderful variety; Paramount Farms, CA, USA); Grape seed extract (GSE;
(2007)(Gravinol Super TM, Kikkoman, Tokyo, Japan) contained 98% total flavanols (89%
proanthocyanidins); Dietary selenium (Nature’s Bounty, Bohemia, NY) was received
commercially containing 200 μg organic selenium (of yeast origin) per tablet (Se; (2012)
(Nature’s Bounty, Bohemia, NY)); Butylated hydroxyanisole was reagent grade from Sigma-
Aldrich Inc. (BHA; (2007) (St. Louis, MO, U.S.A.)). All crystalline or tablet antioxidants were
ground using a mortar and pestle (pour lip diameter = 90 mm). Sodium Chloride was procured
from U.S. Salt (Watkins Glen, NY, U.S.A.).
5.3.2 0.5%-Salt Ground Beef Patties
After patty formation, half of each variable of each variable condition were transported
on ice to the University of Illinois Nuclear Radiation Facility (Urbana, IL) where they were
exposed to 1.5 kGy of gamma-irradiation (Gammacell 220 Excell, MDS Nordion, Ottawa, ON,
Canada, K2K 1×8). Samples were maintained at refrigeration temperature (4-8OC) during
irradiation. The cylindrical irradiation chamber was (diameter × height) 152 × 206 mm. Precise
dose distribution in the irradiation chamber was measured using Gafchromic MD-55 (ISP
Technologies Inc., Wayne, NJ) and Radiachromic FWT-60 film dosimeters (Far West
Technology, Inc., Goleta, CA), which were calibrated by the National Institute of Standards and
Technology. Samples were treated with dosages of 1.5 kGy. After irradiation, samples were
stored at 2 + 2 oC in the dark for 0, 2, 4, 7, and 9 days.

93
Sensory analyses were conducted in duplicate on patties made with 0.5% salt and
antioxidant treatment (none, POM, GSE, or BHA). Panelists were trained using standards over
18 thirty-minute sessions and evaluation occurred in duplicate on days 0, 2, 4, 7, and 9. Physical
analysis for 0.5%-salt patties was conducted on the same days as sensory analysis and included
determination of color by a spectrocolorimeter (Konica Minolta Sensing Inc., Osaka, Japan).
Chemical analyses included thiobarbituric acid-reactive substances (TBARS) conducted in
triplicate on six replicate samples. Data were statistically analyzed as a 5 (days) × 2 (irradiation
dose) × 4 (antioxidant) factorial design using SAS.
5.3.3 2%-Salt Ground Beef Patties
The second experiment was modeled after the first experiment, with the inclusion of
dietary selenium as a fifth antioxidant treatment and an two-fold increase in sodium chloride
content. Products were formed in an identical manner and stored in the dark at 2 oC for 9 days.
Physical analysis of color was conducted on days 0, 1, 2, 4, 7 and 9 by spectrocolorimeter.
Chemical analyses were conducted on the same days as physical analysis and included
thiobarbituric acid-reactive substances (TBARS) and spectrophotometric determination of
conjugated dienes. Both physical and chemical analyses were conducted in triplicate on three
replicate samples. Data were statistically analyzed as a 6 (days) × 5 (antioxidant) factorial design
using SAS.
5.3.4 Instrumental Color
Analytical color was determined on each evaluation day of each experiment using a
Chroma Meter CR-400 reflectance spectrocolorimeter (Konica Minolta Sensing Inc., Osaka,
Japan) standardized using a white standardization tile. Spectral curve was determined over the
400-700 nm range at 10 nm increments. L*, a*, and b* values were measured using Illuminant

94
D65 and a 10° observer (CIE, 1978). Hue angle ([tan-1
(b*/a*)] × 53.6) and Chroma
(√ ) were also calculated (Minolta 1998). ΔE*94 was determined using the
following equation:
√
where
L1*, a1*, and b1* corresponded to a reference (the control)
ΔL* = L1* - L2* KL = 1
Δa* = a1* - a2* K1 = 0.045
Δb* = b1* - b2* K2 = 0.015
C1* = √
C2* = √
ΔCab* = C1* - C2* ΔHab* = √
Significance was given as ΔE*94 ≈ 2.3 or above which corresponded to the Just Noticeable
Difference (JND) (Mahy, 1994).
5.3.5 Odor Evaluation of 0.5%-Salt Ground Beef Patties
Sensory testing was conducted at the University of Illinois (Urbana, IL) using ten
panelists (3 male, 7 female) ages 20 to 65 (IRB protocol number 12849). Two panelists data
were removed due to language barriers and incomplete understanding of attributes generated.
Training was performed during nine one-hour sessions under ambient lighting with
approximately 30% relative humidity. Training included a full replication of all variables. During
training, a panel leader facilitated discussions of product characteristics. Using refrigerated raw
and cooked patties, panelists determined odor characteristics based on 15 cm semi-structured line
scale (0 = none, 15 = extreme) (Appendix B, Figures B.2.1 and B.2.2). Odor standards were
determined by group consensus during 3 training sessions and served as anchor values for each
respective standard during the remaining training sessions. A complete list of terms, definitions,

95
references and ratings can be found in Appendix B, Table B.2.2. All references were prepared
within 2 hours of sample evaluation and were served in lidded plastic soufflé cups (56.7 g, Solo
Cup Company, Urbana, IL; Dart Container Corporation, Mason, MI).
Two replications were performed with evaluation occurring on days 0, 2, 4, 7 and 9.
Samples were randomized and presented in 4 oz. (113.4 g) plastic cups (Solo Cup Company,
Urbana, IL; Dart Container Corporation, Mason, MI). The sensory panel evaluated two sets of
five samples per session. Raw samples were evaluated before cooked samples, but cooked
samples were evaluated in random order of treatment across a session. Sensory data are reported
in centimeters from the left end of the line scale.
5.3.5.1 Patty Preparation for Sensory Analysis
Sensory testing only occurred on patties made with 0.5% salt. Raw and cooked patties
were placed in a 40 oC incubator for 30 minutes before being served to panelists. Uncooked
patties measured 5.5 cm.-diameter × 0.375 cm. in height (approximately 25 g). Uncooked patties
were cut into fifths and placed into soufflé cups and labeled with 3-digit random code numbers.
Cooked samples were cooked to 70 oC on Farberware Open Hearth grills (Model 455N,
Walter Kidde, Bronx, NY) at a setting of 3. The amount of time required to accomplish this
temperature was determined in a previous study [data not shown] by inserting internal
temperature monitoring using a copper Constantine copper fine-wire thermocouple (Model 5SC-
TT-T-30-36, Omega Engineering, Inc., Stamford, Ct) connected to a 12-channel scanning
thermocouple thermometer (Model 92000-00, Cole-Parmer Instrument Company, Vernon Hills,
IL). Briefly, 7 cm-diameter patties were placed on the fryers for 2.25 minutes (the approximate
half-time of the patties 70 oC end-point temperature) before being flipped, cooked for a total of

96
4.5 minutes. Cooked patties were blotted once before being cut into fifths and placed in plastic
soufflé cups as previously described.
5.3.6 Determination of Diene Conjugation
Conjugated dienes were determined as described by Juntachote, Berghofer, Siebendandl,
and Bauer (2006). Conjugated dienes were only determined on patties containing 2% salt (w/w).
Briefly, a sample (0.5 g) was suspended in 5.0 mL of deionized water in a porcelain mortar (pour
lip diameter = 90 mm). The sample was ground for 30 seconds until the solution became
homogeneous. A 0.5 mL aliquot of the suspension was mixed with 5.0 mL of extraction solution
(3:2 hexane:isopropanol (v/v)) for 1 min using a touch mixer (Model 231, Fisher Scientific,
Pittsburgh, PA, U.S.A.). After centrifugation at 2000g (Sorvall® RC-5B, Du Pont Company,
Wilmington, DE, U.S.A.) for 5 min, the absorbance of the supernatant (n-hexane) was
determined at 233 nm (Lambda 950 UV/Vis/NIR spectrophotometer, Perkin Elmer, Inc.,
Waltham, MA, USA). The concentration of conjugated dienes was calculated using the molar
extinction coefficient of 25,200 M-1
cm-1
. Hexane and isopropanol were reagent grade (Fisher
Scientific, Pittsburgh, PA, U.S.A.)Results are expressed as mmol dienes / kg sample:
5.3.7 Thiobarbituric Reactive Substances (TBARS)
Thiobarbituric reactive substances (TBARS) were determined as described by Miller
(1998) based on the method developed by Witte, Krause, and Bailey (1970) with the following
modifications: no antioxidants were added as the test units contained antioxidants. Briefly, 5.0 g
of patty samples were placed in a porcelain mortar (pour lip diameter = 90 mm). 45.5 mL of
extraction solution containing 10% trichloroacetic acid in 0.02 M phosphoric acid (TCA /

97
H3PO4) brought to 50 mL, was ground with a pestle for 1 min. The resulting mixture was filtered
through Whatman No. 1 filter paper. One additional sample was spiked with 12 mL of 10 μM
1,1,3,3-tetraethoxypropane (TEP). Two 5 mL aliquots of each filtered sample were transferred
into two separate screw-cap test tubes (15 × 200 mm). To one aliquot, 5.0 mL 0.02 M 2-
thiobarbituric acid was added (test sample); to the second aliquot, 5.0 mL deionized water was
added (sample blank). Test tubes were covered in Parafilm M, capped, inverted three times to
mix and held in the dark for 18 hr. at room temperature. Absorbance was determined at 533 nm
with a UV/Vis/NIR spectrophotometer (Lambda 950 UV/Vis/NIR spectrophotometer, Perkin
Elmer, Inc.) Absorbance was determined at 533 nm with a UV/Vis/NIR spectrophotometer
(Lambda 950 UV/Vis/NIR spectrophotometer, Perkin Elmer, Inc.). The sample blank
absorbance reading was then subtracted from test sample readings.
A standard curve was derived based on the procedure described by Miller (1998).
Aliquots (0.0, 0.5, 1.0, 1.5, 2.0, 2.5 μL) of 25 μM of 1,1,3,3-tetraethoxy-propane (TEP) (Sigma-
Aldrich, St. Louis, MO) were pipetted into 20 mL screw-cap test tubes, in duplicate. The total
volume of each tube was 10 mL: 5 mL with TCA / H3PO4 solution and 5 mL of TBA reagent.
The standard curve was constructed from absorbance versus concentration of malondialdehyde
(as nmol MDA / mL; Pearson’s correlation coefficient: 0.9995) (MDA, St. Louis, MO).
Abs530 = 0.3396 ConcMDA + 0.0092
MDA recovery was calculated and is expressed as a percentage. Concentration of
TBARS was determined as μg MDA / g meat. It was assumed that recovery of TBARS was the
same as for MDA. BHT crystalline, trichloroacetic acid crystal reagent and o-phosphoric acid
were reagent grade (Sigma-Aldrich, St. Louis, MO, U.S.A.).

98
5.3.8 Statistical Analysis
Data from experiment 1 (patties with 0.5% salt) were analyzed as a 4 (antioxidant
treatment) × 2 (irradiation dose treatment) × 5 (storage time) factorial design using the PROC
MIXED procedure (SAS® 2012). TBARS and color parameters main effects and interactions
were considered significant at p<0.05. Sensory characteristics were considered significant at
p<0.10. Separation of least square means was achieved using probability of difference, adjusted
with the Tukey procedure for multiple comparisons.
Data from experiment 2 (patties with 2% salt) were analyzed as a 5 (antioxidant
treatment) × 6 (storage time) factorial design using the PROC MIXED procedure (SAS® 2012).
Color parameters, TBARS, and conjugated dienes main effects and interactions were considered
significant at p<0.05. Separation of least square means was achieved using probability of
difference, adjusted with the Tukey procedure for multiple comparisons.
5.4 Results and Discussion
5.4.1 Effect of Natural Antioxidants on Color of Raw Beef Patties
5.4.1.1 Effect of Natural Antioxidants on Color on 0.5% -salt, Raw Patties Raw Beef Patties
The interaction between antioxidant over storage time was significant (p<0.05) for the L*
and b* value for the raw patties (unirradiated, 0.5%- and 2.0%-salt). For all other values
measured (a* value, chroma and hue angle), storage time was significant (Appendix C.1.1). This
was expected as the ferrous myoglobin (MbFeIIO2) is reduced to deoxymyoglobin. The
spontaneous autoxidation of this critical pigment is an important parameter of meat quality.
Because the appearance of food is the first stimulus consumers use to evaluate products,
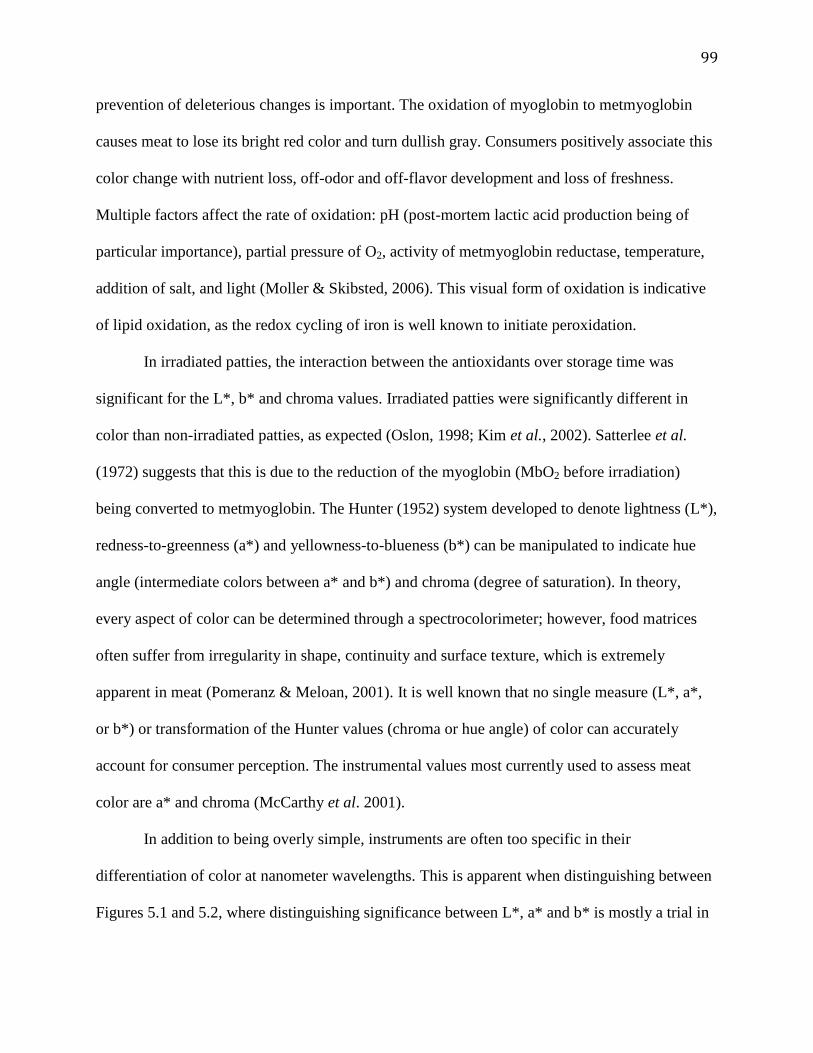
99
prevention of deleterious changes is important. The oxidation of myoglobin to metmyoglobin
causes meat to lose its bright red color and turn dullish gray. Consumers positively associate this
color change with nutrient loss, off-odor and off-flavor development and loss of freshness.
Multiple factors affect the rate of oxidation: pH (post-mortem lactic acid production being of
particular importance), partial pressure of O2, activity of metmyoglobin reductase, temperature,
addition of salt, and light (Moller & Skibsted, 2006). This visual form of oxidation is indicative
of lipid oxidation, as the redox cycling of iron is well known to initiate peroxidation.
In irradiated patties, the interaction between the antioxidants over storage time was
significant for the L*, b* and chroma values. Irradiated patties were significantly different in
color than non-irradiated patties, as expected (Oslon, 1998; Kim et al., 2002). Satterlee et al.
(1972) suggests that this is due to the reduction of the myoglobin (MbO2 before irradiation)
being converted to metmyoglobin. The Hunter (1952) system developed to denote lightness (L*),
redness-to-greenness (a*) and yellowness-to-blueness (b*) can be manipulated to indicate hue
angle (intermediate colors between a* and b*) and chroma (degree of saturation). In theory,
every aspect of color can be determined through a spectrocolorimeter; however, food matrices
often suffer from irregularity in shape, continuity and surface texture, which is extremely
apparent in meat (Pomeranz & Meloan, 2001). It is well known that no single measure (L*, a*,
or b*) or transformation of the Hunter values (chroma or hue angle) of color can accurately
account for consumer perception. The instrumental values most currently used to assess meat
color are a* and chroma (McCarthy et al. 2001).
In addition to being overly simple, instruments are often too specific in their
differentiation of color at nanometer wavelengths. This is apparent when distinguishing between
Figures 5.1 and 5.2, where distinguishing significance between L*, a* and b* is mostly a trial in
100
patience and attention span. Human sensory panels using paint tiles, such as those described by
Nicolade et al. (2006) have proved superior, but time-consuming and costly. In an attempt to find
a balance between instrumental values and the propensity of human sight towards certain
wavelengths (those in the yellow/green range), the International Center for Illuminance (CIE,
1995) has developed a distance metric called ΔE to address perceptual non-conformities while
simultaneously utilizing the L*, a*, and b* color space (CIE, 1995). Through multiple revisions,
the CIE has addressed factors that affect visual perception, such as the MacAdam ellipses. These
changes can be addressed as such:
1986 - Addition of an induction of a lightness-to-chroma factor (2:1), where hue is a
constant defined as 1.
1994 - Addition of weighting factors to give lightness, chroma and hue different
proportional weights in terms of perception.
2000 - Additional weights to correct for the relationship between chroma and hue.
By using the reference color of a fresh meat patty (control) on Day 0, a ΔE can be given
to each sample. Using the just noticeable difference (JND) value of 2.3 reported by Mahy (1994),
it is possible to determine one aspect when the oxidation of myoglobin becomes significantly
altered. For the values given in Table 5.2, it becomes apparent that only BHA maintain a similar
visual color as the control in unirradiated samples, a trend noted by Stout, Muthukamarappan, &
Julson (2000). The result of GSE having no effect on color changes in beef patties over time was
expected (Rojas & Brewer, 2007). In Table 5.3, 1.5 kGy the treated samples appear to maintain
similarity to the irradiated control through day 2, and pomegranate has an added effect of
maintaining the same color as the control through day 4.

101
5.4.1.2 2%-salt Patties
When salt content was increased, greater oxidation was induced (Figure 5.4). It should be
noted that every sample remained similar in color to the control through day 2, and only samples
using pomegranate as an antioxidant showed a just noticeable difference from the control by day
4. By day 7, all samples were noticeably different from the control in terms of color, indicating
that antioxidant effects on metmyoglobin formation had altered the color. As Hultin (1980) and
Srinivisan (1996) have pointed out, oxidation of meat pigments is due to free radicals and likely
a predecessor to lipid oxidation. Because of this, measurement of pigment oxidation is an
integral parameter of study for meat-muscle oxidation.
5.4.2 Effect of Natural Antioxidants and Irradiation on Odor Descriptors of Beef Patties
Table 5.1 Antioxidant Formulation and Code
Antioxidant Amount
Code based on
Irradiation Dose
0 kGy 1.5 kGy
Control 0 ppm CON CONIRR
Pomegranate Extract 100 ppm POM POMIRR
Grape Seed Extract 100 ppm GSE GSEIRR
Butylated
Hydroxyanisole 100 ppm BHA BHAIRR
Significant differences occurred in the intensities of the off-odor characteristics (Figure
5.3) in terms of antioxidant treatment (sweet, wet cardboard), and over storage time (raw, sweet,
wet cardboard and rancid) but not over the interaction between storage time and antioxidant for
each odor descriptor. These findings reaffirm the relationship (fresh meat odor giving way to
sweetness and finally rancidity over 10 days) given by Nissen et al. (2004) in their

102
comprehensive evaluation of plant extracts (including grape skin) as methods of controlling
oxidation.
The statistically significant (p≤0.10) difference in antioxidant treatments was found
between the CON and POMIRR patties in terms of developing sweetness throughout the storage
time. The attribute of wet cardboard developed the most differences among antioxidant
treatments, with high correlation being found between the raw, irradiated patties and raw,
unirradiated patties. The CONIRR and POMIRR treatments were each statistically higher than all
unirradiated treatments (at p≤0.10). Additionally, the POM treatment was found statistically
lower than the GSEIRR, and BHAIRR treatments (a result opposite to those of Stout,
Muthukamarappan, & Julson (2000) who found BHA and irradiation improved color and flavor
of irradiated beef). POMIRR additionally showed a lower value relative to CON in terms of wet
cardboard over time. Wet cardboard is an attribute that can be associated with ‘musty’ and
‘sweaty’. Such attributes have been a known indicator of ozone (Brewer, 2009) and oxidation
(Chen et al., 1999; Ahn et al., 1999b, 1998a; Jo & Ahn, 2000) which is linked to the irradiation
of meat products (Jo & Ahn, 2000).
These results confirm previous experiments using beef as a model system which
indicated that grape seed extract (Rojas & Brewer, 2007) and BHA (Wettasinghe & Shahidi,
1999) have the potential for controlling some of the negative sensory characteristics associated
with oxidation of meat over time. Certainly, no product can control oxidation products
indefinitely.
With the exception of ‘sulfury’, all attributes increased over time. Panelists found a
statistical decrease in terms of the raw attribute immediately from day 0 to day 2 but could only
detect a decrease again between day 7 and day 9. Conversely, panelists noticed a statistical

103
increase between day 0 and day 4 in both wet cardboard and rancid. Both wet cardboard and
rancid have been used as indicators of oxidation previously (Rojas & Brewer, 2007). The last
notable difference was in the term sweet, in which a notable increase developed between day 0
and statistically on day 7. This has also been noted by Nissen et al. (2006) in addition to a
decrease in meatiness over time. While Thakur & Sing (1994) and Mottram (1998) found sulfury
to be byproduct of irradiation processing, this study found it was not an indicator of oxidation
over time, antioxidant treatment or processing treatment.
5.4.2.2 Effect of Natural Antioxidants on Odor Descriptors of Cooked Beef Patties
The effect of cooking altered panelist perception of oxidation in the beef patties (Figure
5.4). After cooking, there was no significant difference due to antioxidant or irradiation. This
result is not surprising due to the unfolding of protein during heating which leads to an increase
in hydrophobic groups (Sydow, 1975). Brewer & Vega (1995) as well as other authors (Aria et
al.,1970) supported and indicated that exposed hydrophilic groups bind and inactivate the odor
properties of aldehydes (such as hexanal, a potent off-odor of lipid oxidation). Additionally,
prominent flavor components, such as hexanal, are driven off during heating).A difference due to
storage time appeared only in wet cardboard and rancid attributes and only between day 0 and
day 7. This is encouraging as it suggests the effect of cooking beef patties eradicates perception
of irradiation and added antioxidants up to a week, when kept at refrigerated temperature.
5.4.3 Effect of Natural Antioxidants on Lipid Oxidation of Raw Beef Patties
5.4.3.1 TBARS of 0.5%-salt Patties
The TBARS values of raw, unirradiated (Figure 5.5) and raw, irradiated (Figure 5.6) beef
patties with 0.5% salt and 100 ppm antioxidants over 9 days of refrigerated storage were
significant due to antioxidant and storage time, but not the interaction between the two. Overall,

104
the TBARS values did not change during the first 4 days of storage for beef patties utilizing an
antioxidant treatment (regardless of irradiation treatment). Only the control (?? The ones without
antioxidants?) of the irradiated beef patties showed a significant difference on day 4. Between
day 4 and day 7, there was a significant difference between all samples. This could indicate a
level of acceptance for raw patties, regardless of processing treatment (i.e. irradiation vs. non-
irradiated beef patties). For raw, unirradiated beef patties, only those patties containing BHA as
an antioxidant showed a significantly lower level of oxidation when comparing day 9 to day 0
Where the control showed an 88% increase in TBARS, those patties containing BHA showed
only a 70% increase. This differed statistically to those patties treated with pomegranate and
grape seed extract (increasing 83% and 84%, respectively). In irradiated patties, this difference
was more prominent. Antioxidant treatments involving BHAIRR and GSEIRR showed a significant
difference from the CONIRR and POMIRR (63% and 26% compared to 89% and 87% increases).
An interesting observation was made in patties containing BHAIRR and GSEIRR in TBARS on
Day 7. The steep decline in TBARS noted may indicate that either irradiation at 1.5 kGy was
enough to deactivate the antioxidant, or the high level of irradiation created a cascade of
oxidation products that burdened the antioxidant so that it was less effective after 7 days.
5.4.3.2 TBARS and Conjugated Dienes of 2%-Salt Patties
The increase of sodium chloride on antioxidant efficacy in unirradiated beef patties (as
measured by chemical analysis) offers similar results to those found in lower-salt patties. The
results of both assays of the control were similar of Srinivasan et al. (1996) in oxidation of
surimi-like beef heart. When considering the unirradiated, raw beef patties, it remains clear that
BHA serves as the best antioxidant in retarding oxidation of raw beef (Figure 5.5, 5.7). In Figure
5.7, pomegranate and grape seed extracts both appeared to significantly retard oxidation induced

105
by salt up to day 7, but started to fail (indicated by association with TBARS values similar to the
control) by day 9. In looking at salt-induced oxidation, multiple authors reported a prooxidative
effect at 2% (w/w) salt in cooked beef patties (Chen, 1984; Han and Rhee, 2005) and cooked
turkey patties (King & Earl, 1988) after 6 days (Han and Rhee, 2005) of refrigerated storage.
Multiple mechanisms have been proposed as to how sodium chloride acts as a prooxidant, from
disruption of membrane structural integrity (Rhee, 1999) to acceleration of metmyoglobin to
inducing the formation of free iron ions naturally found in meat (Kanner et al., 1991).
5.5 Conclusions
Butylated hydroxyanisole (BHA) exhibited the best antioxidant activity in ground beef
under each processing condition (both irradiated and non-irradiated beef during refrigerated
storage), as was demonstrated by the lower TBARS values, lower levels of diene conjugation
and off odors associated with rancid, wet cardboard and sweet. BHA did not alter the
instrumental color measures of ΔE*94 past day 2 in non-irradiated, 0.5%-salt beef patties. BHA, a
synthetic antioxidant, still shows the most potential at reducing autoxidation and maintaining the
shelf life in high-fat, ground beef patties.
5.6 References
Ahn, D. U., Olson, D. G., Lee, J. I., Jo, C., Wu, C. & Chen, S. (1998) - Packaging and
irradiation effects on lipid oxidation and volatiles in pork patties. Jour. of
Food Science, 63(1): 15–19.
Ahn, J., Grun, I.U., & Mustapha, A. 2007. Effects of plant extracts on microbial growth, color
change and lipid oxidation in cooked beef. Food Microbiology, 24: 7-14
Brewer, M.S. 2009. Irradiation effects on meat flavor: a review. Meat Sci., 81: 1-14.
CIE (Commision Internationale de L’Eclairage). 1995. Industrial color-difference evaluation.
Technical Report CIE 116-1995, central bureau of CIE, ISBN: 3-900-734-60-7, Vienna, Austria.

106
CIE (Commission Internationale de L’Eclairage). 1978. Recommendations on uniform
colorspaces – color equations, psychometric color terms. Supplement No. 2 to CIE Publ. No. 15
(E-1.3.L) 1971 (9CT-1-3) CIE, Paris.
Chen, C.-C., Pearson, J.I., & Merkel, R.A. (1984). Effects of salt and some antioxidants upon the
TBA number of meat. Food Chem., 14: 167-172.
Chen, X., Jo, C., Lee, J.I. & Ahn, D.U. 1999. Lipid oxidation, volatiles and color changes of
irradiated pork patties as affected by antioxidants. Jour. Food Sci., 64(1): 16-19.
Formanek, Z., Kerry, J.P., Higgens, F.M., Buckley, D.J., Morrissey, P.A. & Farkas, J. 2001.
Addition of synthetic and natural antioxidants on α-tocopherol acetate supplemented beef patties:
effects of antioxidants and packaging on lipid oxidation. Meat Sci., 58: 337-341.
Glitsch, K. 2006. Consumer perceptions of fresh meat quality : cross-national comparison.
British Food Jour., 102(3): 177-194.
Han, J. & Rhee, K.S. 2005. Antioxidant properties of selected Oriental non-
culinary/nutraceutical herb extracts as evaluated in raw and cooked meat. Meat Sci., 70: 25-33.
Hultin, H.O. 1980. Enzyme-catalyzed lipid oxidation in muscle microsomes. In Autoxidation in
Food and Biological Systems; Simic, M.G., Karel, M., Eds.; Plenum: New York.
Hunter, R.S. 1952. Photoelectric tristimulus colorimetry with three filters. Circ. C. 429. U.S.
Dept. Comm. Natl. Bur. Std. (U.S.).
Jo, C. & Ahn, D. U. 2000. Volatiles and oxidative changes in irradiated pork sausage with
different fatty acid composition and tocopherol content. Jour. of Food Sci., 65 (2): 270–5.
Juntachote, T., Berghofer, E., Siebenhandl, S., & Bauer, F. 2006. The antioxidative properties of
Holy basil and Galangal in cooked ground pork. Meat Sci., 72(3): 446-456.
Kanner, J., Harel, S. & Jaffe, R. (1991). Lipid peroxidation of muscle foods as affected by NaCl.
Jour. Ag. and Food Sci., 39: 1017-1021.
Kim, Y.H., Nam, K.C. & Ahn, D.U. 2002. Color, oxidation reduction potential and gas
production of irradiated meat from different animal species. Jour. of Food Sci., 61: 1692–1695.
King, A.J. & Earl, L.A. 1988. Effect of selected sodium and potassium salts on TBA values of
dark meat turkey patties. Jour. Food Sci., 53: 723-726.
Mahy, M., Van Eycken, L. & Oosterlinck, A. 1994. Evaluation of uniform color spaces
developed after the adoption of CIELAB and CIELUV. Jour. of Color Research and App., 19(2):
105-121.

107
McCarthy, T.L., Kerry, J.P., Kerry, J.F., Lynch, P.B. & Buckley, D.J. 2001. Evaluation of the
antioxidant potential of natural food/plant extracts as compared with synthetic antioxidants and
vitamin E in raw and cooked pork patties. Meat Sci., 58(1): 45-52.
Minolta. 1998. Precise color communication. Japan: Minolta Co. Ltd.
Miller, D.D. 1998. Food Chemistry. A Laboratory Manual. New York: John Wiley & Sons. pp.
65-67.
Moller, J.K.S. & Skibsted, L.H. 2006. Myoglobins – the link between discoloration and lipid
oxidation in muscle meat. Quim Nova., 29(6): 1270-1278.
Mottram, D. S. (1998). Flavour formation in meat and meat products: a review. Food
Chemistry, 62: 415–424.
Nicolade, C., Stetzer, A.J., Tucker, E.M. McKeith, F.K. & Brewer, M.S. 2006. Effect of
freezing, exposure to enhancement solution and modified atmosphere on pork bone
discoloration. Jour. Muscle Foods, 17(4): 428-442
Nissen, L.R., Byrne, D.V., Bertelsen, G., & Skibsted, L.H. 2004. The antioxidative activity of
plant extracts in cooked pork patties as evaluated by descriptive sensory profiling and chemical
analysis. Meat Sci., 68: 485-495.
Olson, D.G. 1998. Irradiation processing. Editor: Murano , E., Food irradiation – A
sourcebook. Meat and poultry irradiation short course, Iowa State University Press, Ames, IA,
pp. 3–27.
Olson, D.G. 1998. Irradiation of food: Scientific status summary. Food Tech., 52 (1): 56–62.
Pomeranz, Y. & Meloan, C. E. 2001. Food Analysis Theory and Practice. 2nd
ed. Gaithersburg,
MD : Aspen Publishers. pp. 22-68.
Rhee, K.S. 1988. Enzymic and non-enzymic catalysis of lipid oxidation in muscle foods. Food
Tech., 42(6): 127-132.
Rhee, K.S. 1999. Storage stability of meat products as affected by organic and inorganic
additives and functional ingredients. In Y.L. Xiong, C.T. Ho & F. Shahidi. Quality attributes of
muscle foods. New York: Plenum Publishing Corp. pp. 95-113.
Risvik, E. 1994. Sensory properties and preferences. Meat Sci., 36: 67-77.
Rojas, M. & Brewer, M.S. 2007. Effect of natural antioxidants on oxidative stability of
refrigerated cooked beef and pork patties. Jour. Food Sci., 72(4): S282-S288.

108
FoodSafetyNews: Outbreak tied to Maine ground beef is over [Internet]. Publisher: Marler, C.;
Author: Rothchild, M. [2012 Feb 2, accessed 2012 Jul 22]. Available from: http://www.food- safetynews.com/2012 /02/cdc-outbreak-linked-to-maine-ground-beef-has-ended/.
SAS®. 2012. Statistical Analysis Software. Version 9.3. Cary, NC: SAS Institute, Inc.
Satterlee, L.D., Brown, W.D. & Lycometros, C. 1972. Stability and characteristics of the
pigment produced by gamma irradiation of metmyoglobin. Jour. Food and Ag., 31: 213–217.
Srinivasan, S. Xiong, Y. L., Decker, E.A. 1996. Inhibition of protein and lipid oxidation in beef
heart surimi-like material by antioxidants and combinations of pH, NaCl, and buffer type in the
washing media. Jour. Agric. Food Chem., 44: 119-125.
St. Angelo, A.J., Crippen, K.L., Dupuy, H.P. & James, C. Jr. 1990. Chemical and sensory studies
of antioxidant-treated beef. Jour. Food Sci., 55(6): 1501-1505, 1539.
Stout, J., Muthukamarappan, K., & Julson, J. (2000). In Proceedings of the annual meeting of the
Institute of Food Technologists, Dallas, TX. Paper 86A-25.
Teets, A.S. & Were, L.M. 2008. Inhibition of lipid oxidation in refrigerated and frozen salted
raw minced chicken breasts with electron beam irradiated almond skin powder. Meat Sci., 80:
1326-1332.
Thakur, B. R., & Singh, R. K. (1994). Food irradiation Chemistry and applications.
Food Reviews International, 10(4): 437–473.
Wettasinghe, M. & Shahidi, F. 1999. Antioxidant and free radical-scavenging properties of
ethanolic extracts of defatted borage (Borago officinalis L.) seeds. Food Chem., 67: 399-414.
Witte, V.C., Krause, G.F. & Bailey, M.E. 1970. A new extraction method for determining 2-
thiobarbituric acid values of pork and beef during storage. Jour Food Sci., 35: 582-585.
Shukala, M., Gupta, K., Rasheed, Z. & Khan, K. 2008. Consumption of hydrolysable tannins-
rich pomegranate extract suppresses inflammation and joint damage in rheumatoid arthritis.
Basic Nutr. Invest., 24: 733-743.
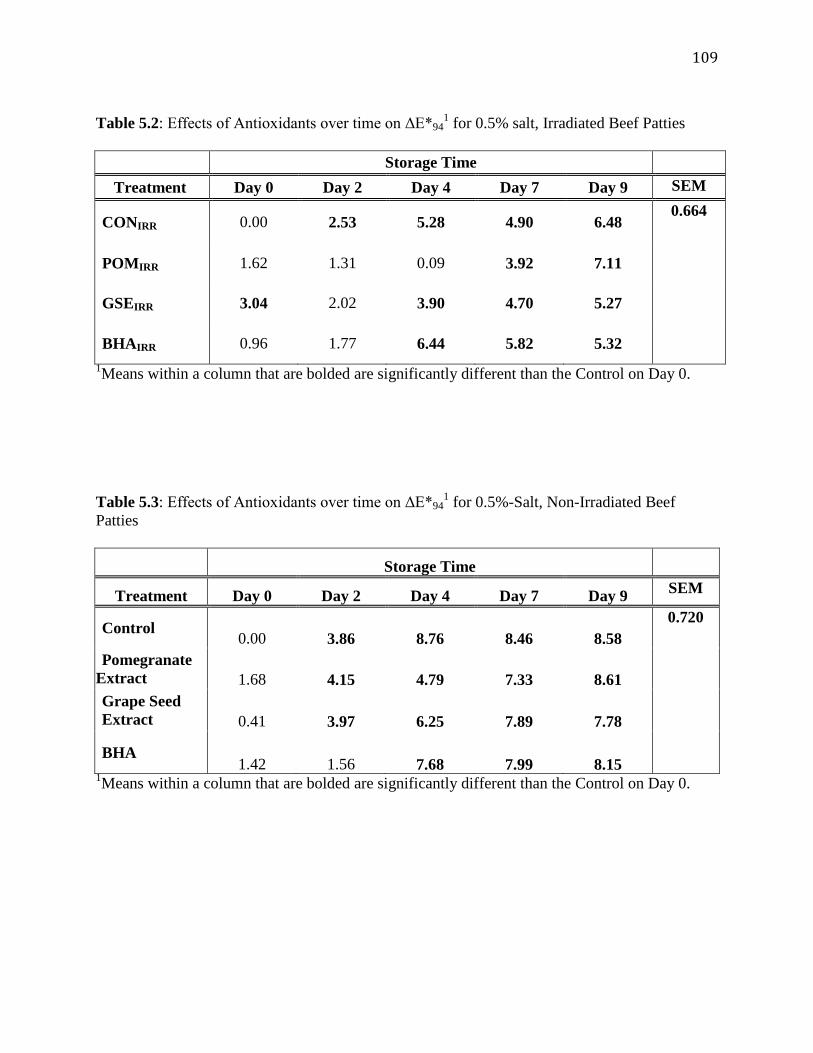
109
Table 5.2: Effects of Antioxidants over time on ΔE*941 for 0.5% salt, Irradiated Beef Patties
Storage Time
Treatment Day 0 Day 2 Day 4 Day 7 Day 9 SEM
CONIRR 0.00 2.53 5.28 4.90 6.48 0.664
POMIRR 1.62 1.31 0.09 3.92 7.11
GSEIRR 3.04 2.02 3.90 4.70 5.27
BHAIRR 0.96 1.77 6.44 5.82 5.32
1Means within a column that are bolded are significantly different than the Control on Day 0.
Table 5.3: Effects of Antioxidants over time on ΔE*941 for 0.5%-Salt, Non-Irradiated Beef
Patties
Storage Time
Treatment Day 0 Day 2 Day 4 Day 7 Day 9 SEM
Control 0.00 3.86 8.76 8.46 8.58
0.720
Pomegranate
Extract 1.68 4.15 4.79 7.33 8.61
Grape Seed
Extract 0.41 3.97 6.25 7.89 7.78
BHA 1.42 1.56 7.68 7.99 8.15
1Means within a column that are bolded are significantly different than the Control on Day 0.

110
Figure 5.1: L*, a* and b* 1 Values of 0.5%-Salt Ground Beef Patties Over Time
1 Least Square Means (LSM) of score value pooled over storage (4
oC) time.

111
Figure 5.2: L*, a* and b* 1
Values of Irradiated 0.5%-Salt Ground Beef Patties Over Time
1 Least Square Means (LSM) of score value pooled over storage (4
oC) time.

112
Table 5.4: Effects of Antioxidants over Time on ΔE*941 for 2%-Salt Ground Beef Patties
Storage Time
Treatment Day 0 Day 1 Day 2 Day 4 Day 7 Day 9 SEM
Control 0.00 1.15 1.52 2.27 4.58 6.17
0.446
Pomegranate
Extract 1.39 1.46 2.09 2.36 3.05 4.51
Grape Seed
Extract 0.76 0.61 1.74 1.52 3.22 4.55
Dietary
Selenium 0.80 1.55 1.28 1.87 3.79 4.46
BHA 0.91 1.03 1.29 1.22 2.85 3.14
1Means within a column that are bolded are significantly different than the Control on
Day 0.

113
Figure 5.3: Effect of Natural Antioxidants and Irradiation on Odor Descriptors1 of Refrigerated Raw Beef Patties
1 Least Square Means (LSM) of score value pooled over storage (4
oC) time.

114
Figure 5.4: Effect of Natural Antioxidants and Irradiation on Odor Descriptors1 of Refrigerated Raw Beef Patties After Cooking
1 Least Square Means (LSM) of score value pooled over storage (4
oC) time.

115
Figure 5.5 Comparative Effect of Antioxidants1 on TBARS of Raw, 0.5%-Salt Ground
Beef Model System over Storage Time (4oC)
1Least Square Means (LSM) of TBARS (μg MDA / g sample)
Y Error bars = standard error of LSM
Figure 5.6 Comparative Effect of Antioxidants1 on TBARS of Raw, Irradiated 0.5%-salt
Ground Beef Model System over Storage Time (4oC)
1Least Square Means (LSM) of TBARS (μg MDA / g sample)
Y Error bars = standard error of LSM
0
0.5
1
1.5
2
2.5
0 2 4 6 8
μg
MD
A /
g S
am
ple
Storage Time (Days)
Control
PomegranateExtractGrape Seed Extract
0
0.5
1
1.5
2
2.5
0 2 4 6 8
μg
MD
A /
g S
am
ple
Storage Time (Days)
Control
PomegranateExtractGrape Seed Extract

116
Figure 5.7 Comparative Effect of Antioxidants on TBARS1 of 2%-Salt, Raw Ground
Beef Model System over Storage Time (4oC)
1Least Square Means (LSM) of TBARS (μg MDA / g sample)
Y Error bars = standard error of LSM
Figure 5.8: Comparative Effect of Antioxidants on Conjugated Dienes1 of 2% NaCl Raw
Ground Beef Model System over time (4oC)
1Least Square Means (LSM) of diene conjugation (mmol / kg sample)
Y Error bars = standard error of LSM
0
0.2
0.4
0.6
0.8
1
1.2
1.4
0 2 4 6 8 10
μg
MD
A /
g S
am
ple
Storage Time (Days)
Control
Pomegranate Extract
Grape Seed Extract
Selenium
BHA
1
1.25
1.5
1.75
2
2.25
2.5
0 2 4 6 8 10
mm
ol
Co
nju
ga
ted
Die
ne
s /
kg
Sa
mp
le
Storage Time (days)
Control
Pomegranate Extract
Grape Seed Extract
Dietary Selenium
Butylated Hydroxyanisol

117
Chapter 6: Conclusions
Reducing lipid autoxidation in foods is a priority in maintaining quality attributes,
nutritional status, and consumer acceptability. The food industry has discovered multiple
avenues for controlling oxidation. Physical environmental control, elimination of activity
of endogenous enzymes, addition of hydrogen-donating compounds, and the addition of
reducing agents are all commonly employed methods. Because the chemical nature of
each antioxidant is different (e.g. hydrophilicity/solubility, number and placement of
hydroxyl groups, reductive potential), the nature of the antioxidant and matrix must be
known to determine effective systems for controlling oxidation. The consumer-driven
preference towards natural, plant-based antioxidants over conventional synthetically-
produced antioxidants becomes an economical concern when antioxidants (at the same
weight-by-weight basis) do not work in similar context.
Four experiments were conducted to evaluate the effectiveness of pomegranate
extract as an antioxidant in comparison to grape seed extract (an effective natural
antioxidant) and butylated hydroxyanisole (an effective synthetic antioxidant). When
directly analyzed through multiple well-known techniques, pomegranate extract was
found to be an exceptional antioxidant, performing better than both the well-known
synthetic and natural antioxidants. However, direct analysis is flawed through an over-
abundance of antioxidant, synthetically-generated free radical compounds, and a
chemical matrix that bears little similarity to standard food systems.
All three antioxidants were then evaluated in a gelled, emulsified lard model
system, using three concentrations of pomegranate extract (100 ppm, 500 ppm, and 1000
ppm) compared to 100 ppm of BHA and grape seed extract. At ten times the

118
concentration of the other antioxidants, POM extract finally extended the induction
period of oxidation beyond that of BHA, while at five times the concentration it exhibited
the antioxidant capacity of grape seed extract. At the same concentration of BHA and
GSE in a gelled, emulsified canola-oil model, it showed lower antioxidant capacity than
the well-known antioxidants, but was still distinguishable from the control in chemical
assays. A sensory study, however, indicated that all three antioxidants were comparable
in retarding oxidation.
In the final study, all three antioxidants were compared in a ground beef model
system. The meat model system contains more endogenous oxidation species, but is
representative of an actual food product. Chemical assays indicated that pomegranate
extract was not as efficient at reducing autoxidation, salt-induced oxidation or irradiation-
induced oxidation when compared to GSE and BHA. On the other hand, a sensory study
indicated that while each antioxidant had slightly different characteristics, all were more
effective at controlling salt-induced and autoxidation when compared to a control. No
antioxidant was effective at extending the induction period of oxidation in the meat
samples after being irradiated. Additionally, the effect of cooking minimized the off-odor
effect of both irradiation- and salt-induced oxidation characteristics.
In summary, pomegranate extract has the potential to extend the induction period
of oxidation (reducing off-odor and flavor characteristics), but only if incorporated at
higher levels than antioxidants which are currently employed (i.e. BHA). While the
relationship between pomegranate extract, grape seed extract and BHA appeared
independent of the food matrix, it is necessary to understand the nature of the matrix
because each matrix will have individual pro- and antioxidant constituents.

119
Appendix A: Experimental Design
Figure A.1.1. Lard Model System Flow Diagram
Lard Model System
Control Pomegranate
Extract
Grape Seed Extract
Butylated Hydroxy-
Anisol
Day 0 Day 2 Day 4 Day 7 Day 9
Dietary Selenium
Day 1

120
Figure A.1.2.: Canola Oil Model System Experimental Design
Canola Oil Gelatin
Sodium Stearoyl Lactylate Hemoglobin
Control Pomegranate Extract
Grape Seed Extract
Butylated Hydroxy- Anisol
Day 0 Day 2 Day 4 Day 7 Day 9 Day 1

121
Figure A.1.3 Ground Beef Model System Flow Diagram
Ground Beef
(5.5 cm diameter)
Control Pomegranate Extract
Grape Seed Extract
Butylated Hydroxy- Anisole
0 kGy 1.5 kGy
Day 0 Day 2 Day 4 Day 7 Day 9

122
Figure A.2.1 Total Phenolics Determined by Folin-Ciocalteu Reagent
Pipette 2.0 mL of Antioxidant extract into 3 screw-cap test
tubes
Medium Concentration: Pippette 0.200 mL 100 ppm Antiox Extract into test tube Pippette 0.200 mL MeOH in test tube Pippette 1.600 mL dH
2O into test tube
High Concentration: Pippette 0.400 mL 100 ppm Antiox Extract into test tube Pippette 1.600 mL dH
2O into test tube
Add 10.0 mL FCR Reagent (1:10 dilution)
Read Absorbance at 760 nm against Control
Pipette 1 mL MeOH into screw-cap test tube
Low Concentration: Pippette 0.1500 mL 100 ppm Antiox Extract into test tube Pippette 0.250 mL MeOH in test tube Pippette 1.600 mL dH
2O into test tube
Incubate 5 min at RT
Vortex 20 sec
Add 8.0 mL 20% Na2CO
3 sol’n
Incubate 110 min in dark at room temperature

123
Figure A.2.2 FCR Standard Curve of Gallic Acid
Pipette 2.0 mL ofGallic Acid aliquots in screw cap test-
tubes
Pipettor and tips for 250, 500, 1000, 1500, etc.
Spectrophotometer cuvettes
0 mL
Bring volume to 2.0 mL with dH
2O solution
1.0 mL 2.0 mL 3.0 mL 5.0 mL 10.0 mL
Add 10 mL FCR reagent (1:10 Dilution) per tube Cap, vortex and set aside
Place tubes in dark cabinet for 5 min at room temperature; add 8.0
mL Na2CO
3, incubate 110 min
Read Absorbance at 760 nm against 0 mL GA
Construct a standard curve by plotting Absorbance vs. Concentration of GA as nmol / mL
0 mL
0.1 g Gallic Acid in 9.9 mL MeOH : 190 mL dH
2O
1.0 mL 2.0 mL 3.0 mL 5.0 mL 10.0 mL

124
Table A.2.1 Gallic Acid Standard Curve
Figure A.2.3 Gallic Acid Standard Curve
y = 0.0091x + 0.0904 R² = 0.9996
0
0.1
0.2
0.3
0.4
0.5
0.6
0.7
0.8
0.9
1
0 20 40 60 80 100
Ab
sorb
an
ce a
t 7
60
nm
mg Gallic Acid / L solvent
Gallic Acid Standard Curve for Folin-Ciocalteau
Gallic Acid
(mg / L MeOH) Absorbance (A760)
0 0.0812 0.0803 0.0811
1 0.1821 0.1771 0.1843
2 0.2799 0.2741 0.2706
3 0.3748 0.3700 0.3751
5 0.5534 0.5448 0.5406
10 1.0136 0.9814 0.9922

125
Figure A.2.4 Ferricyanide Reducing Antioxidant Power
Pipette 1.0 mL 100 ppm Antioxidant extract using
micropippetor mL into 3 screw-cap test tubes
Medium Concentration: Pippette 0.100 mL Antiox Extract Pippette 0.900 mL MeOH
High Concentration: Pippette 0.200 mL Antiox Extract Pippette 0.800 mL MeOH
1. Add 2.5 mL Phosphate Buffer (0.2 M; pH 6.62)
2. Add 2.5 mL Ferricyanide (1%, HCl)
Read Absorbance at 700 nm against Control
Pipette 1 mL MeOH into screw-cap test tube
Low Concentration: Pippette 0.025 mL Antiox Extract Pippette 0.975 mL MeOH
1. Vortex 5 sec
2. Incubate 20 min, 50oC
3. Incubate 20 min , Room Temp
1. Vortex 5 sec 2. Centrifuge 10 min, 3000
RPM
Add 2.5 mL TCA (10%)
1. Aliquot 2.5 mL supernatant into new test tube
2. Add 2.5 mL dH2O
3. Add 0.5 mL FeCl3 (0.1%, HCl)
4. Vortex 5 sec

126
Figure A.2.5 Free Radical Scavenging by DPPH
Weigh 0.010 g Antioxidant into 100 mL volumetric flask
Invert 10 times Fill volumetric flask to line with MeOH
Pipette 1.0 mL Antioxidant extract using micropippetor mL
into 3 screw-cap test tubes
Medium Concentration: Pippette 0.075 mL Antiox Extract Pippette 0.9125 mL MeOH
High ConcentrationC: Pippette 0.0875 mL Antiox Extract Pippette 0.9125 mL MeOH
1. Transfer to Dark Room 2. Add 3.0 mL 50 μM DPPH
(in MeOH)
3. Cap. 4. Vortex for 4 sec.
Read Absorbance at 517 nm against 4 mL 50 μM DPPH (in MeOH)
Pipette 1 mL dH2O into
screw-cap test tube
Low Concentration: Pippette 0.0625 mL Antiox Extract Pippette 0.9375 mL MeOH

127
Figure A.2.6 DPPH Standard Curve of Ascorbic Acid
Pipette 100 ppm Ascorbic Acid aliquots in screw cap
test-tubes
Pipettor and tips for 250, 500, 1000, 1500, etc.
Spectrophotometer cuvettes
50 μM DPPH reagent in MeOH
5 mL pipette
0 mL
Bring volume to 1.0 mL with Methanol solution
0.025 mL
0.050 mL
0.075 mL
0.100 mL
0.150 mL
Add 3.0 mL DPPH reagent / tube Cap, vortex and set aside
Place tubes in dark cabinet for 20 min at room
temperature
Read Absorbance at 517 nm against 0 mL AA
Construct a standard curve by plotting Absorbance vs. Concentration of MDA as nmol /
mL
0 mL 0.025 mL
0.050 mL
0.075 mL
0.100 mL
0.150 mL

128
Table A.2.2 DPPH Standard Curve
Figure A.2.7 Ascorbic Acid Standard Curve for Free Radical Scavenging by DPPH
y = -0.0387x + 0.545 R² = 0.9976
0
0.1
0.2
0.3
0.4
0.5
0.6
0 5 10 15 20
Ab
sorb
an
ce a
t 5
17
nm
mg Ascorbic Acid / L Methanol
Ascorbic Acid
(mg / L MeOH) Absorbance (A517)
0 0.5387 0.5389 0.5388
2.5 0.4434 0.4522 0.4492
5 0.3616 0.3676 0.359
7.5 0.2637 0.2508
10 0.1551 0.1478 0.1485
15 0.0739 0.0697 0.0708
20 0.0687 0.0687 0.0661

129
Figure A.2.8 Conjugated-Dienes Extraction Procedure
Weigh 0.5 g Sample into Porcelean mortar
Grind sample in Mortar with pestle for ≈ 30 sec
Add 5 mL dH2O
Pipette 0.5 mL into 3 screw-cap test tubes using 1 mL pippetor
Sample B: Add 5 mL 3:1 Hex:Isoprop
Sample C: Add 10 mL 3:2 Hex:Isoprop
1. Cap. 2. Vortex for 1 min.
Centrifuge at 2000 X g for 5 mins. Extract hexane layer (hard to see)
Read Absorbance at 233 nm against dH
2O in
quartz cuvettes
Pipette 1 mL dH2O
into screw-cap test tube
Sample A: Add 5 mL 3:1 Hex:Isoprop

130
Figure A.2.9 TBARS Extraction Procedure
Weigh 5 g Sample into Porcelean mortar
Weigh 5 g Sample into Porcelean mortar
Lab
el: O
dd
Tru
e R
ead
ing
Lab
el: E
ven
F
alse
Po
siti
ve
SPIKED SAMPLE 1 mL BHT (0.2 mg / mL) 12 mL TEP (10 μM) 33.5 mL TCA / H
3PO
4
Grind sample in Mortar with TCA / H
3PO
4 for ≈ 30 sec
Add 1.0 mL BHT (0.2 mg / mL) 45.5 mL TCA / H
3PO
4
Filter (Whatman #1) in Erlenmeyer Flask
Pipette 5 mL into 4 screw-cap test tubes
Odd A: Add 5 mL dH
2O
Odd B: Add 5 mL TBA (0.02 M)
Even A: Add 5 mL dH
2O
Even B: Add 5 mL TBA (0.02 M)
1. Cover with Parafilm M. 2. Cap. 3. Invert 3 times to mix.
Store in dark incubator at room temperature for 15 – 20 hours (≈ 18 hrs)
Read Absorbance at 530 nm against dH
2O
(Abs Sample – Abs Blank)

131
Figure A.2.10 TBARS Standard Curve
Pipette 25 μM TEP aliquots in screw cap test-tubes
Pipettor and tips for 250, 500, 1000, 1500, etc.
TCA / H3PO
4: 10% (w/v)
TCA in 0.2 M H3PO
4
Spectrophotometer cuvettes
0.02 M TBA reagent in dH
2O
5 mL pipette
0 mL
Bring volume to 5 mL with TCA / H
3PO
4 solution
0.25 mL 0.5 mL 0.75 mL 1.0 mL 2.0 mL 1.5 mL 3.0 mL 2.5 mL
Add 5 mL TBA reagent / tube
Cap, mix and set aside
Place tubes in dark cabinet for 15-20 hours at room
temperature
Read Absorbance at 530 against 0 mL
Construct a standard curve by plotting Absorbance vs. Concentration of MDA as nmol / mL
0 mL 0.25 mL 0.5 mL 0.75 mL 1.0 mL 2.0 mL 1.5 mL 3.0 mL 2.5 mL

132
Table A.2.3 TBARs Standard Curve for Meat Patties
TEP (mL) MDA nmol / tube MDA nmol / mL Absorbance (A530)
Adjusted
0 0 0 0.0652
0.25 6.25 1.25 0.1549 0.0897
0.5 12.5 2.5 0.2449 0.1797
0.75 18.75 3.75 0.3303 0.2651
1.0 25 5 0.4218 0.3566
1.5 37.5 7.5 0.5895 0.5243
2.0 50 10 0.7645 0.6993
2.5 62.5 15 0.9254 0.8602
3.0 75 20 1.0788 1.0135
Figure A.2.11 Malondialdehyde Standard Curve for TBARS
y = 0.3396x + 0.0092 R² = 0.9995
0
0.2
0.4
0.6
0.8
1
1.2
0 0.5 1 1.5 2 2.5 3 3.5
Ab
sorb
an
ce (
53
0 n
m)
nmol malondiadehyde [MDA] / mL Solution

133
Table A.2.4 TBARs Standard Curve for Meat Patties in Water vs. TCA/H3PO4
TBARS Standard Curve
TEP (mL) MDA nmol / mL
Absorbance (530
nm)
Acid Water
0.00 0 0.0022 0.0102
0.25 1.25 0.0894 0.0853
0.50 2.5 0.1796 0.1616
0.75 3.75 0.2721 0.2395
1.00 5 0.393 0.3179
1.50 7.5 0.5457 0.4738
2.00 10 0.7528 0.6323
2.50 12.5 0.9069 0.7959
3.00 15 1.0852 0.962
Figure A.2.12 Solvatochromic shift for TBARs Standard Curve for Meat Patties using
Water vs. TCA/H3PO4
y = 0.0727x + 0.0052 R² = 0.9988
y = 0.0634x + 0.0039 R² = 0.9998
0
0.2
0.4
0.6
0.8
1
1.2
0 5 10 15 20
Ab
sorb
an
ce a
t 5
30
nm
MDA nmol / mL
TBARS Malondialdehyde Curve
25 μM with Acid
25 μM with Water
Linear (25 μM with Acid)
Linear (25 μM with Water)

134
A.3.1 Solutions for TBARS Test
Table A.3.1 TBARs Solutions to be prepared
# Solution ppm Frequency Storage Conditions
1 0.02 M TEP, mL 500 Weekly Overwrapped in Aluminum foil at 4oC
2 25 μM TEP, mL 100 For Curve
3 10 μM TEP, mL 100 Daily at 4oC
4 0.02 M TBA, mL 250 Daily at 4oC
5 BHT 0.2 mg/mL,
mL 100 Weekly Overwrapped in Aluminum foil at 4
oC
6 TCA / H3PO4, mL 2 1000 Weekly at 4oC
1. 0.02 M TEP – Stock solution Procedure
Weigh 2.27 g (in electronic balance) in a 100 mL beaker
Dissolve with deionized water (dH2O)
Pour the solution into a 500 mL glass volumetric flask
Bring the volume up to solution using dH2O
Table A.3.2 Preparation of 500 mL of 0.02 M TEP
Calculations to estimate the amount of TEP
TEP to be used : Malondialdehyde bis(diethyl acetate) 97%
Molecular weight: 220.31
g in 0.02moles: 220.31 × 0.02 = 4.41
Correction for 97%: 4.41 ÷ 0.97 = 4.54
g per 1000 mL: 4.54
g per 500 mL: 4.52 ÷ 2.00 = 2.27
2. 25 μM TEP Procedure
Measure 125 μL with a micropipetter in a 100 mL glass volumetric flask
Dissolve with d H2O
Bring volume up to solution using dH2O
Table A.3.3 Preparation of 100 mL of 25 μM TEP
Calculations to estimate the amount of TEP
TEP to be used : Malondialdehyde bis(diethyl acetate) 97%
Molecular weight: 220.31
Stock solution 0.02 M TEP
V × 20×103 μM: 25 μM × 100 mL
V, mL: (25 × 100) ÷ (20×103)
V, mL: 0.125

135
3. 10 μM TEP Procedure
Measure 50 μL with a micropipetter in a 100 mL glass volumetric flask
Dissolve with d H2O
Bring volume up to solution using dH2O
Table A.3.4 Preparation of 100 mL of 10 μM TEP
Calculations to estimate the amount of TEP
TEP to be used : Malondialdehyde bis(diethyl acetate) 97%
Molecular weight: 220.31
Stock solution 0.02 M TEP
V × 20×103 μM: 10 μM × 100 mL
V, mL: (10 × 100) ÷ (20×103)
V, mL: 0.05
4. 0.02 M TBA (Thiobarbituric Acid) – Procedure
Weigh 0.735 g (in electronic balance) in a 100 mL beaker
Dissolve with deionized water (dH2O)
Pour the solution into a 250 mL glass volumetric flask
Bring the volume up to solution using dH2O
Table A.3.5 Preparation of 250 mL of 0.02 M TBA
Calculations to estimate the amount of TBA
TBA to be used : Thiobarbituric Acid, minimum 98%
Molecular weight: 144.1
g in 0.02moles: 144.1 × 0.02 = 2.88
Correction for 98%: 2.88 ÷ 0.98 = 2.94
g per 250 mL: 2.94 ÷ 4.00 = 0.735
5. BHT 0.2 mg / mL Procedure
Weigh 20 mg (0.02 g in electronic balance) in a 100 mL beaker
Dissolve with deionized water (dH2O)
Pour the solution into a 100 mL glass volumetric flask
Bring the volume up to solution using dH2O
Table A.3.6 Preparation of 100 mL of 0.2 mg/mL BHT
Calculations to estimate the amount of BHT
Concentration Required: 0.2 mg per mL
Mg required per 100 mL: 100 × 0.2 20

136
6. TCA / H3PO4: 10% (w/v) TCA in 0.2 M H3PO4 Procedure
The order of the procedure is very important for safety reasons
Pour 700 mL dH2O into a 1000 mL glass beaker
Weigh 23.06 g of o-Phosphoric Acid (85%) in a 100 mL beaker
Place the two beakers into the hood
Pour the Phosphoric acid into the dH2O. WORK INSIDE THE HOOD.
Once the acid is dissolved, pour the acid solution into a 1000 mL glass volumetric
flask
Bring up to volume using dH2O
Weigh 1000 g of Trichloroacetic acid (TCA) in a 500 mL glass beaker
Place the 500 mL beaker with the TCA into the hood
Pour approximately 500 mL of the 0.2 M H3PO4into the 1000 mL glass beaker
Place part of the 100 g of TCA into the glass beaker with 0.2 M H3PO4
Mix until the TCA begins to dissolve
Continue until all the TCA has been dissolved
Pour the TCA / H3PO4 mixture into a 1000 mL glass volumetric flask
Bring the solution to volume using dH2O
Table A.3.7 Preparation of 1 L of 0.2 M TCA / H3PO4
Calculations to estimate the amount of Phosphoric acid
H3PO4to be used : o-Phosphoric Acid, 85%
Molecular weight: 98
g in 0.02moles: 98.00 × 0.02 = 19.6
Correction for 85%: 19.6 ÷ 0.85 = 23.06
g per 1000 mL: 32.1 ÷ 1.00 = 23.06
Amount of Fe in Myoglobin
0.29414 g / 25 g sample

137
Appendix B: Sensory Testing
Figure B.1.1 Canola Oil-Model System Scorecard
Odor Evaluation of Oil Patties
Sample # ________________________ Panelist (Initials)
____________
Oxidized
Fresh
Oxidized
Dairy
None Intense
Painty
None Intense
Oaty
None Intense
Green
None Intense
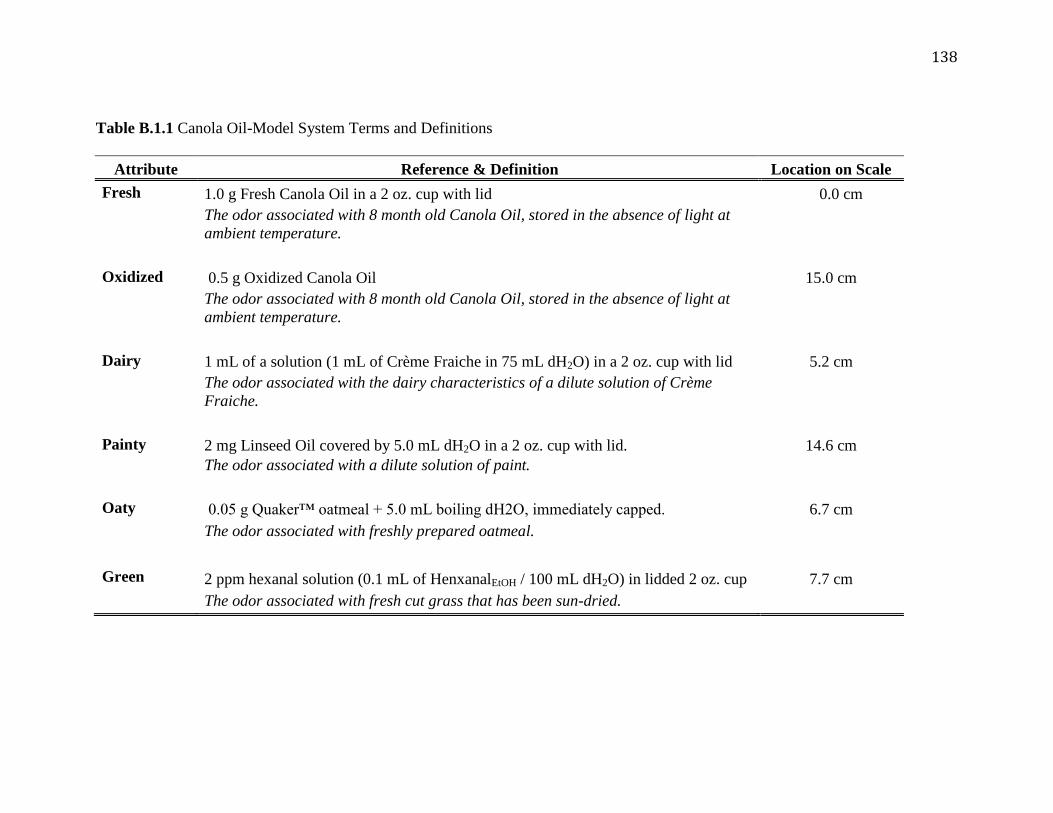
138
Table B.1.1 Canola Oil-Model System Terms and Definitions
Attribute Reference & Definition Location on Scale
Fresh 1.0 g Fresh Canola Oil in a 2 oz. cup with lid 0.0 cm
The odor associated with 8 month old Canola Oil, stored in the absence of light at
ambient temperature.
Oxidized 0.5 g Oxidized Canola Oil 15.0 cm
The odor associated with 8 month old Canola Oil, stored in the absence of light at
ambient temperature.
Dairy 1 mL of a solution (1 mL of Crème Fraiche in 75 mL dH2O) in a 2 oz. cup with lid 5.2 cm
The odor associated with the dairy characteristics of a dilute solution of Crème
Fraiche.
Painty 2 mg Linseed Oil covered by 5.0 mL dH2O in a 2 oz. cup with lid. 14.6 cm
The odor associated with a dilute solution of paint.
Oaty 0.05 g Quaker™ oatmeal + 5.0 mL boiling dH2O, immediately capped. 6.7 cm
The odor associated with freshly prepared oatmeal.
Green 2 ppm hexanal solution (0.1 mL of HenxanalEtOH / 100 mL dH2O) in lidded 2 oz. cup 7.7 cm
The odor associated with fresh cut grass that has been sun-dried.

139
Table B.2.2 Effects of Antioxidants on Odor Descriptors in Canola Oil-Gelled Model System
Variables Day 0 Day 1 Day 2 Day 4 Day 7 Day 9 SEM
Oxidized
Control 3.4 ghij
3.9 fg
3.2 hij
4.6 ef 11.6
a 10.3
b 0.5625
Pomegranate Extract 3.0 hij
3.1 hij
3.7 fgh
3.7 fgh
5.5 d 6.5
c
Grape Seed Extract 3.5
ghij 3.6
ghi 3.7
fgh 5.4
d 5.0
de 6.4
c
BHA 3.5
ghij 3.2
hij 3.7
fgh 5.4
d 4.2
f 5.2
d
Dairy
Control 3.1 h 3.2
h 2.6
ij 3.0
h 9.8
a 6.1
b 0.3381
Pomegranate Extract 2.6 ij 3.1
h 3.0
h 2.7
h 4.3
de 5.6
c
Grape Seed Extract 2.6
ij 2.3
j 2.5
i 3.0
h 4.0
ef 6.2
b
BHA 3.0
h 2.6
ij 3.1
h 3.7
fg 3.8
fg 4.4
d
Painty
Control 4.1 d 2.9
fgh 2.8
gh 2.9
fg 9.5
a 8.0
b 0.4530
Pomegranate Extract 3.1 fgh
2.6 hi 3.1
fgh 2.1
i 4.0
d 5.5
c
Grape Seed Extract 3.9
e 2.3
i 3.0
fgh 2.9
fg 2.6
hi 5.1
c
BHA 3.4
ef 2.1
i 3.1
fgh 3.2
fg 3.0
fgh 5.6
c
Oaty
Control 2.3 nop
3.0 ijkl
3.3 hijk
3.6 fgh
9.7 a 7.2
b 0.4709
Pomegranate Extract 2.0 p 2.8
jklmn 3.4
ghi 2.6
lmno 5.5
d 6.3
c
Grape Seed Extract 2.4
mnop 2.8
jklmn 3.9
fg 3.8
fgh 4.0
f 6.1
c
BHA 2.9
jklmn 2.8
jklmn 3.8
fgh 3.7
fgh 4.9
e 6.0
c
Green
Control 2.4 fg
2.3 gh
2.7 ef 2.1
ghi 8.5
a 6.7
b 0.3094
Pomegranate Extract 1.9 ij 2.7
ef 2.2
ghi 1.7
j 4.1
d 5.2
c
Grape Seed Extract 2.1
ghi 2.0
hij 2.9
e 2.0
hij 2.7
ef 5.3
c
BHA 2.4
fg 2.2
ghi 2.3
gh 2.2
ghi 2.4
fg 5.2
c

140
Figure B.2.1 0.5%-Salt Raw Beef Patty Scorecard
Odor Evaluation of Beef Patties Sample # ________________________ Panelist (Initials)
____________
Raw Beef
None Intense
Sweet
None Intense
Wet Cardboard
None Intense
Rancid
None Intense
Sulfery
None Intense

141
Figure B.2.2 0.5%-Salt Cooked Beef Patty Scorecard
Odor Evaluation of Beef Patties Sample # ________________________ Panelist (Initials)
____________
Cooked Beef
None Intense
Sweet
None Intense
Wet Cardboard
None Intense
Rancid
None Intense
Sulfery
None Intense

142
Table B.2.1 0.5%-salt Beef Patty Model System Terms and Definitions
Attribute Reference & Definition Location on Scale
Raw Beef 0.5 g Frozen, raw beef warmed to 40oC 6.4 cm
The odor associated with fresh ground beef.
Cooked Beef 0.5g of fresh beef cooked for 4 min 30 sec, placed in a 2 oz. cup with lid 6.6 cm
The odor associated with freshly cooked beef patties.
Sweet
1 mL of a solution (1.0 g of Hershey’s ™ Carmel in 10 mL dH2O) in a 2 oz. cup with
lid 6.6 cm
The odor associated with caramelized sugar.
Wet Cardboard 0.5 cm2 piece of cardboard wetted with 1 drop of dH2O in a Nalgene squeeze bottle. 9.2 cm
The odor associated with wet cardboard.
Rancid 0.5 g of lard heated to 80oC in a 2 oz. cup with lid 7.5 cm
The odor associated with the lard.
Sulfury 0.25 g of the yolk from a hard-boiled egg. 11.0 cm
The odor associated with the cooked yolk of an egg.

143
Table B.2.2 Effects of Antioxidants on Odor Descriptors over Time in 0.5%-Salt, Non-Irradiated Raw Beef Patties
Variables Day 0 Day 2 Day 4 Day 7 Day 9 SEM
Raw Beef
Control 5.7 a 3.3
b 2.8
b 5.0
a 2.1
c 0.3975
Pomegranate Extract 5.1 a 4.2
b 3.6
c 4.2
b 4.4
b
Grape Seed Extract 4.8
a 3.2
c 4.2
ab 4.1
b c 3.1
c
BHA 4.3
a 3.8
bc 4.1
ab 3.3
c 3.5
c
Sweet
Control 3.3 a a
2.6 b a
3.5 a a
3.2 a ab
3.2 a ab
0.4521
Pomegranate Extract 2.3 b bc
2.6 b a
3.5 a a
3.8 a a
1.4 c c
Grape Seed Extract 2.5
a b 2.7
a a 3.1
a a 2.5
a b 2.5
a b
BHA 1.6
b c 2.8
a a
2.9 a
a
3.2 a ab
3.4 a a
Wet
Cardboard
Control 1.7 c a
3.3 b a
2.8 b ab
4.2 a a
2.9 b a
0.2684
Pomegranate Extract 1.0 c b
1.0 c b
2.3 b b
3.4 a b
2.3 b b
Grape Seed Extract 1.2
c ab 3.0
b b 2.8
b ab 3.8
a ab 3.3
ab a
BHA 0.7
c b 1.1
c b 3.3
b a 4.4
a a 3.2
b a
Rancid
Control 2.1 d 3.4
c 3.7
bc 4.5
a 4.1
ab 0.4012
Pomegranate Extract 1.3 d 2.7
bc 2.2
c 4.4
a 2.9
b
Grape Seed Extract 1.5
c 2.1
b 3.3
a. 3.3
a 3.4
a
BHA 0.9
c 2.2
b 3.8
a 4.0
a 4.1
a
Sulfury
Control 1.1 2.2 1.8 2.1 2.2 0.3726
Pomegranate Extract 1.6 2.3 1.8 2.1 2.2
Grape Seed Extract 1.6 1.6 1.7 1.8 1.8
BHA 1.5 1.5 2.1 1.9 2.0

144
Table B.2.3 Effects of Antioxidants on Odor Descriptors over Time in 0.5%-Salt, Irradiated Raw Beef Patties
Variables Day 0 Day 2 Day 4 Day 7 Day 9 SEM
Raw Beef
Control 4.2 a 4.4
a 4.0
a 4.0
a 2.7
b 0.3975
Pomegranate Extract 5.0 a 3.5
c 3.8
bc 4.4
ab 3.3
c
Grape Seed Extract 5.1
a 4.2
b 3.6
bc 4.4
b 3.5
c
BHA 4.7
ab 4.1
b 4.7
ab 4.8
a 2.9
c
Sweet
Control 1.3 b a
2.2 a a
2.0 a b
2.2 a b
1.4 b ab
0.4521
Pomegranate Extract 1.0 c a
2.1 a ab
1.7 ab b
2.0 a b
1.2 bc b
Grape Seed Extract 1.6
b a 1.4
b b 3.0
a a 3.2
a a 1.6
b ab
BHA 0.9
c a 1.9
b ab
1.7 b
b
3.0 a a
2.0 b a
Wet
Cardboard
Control 3.1 c a
2.9 c a
4.6 a a
3.8 b a
3.7 b ab
0.2684
Pomegranate Extract 2.8 c a
3.0 c a
3.7 b b
3.7 b a
4.4 a a
Grape Seed Extract 2.6
b a 3.0
ab a 3.2
ab b 2.9
b b 3.5
a b
BHA 2.9 c a
2.7 c a
3.5 b b
3.2 bc
ab 4.1
a ab
Rancid
Control 3.7 a 2.4
b 3.6
a 3.8
a 4.0
a 0.4012
Pomegranate Extract 2.3 c 2.8
c 3.5
b 3.6
b 4.7
a
Grape Seed Extract 2.7
c 2.6
c 3.9
b 4.6
a 3.4
b
BHA 2.7
c 2.8
c 2.9
bc 3.3
b 4.3
a
Sulfury
Control 2.6 1.1 1.7 1.3 1.4 0.3726
Pomegranate Extract 1.4 1.8 1.5 1.8 0.8
Grape Seed Extract 2.1 1.0 2.3 2.2 1.8
BHA 1.6 1.5 1.8 1.7 1.9

145
Table B.2.4 Effects of Antioxidants on Odor Descriptors over Time in 0.5%-Salt, Non-Irradiated Cooked Beef Patties
Variables Day 0 Day 2 Day 4 Day 7 Day 9 SEM
Cooked Beef
Control 7.4 7.9 6.9 7.1 6.8 0.4108
Pomegranate Extract 7.3 7.5 7.6 7.3 8.1
Grape Seed Extract 8.1 7.1 7.7 6.5 6.9
BHA 9.1 8.2 8.6 7.2 7.0
Sweet
Control 1.5 1.6 1.3 1.3 1.4 0.1147
Pomegranate Extract 1.0 1.3 1.5 1.0 1.5
Grape Seed Extract 1.6 1.3 0.7 1.7 1.0
BHA 1.2 0.8 0.8 1.5 1.1
Wet
Cardboard
Control 1.1 b 1.5
b 1.6
b 2.4
a 2.3
a 0.1988
Pomegranate Extract 1.6 c 2.7
a 1.5
c 2.2
b 1.9
bc
Grape Seed Extract 1.7
c 1.2
d 2.2
b 2.9
a 1.8
bc
BHA 1.2
d c 1.7
b 1.8
b 2.8
a 2.1
b
Rancid
Control 2.3 a 1.5
b 1.8
b 2.7
a 2.4
a 0.3634
Pomegranate Extract 1.7 c 2.4
b 1.7
c 3.0
a 2.7
ab
Grape Seed Extract 1.8
b 1.8
b 2.0
b 3.6
a 3.1
a
BHA 1.5
c 2.2
ab 1.8
bc 2.2
ab 2.5
a
Sulfury
Control 2.8 3.0 6.6 2.8 1.9 0.7258
Pomegranate Extract 2.5 3.6 2.3 3.4 2.8
Grape Seed Extract 2.9 2.4 2.9 3.8 3.2
BHA 3.3 3.4 3.5 3.2 2.4

146
Table B.2.5 Effects of Antioxidants on Odor Descriptors over Time in 0.5%-Salt, Irradiated Cooked Beef Patties
Variables Day 0 Day 2 Day 4 Day 7 Day 9 SEM
Cooked Beef
Control 7.5 8.1 8.5 7.1 7.1 0.4108
Pomegranate Extract 8.2 7.0 8.9 7.4 8.1
Grape Seed Extract 8.1 7.8 7.4 7.9 8.5
BHA 8.8 7.1 8.1 7.8 7.1
Sweet
Control 0.9 1.1 1.1 1.1 1.6 0.1147
Pomegranate Extract 1.1 1.1 0.9 1.2 1.3
Grape Seed Extract 1.0 1.6 1.2 1.4 1.6
BHA 0.7 0.9 0.9 1.5 1.1
Wet
Cardboard
Control 1.7 b 1.8
b 2.4
a 2.5
a 2.5
a 0.1988
Pomegranate Extract 1.3 c 1.3
c 1.8
b 3.0
a 3.1
a
Grape Seed Extract 1.0
c 2.6
a 1.7
b 2.8
a 1.5
d
BHA 1.4
c 2.1
b 2.5
ab 2.9
a 1.5
c
Rancid
Control 2.0 c 2.0
c 2.5
ab 2.8
a 2.2
bc 0.3634
Pomegranate Extract 1.8 c 2.6
b 1.9
c 3.2
a 2.7
ab
Grape Seed Extract 1.9
c 2.5
b 1.9
c 3.0
a 1.9
c
BHA 1.4
c 2.3
ab 2.2
b 2.7
a 2.1
b
Sulfury
Control 3.5 2.5 2.7 2.5 2.4 0.7258
Pomegranate Extract 2.7 2.0 2.5 2.8 3.0
Grape Seed Extract 3.7 2.9 2.2 2.5 3.0
BHA 3.5 2.8 2.3 2.8 2.2

147
Appendix C: Spectrocolorimetric Data
Table C.1.1 Effects of Antioxidants Over Time on L*, a* and b* values for 0.5%-Salt, Non-Irradiated Beef Patties
Variables
Antioxidants
SEM Control
Pomegranate
Extract
Grape Seed
Extract BHA
L*
Day 0 47.1 Θ
47.1 Θ
44. 2 Ω
46.8 Θ
Antioxidant*Storage
Day 2 49.5 ΔΕΖΗ
47.6 ΗΘ
48.2 ΖΗΘ
48.2 ΗΘ
5.4152
Day 4 51.6 αβΔ
46.7 Θ
50.4 βΔΕΖ
53.0 α
Day 7 48.9 ΕΖΗΘ
47.8 ΗΘ
48.0 ΗΘ
50.7 βΔΕ
Day 9 51.9
αβ 52.6
αβ 50.9
αβΔΕ 50.7
βΔΕ
a*
Day 0 11.2 a a
11.5 a a
8.8 a b
9.4 a b
Antioxidant Storage
Day 2 8.7 b a
8.6 b a
7.1 b b
8.4 b a
0.5384 0.4268
Day 4 6.2 c b
7.8 c a
7.2 b a
6.4 c b
Day 7 4.1
d b 5.5
d a 4.6
c b 4.6
d b
Day 9 4.3 d b
4.5 e ab
5.1 c a
5.1 d a
b*
Day 0 12.0 αβ
9.5 ΘΙ
7.9 Ω
8.6 ΙΩ
Antioxidant*Storage
Day 2 10.6 ΕΖΗ
11.2 αβΔΖ
10.2 ΖΗΘ
11.3 αβΔΕ
1.2906
Day 4 10.9 ΔΕΖ
9.6 ΗΘΙ
11.0 βΔΕΖ
11.0 βΔΕΖ
Day 7 11.3
αβΔΕ 12.1
α 11.8
αβΔ 12.2
α
Day 9 11.3 αβΔΕ
11.9 αβΔ
11.0 βΔΕ
11. 5 αβΔΕ

148
Table C.1.2 Effects of Antioxidants Over Time on Hue Angle and Chroma for 0.5%-Salt, Non-Irradiated Beef Patties
Variables
Antioxidants
SEM Control
Pomegranate
Extract
Grape Seed
Extract BHA
Hue Angle
Day 0 33.5 e b
35.3 e a
33.7 e b
34.7 d ab
Antioxidant Storage
Day 2 47.3 d a
40.5 d b
46.5 d a
39.0 c c
1.2412 0.9813
Day 4 66.9 c a
54.6 c c
60.0 c b
67.5 b a
Day 7 69.7 b a
68.3 b b
68.5 b ab
69.4 a ab
Day 9 70.3 a ab
71.7 a a
69.7 a b
69.5 a b
Chroma
Day 0 16.5 a a
15.0 a b
11.9 d d
12.7 b c
Antioxidant Storage
Day 2 13.8 b a
14.5 a a
12.6 bc b
14.4 a a
0.4528 0.3589
Day 4 12.7 c b
12.5 c b
13.2 a a
13.0 b ab
Day 7 12.0
d b 13.3
b a 12.7
ab ab 13.1
b a
Day 9 12.1
d a 12.7
bc a 12.1
cd a 12.6
b a

149
Table C.1.3 Effects and Interactions of Antioxidants on Storage Color Attributes of
0.5%-Salt, Non-Irradiated Beef Patties
Variable p-value
L*
Antioxidant <0.0001
Storage 0.0042
Antioxidant * Storage 0.0106
a*
Antioxidant 0.9605
Storage < 0.0001
Antioxidant * Storage 0.2732
b*
Antioxidant 0.0664
Storage < 0.0001
Antioxidant * Storage 0.0348
Hue Angle
Antioxidant 0.4363
Storage < 0.0001
Antioxidant * Storage 0.1595
Chroma
Antioxidant 0.9037
Storage < 0.0001
Antioxidant * Storage 0.3360

150
Table C.2.1 Effects of Antioxidants Over Time on L*, a* and b* values for 0.5%-Salt, Irradiated Beef Patties
Variables
Antioxidants
SEM Control
Pomegranate
Extract
Grape Seed
Extract BHA
L*
Day 0 47.1 d a
47.1 cd a
44.2 d b
46.8 d a
Antioxidant*Storage
Day 2 49.5 b a
47.6 bc b
48.2 c b
48.2 c b
6.1790
Day 4 51.6 a b
46.7 d d
50.4 a c
53.0 a a
Day 7 48.9
c b 47.8
b c 48.9
b b 50.7
b a
Day 9 51.9
a b 52.6
a a 50.9
a c 50.7
b c
a*
Day 0 11.2 a a
11.5 a a
8.8 a b
9.4 a b
Antioxidant Storage
Day 2 8.7 b a
8.6 b a
7.1 b b
8.4 b a
0.5384 0.4256
Day 4 6.2 c b
7.8 c a
7.1 b a
6.4 c b
Day 7 4.1
d b 5.5
d a 4.6
c b 4.6
e b
Day 9 4.3
d b 4.5
e b 5.0
c a 5.1
d a
b*
Day 0 12.0 a a
9.5 c b
7.9 d d
8.6 d c
Antioxidant*Storage
Day 2 10.6 c b
11.2 b a
10.2 c b
11.3 bc a
0.7674
Day 4 10.9 bc a
9.6 c b
11.0 b a
11.0 c a
Day 7 11.3
b b 12.1
a a 11.8
a a 12.2
a a
Day 9 11.3
b bc 11.9
a a 11.0
b c 11.5
b ab

151
Table C.2.2 Effects of Antioxidants Over Time on Hue Angle and Chroma for 0.5%-Salt, Irradiated Beef Patties
Variables
Antioxidants
SEM Control
Pomegranate
Extract
Grape Seed
Extract BHA
Hue Angle
Day 0 43.8 e a
37.0 e d
39.7 d c
40.3 e b
Antioxidant Storage
Day 2 47.7 d c
50.3 d b
53.3 c a
50.7 d b
1.2412 0.9813
Day 4 56.9 c a
48.6 c c
53.3 c b
56.0 c a
Day 7 65.7 a a 61.3
b c 64.3
a b 64.9
a ab
Day 9 64.5
b a 64.6
a a 61.2
b b 61.8
b b
Chroma
Day 0 16.48 a a
14.97 a b
11.86 c d
12.87 b c
Antioxidant*Storage
Day 2 13.76 b b
14.52 a a
12.6 bc c
14.35 a ab
1.4959
Day 4 12.74 c ab
12.53 c b
13.23 a a
12.96 b ab
Day 7 12.01
d b 13.32
b a 12.69
b a 13.06
b a
Day 9 12.07
d b 12.71
c a 12.14
c ab 12.58
b ab

152
Table C.2.3 Affects and Interactions of Antioxidants on Storage Color Attributes of
0.5%-Salt, Irradiated Beef Patties
Variable p-value
L*
Antioxidant 0.0272
Storage <0.0001
Antioxidant * Storage 0.0230
a*
Antioxidant 0.1758
Storage < 0.0001
Antioxidant * Storage 0.4787
b*
Antioxidant 0.0048
Storage < 0.0001
Antioxidant * Storage <0.0001
Hue Angle
Antioxidant 0.2909
Storage < 0.0001
Antioxidant * Storage 0.6717
Chroma
Antioxidant 0.0044
Storage < 0.0001
Antioxidant * Storage <0.0001

153
Table C.3.1 Effects of Antioxidants Over Time on L*, a* and b* values for 2%-Salt Beef Patties
Variables
Antioxidants
SEM Control
Pomegranate
Extract
Grape Seed
Extract
Dietary
Selenium BHA
L*
Day 0 50.1 a a
48.7 b abc
49.7 a bc
48.8 b d
49.2 b c
0.3320
Day 1 48.9 b c
48.3 b bcd
48.8 b d
50.8 a a
50.4 a a
Day 2 48.9 c c
48.8 c ab
50.8 a a
49.8 b c
50.5 a a
Day 4 49.7 a ab
48.2 c cd
48.6 bc
d 49.1
ab d 49.4
a bc
Day 7 49.4 bc bc
49.1 c ab
50.2 a b
50.4 a ab
49.8 ab b
Day 9 49.5 b bc
48.1 c d
49.4 b c
50.2 a bc
49.5 b bc
a*
Day 0 13.0 c a
13.3 bc a
13.8 ab a
13.8 ab a
13.9 a a
0.3347
Day 1 11.6 d b
12.3 c b
12.6 bc b
12.6 bc b
12.9 a b
Day 2 11.4 ab b
11.3 ab c
11.5 ab c
11.7 a c
11.1 b c
Day 4 7.6 d c
8.9 c d
11.1 a c
8.9 c d
9.6 b d
Day 7 4.7 c d
6.7 a e
6.4 a d
5.6 b e
6.9 a e
Day 9 2.7 d e
5.1 b f
4.4 c e
4.3 c f
6.6 a f
b*
Day 0 13.8 b a
13.8 b a
14.2 a a
14.2 a a
13.9 ab a
0.1624
Day 1 13.6 b a
13.8 ab a
14.1 a a
13.5 b b
13.7 b a
Day 2 13.6 a a
13.0 b b
12.8 b c
12.6 c c
12.6 c c
Day 4 13.1 b b
13.2 b b
13.6 a b
13.6 a b
13.3 ab b
Day 7 13.5 a ab
13.1 b b
13.4 ab b
13.3 ab b
13.3 ab b
Day 9 13.6 a a
13.1 bc b
12.9 cd c
12.7 d c
13.4 ab b

154
Table C.3.2 Effects of Antioxidants Over Time on Hue Angle and Chroma for 2%-Salt Beef Patties
Variables
Antioxidants
SEM Control
Pomegranate
Extract
Grape Seed
Extract
Dietary
Selenium BHA
Hue Angle
Day 0 43.8 e a
43.2 f ab
43.0 e abc
42.9 f bc
42.1 f c
1.0403
Day 1 46.7 d a
45.3 e b
45.2 d b
44.1 e c
43.7 e d
Day 2 47.7 d a
46.6 d b
45.4 d c
45.4 d c
46.1 d bc
Day 4 56.3 c a
52.9 c c
47.6 c e
53.4 c b
51.7 c d
Day 7 66 b a
59.6 b e
60.3 b c
63.4 b b
59.2 b d
Day 9 73.4 a a
65.2 a c
66.4 a b
66.9 a b
60 a d
Chroma
Day 0 18.95 a b
19.18 a b
19.77 a a
19.84 a a
19.63 a a
0.2711
Day 1 17.93 b c
18.5 b b
18.94 b a
18.49 b b
18.77 b ab
Day 2 17.9 b a
17.28 c b
17.24 c b
17.22 c b
16.90 c b
Day 4 15.26 c d
16.11 d c
17.55 c a
16.59 d b
16.68 c b
Day 7 14.36 d c
15.05 e ab
14.84 d ab
14.74 e bc
15.25 d a
Day 9 13.96 e c
14.44 f b
13.67 e c
13.61 f c
15.02 d a
For μαβ where α indicates a difference at P≤0.05 between rows and β indicates a difference at P≤0.05 between columns

155
Table C.3.3 Affects and Interactions of Antioxidants in Storage Color Attributes of 2%-
Salt Ground Beef Patties
Variable p-value
L*
Antioxidant 0.0355
Storage 0.5861
Antioxidant * Storage 0.9184
a*
Antioxidant 0.0053
Storage < 0.0001
Antioxidant * Storage 0.8048
b*
Antioxidant 0.6457
Storage < 0.0001
Antioxidant * Storage 0.5814
Hue Angle
Antioxidant 0.0036
Storage < 0.0001
Antioxidant * Storage 0.7850
Chroma
Antioxidant 0.1938
Storage < 0.0001
Antioxidant * Storage 0.6316

156
Appendix D: Spectrophotometric Data
Table D.1.1 Comparison of Antioxidant Assays on Various Natural Antioxidants
Antioxidant Folin-Ciocalteu Reagent
Ferricyanide Reducing
Power DPPH Scavenging ORAC
(Gallic Acid Equivalents) (μM Gallic Acid Equivalents) (Ascorbic Acid Equivalents) (Trolox Equivalence)
Concentration: 6.25 mg 10 mg 20 mg 2.75 mg 11 mg 22 mg 6.9 mg 8.25 mg 9.6 mg 10 mg
Pom. Extract 4.9 b 7.3
b 18.0
a 0.14
b 0.43
bc 0.87
c 7.7
b 8.5
b 9.7
b 49.1 ± 2.7
d
Grape Seed Extract 3.3 c 6.0
c 12.5
b 0.13
bc 0.37
cd 0.75
d 5.0
d 5.9
d 6.8
d 101.7 ± 13.6
b
Dietary Selenium 0.0 f 0.0
e 0.0
f 0.05
e 0.02
f 0.02
g 0.1
g 0.1
g 0.1
g 0.0 ± 0.0
f
BHA 2.7 d 4.6
d 10.6
d 0.10
c 0.34
d 0.68
e 4.6
e 4.8
e 5.4
e 171.3 ± 27.1
a
Gallic Acid 6.5 a 9.1
a 18.0
a 0.19
a 0.56
a 1.27
a 12.2
a 12.2
a 12.2
a 30.0 ± 3.8
c
Ascorbic Acid 3.3 c 4.9
cd 11.4
c 0.16
b 0.46
b 0.95
b 5.4
c 7.4
c 9.5
c 14.7 ± 4.2
e
d,l α-tocopherol 0.2 e 0.7
e 2.4
e 0.06
d 0.12
e 0.29
f 2.8
f 3.0
f 3.4
f N/A
SEM 0.112 0.681 0.736 0.015 0.031 0.057 0.017 0.028 0.015
Table D.1.2 Pearson Correlation Coefficients
Folin-Ciocalteu Reagent Reduction by Ferricyanide Scavenging by DPPH O2 Radical Abs. Cap.
Folin-Ciocalteu Reagent 1.00000 0.93582 0.92684 -0.40658
p < 0.0001 p < 0.0001 p < 0.0674
Reduction by
Ferricyanide
0.93582 1.00000
0.94004 -0.35669
p < 0.0001 p < 0.0001 p < 0.1125
Scavenging by DPPH 0.92684 0.94004
1.00000 -0.34404
p < 0.0001 p < 0.0001 p < 0.1267
O2 Radical Abs. Cap. -0.40658 -0.35669 -0.34404
1.00000 p < 0.0674 p < 0.1125 p < 0.1267

157
Table D.2.1 Effect of Natural Antioxidants on Diene Conjugation of Gelled Lard Model System at 30oC
Conjugated Dienes (mmol Conjugated Diene / kg Lard Model)
Storage Time
Antioxidant Day 0 Day 1 Day 2 Day 4 Day 7 Day 9
Control 3.71 cdef
3.55 def
3.74 cdef
4.96 bcde
5.64 bc
9.80 a
Pomegranate
Extract 3.51
def 3.22
ef 3.37
ef 5.58
bc 5.40
bcd 6.16
b
Grape Seed
Extract 3.29
ef 3.77
cdef 3.06
ef 4.73
bcde 4.68
bcde 4.82
bcde
Dietary Selenium 3.47 def
3.15 ef 3.49
def 4.61
bcdef 5.61
bc 9.25
a
Butylated
Hydroxyanisol 3.38
ef 3.669
cdef 3.35
ef 3.85
cdef 3.03
ef 2.67
f
P-value
SEM 3.1151
Antioxidant < 0.0001
Storage < 0.0001
Antioxidant *
Storage 0.0004

158
Table D.2.2 Effect of Natural Antioxidants on TBARS of Gelled Lard Model System at 30oC
TBARS (μg Malondialdehyde / g Lard Model)
Storage Time
Antioxidant Day 0 Day 1 Day 2 Day 4 Day 7 Day 9
Control 0.05 no
0.15 jklm
0.22 hijk
0.40 f 0.96
c 1.54
a
Pomegranate
Extract 0.09
lmno 0.16
jkl 0.24
hij 0.27
ghi 0.58
e 1.41
b
Grape Seed
Extract 0.06
mno 0.16
jkl 0.29
ghi 0.34
fgh 0.67
e 1.02
c
Dietary Selenium 0.06 mno
0.15 jklmn
0.23 ijk
0.35 fg
0.79 d 1.55
a
Butylated
Hydroxyanisol 0.03
o 0.07
lmno 0.11
lmno 0.14
klmn 0.24
hij 0.28
ghi
P-
value
SEM 0.0980
Antioxidant < 0.0001
Storage < 0.0001
Antiox. *
Storage < 0.0001

159
Table D.2.3 Effect of Natural Antioxidants on Diene Conjugation of Gelled Lard Model System at 30oC
Conjugated Dienes (mmol Conjugated Diene / kg Lard Model)
Storage Time
Antioxidant Day 0 Day 1 Day 2 Day 4 Day 7 Day 9
Control 3.71 defgh
3.55 efgh
3.74 defgh
4.96 bcde
5.64 bc
9.80 a
100
ppm
Pomegranate
Extract
3.51 efgh
3.22 efgh
3.37 efgh
5.58 bc
5.40 bcd
6.16 b
500
ppm 3.66
defgh 3.21
efgh 2.77
h 4.53
bcdefg 3.90
cdefgh 4.61
bcdefg
1000
ppm 3.14
fgh 3.32
efgh 3.44
efgh 4.84
bcdef 3.57
efgh 3.27
efgh
Butylated
Hydroxyanisol 3.38
efgh 3.66
defgh 3.35
efgh 3.85
cdefgh 3.03
gh 2.67
h
P-value
SEM 2.5712
Antioxidant < 0.0001
Storage < 0.0001
Antiox. * Storage < 0.0001

160
Table D.2.4 Effect of Natural Antioxidants on TBARS of Gelled Lard Model System
TBARS (μg Malondialdehyde / g Lard Model)
Storage Time
Antioxidant Day 0 Day 1 Day 2 Day 4 Day 7 Day 9
Control 0.05 nop
0.15 ijklm
0.22 ghij
0.40 f 0.96
c 1.54
a
100 ppm
Pomegranate
Extract
0.09 lmnop
0.16 ijklm
0.24 ghi
0.27 gh
0.58 e 1.41
b
500 ppm 0.03
op 0.09
lmnop 0.13
jklmno 0.20
ghik 0.50
e 0.81
d
1000 ppm 0.04
nop 0.10
klmnop 0.12
ijklmnop 0.15
ijklm 0.17
ijklm 0.18
hijkl
Butylated
Hydroxyanisol 0.03
p 0.07
mnop 0.11
klmnop 0.14
jklmn 0.24
ghi 0.28
g
P-value
SEM 0.0980
Antioxidant < 0.0001
Storage < 0.0001
Antiox. *
Storage < 0.0001

161
Table D.2.5 Effect of Natural Antioxidants on Diene Conjugation of Canola Oil Model
System at 30 oC
Conjugated Dienes (mmol Conjugated Diene / kg Oil
Model)
Storage Time
Antioxidant Day 0 Day 1 Day 2 Day 4 Day 7 Day 9
Control 1.35 ij 2.16
e 2.27
e 1.26
jk 1.78
gh 2.95
b
Pomegranate Extract 1.25 ijk
2.17 e 2.56
d 1.18
jk 2.03
ef 2.92
b
Grape Seed Extract 1.85 fg
2.24 e 2.20
e 1.12
jk 2.77
bcd 2.81
bc
Butylated
Hydroxyanisol 1.08
efk 2.74
bcd 3.24
a 1.54
hi 2.17
e 1.71
gh
P-value
SEM 0.2523
Antioxidant
0.5438
Storage
< 0.0001
Antioxidant * Storage 0.0024
Table D.2.6 Effect of Natural Antioxidants on TBARS of Canola Oil Model System at
30 oC
TBARS (μg Malondialdehyde / g Oil Model)
Storage Time
Antioxidant Day 0 Day 1 Day 2 Day 4 Day 7 Day 9
Control 0.04 jk 0.11
g h 0.16
d 0.19
bc 0.23
a 0.24
a
Pomegranate Extract 0.03 k 0.08
i 0.11
h 0.11
h 0.11
gh 0.18
c
Grape Seed Extract 0.05 j 0.05
j 0.08
i 0.13
efg 0.14
ef 0.20
b
Butylated
Hydroxyanisol 0.04
jk 0.08
i 0.09
i 0.13
fg .15
de 0.18
c
P-value
SEM 0.0136
Antioxidant
< 0.0001
Storage
< 0.0001
Antioxidant * Storage 0.0373

162
Table D.3.1 Effect of Natural Antioxidants on TBARS of 2%-Salt Ground Beef Patties
TBARS (μg Malondialdehyde / g Ground Beef Patty)
Storage Time SEM
Antioxidant Day 0 Day 1 Day 2 Day 4 Day 7 Day 9
Control 0.50 b 0.78
ab 0.76
ab 1.07
a a 1.07
a a 0.93
a a
0.0727
Pomegranate
Extract 0.45
b 0.59
ab 0.61
ab 0.77
a ab 0.68
ab bc 0.55
ab b
0.0727
Grape Seed
Extract 0.47
ab 0.53
ab 0.64
ab 0.69
a
b 0.54
a
c 0.37
b
b
0.0727
Dietary Selenium 0.49 b 0.70
ab 0.72
ab 0.85
a ab 0.82
a ab 0.65
ab ab
0.0727
Butylated
Hydroxyanisol 0.36 0.50 0.50 0.57
b 0.60
bc 0.42
b
0.0727
SEM 0.0796 0.0796 0.0796 0.0796 0.0796 0.0796
P-value
Antioxidant 0.0170
Storage 0.0238
Antiox. * Storage 0.1330


![Self'-Confidence and Sports Performance...Self-Efficacy Bandura's [1] theory of self-efficacy has been the most extensively used theory for investigating self-confidence in sport and](https://img.dokumen.tips/doc/110x75/60e935b2a7482b208c3593d4/self-confidence-and-sports-performance-self-efficacy-banduras-1-theory-of.jpg)