Embed Size (px)
Citation preview

The 83rd Annual Conference of the Agricultural Economics Society
Dublin
30th March to 1st April 2009
Investigating Thai Shopping Behaviour:
Wet-Markets, Supermarkets and Food Quality
Matthew Gorton1, Johannes Sauer2 and Pajaree Supatpongkul1
1 School of Agriculture, Food and Rural Development, Newcastle University, Newcastle upon
Tyne, NE1 7RU. UK [email protected]
2 University of Kent and Imperial College at Wye, Wye, Ashford, Kent. TN25 5AH. UK
Copyright 2009 by Gorton, Sauer and Supatpongkul. All rights reserved. Readers may make
verbatim copies of this document for non-commercial purposes by any means, provided that
this copyright notice appears on all such copies.
Abstract
An analysis of primary survey data on Thai shopping behavior seeks to understand the
relative satisfaction of consumers with wet markets and supermarkets and identify the factors
that affect frequency of visit to, and purchase behavior within, these retail outlets. This is used
as a basis for engaging in wider debates on the ‘supermarket revolution’ in Asia. On all
salient attributes affecting retail outlet choice, wet markets are perceived, in general, to be
inferior to supermarkets. However for fresh produce sales, wet markets retain an advantage.
Both socio-economic characteristics and retail outlet attributes are considered as determinants
of food shopping behavior. Bootstrapped bivariate ordered probit models identify that those
using wet markets more frequently are older and characterized by lower incomes and
educational achievement. Bootstrapped bivariate Tobit models reveal that those purchasing a
higher proportion of fresh produce from wet markets do so based on product quality and do
not regard wet markets as lacking cleanliness. Visit data are consistent with Reardon’s model
of supermarket diffusion.
Keywords and JEL Codes
Food choice, retail, Thailand. D12, L81, P46
2
I) Introduction
As in other parts of Southeast Asia (Reardon et al. 2003), Eastern Europe (Dries et al. 2004), and
Central and South America (Berdegué et al. 2007), Thailand has witnessed a ‘supermarket
revolution’ – the rapid development of typically foreign-owned, food retail chains. Within a little
over a decade, supermarkets have gone from being limited to sub-sections of department stores to
the main outlet for grocery sales in urban Thailand (Australian Department of Foreign Affairs and
Trade, 2002, cited in Cadilhon et al. 2006). This has occurred partially at the expense of traditional
wet markets (also referred to as fresh or street markets) and independent grocers. The supermarket
revolution has attracted much attention, principally from a business strategy perspective
(Mukoyama, 2005), focussing on debates about standardisation or adaptation of retail formats
across countries, or from a policy standpoint, concerned about the opportunities for small-scale
domestic producers and farmers within restructured supply chains (Reardon et al. 2003). While
these debates are important, it is essential that consumer perspectives are not ignored, particularly
when assessing the extent to which ‘the supermarket revolution’ is customer driven. As Neven et al.
(2006) remark - consumer retail studies for developing economies remain rare. This is despite the
fact that relative growth rates for supermarkets tend to be higher outside of North America and
Western Europe and that emerging markets have witnessed an unprecedented wave of Foreign
Direct Investment (FDI) in retailing (Dawson, 2001).
The paper addresses this gap in the literature by investigating consumer food shopping
behaviour in Thailand. Specifically, our objectives are to quantify the relative satisfaction of
consumers with wet markets and supermarkets and identify the factors that affect frequency of visit
to, and purchase behaviour within, the two main retail formats in Thailand, namely supermarkets
and traditional wet markets. In explaining behaviour the analysis considers both socio-economic
characteristics and retail format attributes. Previous studies that seek to model food choice in
developing countries tend to consider solely socio-economic characteristics as determinants. This
3
means that to date there is limited information on the role played by the characteristics of different
retail formats, so ‘it would be worthwhile studying the in-store characteristics that attract customers
to supermarkets, or avert them’ (D' Haese et al. 2008, p.613). This should generate a more refined
picture of the determinants of food shopping behaviour, contributing to a wider debate on the ‘retail
revolution’.
The paper draws on two literatures: the debate concerning the ‘supermarket revolution’ and
theories of consumers’ choice of retail outlets. These are presented in the next section. Section three
presents an overview of the evolution of the Thai retail sector since the mid-1990s. Section four
outlines the methodology employed, justifying the design of a consumer questionnaire and the
econometric models employed. The dataset is introduced in Section 5. Descriptive statistics of
survey results and the econometric analysis are evaluated in Section 6 and conclusions drawn in
Section 7.
II) Literature Review
Reardon and Berdegué (2006) define retail modernisation as the spread of supermarkets,
hypermarkets and convenience stores at the expense of traditional food outlets (markets,
independent stores and traders). Of the three modern retail formats, supermarkets, defined by
Humphrey (2007, p.440) as a ‘self-service store with trolleys and/or baskets and a checkout at the
exit’, are the most widespread. Reardon et al. (2007) argue that developing and transitional
economies have undergone a ‘supermarket revolution’ characterised by four main features. First, its
spread occurred in three established waves, and a fourth emerging wave. The first wave of
supermarket-sector “takeoff” took place in the early to mid 1990s in much of South America and
East Asia outside China, Central Europe and South Africa. This ‘take off’ was spectacular: the
average share of total food retail spending accounted for by supermarkets rose from roughly 10-20
per cent circa 1990 to 50-60 per cent by the early 2000s (Reardon and Berdegué 2002; Reardon et

4
al. 2003). Subsequent waves followed, covering Mexico and much of Southeast Asia, Central
America, and Southern-Central Europe.
Second, the speed of the supermarket revolution has accelerated, due to not only demand
side factors (urbanisation, rising incomes) but also a ‘tidal wave of FDI’ (Reardon et al. 2003,
p.1143) and a policy environment conducive to the internationalisation of retailing. This has pushed
the growth of supermarkets ahead of the advance of broad social trends (Reardon et al. 2007).
Third, the diffusion of supermarkets originates from capital cities / largest markets. Retail networks
then expand into intermediate cities and towns, followed by rural small towns. The target market
also expands from an initial focus on higher income groups, to the middle classes and then the
urban poor. This pattern of diffusion develops from retailers initially targeting the most lucrative
markets but as these become saturated, new opportunities for growth are sought which can be
combined with cost savings and reaping economies of scale. Fourth, a critical strategy for reducing
costs and improving quality is the modernisation of procurement systems. This typically involves
the ‘delocalisation’ of supply networks, investment in distribution centres and less reliance on
traditional wholesalers, and the greater use of private standards and contracting (Dries et al. 2004;
Reardon et al. 2003; Reardon et al. 2007). This is crtical for increasing the penetration of
supermarkets in fresh produce markets, where their market share tends to lag that in processed
goods.
Humphrey (2007), however, questions the extent of the supermarket revolution, arguing that
Reardon et al. (2007) and others underestimate the competitiveness of traditional retail formats. To
support this, Humphrey (2007) draws on data for Brasil and Argentina which suggest that the
penetration of supermarkets has stagnated, or in certain cases declined. Goldman et al. (1999) also
doubt the superiority of modern retail formats in an Asian context, drawing on consumer research
for Hong Kong. The latter authors argue that wet markets possess advantages in terms of costs and
distribution, which make them more attractive to consumers based on the price and freshness of

5
their products. Goldman et al. (1999) also argue that some Western scholars underestimate the role
played by wet markets in Asian culture and how they are best placed to meet a diet and culture built
on local foods and freshness.
Reardon et al. (2007) respond to these criticisms, arguing that Goldman et al.’s (1999)
analysis is based on data for the mid-1990s and precedes the ‘take off’ of modern retail formats in
East Asia. Since Goldman et al.’s (1999) analysis for Hong Kong, the share of total food
expenditure accounted for by wet markets has fallen from a peak of 65 per cent in 1994–1995, to 49
per cent in 1999–2000 (Ho, 2005). Pingali (2007) studied the evolution of Asian diets, concluding
that significant shifts have occurred since the early 1980s with a relative shift away from rice and
indigenous fruits and vegetables toward wheat and dairy based products, processed goods, fast food
and exotic fruits and vegetables. Some of these changes have been dramatic: for instance between
1981 and 2001 rice’s share of the average Thai diet fell from 60 per cent to 43 per cent. Pingali
(2007) labels this a ‘Westernisation’ of Asian diets, which is both conducive to, and reinforced by,
the spread of global supermarket chains.
Understanding consumers’ choice of retail outlets has attracted considerable academic
debate. This literature, which emerged principally from North America and Western Europe, rests
on the premise that choices depend on perceived or expected customer satisfaction. Customer
satisfaction regarding retail outlets has been modelled in a number of ways, with many building on
the multi-attribute attitudinal model developed by Bass and Talarzyk (1972). This assumes that
customers derive satisfaction to the extent that a store offers desired attributes:
∑=
=n
gihgighi BWA
1 [1]
Where Ahi is consumer i’s attitude score for retail outlet h, Wig is the importance weight assigned by
consumer i to attribute g, Bihg is consumer i’s belief as to the amount of attribute g offered by outlet

6
h and n is the number of relevant attributes in the selection of a given type of store (McGoldrick,
2002).
Empirical research has sought to identify relevant attributes. For instance, Arnold et al.
(1983) used shopping data to study food store choice in North America and Western Europe,
ascertaining that that the most significant aspects are location/convenience, lowest overall prices,
assortment/variety of merchandise, friendly/courteous service, fast check out, quality of products,
and store environment. Louviere and Faeth (1987), using conjoint analysis, identified four critical
attributes: price, quality, selection and convenience. For empirical testing, several researchers
(Davies and Brooks, 1989; Ness et al. 2002; Stoltman et al. 1991) use scales developed by
Lindquist (1974), who included items on merchandise, service, clientele, convenience, promotion,
atmosphere and post-transaction satisfaction. This assumes that store attributes are the main
determinants of retail outlet choice and, hence, shopping behaviour, although this has not been
commonly considered for developing countries (D'Haese et al. 2008). Studies for the latter group of
states have principally used socio-economic and demographic data as predictors of food purchasing
behaviour (Neven et al. 2006; Goldman et al. 2002).
The existing literature on retail attributes, however, presents a number of problems for
understanding shopping behaviour in Thailand. Notwithstanding some notable exceptions (Trappey,
1997), research instruments on the importance consumers place on particular retail attributes have
been overwhelmingly developed for, and empirically tested in, North America and Western Europe.
Given its Western origins, previous research focuses therefore on understanding consumers’ choice
between different types of ‘modern retail’ stores. In other market environments, however, this may
not be the critical decision made by consumers. For instance in Thailand, the main retail choice is
between supermarkets and wet markets. Moreover, scales and research instruments designed to
understand consumer decision making in Western markets may not incorporate the critical attributes
that underpin decisions elsewhere. For instance, cleanliness and food safety are neither included as

7
attributes in the scales of Lindquist (1974) nor in subsequent studies by Davies and Brooks (1989)
and Ness et al. (2002), but these have been suggested as important factors for declining use of wet
markets in Asia (Ho, 2005).
This suggests that for Thailand models should assume that consumers choose between two
retail formats, s denoting supermarkets and m wet markets. Let ν (s, i ,t ) be the expected utility that
arises if the ith consumer chooses retail format s in time t. The ith consumer will choose retail
format s if:
),,(),,( timtis νν > [2]
Where expected utility is a function of all relevant variables including store format attributes and
socioeconomic characteristics. In the simplest form, a dummy variable d(s, i ,t), may take the value
of 1 if the ith consumer chooses to shop at retail format s in time t and 0 if otherwise. The
econometric specification of retail format choice involves a probabilistic model, whereby the
likelihood of the ith consumer choosing format s in time t is given by:
[3]
Where Φ (.) is the cumulative distribution function (cdf) and V(s,i,t / m) is the deterministic
component of the difference in expected utility between formats s and m (Arnade et al. 2008).
Rather than a binary dependent variable, it is more realistic to assume, however, that in time period
t, consumers may use both formats s and m but differ in the frequency of visits and the percentage
of total spending on a product category accounted for by s and m.
III. The Thai Context
Prior to the mid-1990s, supermarkets were largely confined to department stores. These department
stores targeted higher income consumers and were restricted to the capital city, Bangkok, and its
suburbs. Within Bangkok, convenience stores were successfully introduced in the late 1980s, most
))/,,,((/1),,((Pr ,mtisVmtisdob ti
Φ==

8
notably 7-Eleven, which fitted with the rising job market participation of women and a consequent
reduction in time devoted to ‘household’ activities (Feeney et al. 1996). However, traditional wet
markets, characterised by minimal central control or organization and family ownership remained
the main food distribution channel (Trappey, 1997).
In 1994, two supermarket chains were established, ‘Lotus’, controlled by the Thai-based CP
Group, and ‘Big C’, controlled by the domestically owned Central Group. In 1996, Central Group
collaborated with the French retailer Carrefour to open a store in the latter’s name. The Central
Group also established a chain of ‘Tops’ supermarkets jointly with the Dutch multinational grocer
Royal Ahold. A host of other Thai retailers also sought to enter the supermarket business but these
were largely unsuccessful.
As a result of the Asian economic crisis in the late 1990s, Thai retailers, which had rapidly
expanded into supermarkets, funded by foreign loans, faced severe financial difficulties. A large
chunk of the supermarket sector was sold to foreign investors. Namely, Central sold their share in
Big C to the French Casino Group, their stake in Carrefour to the French company, and their
interest in Tops Supermarkets to Royal Ahold. At the same time, CP sold their majority
shareholding in Lotus to the British retailer Tesco.
During the early 2000s, foreign ownership thus became integral to the expansion of
supermarket groups. However in 2004, the Central Group bought out Royal Ahold’s interests in the
Tops supermarket chain as the Dutch company divested all its Asian interests. By 2007 the Central
group had approximately 59 per cent market share of the supermarket sector (GMID, 2008). The
second largest retailer by market share is the Ek-Chai Distribution System, the Thai subsidiary of
Tesco, which controls the “Talad Lotus” chain. Talad Lotus has a market share of approximately
8.6 per cent (GMID, 2008). For the supermarket sector as a whole, the number of outlets and selling
space are currently rising at annual rates of 8 and 9 per cent respectively (GMID, 2008).

9
The rise of super/hypermarkets has been partially at the expense of traditional street and wet
markets and independent grocery stores. For instance, the number of traditional grocery stores fell
from 283,009 in 2002 to 273,314 in 2003 (ACNielson data cited by USDA, 2004). Approximately
90 percent of urban Thai shoppers use supermarkets at least once a month (USDA, 2007). However
while squeezed, markets remain important: USDA (2004) report that 87 per cent of all Thai
consumers visited a wet market at least once a week and that the majority of food shoppers,
particularly those outside of Bangkok, continue to visit wet markets to buy fresh food. While
precise data are unavailable, USDA (2004) estimates that ‘modern retail’ which includes both
supermarkets and convenience stores, accounts for approximately 35 per cent of total Thai food
sales. However this average masks a considerable urban – rural divide and in Bangkok modern
retail is likely to predominate.
IV) Methodology
The lack of secondary data on the determinants of food shopping behaviour in Thailand justifies
primary data collection. Development of a survey instrument began with the verified scales of retail
outlet attributes as developed by Lindquist (1974) and refined by Davies and Brooks (1989) and
Ness et al. (2002). The applicability of these attributes for the Thai context and whether other
salient factors were missing was discussed in a focus group of Thai shoppers. This led to the
modification of the survey design to include ‘cleanliness of place’, ‘speed of service’, ‘food safety’
and ‘atmosphere’ as attributes. Other variables such as convenient location, low prices, assortment,
product quality and variety of products, identified in previous studies, were seen as salient in the
Thai context. A second focus group confirmed the appropriateness of the modifications.
The final version of questionnaire consists of three sections. The first part measures the use
of supermarkets and wet markets. Specifically, it includes questions on frequency of visits to
supermarkets and wet markets. Respondents were also asked about the average percentage of their

10
total spending on fresh fruit and vegetables [FFV], fresh meat, fresh fish, packaged goods and
beverages accounted for by wet markets, supermarkets and other outlets in a typical month. This
recognises that patterns of behaviour and motivations may vary across food product categories.
Section two considers retail attributes and the weighting attached to them by consumers.
First, respondents were asked to rate the importance of individual attributes (e.g. cleanliness of
place) in their decision for where to buy food on a five point Likert scale (1= not at all important,
5= most important). They then rated supermarkets and wet markets in their locality according to
how well they scored on each attribute. This again was based on a five point scale (1 = very poor, 5
= excellent). In accordance with [1], this captures both Wig and Bihg. Section 3 elicits socio-
economic and demographic information (location, gender, age, income band and highest level of
education achieved).
The econometric analysis is divided into two stages. As a first step, frequency of visits to
wet-markets and supermarkets are modelled respectively. Secondly, we evaluate the determinants
of proportionate spending in wet markets and supermarkets for selected product categories.
Bivariate ordered probit model
The first step is based on the estimation of a bivariate ordered probit model. This model
can be treated as an extension of a standard bivariate probit model where the number of categories
of the dependent variables is greater than two (see Kilkenny and Huffman, 2003; Sajaha, 2008).1 As
for the univariate ordered probability model, the bivariate model type can be derived from a latent
variable model (Sajaha, 2008). Assume that two latent variables y1* and y2
* are determined by:
* '
1 1 1 1i i iy x β ε= + [4]
* '
2 2 2 2i i iy x β ε= + [5]
1 The BIOPROBIT Stata module (version 2/4/2008) was utilised.

11
where β1 and β2 are vectors of unknown parameters, ε1 and ε2 are the error terms, and subscript i
denotes the individual observation. Further we assume that the explanatory variables in [4] and [5]
satisfy the conditions of exogeneity such that E(x1i, ε1i) = 0 and E(x2i, ε2i) = 0. y1 and y2 are
observed as categorical variables such that:
* *
1i 11 2i 21
* *
11 1i 12 21 2i 22
1 2
* *
1 1 1i 1 1 2i
1 if y 1 if y
2 if < y 2 if < y
. .
J if y K if y
i i
J K
c c
c c c cy y
c c− −
≤ ≤
≤ ≤ = =
≤ ≤
[6]
and where the unknown cutoffs satisfy: c11 < c12 < ... < c1,J-1 and c21 < c22 < ... < c2,K-1 and c10 = c20 =
-∞ and c1J = c2K = ∞. The probability that y1i = j and y2i = k is:
* *
1 2 1j-1 1 1 2k-1 2 2
* *
1 1 2 2
* *
1 1 1 2 2
Pr( , ) = Pr(c ,c )
= Pr( , )
- Pr( , )
-
i i i j i k
i j i k
i j i k
y j y k y c y c
y c y c
y c y c−
= = < ≤ < ≤
≤ ≤
≤ ≤* *
1 1 2 2 1
* *
1 1 1 2 2 1
Pr( , )
+ Pr( , )
i j i k
i j i k
y c y c
y c y c
−
− −
≤ ≤
≤ ≤
[7]
If the error terms follow a bivariate standard normal distribution with correlation ρ% the individual
contribution to the likelihood function may be expressed as:
' ' '
1 2 2 1 1 1 2 1 1 2 2
' ' '
2 1 1 1 1 2 1 1 2 2
' ' '
2 1 1 1 2 1 1 1 2 2
Pr( , ) = ( , ( ) , )
- ( , ( ) , )
- ( , ( )
i i j i k i i
j i k i i
j i k i i
y j y k c x c x x
c x c x x
c x c x x
β γ β β ζ ρ
β γ β β ζ ρ
β γ β β
−
−
= = Φ − − −
Φ − − −
Φ − − −
%
%
' ' '
2 1 1 1 2 1 1 1 2 2
, )
+ ( , ( ) , )j i k i ic x c x x
ζ ρ
β γ β β ζ ρ−Φ − − −
%
%
[8]
where 2Φ is the bivariate standard normal cumulative distribution function, 21/ 1 2ζ γρ γ= + + and
( )ρ ζ γ ρ= +% . The logarithmic likelihood of observation i is given by:
1 2 1 2
1 1
ln ( , ) ln Pr( , )J K
i i i i i
j k
L I y j y k y j y k= =
= = = = =∑∑ [9]

12
Assuming, lastly, that the observations are independent we can sum across all observations to obtain
the log likelihood for the entire sample of size N:
1 2 1 2
1 1 1
ln L= ( , ) ln Pr( , )N J K
i i i i
i j k
I y j y k y j y k= = =
= = = =∑∑∑ [10]
In the case of modelling step 1, the categorical dependent variables y1 and y2 equal the frequency of
visits to wet-markets and the frequency of visits to supermarkets respectively. These variables carry
the value ‘1’ for “everyday”, ‘2’ for “2-3 times a week”, ‘3’ for “once a week”, ‘4’ for “2-3 times a
month”, ‘5’ for “once a month”, and ‘6’ for “less than once a month”. The vectors of explanatory
variables x1 and x2 contain the following independent variables related to retail outlet attributes:
convenience of location, price of products, special offers, assortment, quality of service, speed of
service, product quality, variety of products, payment by card, atmosphere, cleanliness, food safety
as well as a cross variable for the combined effect of product quality and cleanliness. Further,
socioeconomic variables are included: a location dummy for the household residing in Bangkok,
gender, age, household income, and the level of education of the customer.
We check for the robustness of our models by applying a simple stochastic resampling
procedure based on bootstrapping techniques (see Efron 1979). This appears necessary as our cross-
sectional sample consists of a limited number of observations. If we suppose that ˆnΨ is an
estimator of the parameter vector nψ including all parameters obtained by estimating [4] and [5]
based on our original sample of 201 observations 1( ,..., )nX x x= , then we are able to approximate
the statistical properties of ˆnΨ by studying a sample of 1000 bootstrap estimators
ˆ ( ) , 1,...,n mc c CΨ = . These are obtained by resampling our 201 observations – with replacement –
from X and recomputing ˆnΨ by using each generated sample. Finally the sampling characteristics
of our vector of parameters are obtained from:
(1) (500)ˆ ˆ ˆ,...,m m
Ψ = Ψ Ψ [11]
13
As discussed extensively by Horowitz (2001) and Efron and Tibshirani (1993), the bias of the
bootstrap as an estimator of ˆnΨ , ˆ
n nnBψ = Ψ − Ψ%
% , is itself a feasible estimator of the bias of the
asymptotic estimator of the true population parameter nψ .2 This holds also for the standard
deviation of the bootstrapped empirical distribution, providing a natural estimator of the standard
error for each initial parameter estimate. By using a bias corrected bootstrap we aim to reduce the
likely small sample bias in the initial estimates.
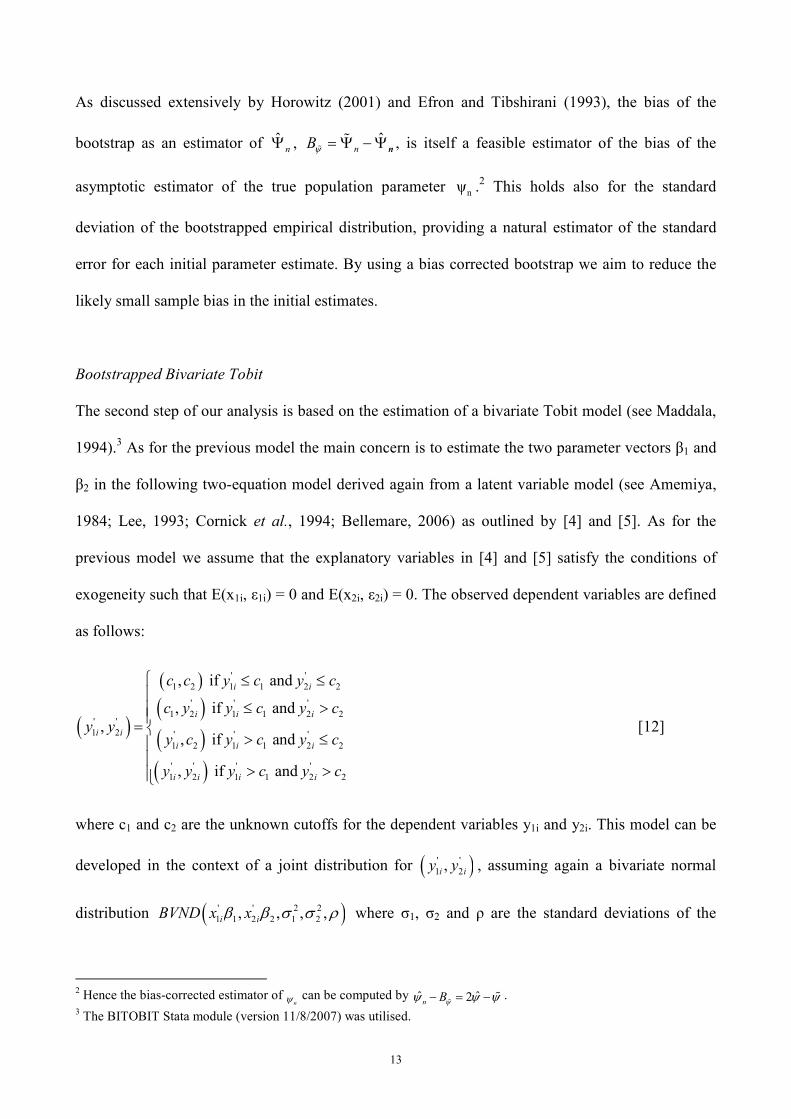
Bootstrapped Bivariate Tobit
The second step of our analysis is based on the estimation of a bivariate Tobit model (see Maddala,
1994).3 As for the previous model the main concern is to estimate the two parameter vectors β1 and
β2 in the following two-equation model derived again from a latent variable model (see Amemiya,
1984; Lee, 1993; Cornick et al., 1994; Bellemare, 2006) as outlined by [4] and [5]. As for the
previous model we assume that the explanatory variables in [4] and [5] satisfy the conditions of
exogeneity such that E(x1i, ε1i) = 0 and E(x2i, ε2i) = 0. The observed dependent variables are defined
as follows:
( )
( )( )( )( )
' '
1 2 1 1 2 2
' ' '
1 2 1 1 2 2' '
1 2 ' ' '
1 2 1 1 2 2
' ' ' '
1 2 1 1 2 2
, if and
, if and
,, if and
, if and
i i
i i i
i i
i i i
i i i i
c c y c y c
c y y c y c
y yy c y c y c
y y y c y c
≤ ≤
≤ >=
> ≤
> >
[12]
where c1 and c2 are the unknown cutoffs for the dependent variables y1i and y2i. This model can be
developed in the context of a joint distribution for ( )' '
1 2,i iy y , assuming again a bivariate normal
distribution ( )' ' 2 2
1 1 2 2 1 2, , , ,i iBVND x xβ β σ σ ρ where σ1, σ2 and ρ are the standard deviations of the
2 Hence the bias-corrected estimator of
nψ can be computed by ˆ ˆ2n Bψψ ψ ψ− = −%
% .
3 The BITOBIT Stata module (version 11/8/2007) was utilised.
14
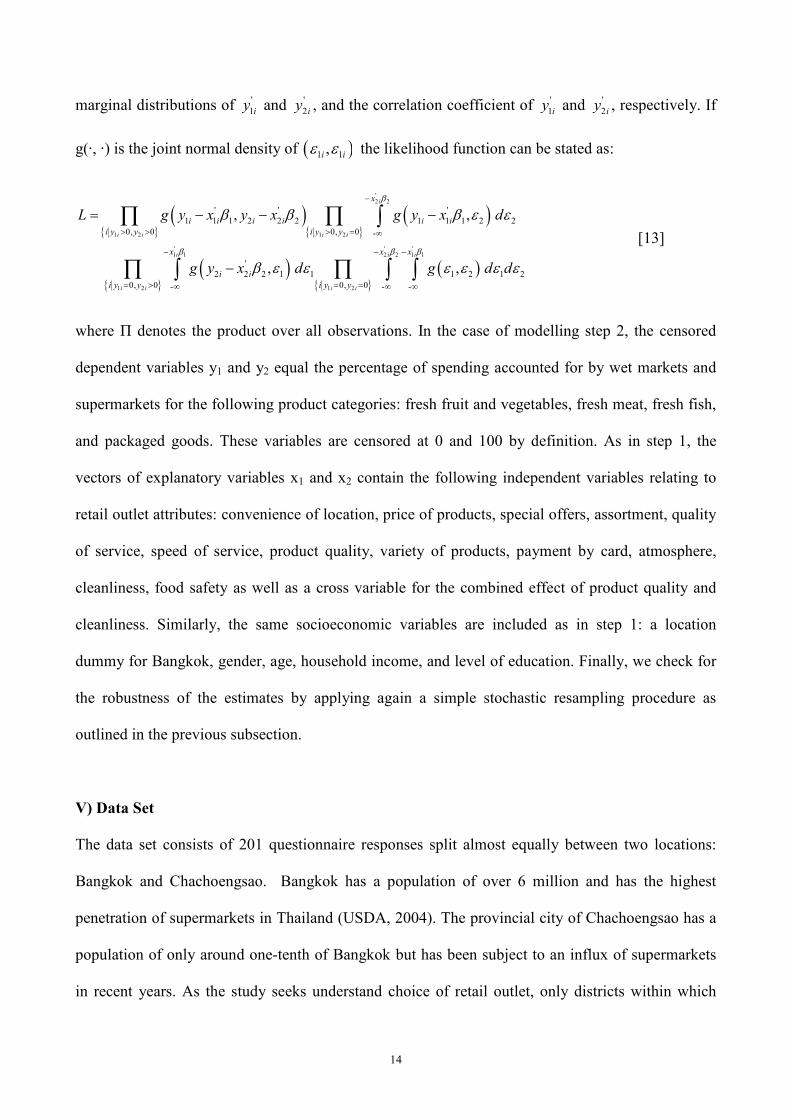
marginal distributions of '
1iy and '
2iy , and the correlation coefficient of '
1iy and '
2iy , respectively. If
g(·, ·) is the joint normal density of ( )1 1,i iε ε the likelihood function can be stated as:
( ){ }
( ){ }
( ){ }
( ){ }
'2 2
1 2 1 2
' ' '1 1 2 2 1 1
1 2 1 2
' ' '
1 1 1 2 2 2 1 1 1 2 2
0, 0 0, 0 -
'
2 2 2 1 1 1 2 1 2
0, 0 0, 0- - -
, ,
, ,
i
i i i i
i i i
i i i i
x
i i i i i i
i y y i y y
x x x
i i
i y y i y y
L g y x y x g y x d
g y x d g d d
β
β β β
β β β ε ε
β ε ε ε ε ε ε
−
> > > = ∞
− − −
= > = =∞ ∞ ∞
= − − −
−
∏ ∏ ∫
∏ ∏∫ ∫ ∫
[13]
where Π denotes the product over all observations. In the case of modelling step 2, the censored
dependent variables y1 and y2 equal the percentage of spending accounted for by wet markets and
supermarkets for the following product categories: fresh fruit and vegetables, fresh meat, fresh fish,
and packaged goods. These variables are censored at 0 and 100 by definition. As in step 1, the
vectors of explanatory variables x1 and x2 contain the following independent variables relating to
retail outlet attributes: convenience of location, price of products, special offers, assortment, quality
of service, speed of service, product quality, variety of products, payment by card, atmosphere,
cleanliness, food safety as well as a cross variable for the combined effect of product quality and
cleanliness. Similarly, the same socioeconomic variables are included as in step 1: a location
dummy for Bangkok, gender, age, household income, and level of education. Finally, we check for
the robustness of the estimates by applying again a simple stochastic resampling procedure as
outlined in the previous subsection.
V) Data Set
The data set consists of 201 questionnaire responses split almost equally between two locations:
Bangkok and Chachoengsao. Bangkok has a population of over 6 million and has the highest
penetration of supermarkets in Thailand (USDA, 2004). The provincial city of Chachoengsao has a
population of only around one-tenth of Bangkok but has been subject to an influx of supermarkets
in recent years. As the study seeks understand choice of retail outlet, only districts within which

15
both wet markets and supermarkets are located were included in the study. Quota sampling, based
on four age groups, was utilised. The size of the each age group quota matches Thailand’s
demographic profile. As the study was limited to those responsible for the majority of food
purchases in their household, approximately two-thirds of the sample is female. Data collection
occurred via face to face interviews in 2007.
VI) Analysis
Table 1 reports the average percentage spend in a typical month by type of retail outlet (wet market,
supermarket / hypermarket and other)4 for five food categories (fresh fruit and vegetables, fresh
meat, fresh meat, packaged goods and beverages). Important differences are apparent across the
food categories. For fresh produce (fruit and vegetables, meat and fish) wet markets continue to
account for the majority of spending. For packaged goods and beverages, supermarkets are more
important. This divide between fresh and ‘longer-life’ goods has been reported for other Asian
countries but the penetration of supermarkets into fresh market markets is greater than some
previous assessments (Goldman et al. 1999; Ho, 2005).
Table 2 details the average importance weighting given to retail outlet attributes in the
choice of where to buy food (1= not important, 5 = most important). Attributes are listed in
descending order of importance. The most important factors are quality of products, food safety,
variety of products, cleanliness of place and quality of service. Facilities to pay by card are of little
importance. The latter two columns of Table 2 report how well wet markets and supermarkets in
respondents’ local area score (1= very poor; 5 = very good) on each of these attributes. On all items,
supermarkets perform better. The greatest divide is apparent for food safety, cleanliness of place,
assortment and, albeit of little importance, payment by card. There is little difference in the ratings
attached to price of products. Data in Table 2, therefore, suggest that the switch to supermarkets has
4 The other category includes convenience stores.

16
been customer driven as they appear to offer a superior shopping experience. Most shoppers,
however, are dual format users, frequenting both supermarkets and wet markets. 53.4% visit a wet
market 2-3 times a week or more often. Visits to supermarkets are less common, with less than one–
quarter of respondents visiting 2-3 times a week or more frequently.
Regarding the econometric analysis, the different diagnosis tests performed indicate that all
estimated model specifications show a statistical significance at a satisfactory level and no severe
signs of misspecification (see different model quality measures). These conclusions are supported
by the bootstrapped bias-corrected standard errors which confirm the robustness of the various
estimates. The linear hypotheses tests conducted with respect to the significance of explanatory
variables indicate for all models the statistical relevance of the stated factors for retail outlet
attributes and socioeconomic characteristics.
Table 3 presents the bootstrapped bivariate ordered probit model for frequency of wet-
market and supermarket visits. Considering the determinants of wet market visits both retail outlet
attributes and socio-economic characteristics are important. Males are significantly less frequent
visitors to wet markets compared to females. Frequent wet market visits are also biased to older
consumers, those in lower income groups, with lower education achievement and located outside of
the capital city. Frequency of supermarket visits is negatively related to age and educational
attainment. Chachoengsao residents are significantly less frequent visitors to supermarkets. This
socio-economic profile is consistent with Reardon et al.’s (2007) theory of supermarket diffusion,
which suggests that traditional formats will lose first the custom of higher educated, younger and
affluent consumers in capital cities.
Regarding retail attributes, frequency of wet market visits is positively related to the
importance given to speed of service and product quality, and negatively related to atmosphere and
the interaction of quality and cleanliness. In other words, for instance, those that view speed of
service as more important in their choice of retail outlets are more frequent vistors to wet markets.

17
The frequency of supermarket visits is positively related to the importance given to a good
atmosphere, convenient location, assortment and range of offers. Frequency of supermarket visits is
negatively related to the importance placed on price.
An analysis for all products, however, may mask significant variations in the determinants
of format choice for specific product categories. This is accounted for in the second stage of the
analysis which identifies the determinants of variations in the percentage of total spending for four
product categories (FFV, fresh meat, fresh fish and packaged goods) accounted for by wet markets
and supermarkets. Regarding FFV (Table 4), those with a higher proportion of spending in wet
markets rate price and cleanliness of place as being of greater importance. Payment by card and
atmosphere are significantly less important for this group. The percentage spent on FFV in wet
markets is significantly higher in Chachoengsao. Gender, age, income and education are not
significant in explaining variations in the percentage of total FFV spend accounted for by wet
markets or supermarkets. There are positive relationships between supermarket spending on FFV
and speed of service and variety of products. This suggests that supermarket shoppers value more
highly the convenience of ‘a one stop shop’. Those relying on supermarkets for FFV are biased to
the capital city. Supermarket shoppers for FFV also rate food safety as being of greater importance.
Analysis of the bivariate Tobit model for percentage of total spending on fresh meat
accounted for by wet markets and supermarkets (Table 5) reveals negative relationships between
percentage spent in wet markets and the importance of speed of service, payment by card and
atmosphere. As for FFV, wet market shoppers are biased toward Chachoengsao. However, positive
relationships between wet market spending and the importance of product quality, cleanliness of
place, quality of service and the interaction of quality and cleanliness are observed. This suggests
that meat available in wet markets is still perceived to be fresher with customers having greater
control in selecting specific cuts. Those buying a greater proportion of fresh meat from
supermarkets rate price as being less important and have higher incomes. This suggests that those

18
relying on supermarkets for fresh meat are more affluent. They are also biased to the capital city.
Use of supermarkets for fresh meat, as with FFV, is positively associated with consumers who place
greater emphasis on food safety. This may reflect that quality assurance is seen as superior in
supermarkets.
The results of the bivariate Tobit model for the percentage of total spending on fresh fish
accounted for by wet markets and supermarkets are detailed in Table 6. Significant positive
relationships between percentage spent in wet markets and the importance of product quality,
cleanliness and the interaction of quality and cleanliness are revealed. These mirror the relationships
identified for fresh meat and suggest that with regard to freshness wet markets retain an advantage.
As in the case of FFV and meat, spending in wet markets for fresh fish is significantly higher in
Chachoengsao. Those relying on supermarkets for fresh fish are biased to Bangkok. Other
socioeconomic characteristics (age, gender, income and education) are not significant for explaining
variations in the percentage spent in wet markets and supermarkets for fresh fish. Supermarket
shoppers for fresh fish are less concerned about assortment but rate quality of service as being of
greater importance.
For packaged goods (Table 7), speed and quality of service are not significant for explaining
variations in the percentage spent at supermarkets and wet markets. Those relying on wet markets
for packaged goods rate convenient location and special offers as being of greater importance. As
with fresh produce, spending in wet markets is significantly higher in Chachoengsao. A positive
relationship between percentage spent in supermarkets and assortment is recorded, which suggests
that multiple retailers appeal most to those who value convenience and ‘one stop shopping’. Those
relying most on supermarkets for packaged goods are significantly younger and also rate food
safety as significantly more important.

19
VII) Conclusions
Data suggest that the growing market share of supermarkets in Thailand is customer driven, as,
overall, they offer a superior shopping experience. Considering all product categories, supermarkets
are perceived as superior by Thai shoppers on all salient attributes. However, significant variations
in the penetration of supermarkets between product categories persist. While wet markets retain an
advantage in sales of fresh produce, the market share of supermarkets in these product categories
has grown significantly when compared against studies for Asian markets in the 1990s.
In understanding shopping behaviour in developing economies, previous studies principally
consider socio-economic characteristics as determinants. Income, age, gender and education are
significant for explaining variations in the frequency of visits to wet markets and supermarkets. The
greater penetration of supermarkets in the capital city and their more frequent use by higher income,
better educated and younger consumers is also consistent with Reardon et al.’s (2007) model of
diffusion.
However, apart from location, socio-economic characteristics are poor predictors of the
variation in the percentage spent on fresh FFV accounted for by wet markets and supermarkets. In
understanding relative spending on fresh produce, differences in the importance attached to retail
outlet attributes are, however, significant. This vindicates the dual consideration of both socio-
economic characteristics and retail attributes. For FFV, meat and fish, wet markets attract most
custom from those that value food quality highly, which is principally perceived in terms of
freshness. The appeal of supermarkets rests on food safety, a good atmosphere and convenience.
The spread of supermarkets will, in part, therefore, depend on the extent to which they can close the
gap in perceived freshness of produce and the salience of the appeal of ‘one stop shopping’. The
latter is likely to be linked to working patterns, especially female participation in the job market.
Current trends regarding labour market participation and Asian diets are conducive to an on-going
steady erosion of the market share of wet markets.
20
References
Amemiya, T. 1974. “Tobit Models: A Survey.” Journal of Econometrics, 24: 3-61.
Arnade, C., Gopinath M. and Pick, D. 2008. “Brand Inertia in U.S. Household Cheese
Consumption.” American Journal of Agricultural Economics, 90:813-826.
Arnold, S.J., Oum, T.H. and Tigert, D.J. 1983. “Determinant attributes in retail patronage: seasonal,
temporal, regional, and international comparisons.” Journal of Marketing Research, 20(2):149-157.
Australian Department of Foreign Affairs and Trade. 2002 Subsistence to Supermarket II: Agrifood
Globalisation and Asia. Vol II: Changing Agrifood Distribution in Asia. Canberra: Department of
Foreign Affairs and Trade.
Bass, F.M. and Talarzyk, W.W. 1972. “An attitude model for the study of brand preference.”
Journal of Marketing Research, 9(1):93-96.
Bellemare, M. F. 2006. “An Ordered Tobit Model of Market Participation: Evidence from Kenya
and Ethiopia.” American Journal of Agricultural Economics, 88:234-337.
Berdegué, J.A., Reardon, T., Balsevich, F., Flores, L.G. and Hernández, R.A. 2007. “Supermarkets
and small horticultural product farmers in Central America.” In: J.F.M. Swinnen, (ed.), Global
Supply Chains, Standards and the Poor, Wallingford: CABI, 135-143.
Cadilhon J-J, Moustier P, Poole ND, Giac Tam, P.T. and Fearne, A.P. 2006. “Traditional vs.
modern food systems? Insights from vegetable supply chains to Ho Chi Minh City (Vietnam).”
Development Policy Review, 24(1):31-49.
Cornick, J., Cox, T.L. and Gould, B.W. 1994. “Fluid Milk Purchases: a Multivariate Tobit
Analysis.” American Journal of Agricultural Economics, 76:74-82.
Davies, G. and Brooks, J.M. 1989. Positioning Strategy in Retailing, London: Paul Chapman.
Dawson, J. 2001. “Strategy and Opportunism in European Retail Internationalization.” British
Journal of Management, 12(4):253-266.
D’Haese, M., Van den Berg, M. and Speelman, S. 2008. “A country-wide study of consumer choice
for an emerging supermarket sector: A case study of Nicaragua.” Development Policy Review,
26(5):603-615.
Dries, L., Reardon, T. and Swinnen, J. 2004. “The rapid rise of supermarkets in Central and Eastern
Europe: Implications for the agrifood sector and rural development.” Development Policy Review,
22 (5):525-556.
Efron, B. 1979. “Bootstrap Methods: Another Look at the Jackknife.” Annals of Statistics 7:1-26.
Efron, B. and Tibshirani R.J. 1993. An Introduction to the Bootstrap. London: Chapman & Hall.

21
Feeney, A., Vongpatanasin, T. and Soonsatham, A. 1996. “Retailing in Thailand.” International
Journal of Retail & Distribution Management, 24(8):38-44.
Goldman, A., Krider, R. and Ramaswami, S. 1999. “The persistent competitive advantage of
traditional food retailers in Asia: wet markets’ continued dominance in Hong Kong.” Journal of
Macromarketing, 19(2):126–139.
Goldman, A., Ramaswami, S. and Krider, R.E. 2002. ”Barriers to the advancement of modern food
retail formats: theory and measurement.” Journal of Retailing, 78:281–295.
Ho, S.C. 2005. “Evolution versus tradition in marketing systems: The Hong Kong food-retailing
experience.” Journal of Public Policy and Marketing, 24(1):90-99.
Horowitz, J.L. 2001. The Bootstrap. In: J. Heckman, and E. Leamer (eds.). Handbook of
Econometrics, Vol. 5, Amsterdam: North-Holland, pp.3159-3228.
Humphrey, J. 2007. “The Supermarket Revolution in Developing Countries: Tidal Wave or Tough
Competitive Struggle?” Journal of Economic Geography, 7:433-450.
Kilkenny, M. and Huffman, S.K. 2003. “Rural/Urban Welfare Program and Labor Force
Participation.” American Journal of Agricultural Economics, 85:914-927.
Lee, L.F. 1993. Multivariate Tobit models in Econometrics. In: G.S. Maddala, C.R. Rao and H.D.
Vinod (eds.). Handbook of Statistics, Vol.11, Amsterdam: North-Holland, pp.145-173.
Lindquist, J.D. 1974. “Meaning of image: a survey of empirical and hypothetical evidence.”
Journal of Retailing, 50(4):29-38.
Louviere, J. and Gaeth, G. 1987. “Decomposing the determinants of retail facility choice using the
method of hierarchical information integration: a supermarket illustration.” Journal of Retailing,
63(1): 25–48.
Maddala, G.S. 1994. Limited-Dependent and Qualitative Variables in Econometrics. New York:
Cambridge University Press.
McGoldrick, P. 2002. Retail Marketing, London: McGraw Hill, 2nd
edition.
Mukoyama, M. 2005. “The Characteristics of the New Retail Competition in Asia and the Research
Agenda.” Journal of Global Marketing, 18(1/2):187-198.
Ness, M., Gorton, M. and Kuznesof, S. 2002. “The student food shopper: segmentation on the basis
of attitudes to store features and shopping behaviour.” British Food Journal, 104(7):506-525.
Neven, D., Reardon, T., Chege, J. and Wang, H. 2006. “Supermarkets and consumers in Africa: The
case of Nairobi, Kenya.” Journal of International Food and Agribusiness Marketing, 18(1/2):103–
123.
Pingali, P. 2007. “Westernization of Asian diets and the transformation of food systems:
Implications for research and policy.” Food Policy, 32(3):281-298.

22
Reardon, T. and Berdegué, J.A. 2002. “The Rapid Rise of Supermarkets in Latin America:
Challenges and Opportunities for Development.” Development Policy Review, 20(4):317-34.
Reardon, T. and Berdegué, J.A., 2006. The Retail-led Transformation of Agrifood Systems and its
Implications for Development Policies, Rimisp-Latin American Center for Rural Development.
Reardon, T, Henson, S; Berdegue, J. 2007. “Proactive fast-tracking diffusion of supermarkets in
developing countries: implications for market institutions and trade.” Journal of Economic
Geography, 7(4):399-431.
Reardon, T., Timmer, C.P., Barrett, C.B. and Berdegue, J. 2003. “The Rise of Supermarkets in
Africa, Asia, and Latin America.” American Journal of Agricultural Economics, 85:1140-1146.
Sajaia, Z. 2008. “Maximum Likelihood Estimation of a Bivariate Ordered Probit Model:
Implementation and Monte Carlo Simulations.” The Stata Journal, forthcoming
Stoltman, J.J., Gentry, J.W. and Anglin, K.A. 1991. “Shopping choices – the case of the mall
choice.” Advances in Consumer Research, 18:434-40.
Trappey, C. and M. K. Lai 1997. “Differences in Factors Attracting Consumers to Taiwan's
Supermarkets and Traditional Wet Markets.” Journal of Family and Economic Issues, 18(2):211-
224.
USDA 2004. Thailand Retail Food Sector, GAIN Report No. TH4143.
USDA 2007. Thailand Exporter Guide Report, GAIN Report No.TH7152.

23
Table 1: Average percentage spent by type of retail outlet for different food product categories.
Wet market Supermarket Other
Fresh Fruit and Vegetables (FFV) 55.5 36.8 7.6
Fresh meat 53.4 40.3 6.1
Fresh fish 62.4 31.0 7.1
Packaged goods 30.1 59.9 10.0
Beverages 17.9 69.1 13.0
Source: analysis of survey data
Table 2: Importance weightings for retail outlet attributes and mean score on those attributes for supermarkets
and wet markets
Average
importance
rating given to
attribute
Average
score of wet
markets for
attribute
Average score
for
supermarkets
for attribute Quality of products 4.45 3.41 3.87
Food Safety 4.34 3.05 3.95
Variety of products 4.28 3.44 3.95
Cleanliness of place 4.25 2.74 4.10
Quality of service 4.08 3.14 3.83
Speed of service 3.97 3.38 3.67
Convenience of location 3.87 3.16 4.06
Price of products 3.87 3.4 3.52
Atmosphere 3.55 3.01 3.95
Assortment 3.31 2.94 3.96
Special offers 3.24 2.68 3.61
Payment by card 2.21 1.79 3.67
Source: analysis of survey data

24
Table 3: Bootstrapped Bivariate Ordered Probit Model: Frequency of Wet Market and Supermarket Visits
(n = 201)
independents
coefficient1 z-value
bootstrapped bias-corrected standard error
95% confidence interval2
equation 1 dependent 1: frequency of wet market visits
Retail outlet attributes
Convenience of location 0.088 0.72 [0.108; 0.138]
Price of products 0.225 1.43 [0.138; 0.177]
Special offers 0.031 0.25 [0.107; 0.139]
Assortment -0.209 -1.30 [0.141; 0.179]
Quality of service -0.075 -0.50 [0.128; 0.167]
Speed of service 0.331** 2.10 [0.135; 0.179]
Product Quality 0.575*** 3.21 [0.265; 0.493]
Variety of products 0.149 0.134 [0.116; 0.152]
Payment by card -0.094 -0.96 [0.088; 0.107]
Atmosphere -0.226*** -4.72 [0.128; 0.167]
Cleanliness 1.153** 2.24 [0.389; 0.639]
Food safety 0.029 0.19 [0.132; 0.172]
Product quality x cleanliness -0.202*** -4.95 [0.102; 0.179]
socio-economic characteristics
Location 0.522*** 3.14 [0.154; 0.178]
Gender 0.352** 2.14 [0.152; 0.178]
Age 0.236*** 2.56 [0.079; 0.099]
Household income -0.223** -2.53 [0.078; 0.098]
Level of education -0.299*** -3.26 [0.079; 0.105]
equation 2 dependent 2: frequency of supermarket visits
Retail outlet attributes
Convenience of location 0.498*** 2.84 [0.151; 0.199]
Price of products -0.283* -1.88 [0.131; 0.169]
Special offers 0.455*** 2.94 [0.135; 0.174]
Assortment 0.164*** 3.65 [0.152; 0.198]
Quality of service 0.257 1.27 [0.177; 0.228]
Speed of service 0.162 1.09 [0.124; 0.173]
Product Quality 0.615 0.76 [0.727; 0.901]
Variety of products 0.211 1.38 [0.135; 0.170]
Payment by card -0.044 -0.43 [0.085; 0.118]
Atmosphere 0.404*** 3.63 [0.183; 0.239]
Cleanliness 0.381 0.51 [0.656; 0.828]
Food safety 0.154 0.91 [0.133; 0.203]
Product quality x cleanliness -0.173 -0.93 [0.166; 0.207]
socio-economic characteristics
Location -0.464*** -2.95 [0.148; 0.166]
Gender -0.026 -0.16 [0.149; 0.169]
Age -0.127*** -2.29 [0.084; 0.107]
Household income 0.058 0.68 [0.077; 0.095]
Level of education -0.133*** -3.31 [0.078; 0.102]
constant 0.341*** 3.73 [0.081; 0.101]

25
Table 3: Bootstrapped Bivariate Ordered Probit Model: Frequency of Wet Market and Supermarket Visits
(continued)
coefficient1 z-value bootstrapped bias-corrected
standard error
95% confidence interval2
Rho 0.328*** 4.05 [0.083; 0.112]
cut11 3.418** 2.34 [0.998; 1.878]
cut12 3.793*** 2.58 [0.999; 1.886]
cut13 4.138*** 2.81 [0.998; 1.889]
cut14 5.171*** 3.51 [1.002; 1.892]
cut15 6.494*** 4.32 [1.009; 1.898]
cut21 4.342 1.40 [2.757; 3.477]
cut22 5.021 1.63 [2.754; 3.475]
cut23 5.739 1.86 [2.752; 3.472]
cut24 6.682** 2.16 [2.758; 3.477]
cut25 8.619*** 2.75 [2.783; 3.501]
LR-test of Independent Equations [chi2(1)] 15.69*** [0.001]
Log likelihood -574.948
Wald chi2(18) [prob>chi2] 71.18*** [0.000]
linear hypotheses tests on model specification (chi2(x))
H0: stated factors for buying decision have no significant effect for wet markets (chi2(13)) H0: stated factors for buying decision have no significant effect for supermarkets (chi2(13))
H0: socio-economic characteristics have no significant effect for wet markets (chi2(5))
H0: socio-economic characteristics have no significant effect for supermarkets (chi2(5))
37.60*** (rejected) 29.84*** (rejected)
43.33*** (rejected)
11.84** (rejected)
1: * - 10%-, ** - 5%-, *** - 1%-level of significance; 2: 1000 replications.

26
Table 4: Bootstrapped Bivariate Tobit Model for Percentage of Spending on Fresh Fruits & Vegetables
accounted for Wet Markets and Supermarket s
(n = 201)
independents
coefficient1 z-value
bootstrapped bias-corrected
standard error 95% confidence interval2
equation 1 dependent 1: percentage of spending on fresh fruit and
vegetables accounted for by wet markets
Retail outlet attributes
Convenience of location -0.169 -0.12 [1.214; 1.603]
Price of products 4.13** 2.19 [1.625; 2.146]
Special offers 1.42 0.95 [1.288; 1.701]
Assortment -2.44 -1.31 [1.605; 2.120]
Quality of service 1.34 0.80 [1.443; 1.906]
Speed of service -1.69 -0.93 [1.566; 1.068]
Product Quality 4.49 0.98 [3.948; 2.068]
Variety of products 0.189 0.12 [1.357; 1.792]
Payment by card -3.19*** -3.41 [0.806; 1.065]
Atmosphere -4.68*** -2.81 [1.435; 1.895]
Cleanliness 8.59** 2.81 [2.634; 3.479]
Food safety 1.35 0.75 [1.551; 2.049]
Product quality x cleanliness -1.36 -0.80 [1.465; 1.935]
socio-economic characteristics
Location 27.69*** 7.70 [3.098: 4.093]
Gender 1.68 0.47 [3.080; 4.068]
Age -0.45 -0.23 [1.686; 2.227]
Household income -1.16 -0.63 [1.587; 2.096]
Level of education -0.58 -0.29 [1.724; 2.276]
constant -0.56 -0.03 [16.086; 21.247]
equation 2 dependent 2: percentage of spending on fresh fruit and
vegetables accounted for by supermarkets
Retail outlet attributes
Convenience of location -3.47 -1.70 [1.759; 3.323]
Price of products 0.01 0.01 [0.862; 1.138]
Special offers 0.56 0.33 [1.462; 1.931]
Assortment 2.36 1.22 [1.667; 2.202]
Quality of service -1.91 -0.83 [1.983; 2.619]
Speed of service 2.84*** 3.12 [0.784; 1.036]
Product Quality -4.70 -0.51 [7.942; 10.489]
Variety of products 2.54*** -4.10 [-0.705; -0.534]
Payment by card 1.26 1.09 [0.996; 1.316]
Atmosphere 0.71 0.30 [2.039; 2.694]
Cleanliness -7.55 -0.88 [7.393; 9.766]
Food safety 4.80** 2.49 [1.661; 2.194]
Product quality x cleanliness 0.87 0.41 [1.829; 2.415]
socio-economic characteristics
Location -31.47*** -9.07 [2.990; 3.949]
Gender 2.45 0.72 [2.932; 3.873]
Age 1.79 0.94 [1.641; 2.167]
Household income 1.12 0.63 [1.532; 2.023]
Level of education 1.45 0.73 [1.711; 2.261]
constant 84.68*** 2.34 [31.185; 41.191]
lnsigma1 3.15*** 59.98 [0.045; 0.059]
lnsigma2 3.09*** 56.97 [0.047; 0.062]
atrho12 -1.32*** -17.60 [0.065; 0.085]
sigma1 23.27*** 19.06 [1.052; 1.389]
sigma2 22.18*** 18.38 [1.039; 1.373]
rho12 -0.86*** -46.24 [0.016; 0.021]
LR-test of rho12 [chi2(1)] 249.445*** [0.000]
Log likelihood -1603.524
Wald chi2(36) [prob>chi2] 151.04*** [0.000]
1: * - 10%-, ** - 5%-, *** - 1%-level of significance; 2: 1000 replications.

27
Table 5: Bootstrapped Bivariate Tobit Model for Percentage of Spending on Fresh Meat accounted for Wet
Markets and Supermarket s
(n = 201)
independents
coefficient1 z-value
bootstrapped bias-corrected
standard error
95% confidence interval2
equation 1 dependent 1: percentage of spending on fresh meat
accounted for by wet markets
Retail outlet attributes
Convenience of location 0.99 0.67 [1.273; 1.682]
Price of products 1.27 0.66 [1.658; 2.190]
Special offers 1.59 1.01 [1.357; 1.792]
Assortment -1.51 -0.78 [1.668; 2.204]
Quality of service 2.71*** 3.57 [0.654; 0.864]
Speed of service -2.71*** -3.47 [0.673; 0.889]
Product Quality 13.50*** 2.60 [4.474; 5.910]
Variety of products -0.61 -0.38 [1.383; 1.827]
Payment by card -3.28*** -2.80 [1.009; 1.333]
Atmosphere -4.65*** -2.73 [1.468; 1.939]
Cleanliness 14.69** 2.20 [5.754; 7.600]
Food safety 1.812 0.71 [2.199; 2.905]
Product quality x cleanliness 3.75** 2.00 [1.616; 2.134]
socio-economic characteristics
Location 28.27*** 7.56 [3.222; 4.256]
Gender 0.21 0.05 [3.619; 4.781]
Age -1.68 -0.84 [1.723; 2.276]
Household income -2.41 -1.27 [1.635; 2.159]
Level of education -0.84 -0.40 [1.809; 2.390]
constant -16.04 -0.72 [19.198; 25.358]
equation 2 dependent 2: percentage of spending on fresh meat
accounted for by supermarkets
Retail outlet attributes
Convenience of location 2.09 1.01 [1.783; 2.356]
Price of products -3.18** -1.92 [1.427; 1.885]
Special offers 0.45 0.26 [1.491; 1.970]
Assortment -0.18 0.09 [-2.276; -1.723]
Quality of service 0.83 0.35 [2.043; 2.699]
Speed of service 0.37 0.20 [1.594; 2.106]
Product Quality 2.78 0.29 [8.261; 10.911]
Variety of products -1.25 -0.73 [1.476; 1.949]
Payment by card 1.32 1.13 [1.007; 1.329]
Atmosphere -1.41 -0.59 [2.059; 2.720]
Cleanliness 1.21 0.14 [7.448; 9.838]
Food safety 2.99*** 2.50 [1.031; 1.361]
Product quality x cleanliness -1.05 -0.48 [1.885; 2.489]
socio-economic characteristics
Location -32.68*** -9.15 [3.078; 4.065]
Gender 1.69 0.46 [3.166; 4.182]
Age 2.21 1.12 [1.700; 2.246]
Household income 3.37* 1.87 [1.553; 2.051]
Level of education 0.17 0.08 [1.831; 2.419]
constant 63.55* 1.69 [32.405; 42.802]
lnsigma1 3.26*** 62.52 [0.045; 0.059]
lnsigma2 3.19*** 61.19 [0.045; 0.059]
atrho12 -1.41*** -19.30 [0.063; 0.083]
sigma1 25.93*** 19.21 [1.163; 1.536]
sigma2 24.42*** 19.15 [1.099; 1.451]
rho12 -0.89*** -57.21 [0.013; 0.018]
LR-test of rho12 [chi2(1)] 264.284*** [0.000]
Log likelihood -1602.0945
Wald chi2(36) [prob>chi2] 150.61*** [0.000]
* - 10%-, ** - 5%-, *** - 1%-level of significance; 2: 1000 replications.

28
Table 6: Bootstrapped Bivariate Tobit Model for Percentage of Spending on Fresh Fish accounted for Wet
Markets and Supermarket s
(n = 201)
independents
coefficient1 z-value
bootstrapped bias-corrected
standard error
95% confidence interval2
equation 1 dependent 1: percentage of spending on fresh fish
accounted for by wet markets
Retail outlet attributes
Convenience of location 3.38* 1.98 [1.471; 1.943]
Price of products 1.74 0.66 [2.272; 3.001]
Special offers -0.29 -0.14 [1.785; 2.358]
Assortment -3.01 -1.17 [2.217; 2.928]
Quality of service -0.11 -0.06 [1.579; 2.087]
Speed of service -1.60 -0.65 [2.121; 2.802]
Product Quality 19.41*** 2.87 [5.828; 7.698]
Variety of products 1.72 0.79 [1.876; 2.478]
Payment by card 0.44 0.28 [1.354; 1.789]
Atmosphere -1.49 -0.64 [2.006; 2.649]
Cleanliness 27.13*** 3.03 [7.716; 10.192]
Food safety 0.58 0.23 [2.173; 2.870]
Product quality x cleanliness 7.239*** 2.90 [2.151; 2.841]
socio-economic characteristics
Location 7.24*** 2.49 [2.506; 3.309]
Gender 24.05*** 6.14 [3.375; 4.458]
Age 0.28 0.07 [3.447; 4.553]
Household income -2.19 -1.03 [1.832; 2.420]
Level of education 1.44 0.63 [1.969; 2.602]
constant -56.73*** -2.07 [23.617; 31.194]
equation 2 dependent 2: percentage of spending on fresh fish
accounted for by supermarkets
Retail outlet attributes
Convenience of location 0.17 0.05 [2.929; 3.870]
Price of products -1.52 -0.57 [2.298; 3.035)
Special offers -1.48 -0.57 [2.237; 2.955]
Assortment -3.99*** -2.91 [1.181; 1.561]
Quality of service 7.33** 2.07 [3.051; 4.031]
Speed of service -1.69 -0.61 [2.387; 3.153]
Product Quality -5.96 -0.42 [12.229; 16.152]
Variety of products 1.28 0.48 [2.298; 3.035]
Payment by card 0.49 0.28 [1.508; 1.992]
Atmosphere 1.32 0.36 [3.159; 4.174]
Cleanliness -11.78 -0.91 [11.155; 14.735]
Food safety 0.77 0.26 [2.552; 3.371]
Product quality x cleanliness 1.88 0.58 [2.793; 3.689]
socio-economic characteristics
Location -31.33*** -7.45 [3.624; 4.787]
Gender -2.49 -0.58 [3.699; 4.887]
Age 0.68 0.28 [2.093; 2.764]
Household income 2.62 1.14 [1.981; 2.616]
Level of education 0.95 0.38 [2.154; 2.846]
constant 96.34* 1.76 [47.171; 62.306]
lnsigma1 3.29*** 65.24 [0.043; 0.057]
lnsigma2 3.35*** 58.30 [0.049; 0.065]
atrho12 -1.12*** -14.85 [0.065; 0.086]
sigma1 27.05*** 19.78 [1.178; 1.557]
sigma2 28.52*** 17.40 [1.412; 1.866]
rho12 -0.81*** -30.67 [0.023; 0.030]
LR-test of rho12 [chi2(1)] 249.445*** [0.000]
Log likelihood -1603.524
Wald chi2(36) [prob>chi2] 151.04*** [0.000]
1: * - 10%-, ** - 5%-, *** - 1%-level of significance; 2: 1000 replications.

29
Table 7: Bootstrapped Bivariate Tobit Model for Percentage of Spending on Packaged Goods accounted for Wet
Markets and Supermarket s
(n = 201)
independents
coefficient1 z-value bootstrapped bias-corrected
standard error
95% confidence interval2
equation 1 dependent 1: percentage of spending on packaged goods
accounted for by wet markets
Retail outlet attributes
Convenience of location 4.97* 1.83 [2.463; 2.969]
Price of products 1.69 0.47 [3.531; 3.661]
Special offers 5.39* 1.84 [2.675; 3.184]
Assortment -2.84 -0.78 [3.533; 3.749]
Quality of service -1.43 -0.43 [3.266; 3.385]
Speed of service -2.59 -0.74 [3.398; 3.602]
Product Quality 9.62 1.11 [8.513; 8.820]
Variety of products -0.82 -0.27 [2.999; 3.074]
Payment by card -0.65 -0.30 [2.125; 2.208]
Atmosphere -0.39 -0.12 [3.233; 3.267]
Cleanliness -1.18 -0.10 [11.786; 11.814]
Food safety -1.77 -0.51 [3.400; 3.541]
Product quality x cleanliness -0.53 -0.16 [3.290; 3.335]
socio-economic characteristics
Location 22.36*** 4.72 [4.085; 5.389]
Gender 1.39 0.29 [4.753; 4.833]
Age 0.73 0.29 [2.477; 2.557]
Household income -0.78 -0.31 [2.473; 2.556]
Level of education -3.13 -1.20 [2.442; 2.774]
constant -23.47 -0.69 [33.919; 34.109]
equation 2 dependent 2: percentage of spending on packaged goods
accounted for by supermarkets
Retail outlet attributes
Convenience of location -2.18 -0.46 [4.676; 4.803]
Price of products 2.32 0.58 [3.919; 4.080]
Special offers -0.93 -0.23 [4.012; 4.075]
Assortment 9.93*** 2.14 [4.344; 4.936]
Quality of service 7.33 1.35 [5.243; 5.616]
Speed of service 5.87 1.38 [4.063; 4.444]
Product Quality -27.84 -1.27 [21.746; 22.097]
Variety of products 2.32 0.58 [3.919; 4.080]
Payment by card 2.57 0.93 [2.635; 2.892]
Atmosphere -2.63 -0.47 [5.531; 5.661]
Cleanliness -19.29 -0.96 [19.961; 20.226]
Food safety 7.22*** 2.63 [2.382; 3.109]
Product quality x cleanliness 4.55 0.91 [4.874; 5.126]
Socio-economic characteristics
Location -26.09 -4.83 [4.734; 6.069]
Gender -6.03 -1.08 [5.434; 5.733]
Age -5.09*** -3.59 [0.922; 1.914]
Household income 2.53 0.86 [2.823; 3.061]
Level of education -1.06 -0.34 [3.071; 3.165]
constant 188.03** 2.22 [84.391; 85.005]
lnsigma1 3.43*** 59.76 [-8.204; 8.319]
lnsigma2 3.61*** 68.61 [-9.432; 9.538]
atrho12 -0.83*** -10.92 [-1.434; 1.586]
sigma1 30.89*** 17.42 [-0.635; 4.181]
sigma2 36.93*** 19.01 [-0.685; 4.571]
rho12 -0.68*** -16.73 [-2.272; 2.353]
LR-test of rho12 [chi2(1)] 103.569*** [0.000]
Log likelihood -1730.620
Wald chi2(36) [prob>chi2] 70.33*** [0.000]
1: * - 10%-, ** - 5%-, *** - 1%-level of significance; 2: 1000 replications.