Embed Size (px)
Citation preview

INVESTIGATING FOOD WASTE MANAGEMENT IN COLLEGE AND
UNIVERSITY FOODSERVICE OPERATIONS
A THESIS
SUBMITTED IN PARTIAL FULFILLMENT OF THE REQUIREMENTS FOR THE
DEGREE OF MASTER OF SCIENCE
IN THE GRADUATE SCHOOL OF THE
TEXAS WOMAN'S UNIVERSITY
COLLEGE OF HEALTH SCIENCES
BY
SOCKJU KWON, PH.D.
DENTON, TEXAS
AUGUST2009

TEXAS WOMAN'S UNIVERSITY DENTON, TEXAS
June 3, 2009
To the Dean of the Graduate School:
I am submitting herewith a thesis written by Sockju Kwon entitled "Investigating food waste management in college and university foodservice operations." I have examined this thesis for form and content and recommend that it be accepted in partial fulfillment of the requirements for the degree of Master of Science with a major in Food Systems Administration.
We have read this thesis and recommend its acceptance:
Department Chair
Accepted:
Dean of the Graduate School

ACKNOWLEDGEMENT
Special thanks to
the Foodservice Systems Management Education Council (FSMEC)
for financial support of this study.
Special thanks to
Carolyn Bednar, Ph.D.
for academic and research advising throughout the Master's program.
Special thanks to
Rose Bush, M.S., Junehee Kwon, Ph.D., and Kathy Butler, M.S.
for their service as being committee members.
Special thanks to
Rene Paulson, Ph.D., Texas Woman's University
for providing statistical advice for this study.
Special thanks to
family members and friends in the United States, Korea and Australia
for their endless support for my success and happiness.
111

ABSTRACT
SOCKJUKWON
INVESTIGATING FOOD WASTE MANAGEMENT IN COLLEGE AND UNIVERSITY FOODSERVICE OPERATIONS
AUGUST2009
This study was designed to investigate foodservice administrators' attitudes and
barriers regarding food waste management (FWM) in college and university foodservice
operations. Research methods included focus group discussions and a national survey
conducted both online and by mail. Survey questionnaires were e-mailed and/or mailed
to delegates of the National Association of College and University Food Services, and 63
usable responses were received. Student t-tests and analysis of variance (AN OVA) were
used to compare to test differences among groups. Educating customers about FWM was
considered most likely to reduce food waste among suggested foodservice management
activities. Composting was selected as most likely to reduce food waste among food
disposal methods. Most respondents had positive attitudes regarding FWM, but limited
space, lack of governmental enforcement and training employees were selected as three
major barriers to FWM. Results varied depending on type of management, meal plans
and production, residential dining halls, and source of information about FWM.
IV

TABLE OF CONTENTS
Page
ACKNOWLEDGMENTS ......... · ············· ··· · ····· · ..... · · .............. · ···· · ···· ··· ·· ·· · · · ·· · ···· · ··· · ···········iii
ABSTRACT······················································································································· iv
LIST OF TABLES · ··· ·············· · · ·· ····· · ····· ····· · ···· · · · ··· ·· ···· ······ · · · ············ ·· ·· ··· ······ · ·· · ··· · · ···· · ···· vii
Chapter
I. INTRODUCTION ··· ·· ······ · ····· ·········· ·· · · ··· · ·· · ·· · ········· ················· ·· ·· ··· · ·· ·· · ··· ·· · · ·· ·· ··· ··· · ·· · 1 Purpose and Objectives •·····························································································3 Null Hypothesis ·················································· ····· ······································ ·· ··········4 Assumption and Delimitation · • • · · · · · • · · · · · · · · · · · · · · · · · · · · · · · · · · · · · · · · · · · · · · · · · · · · · · · · · · · · · · · · · · · · · · · · · · · · · · · · · · · ·4
II. REVIEW OF LITERATURE ................................. ....................... ............................. 6
Sustainability··················· ···· ························································································6 Municipal Solid Waste (MSW) ································· ·· ···················· ··························8 Food Waste Management ............................................................... ........................... 3
College and University Foodservice ........................................................................ 11
Recent Sustainability Programs·· ················ ······························································ 15 Decision Making for Waste Management .. · .............. · ...................... · .......... · · · ........ · 16
Barriers for Making Decisions .... · · · .. · .. · · · · · · · · .. · · · · ........ · ........ · ......... · · · · · · · .. · · · ...... · · .... · .. · 18
Research Methods · · · · · · · · · · · · · · · · · · · · · · · · · · · · · · · · · · · · · · · · · · · · · · · · · · · · · · · · · · · · · · · · · · · · · · · · · · · · · · · · · · · · · · · · · · · · · · · · · · · · · 20
III. METHODOLOGY ................................................... ..... ........................................... 22
Institutional Review Board ....................................................................................... 22
Focus Group · · · · · · · · · · · · · · · · · · · · · · · · · · · · · · · · · · · · · · · · · · · · · · · · · · · · · · · · · · · · · · · · · · · · · · · · · · · · · · · · · · · · · · · · · · · · · · · · · · · · · · · · · · · · · 22 Survey .............................................................................................. ....... ...... ........... 24
IV. RESULTS ................................................ ...... ...................... .. .................................. 27
Focus Group Discussion · · · · · · · · · · · · · · · · · · · · · · · · · · · · · · · · · · · · · · · · · · · · · · · · · · · · · · · · · · · · · · · · · · · · · · · · · · · · · · · · · • • · • · · • · · 27 Pilot Survey .............................................................................................................. 29
National Survey ·························· ··· ······························· ··············· ·· ····· ····· ················31
V

V. DISCUSSION AND CONCLUSIONS ··························· ·········································75 Discussion · · · · · · · · · · · · • • • • • • • • • • • • • • • • • • • • • • • • • • • • • • • • • • • • • • • • • • • • • • • • • • • • • • • • • • • • • • • • • • • • • • • • • • • • • • • • • • • • • • • • • • • • • • • • • • • • • 7 5
Conclusion •··········································· ····································································84 Limitation•·•·····••·•·•··•·····•··••········•······•···•·••··········•········••····•·•··•···••••··••·••••·· ·•·•····•··· •··85
Recommendation ········ ·················································· ············ ········· ······················86
REFERENCES ···························· ··········································· ································ ···· ··· ···89
APPENDICES ······· ··········································································· ·· ············ ···················94 A. Approval of the Study from Institutional Review Board··························· ···· ······94
B. Focus Group Questioning Route •··················································· ······················96
C. Cover Letter•··········································· ······························ ············· ······ ·············98 D. Mailed Survey Questionnaire············································································· l00
Vl

LIST OF TABLES
Table Page
1. Demographic Characteristics of Foodservice Administrators ·························33
2. Characteristics of College and University Foodservice Operations ················35
3. Characteristics of Waste Produced in College and University Foodservice Operations ···················································································36
4. College and University Foodservice Administrators' Perceptions of Likeliness of Foodservice Management Activities to Reduce Food Waste··············································· ··········· ······ ························· ················ ··· ····37
5. College and University Foodservice Administrators' Perceptions of Likeliness of Foodservice Management Activities to Reduce Food Waste according to Type of Management ....................................................... 3g
6. College and University Foodservice Administrators' Perceptions of Likeliness of Foodservice Management Activities to Reduce Food Waste according to the Existence of Residential Dining Halls · · · · · · · · · · · · · · · · · · · · · · · 3 9
7. College and University Foodservice Administrators' Perceptions of Likeliness of Foodservice Management Activities to Reduce Food Waste according to Number of Meals Served Weekly .................................... 41
8. College and University Foodservice Administrators ' Perceptions of Likeliness of Foodservice Management Activities to Reduce Food Waste according to Meal Plan ······················································· ··········· ·······42
9. College and University Foodservice Administrators ' Perceptions of Likeliness of Foodservice Management Activities to Reduce Food Waste according to Type of Food Production .............................. .... .............. -45
10. College and University Foodservice Administrators ' Perceptions of Likeliness of Foodservice Management Activities to Reduce Food Waste according to Source of Information about Food Waste Management· ···· ··· .. ··· ........................................................................................ 4g
Vll
11. College and University Foodservice Administrators' Perceptions of Effectiveness of Food Waste Disposal Methods • .. · · · · .. · · · · · · · · · · · · · · · · · · · · · · .. · · · · · · · · · · · · 51
12. College and University Foodservice Administrators' Perceptions of Effectiveness of Food Waste according to Type of Management ···················53
13. College and University Foodservice Administrators' Perceptions of Effectiveness of Food Waste Disposal Methods according to the Existence of Residential Dining Halls • • • • • • • • • • • • • • • • • • • • • • • • • • • • • • • • • • • • · · • • • · · · · · · · · · · · · · · · · · · · · 54
14. College and University Foodservice Administrators' Perceptions of Effectiveness of Food Waste Disposal Methods according to Number of Meals Served Weekly······· ............................................................. 55
15. College and University Foodservice Administrators' Perceptions of Effectiveness of Food Waste Disposal Methods according to Age of Foodservice Administrators · · · · · · · · · · · · · · · · · · · · · · · · · · · · · · · · · · · · · · · · · · · · · · · · · · · · · · · · · · · · · · · ·· · · · · · · · · · · · 56
16. College and University Foodservice Administrators' Perceptions of Effectiveness of Food Waste Disposal Methods according to Meal Plan ······ ··· ································ ········································································58
17. College and University Foodservice Administrators' Perceptions of Effectiveness of Food Waste Disposal Methods according to Type of Production ··················· ······ ······· ··· ···· ···································· ······· ·················60
18. College and University Foodservice Administrators' Perceptions of EffeGtiveness of Food Waste Disposal Methods according to Source of Information about Food Waste Management· ........ ··· · .... ·· .. ········· .... ·· .. ·· .. ··· ·63
19. College and University Foodservice Administrators' Perceptions of Barriers Regarding Food Waste Management .............. ....... ... ......... .. ........... ... 67
20. College and University Foodservice Administrators ' Perceptions of Barriers Regarding Food Waste Management according to Type of Management················································· ····················································69
21. College and University Foodservice Administrators' Perceptions of Barriers Regarding Food Waste Management according to Number of Meals Served Weekly··············· ··· ·· ································· ··· ··· ···················· ···72
V111
CHAPTER I
INTRODUCTION
Sustainability has become an important concept in today's society. Ecological or
environmental sustainability is defined as "the ability of an ecosystem to maintain
ecological processes, functions, biodiversity and productivity into the future (Regional
Ecosystem Office, 2003)." In 2007, the American Dietetic Association (ADA) also
established a position statement on conservation of natural resources and ecological
sustainability and suggested specific tips and procedures to keep the environment clean
with emphasis on the food system. The specific ways to reduce food waste include the
purchase of ready-prepared produce, accurate forecasting of food production, and
donation of leftovers for human or animal feed (Harmon & Gerald, 2007).
Food waste has a serious effect on the environment because methane produced
from land-filled food waste is 21 times more potent green house gases than carbon
dioxide (EPA, 2007a). The literature includes several success stories about managing
food waste from foodservice operations such as sending food waste to composting sites
and reusing frying oil for utilities or delivery truck (Buchthal, 2006; Miller, 2007).
However, most food scraps from homes and small foodservice operations are packed in
garbage bags and sent to landfills. Large quantities of food waste from foodservice
operations could be sent to processing sites more consistently, which is important when
animal feeding and composting methods are used (Department of Hotel, Restaurant,
- 1 -

Institution Management and Dietetics, Kansas State University, 2002). Since production
of food waste is inevitable in foodservice operations, most foodservice operations are
aware of food waste management as an important factor in enhancing environmental
sustainability. Food waste management is also important for foodservice operations
because of possible reduction in cost for food purchases and waste disposal.
With well-educated staff and students, colleges and universities have great
potential to influence campus communities. Trends toward sustainability in this area are
apparent. Several colleges have been recognized for practicing resource conservation and
effective waste management by the Association for the Advancement of Sustainability in
Higher Education (AASHE, 2006). Many college and university foodservice directors
are working to achieve the sustainability of their kitchens and dining halls. National
leading college and university foodservice operations are offering fresh, organic, and
sustainable foods in their facilities (Herrmann, 2007).
RecycleMania, a national waste management competition among colleges and
universities, is another good example. RecycleMania was established in 2001 to decrease
municipal solid waste (MSW) generated from residence and dining halls in campus.
Results from 2008 competition showed that Mills College in California collected total
33.75 lb per person for 10 weeks. Total recycled food waste from Rutgers University
that has 39,000 students and staff was estimated as 1.9 million lb, the equivalent of 900
tons (National Recycling Coalition, 2008).
- 2 -

Trayless dining, a recent innovation in foodservice operations, has been addressed
by large corporations such as Aramark and Sodexo. Trayless dining showed effective
reduction in food waste by 25-30% as well as savings in water and energy (Aramark,
2008; Meltzer & Stumpf, 2008).
The possibility of effective food waste management in college and university
foodservice operations has been demonstrated. However, only a few college and
university foodservice operations have actively participated in food waste management
programs. Therefore, this research was designed to investigate current trends in food
waste management and to determine attitudes and barriers of foodservice administrators
when making decisions for food waste management program implementation.
Purpose and Objectives
The purpose of this study was to investigate the present status of food waste
management in college and university foodservice operations, foodservice
administrators' attitudes toward food waste management, and the barriers against making
decisions regarding food waste management.
The objectives were:
1. to identify the key factors impacting decision making on whether or not to participate
in food waste programs
2. to determine differences in attitudes and barriers regarding food waste management
by type of management, existence of residential area, number of meals served, type of
food production and source of information about food waste management
- 3 -

Null Hypotheses
1. Ho: There will be no significant difference in foodservice administrators' attitudes
regarding foodservice activities that could reduce amount of food waste for the
following variables: type of management, existence of residential area, number of
meals served, type of meal plan, type of food production, and source of information
about food waste management.
2. Ho: There will be no significant difference in foodservice administrators' attitudes
regarding methods of food waste disposal for the following variables: age of
foodservice administrators, type of management, existence of residential area, number
of meals served, type of meal plan, type of production, and source of information
about food waste management.
3. H0: There will be no significant difference in foodservice administrators' perception
of barriers regarding food waste management for the following variables: type of
management and number of meals served.
Assumption and Delimitations
The survey method was used to collect data from participants. Participants were
foodservice administrators who were voting delegates of the National Association of
College and University Food Services (NACUFS). The researcher assumed that the
NACUFS administrators were qualified to provide reliable and adequate information
about variables including solid waste and food waste management used in this research.
Results from this research were limited to the college and university foodservice
- 4 -

operations where NACUFS administrators are employed. Therefore, the results cannot
be generalized beyond those foodservice operations.
- 5 -

CHAPTER II
REVIEW OF LITERATURE
Sustainability
Sustainability has become important in food systems management as well as in
many industries, communities, nations, and the world. The Merriam-Webster Online
Dictionary (2005) defines sustainability as "the ability to keep in existence, maintain, or
supply with necessities or nourishment". The definition of sustainability may not sound
critical, but it becomes a most important, necessary term for human life when combined
with ecological or environmental factors.
Individuals have raised many concerns about ecological sustainability. After
several weather-related natural disasters during the last few decades, greenhouse gases
were named as one of the main factors affecting climate change that are related to recent
extreme natural disasters (Helmer & Hilhorst, 2006). According to one report, the
amount of carbon dioxide has doubled in the air over the last three decades, which has
also doubled the frequency of category 4-5 severe cyclone outbreaks in the North
Atlantic areas (Webster, Holland, Curry & Chang, 2005).
Carbon dioxide is mostly formed from burning fossil fuels including coals, gases,
and oils. As production of fossil fuels is anticipated to hit a peak soon and demands are
expected to grow 40% by 2020 (Bisk, 2007), voices concerning energy and
environmental conservation have been raised concurrently from the public, educators,
- 6 -

researchers, business experts, and governmental agencies. Solid waste including food
waste is another contributor to the greenhouse effect since it generates methane and
carbon dioxide gases when it is combusted and dumped into landfills (EPA, 2006).
Two major areas for ecological sustainability in foodservice operations are energy
conservation and waste reduction. Resource conservation is mostly related to energy and
water. The kitchen is the highest energy demanding area in the building. It is known to
consume five times more energy than retail, office, or lodging space. Huge amounts of
energy are used for cooking, dishwashing, air conditioning, lighting, ventilating, and
refrigeration. Richard Young, a senior engineer of PG&E Food Service Technology
Center, stated that the foodservice operator is in the energy business during his webinar
(Young & Cartwright, 2007). Resource conservation can be accomplished by choosing
energy and water saving equipment and appliances, training employees, and
implementing resource conserving practices.
The food system produces both food waste and non-food waste. Characteristics
of each category are completely different. Food packaging, including dinnerware,
tableware, glassware, and plastics, is visually very bulky, but contributes less weight to
municipal solid waste than food wastes such as vegetable/fruit trims, plate wastes, and
leftovers (Hackes, Shanklin, Kim & Su, 1997).
Food waste management is an important factor for improving environmental
sustainability, because the amount of food waste directly and indirectly reflects the
- 7 -

efficiency and effectiveness of system management. In addition, food waste is negatively
related to profit because it increases the input and decreases the output.
Municipal Solid Waste (MSW)
In the U.S., concerns about environmental protection were raised long ago. The
U.S. Environmental Protection Agency (EPA) was established in 1970 to meet the
public's demand for a safe and harmless environment. Since then, EPA has set up a solid
structure to act as the representative agent for environmental issues, provide guidelines
for environmental protection and improve environmental indices (EPA, 2007a).
Waste management is a key element in preserving our environment (air, water,
and soil) as well as saving resources. The EPA emphasized that more than 10 billion
gallons of gasoline would be saved by recycling 82 million tons of MSW, 1,655 gallons
of gasoline by recycling 1 ton of aluminum cans, and 197 gallons of gasoline by
replacing one ton of plastics (EPA, 2007b ). Since 1990, the total amount of MSW has
increased from 205.2 to 251.3 million tons (MT), whereas the daily per capita generation
of MSW has kept in range within 4.50-4.60 lb/person. The percentage of recycled MSW
has also doubled in the last two decades, and in 2006 about one third (32.5%) of total
MSW was recycled.
Food Waste Management
The activity of the EPA has been expanding in the U.S. for several decades and
has shown great progress. However, food waste management still remains a challenging
problem. The seriousness of food waste was also addressed by the EPA. The EPA
- 8 -

considered food leftovers as a single-largest component of the waste stream by weight in
the United States. The EPA also emphasized that more than 25% of prepared food was
thrown away and the amount of wasted food were about 96 billion pounds each year in
2006. The EPA also emphasized that landfills produce 34% of methane emissions in the
U.S. and that food waste in landfills produces methane which is 21 times more potent
than carbon dioxide in boosting the greenhouse effect (EPA, 2007 c).
Food waste is generated through the food flow from farms to consumers. Food
manufacturers, processors, and supermarkets generate mostly preparatory food scraps,
whereas others such as foodservice operations and households have both preparatory
food scraps and leftovers/plate wastes (EPA, 2007a). Timothy W. Jones, an
anthropologist in Arizona University spent 10 years measuring food loss under grants
from the U.S. Department of Agriculture (Cole C, 2005). He determined that more than
50% of solid waste was food; 14% of food was wasted within expiration dates, and each
family with four members wasted annually $590 worth food, which is equal nationally to
$43 billion per year. It is not clear how many foodservice operations are implementing
food waste programs or how much they donate or compost foods, although a few case
studies are described by organizations including the EPA and the California Integrated
Waste Management Board (CIWMB).
As environmental sustainability becomes a must, food waste management should
also be a must. Vegetable trims and food scraps are major components in food waste.
Food waste is a very unique output from the food system because it is the third heaviest
- 9 -

component among MSW (EPA, 2007b) and relatively dense (Hackes, Shanklin, Kim, &
Su, 1997), which means it weighs much more per unit volume than other MSW. Food
waste is 81.8% by weight and 14% by volume, whereas food package waste is 28% by
weight and 85% by volume (Hackes et al., 1997).
Although the environmental protection movement has been expanding in the U.S.
for several decades, little progress has been made regarding the management of food
waste in foodservice operations. The amount of food waste has continuously increased,
whereas the recovery rate has decreased. The total weight from food waste was 26.2 MT
(11.4%) in 2001, 27.6 MT (11.7%) in 2003, 29.2 MT (11.9%) in 2005, and 31.3 MT
(12.4%) in 2006. While the total MSW has been recovered from 29.7% in 2001 to 32.5%
in 2006, the recovered weight from food waste was 0.7 MT (2.8%) in 2001, 0.75 MT
(2.7%) in 2003, 0.69 MT (2.4%) in 2005, and 0.68MT (2.2%) in 2006 (EPA, 2007b).
The EPA suggests a food waste recovery hierarchy: reduce food waste generation,
donate the leftover foods to shelters, feed the animals, compost the waste to nourish the
soil, send it to landfills, or incinerate it. Source reduction and reuse are preferred
methods of waste management, followed by recycling and composting.
Several states and local governments have implemented food waste recovery and
recycling. Middlebury College in Vermont collected 288 tons of food waste and saved a
net cost of $27,000 in 1996 (EPA, 2007a). Delux Town Diner in Watertown,
Massachusetts invested $20,000 for a boiler using recycled vegetable oil and saved a net
- 10-

cost of $5,800 per year from the oil cost for heating and the disposal costs for waste
(Buchthal, 2006).
The EPA urges food providers, including institutional foodservice operations, to
participate in food waste programs because of the significant amount of food waste every
day (EPA, 2007a). For food waste management, donations to the hungry and animals are
the most common method and composting is second. California is one of the states that
actively practices state-level food waste management. The CIWMB established the
Waste Reduction Awards Program (WRAP) in 1993 to encourage more companies to
practice environmental-friendly activities. The board recognized Dole Fresh Vegetables
(1997), Kraft Foods Inc., Visalia (1999), and Westin San Francisco Hotels (2000) as
winners for their food waste reduction efforts (CIWMB, 2007). Dole Fresh Vegetables
and Westin San Francisco Hotels donated excess food to local food banks, and Kraft
Foods sent byproducts to animal food manufacturers.
College and University Foodservice
The trends toward sustainability in colleges and universities are well documented.
Colleges get recognized by practicing resource conservation and waste management.
Education for Sustainability Western Network, the former organization of the
Association for the Advancement of Sustainability in Higher Education (AASHE) was
established in 2001 with a vision, to see higher education take a leadership role in
preparing students and employees to achieve a just and sustainable society (AASHE,
2007). The association projected colleges and universities to be good models for leading
- 11 -

ecological sustainability among the community by creating integrative curriculum and
practice.
With well-educated staff and students, colleges and universities have the potential
power to affect environmental protection efforts. University of British Columbia (UBC)
received an inaugural Campus Sustainability Leadership Award from AASHE in 2006.
The major 2005-2006 accomplishments of UBC for sustainability are summarized as
follows: (a) decreased energy use by 20%, carbon dioxide emission by 15,000 tons, and
water use by 30%, (b) saved $100,000 per year and expected carbon dioxide emission by
38,000 tons by ground water energy system in the next 20 years, (c) received Leadership
in Energy and Environmental Design (LEED) certification for the Life Sciences Centre
(gold), and Aquatic Ecosystems Research Laboratory (silver), (d) performed custodial
service with certified green cleaning products, (e) reduced 2,000 tons of landfills (42% of
total waste) by composting and recycling, (f) developed 300 undergraduate and graduate
courses dealing with issues of sustainability, (g) incorporated sustainability training
program for first year student orientation leaders, and (h) offered a residence
sustainability coordinator program (AASHE, 2006).
Similar to WRAP for companies in California, RecyleMania is a national waste
management competition among colleges and universities. The program was established
in 2001 to decrease MSW generated by residence and dining halls in colleges and
universities. Basically, all colleges can participate in this program, which requires
participants to collect recyclable materials throughout the campus for a 10 week period.
- 12 -

This program mainly focuses on collecting paper, containers, and cardboard. However,
foodservice organics including food waste can be collected separately to compete for
specific targeted materials recognition. According to statistics from the National Center
for Education, there are a total of 6,441 colleges and universities in the United States
(National Center for Education Statistics, 2007). In 2007, a total of 201 colleges and
universities (3.1 % ) participated in the competition and recycled about 18.7 thousand tons
of waste through 10 weeks. Rutgers University won the organic waste division, recycling
7.1 lb/person/week (National Recycling Coalition, 2007).
The number of participating colleges and universities doubled and a total of 430
colleges and universities participated in 2008 RecycleMania. Among total participants,
only about 10% of participants (n=43) collected foodservice organics. The 2008
competition results showed that Mills College in California collected a total of 33.75 lb
of organic waste per person for 10 weeks. Total recycled food waste from Rutgers
University which has 39,000 students and staff was estimated at 1.9 million lb, equivalent
to 900 tons (National Recycling Coalition, 2008).
College and university foodservice operations are also very active in improving
the sustainability of their kitchens and dining halls through using local and organic foods
and composting food scraps. Stanford University is one of foodservice operations that
focus on environmental sustainability practices. Stanford Dining received several awards
due to its sustainability practices: an "A" rating for food and recycling from the
Sustainable Endowment Institute' s 2007 College Sustainability Report Card, the 2007
- 13 -

Acterra Business Environmental Award for sustainability and green business practices, a
2007 Certificate of Special Congressional Recognition from the U.S. Congress, the 2006
Pacific Gas & Electric Company's award for Leadership in Applying Green Building
Design, and Santa Clara County's Green Business Certification in 2004 (Friendland &
Lawn, 2007). Stanford University held an 'Eat Local Celebration' week to increase the
awareness of sustainable food in the campus dining in Spring 2007 (Stanford celebrates,
2007).
The University of Maryland has also set a good example practicing sustainability
in its dining halls. Specific practices are waste reduction, extensive recycling programs,
energy and water conservation, proper purchasing, a triple filtered water purification
system, reusable mugs, and cook to order menus (Department of Dining Services, 2006).
In addition to the University of Maryland, 14 more colleges and universities were
selecte_d as "Green" campuses by Grist Organization, a nonprofit environmental
journalism organization in Seattle, Washington (15 green colleges, 2007).
Successful college and university foodservice operations frequently offer fresh,
organic, or sustainable foods. Writing in University Business, Herrmann (2007)
introduced seven successful college and university foodservice operations; Ohio
Wesleyan University, Lehigh University, University of Mary Washington, University of
Massachusetts, San Francisco State University, Florida State University, and Indiana
University of Pennsylvania. Most are claiming that they put efforts toward ecological
- 14 -

sustainability. For example, the University of Massachusetts foodservice spent 20% of
its budget for produce to local farms (Herrmann, 2007).
Composting is another method of effectively managing food waste. The dining
halls at the Evergreen State College in Washington State collected food scraps from the
residential areas, and delivered them to compost facilities or farmers that are a part of a
massive composting program (15 green colleges, 2007). Portland State University in
Oregon educated students about recycling and composting, implemented extensive
recycling and composting programs and received Businesses for an Environmentally
Sustainable Tomorrow Award from the city of Portland (Campus composts, 2006).
In summary, many American colleges and universities are aware of the
importance of ecological sustainability and are implementing various environmental
protection programs. The national leading college and university foodservices operations
put significant efforts on creating eco-friendly environments and practicing recycling
and/or composting programs.
Recent Sustainability Programs
Two big foodservice companies, Sodexo and Aramark, have implemented trayless
dining with their college and university foodservice operations and observed tremendous
effects on conserving energy and water as well as reducing food waste. According to a
case study done by Aramark Higher Education at the University of Maine at Farmington,
trayless dining implementation resulted in food waste reduction by 5 ounces per meal per
person, equivalent to 46 pounds per person per year. In addition to food waste reduction,
- 15 -

tray less dining was estimated to conserve 288,288 gallons of water for washing trays. By
minimizing the use of the dishmachines, tray less dining results in less use of energy,
detergent and sanitizer. Not only did trayless dining affect environmental sustainability,
it also created great awareness about food waste and improved the image of dining
experience. Students also appreciated the sustainability initiative and reported they could
experience a better visual dining experience without trays. As a result, total estimated
annual economic savings was estimated up to $57,000 (Aramark, 2008).
Sodexo also tested the effect of trayless dining on 150 colleges and universities.
According to a GREENetwork document published by Illinois Wesleyan University,
trayless dining could reduce plate waste by 48% although the report did not report any
cost benefit of energy and water conservation (Sodexo, 2009). Interestingly, colleges and
universities that have implemented trayless dining were listed on a Blog created by
Jonathan Bloom, a freelance journalist who wrote a book on wasted food in America
(Bloom, 2009), and the news release from each school is linked here. Many people who
are interested in food waste reduction have joined this blog and have shared information
about trayless dining trends in college and university foodservice operations.
Decision Making for Waste Management
Wie, Shanklin and Lee (2003) researched the cost-effectiveness of various waste
disposal strategies for institutional foodservice operations. Four case studies were
described: a central food processing center, a continuing-care retirement center, a
university dining center, and a commercial chain restaurant. The study concluded that
- 16 -

the cost effectiveness of implementing various waste management strategies varied
depending on the type of foodservice operation (Wie et al., 2003).
The university dining center in this study served 3,276 meals per day in its
cafeteria and used animal feeding and garbage disposal for food scraps, landfills, and
recycling for the packaging at the time investigated. The center had four strategies
through the 10 years before the investigation: animal feeding, garbage disposal, and
composting combined with garbage disposal. As a result, the cost effectiveness was
greater when animal feeding ($171,472) and composting combined with garbage disposal
($175,073) were used than when only garbage disposal was used. Costs were mainly
saved from reducing the charges for food waste ($30/ton) and pickups ($25/pickup ).
According to study published by Wie, Shanklin and Lee in 2003, the researchers
concluded that foodservice administrators should consider several factors when
evaluating the cost effectiveness of implementing specific methods for waste
management. These include (a) total amount of waste from the facility, (b) availability of
farms, compost sites, food banks and shelters, (c) availability of space, labor, and
hygiene, (d) cost for the labor, waste hauling and utility, and (e) regulations for tax
deductions. Based on these considerations, the researchers suggested that foodservice
administrators use a decision-making process for waste management. Cost effectiveness
can be determined based on cost information (hourly wage, waste hauling cost, electricity
rate, start up cost, rental fee, and surcharge) as well as non cost information (labor time
for sorting, delivering, price index, and consumer's perception). However,
- 17 -

implementation of food waste management should consider not only cost effectiveness,
but also effects on environments and communities (Wie et al., 2003).
Barriers for Making Decisions
The literature describes many successful stories concerning composting food
waste and regenerating energy from it, but these stories also reveal some barriers. There
is also little information about the awareness and willingness of foodservice
administrators to implement food waste management.
The Evans McDonough Company investigated the Castro Valley Food Scrap
Recycling Pilot Program and presented a focus group study. The study was completed in
November 2001. Even though the study was collecting data from the residents of Castro
Valley, CA, results carried a significant message to show reasons for not participating in
the food scrap recycling program that was available. Both participants and non
participants of the food scrap program were interested and aware of its importance even
though they could not clearly explain why they were participating in the program. They
also had the same attitudes toward the program. However, non-participants tended to
give up quickly as soon as they found any problems or inconvenience caused by food
scraps. The problems were the lack of clear benefits and high concerns about hygiene,
rodents, and odors (The Evans McDonough Co., 2002).
The Evans McDonough Company also collected telephone survey data from
residents of four cities in Alameda County, CA where food scrap recycling programs
were established 3-4 years before the survey (n=817) in 2004. The telephone survey was
- 18 -
performed for two weeks from April 29 to May 11, 2004. The main reasons for not
participating in the program were inconvenience (30% ), odor/smell (23% ),
rodents/flies/bugs (16% ), yard compost (11 % ), hygiene issues (11 % ), and insufficient
waste (10%). There were also residents who didn't know (10%) or didn't have enough
information about the program (The Evans McDonough Co., 2004 ).
Another report was presented by The Center for Ecological Technology (CET) in
collaboration with Massachusetts Department of Environmental Protection (DEP) three
years before the Castro Valley County Focus group study. The CET in collaboration
with Massachusetts DEP put efforts on food waste diversion including education,
regulation, funding, and technical assistance. The study results addressed the opportunity
to develop a food waste management program in the counties, primarily due to the
limited disposal capacity and the economic benefits. However, there were also several
barriers to executing the food waste programs. These included (a) lack of physical
availability of the processing sites (including composting units) located a long distance
from the waste generators, (b) high demands of labor, space and care, (c) high
contamination of food waste for livestock with plastics or non-edible waste, (d) "Not In
My Back Yard (NIMBY)" attitude of residents, (e) difficulty in handling wet, odorous
food waste, (f) inconsi tent governmental and financial support or incentives, (g)
inconsistent upply of food waste to processing sites, and (h) no strong vision or
proactive actions from state government (CET, 1999).
- 19 -

Results from the California and Massachusetts waste agencies were based on the
consumers in their areas. College and university foodservice operations may produce a
larger quantity of food waste and send it to processing sites more consistently than
households. Having a consistent supply of a large quantity of foods is an important factor
when using animal feeding and composting methods (Department of Hotel, Restaurant,
Institution Management and Dietetics, Kansas State University, 2002).
Research Methods
Focus Group
Focus groups are a qualitative research method. A focus group typically consists
of 8 to 10 qualified participants who have a face to face discussion on a specific topic.
However, various types of focus groups can be developed using the technology of
telephone, video or internet. The moderator of a focus group discussion should have the
ability to learn quickly, experience, organizational skills, flexibility, good memory, good
listening skills, strong probing skills, good speaking skills, and time management skills
(Edmunds, 1999).
Focus group research is flexibly structured, but results are closely connected to
the research objectives and in-depth understanding of a specific topic. Focus group
discussion is often used to evaluate new marketing or research concepts, design survey
questionnaires, generate hypotheses, and process brainstorming (Abusabha & Woelfel,
2003). However, it is not designed for drawing a final decision on specific topics, but for
obtaining valuable feedback or quotations from the participants.
- 20-
Survey
A survey is a cross-sectional research method used to obtain opinions, attitudes,
and knowledge on a specific topic from a large group of individuals. The population can
be stratified into several subgroups according to certain criteria such as size of facility
and type of management. Results of a survey can be quantified from statistical data
analyses without bias.
Researchers should have a certain amount of data in order to derive qualified and
reliable results from survey. Power analysis is commonly used to determine the size of
sample needed to evaluate the accuracy and reliability of statistical analysis and to detect
the effect or significant difference between and/or among groups. A well qualified
survey will use random samples and blinding to avoid bias. However, surveys can also
be collected from all individuals in a certain targeted group (Abusabha & Woelfel, 2003).
- 21 -

CHAPTER ill
METHODOLOGY
Institutional Review Board
All methods used in this study were reviewed and approved by the Institutional
Review Board at Texas Woman's University prior to commencing research activities. A
copy of an approval letter from the Institutional Review Board at Texas Woman's
University is attached (See Appendix I).
Focus Group
Focus group methods were used to obtain qualitative background information on
the issue of food waste management in college and university foodservice operations.
The focus group process followed methods recommended by Edmunds (1999). First,
foodservice administrators' contact information was collected from web site of colleges
and universities that participated in the 2008 RecycleMania competition in Texas. In
order to recruit participants, the researcher sent e-mails and called each candidate. Due to
the short number of participants from the 2008 RecycleMania competition pool,
researchers contacted foodservice administrators in colleges and universities in the North
Texas area by telephone as well.
The researcher prepared a script with open ended questions and a suggested time
line (See Appendix II). The focus group script included five parts: opening with brief
description of each participant's foodservice operation, introduction covering the purpose
- 22 -

and topics for the focus group discussion, transitional questions about past experience
concerning food waste management, discussion of advantages and disadvantages of food
waste management programs, and an ending question about future plans and additional
comments about food waste management. A group of foodservice professionals and
educators reviewed and evaluated the script and questions. The researcher modified the
script and questions accordingly.
A total of seven participants were recruited from administrators at colleges and
universities in the Dallas and Houston areas. Participants included three foodservice
administrators who participated in the 2008 RecycleMania competition. Focus group
discussions were held on two different dates. Each session was a directed 45 to 60
minute discussion of factors, attitudes and barriers impacting food waste management at
colleges and universities. The first focus group which included foodservice
administrators from both Denton and Houston was held by videoconference and
recorded. The second focus group was held only on the TWU Denton Campus and the
discussion was tape-recorded. Following each focus group discussion, each participant
was mailed a $50.00 gift certificate. The recorded discussions were transcribed, and
analyzed to determine key messages.
- 23 -

Survey
Survey Instrument
Based on focus group results and a review of literature, the researcher developed a
questionnaire that included (a) demographic information about foodservice
administrators, (b) characteristics of foodservice operations, ( c) operational factors
affecting food waste such as use of disposables, forecasting, type of food production and
service, menu and portion control, ( d) use of various foodservice management activities
to manage food waste, and ( e) attitudes concerning food waste disposal methods and
barriers to implementing them. A Likert-type 5 point-scale ranging from very unlikely to
very likely was used to measure effectiveness of various foodservice activities for
managing food waste. Another Likert-type scale ranging from strongly agree to strongly
disagree was used to measure attitudes concerning food waste disposal. Questionnaires
were validated by three foodservice educators for content validity and clarity of
administrators.
The online pilot survey form was prepared and sent to 33 voting delegates of the
National Association of College and University Food Services (NACUFS) in Texas and
Oklahoma. A total of 11 participants attempted to participate in the online survey. At the
end of the survey, participants were asked to indicate the time and/or any difficulties in
completing the survey. A total of six surveys were collected and verified for clarity and
feasibility of questionnaires. Cronbach's alpha test was applied to evaluate the inter-item
reliability of Likert-type scale questions.
- 24 -

Sample Selection
College/university foodservice administrators who are voting delegates of the
National Association of College and University Food Services (NACUFS) were included
in the on-line and mail surveys. The mailing list for voting delegates of NACUFS which
was purchased from NACUFS included foodservice administrators who reside in the U.S.
and Canada. G* power was used to calculate minimum sample size. For initial
estimation of 15 items and one predictor with two levels, a power of .95 and alpha of .05
and a moderate effect size (F = .25), a minimum sample size of 125 was needed.
Data Collection
The questionnaire was converted to an online survey using PsychData (State
College, PA, PsychData™ LLC)provided by Texas Woman's University. A cover letter
that included a web page link to the survey was e-mailed to 591 NACUFS foodservice
administrators who provided e-mail addresses. Two follow-up e-mails were sent in two
weeks to increase the participation rate. At the same time, a cover letter (See Appendix
ill) and printed questionnaire (See Appendix IV) were sent to NACUFS foodservice
administrators who had not yet responded. Three weeks after the postal mailing, a
follow-up post card was sent to non-respondents to increase the participation rate.
Planned Data Analysis
The Statistical Package for the Social Sciences for Windows® (SPSS Inc,
Chicago, IL, v 15.0) was used for data analyses. Descriptive statistics were used to
summarize data related to demographics, foodservice operation characteristics,
- 25 -

operational factors, and food waste methods. Number of meals served was divided into
four groups:~ 5,999, 6000-14,999, 15,000-39,999 and 2'.: 40,000. Most foodservice
administrators were in their 40s and 50s so age was also divided into two groups: :S 49
years and 2'.: 50 years in order to have comparable number of data in each group.
Analyses of variance (ANOVA) were performed to test for differences in attitudes and
barriers among more than three categories including number of meals served. A student
t-test was used to test differences in attitudes and barriers between selected and non
selected for variables such as use of traditional meal plan and use of information from
government web page. Multivariate analysis of variance (MANOVA) was applied to test
for differences in attitudes and barriers depending on number of meals and experience of
foodservice administrators in foodservice operations.
- 26 -

CHAPTER IV
RESULTS
Focus Group Discussions
A total of seven college and university foodservice administrators participated in
focus group discussion sessions, five in a first session at 1 :30 pm on Sep 26, 2008 and
two in a second session at 1 :30 pm on Oct 3, 2008. Based on results of focus group
discussions, the researchers modified the questionnaire by deleting questions on issues
unrelated to food waste management and other questions that foodservice administrators
might not have been able to answer. In addition, the focus group discussion reconfirmed
foodservice management practices to reduce food waste, methods of food waste disposal,
and barriers to food waste management.
The focus group discussion participants served from 4,000 to 35,000 meals per
week. Three of them were working in contract managed foodservice operations and the
rest them were working in self operated operations. Most foodservice administrators
already implemented recycling programs for cardboard and paper goods, but had not
extensively implemented food waste management programs.
Foodservice administrators shared information about several food waste
management methods such as composting, donating food scraps to farmers for animal
feeding, putting trash bins to collect food scraps, going trayless, and recycling vegetable
- 27 -
oil to generate energy. The participants agreed that there is no best method for all
foodservice operations because each food waste disposal method has advantages and
disadvantages. They also agreed that food waste management programs should continue
because the advantages outweighed the disadvantages. Their attitude towards food waste
management programs was very positive.
However, here are some interesting quotes related to barriers against
implementing food waste management mentioned during focus group discussions.
Lack of Resources
"We can't do it. We need to make a partnership with garbage collectors. However, no
one in Dallas will pick up food waste for composting."
"Our community would not allow sites for composting"
"A pulper is an expensive system for food waste management. It needs to be installed in
a new building. Mostly, it does not work in an old building. Who's going to pay for it?"
Complicated Governmental Regulations
"Composting for me? It is not even an option for a medical center because we are a
research facility. There is a major FDA rule against it. I cannot do anything like that."
"We had 55 gallons of food and hog farmers picked those up a long time ago. However,
the Food Drug Administration and USDA put a little bit stricter guidelines on the
farmers. They started to require them to boil the food scraps and kill the pathogens
before they gave them to animals. Of course, small size farmers do not have any facility
to be able to do this, and they quit collecting the food waste."
- 28 -

Lack of Space in the Facility
"If you happen to get just one delivery over a week, you will have some waste or
spoilage."
Liability for Donated Leftover Foods
"All the Good Samaritan laws may shield you from some of them, but there is public
opinion as well. All of sudden, somebody on television is saying that they got lunch from
my operation and now everybody is sick."
Pilot Survey
The response rate for the pilot online survey was 18.2% (6/33). According to
pilot participants, the average time to complete the survey was 13.2±5.36 min, and the
main difficulty was questions that asked for too much detailed data about the foodservice
operations.
Cronbach' s alpha test was conducted to evaluate the reliability of the Likert type
questions. Results showed that a set of questions for foodservice activities to reduce the
amount of food waste was reliable (Cronbach's a=0.928, n=9). Another set of questions
regarding effective methods of food waste disposal was also reliable (Cronbach' s
a=0.860, n=7).
However, the Cronbach's a test results varied in the set of Likert type questions
for barriers in food waste management at each facility partly due to the small number of
data for analysis. Considering difficulties to obtain sufficient number of data, any set of
- 29 -

questions with Cronbach's a value higher than 0.500 was accepted after researchers
consulted with a statistician.
According to the Cronbach' s a test, the researchers removed five of 23 questions
for the section concerning barriers, but kept one question by itself concerning public
image and food waste management. The removed questions were (a) we do not believe
the nutrition quality of food waste is appropriate for animals, (b) there are no farmers
who could use food waste for animals near our operation, ( c) there are no composting
sites near our operation, and ( d) there are potential problems with food waste
management programs such as odor, rodents, and insects.
The barriers section with 19 questions was separated into four parts for
Cronbach's a analysis. The first part included eight questions regarding operational
problems (Cronbach's a=0.641, n=8), which are (a) the amount of food waste from our
operation is not enough to implement a specific food waste management plan, (b) we are
satisfied with our current food waste program, ( c) lack of resources about food waste
management discouraged us, ( d) employees/customers do not like to separate food waste
from soiled dishes and packaging, ( e) we were overwhelmed with the complicated
government requirements for food waste programs, (f) Our operation does not donate
foods to nonprofit organizations because of potential liability issues, (g) we have very
limited space to store food items for donation, and (h) food waste management is not a
current priority issue in our operation.
- 30 -

The second part with four questions related to financial resources and
administrative support included (a) we do not see the cost benefits of a food waste
program (s), (b) we do not have the financial resources to initiate a food waste program in
our operation, ( c) my administrators ( or headquarters) are not willing to support a food
waste management program, and ( d) we do not have enough staff to initiate a food waste
management program (Cronbach's a=0.679, n=4).
· The third set of questions focused on difficulties with waste disposal methods.
They were (a) composting affects the environment through contamination of water
and air, (b) we do not want to have equipment such as a pulper because of equipment
maintenance, and ( c) we cannot use garbage disposals because of high sewer taxes and/or
state law (Cronbach's a=0.535, n=3).
The last group of questions covering lack of motivation included (a) we tried
several methods to reduce food waste in the past, but none of them were successful, (b)
the impact of food waste disposal on the environment is not our concern, and (c)
government regulations do not require us to have a specific food waste management
program (Cronbach's a=0.600, n=3).
National Survey
This tudy used both online and mailed surveys. Among 632 voting delegates of
NACUFS (the National Association of College and University Food Services), six were
international delegates and 35 were in Texas and Oklahoma. E-mails were sent to 591
college and university foodservice administrators who had e-mail addresses on the - 31 -

mailing list in the United States and Canada. After receiving 36 complete and 30
incomplete online surveys, a cover letter and printed survey form were mailed to the
remaining 555 delegates who resided in the United States. Thirty six NACUFS delegates
resided in Canada were not included in the mailed survey due to postage cost. Including
27 mailed surveys returned, there were a total of 93 surveys submitted (return rate =
15% ), but only 63 data had complete data (usable data return rate = 10% ). There were no
returned envelopes due to wrong addresses.
Demographic Characteristics of Respondents
The majority of survey respondents were male (73%) and between ages 40 to 59.
Their mean work experience was 13.8 years in college and university foodservice
operations and 26.6 years in any foodservice operation. Approximately half of the
respondents had a bachelor's degree. Other education included some college and a
degree from a culinary institute. Respondents indicated that they obtained information
about food waste management from various sources including college and university web
pages, professional journals, trade journals, and waste management companies. Few
used governmental web pages as a source of information (See Table 1 ). Respondents
were asked to indicate their level of interest in both solid waste management and food
waste management on a scale ranging from 1 (not interested) to 5 (very interested).
Mean level of interest were 4.06 ± 1.01 for solid waste management and 4.10 ± 1.07 for
food wa te management.
- 32 -

Table 1 Demographic Characteristics of Foodservice Administrators (N=63)
Gender Male Female
Age 20-29 30-39 40-49 50-59 ~ 60
Years of experience
College and university foodservice
All foodservice
Education
Associate degree
Bachelor's degree
Master's degree
Doctoral degree
Other
Source of information about food waste management*
College and university web pages
Professional journals
Trade journals
Waste management company
Governmental web pages
n 46 17
n 2 7
24 25
5
Mean±SD
13.8±10.3
26.6±9.8
n
7
32
17
1
6
n
41
39
37
24
8
I do not obtain any information about food waste management 6
SD=Standard Deviation * The total number of responses exceeds total N because respondents were asked to check all that apply.
- 33 -

Characteristics of Foodservice Operations
An average of 28,720 meals were served weekly at foodservice operations
represented by respondents. The mean number of catering events per week was 48.5
which represented an average of 1,345 catered meals weekly. A total of 47 out of 63
foodservice administrators responded that they have residential dining halls.
About one-third of the respondents' foodservice operations were contract
managed and the rest were self operated. Other types of foodservice operations were not
clearly identified by the respondents. Meal plans were approximately evenly distributed
between traditional, cash-based, and combination of traditional and cash based meal
plans. Fifteen schools that had other meal plans stated that their meal plans were a
mandatory unlimited meal plan, no meal plan, or all meals included in tuition. Nearly all
respondents used cook to serve and cook to order production systems while
approximately one fifth of respondents used cook-chill. One respondent listed in-store
fast food restaurant under "other" methods of production (See Table 2).
The frequency of collecting food waste was 14.8 times per month which was
similar to the frequency of collecting packaging waste (15.3times/month). The cost for
collecting waste was also the same for package waste ($1,317 /month) and food waste
($1, 180/month). However, food waste was more than four times heavier in weight and
one half the volume of package waste (See Table 3).
- 34 -

Table 2 Characteristics of College and University Foodservice Operations (N=63)
Mean+SD
Average number of meals or meal equivalents served/week 28,720 ± 33,765
Average number of catering events/week
Average meals served for catering/week
48.5 ± 94.5
1,345 ± 2,710
Residential dining halls
Type of managements Contract managed Self operated Others
Meal plansa Traditional meal planb
Combination of traditional and cash based meal plans Cash-based meal plane
Other
Type of foodservice productiona Cook to served Cook to ordere Assembly server Cook-chillg Other
a The total number of responses exceeds N because respondents were asked to
check all that apply. b Traditional meal plan: set number of meals per week or per semester c Cash-based meal plan: cash deposit or credit card ct Cook to serve: cook and hold food at serving line e Cook to order: receive order from customers and cook food right at serving line r Assembly serve: reheat and serve already prepared foods g Cook-chill: cook, cool, refrigerate, reheat and serve foods SD=Standard Deviation
- 35 -
n 47
n 20 41
2
n 26
21 19
15
n 59 56 40 12
1

Table 3 Characteristics of Waste Produced in College and University Foodservice Operations (N=63)
Frequency of waste collection (times/month)
Cost for waste disposals ($/month)
Waste by weight (lbs/month)
Waste by volume ( cu ft/month)
SD=Standard Deviation
Package Waste
Mean±SD
15.3 ± 12.6
1,317 ± 2,524
4,648 ± 6,942
12,707 ± 39,657
Foodservice Management Activities to Reduce Food Waste
Food Waste
Mean±SD
14.8 ± 13.6
1,180 ± 1,482
19,598 ± 24,728
617.3 ± 543.5
Respondents were asked to rate how likely eight foodservice management
activities would be to reduce food waste on a 5-point scale ranging from 1 (very unlikely)
to 5 (very likely). The four activities receiving the highest likeliness ratings were:
educate customers to reduce food waste ( 4.51±0.69), modify food production practices
( 4.33±0.98), use a computer program to have accurate forecasting and managing food
production, (4.26±1.05) and train employees to separate food waste and packaging
(4.17±1.08). Changing menu planning was considered the least likely to reduce food
waste (3.61±0.69). Others included that they had in practice all of the above, discussed
with distributors to share concerns about excess packaging, and weighed food waste to
manage food waste from the facilities (See Table 4 ).
- 36 -

Type of management and existence of residential area. A student t-test showed
no significant difference in attitudes of respondents regarding likeliness of suggested
foodservice management activities to reduce food waste between contract-managed and
self-operated foodservice operations (See Table 5). There was also no significant
difference in perceptions between administrators whose facilities had residential dining
halls and those who did not (See Table 6).
Table 4 College and University Foodservice Administrators ' Perceptions of Likeliness of Foodservice Management Activities to Reduce Food Waste
Foodservice Management Activities
Educate customers to reduce food waste
Modify food production practices to reduce food waste ( ex. change to small batch size, improve use of leftovers)
n
63
63
Use a computer program to have accurate forecasting and 61 managing food production
Train employees to separate food waste and packaging 60 ( ex. animal feeds, composting)
Change service methods to reduce food waste 62 ( ex. tray less, charge by item style cafeteria)
Adjust portion sizes to reduce food waste 62
Put a trash bin to collect food scraps for food waste 61 program ( ex. animal feeds, composting)
Change menu planning to reduce food waste ( ex. reduce 62 number of menu items produced, reduce portion size)
Mean± SD
4.51 ± 0.69
4.33 ± 0.98
4.26 ± 1.05
4.17±1.08
4.06 ± 1.23
4.00 ± 1.06
3.72 ± 1.27
3.69 ± 1.42
3.61 ± 0.92
Likeliness scales: 1, very unlikely; 2, unlikely; 3, unsure; 4, likely; 5, very likely SD = Standard Deviation
- 37 -

VJ \0
Table 6 College and University Foodservice Administrators' Perceptions of Likeliness of Foodservice Management Activities to Reduce Food Waste according to the Existence of Residential Dining Hall (N=63)
Foodservice Management Activities
Educate customers to reduce food waste
Modify food production practices to reduce food waste
Use a computer program for accurate forecasting
Train employees to separate food waste and packaging
Change service methods to reduce food waste
Adjust portion sizes to reduce food waste
Put a trash bin to collect food scraps for food waste program
Change menu planning to reduce food waste
Likeliness according to Residential Dining Halls YES NO
(n=47) (n=16) Mean± SD Mean±SD
4.57 ± 0.62 4.31 ±0.87
4.40 ± 0.90 4.13 ± 1.20
4.39 ± 0.93 3.87 ± 1.30
4.09 ± 1.03 4.38 ± 1.20
4.21 ± 1.14 3.60 ± 1.40
4.11 ± 0.94 3.67 ± 1.35
3.78 ± 1.24 3.56 ± 1.37
3.62 ± 1.45 3.93 ± 1.34
Likeliness scales: 1, very unlikely; 2, unlikely; 3, unsure; 4, likely; 5, very likely Statistical significance was analyzed by student t-test SD= Standard Deviation
t p
1.314 0.194
0.980 0.331
1.712 0.092
-0.903 0.370
1.711 0.092
1.178 0.254
0.581 0.564
-0.748 0.457

Number of meals served weekly. For purposes of statistical analyses, respondents
were divided into four groups according to number of meals served:~ 5,999, 6,000-
14,999; 15,000-39,999, and 2:40,000 meals per week. Analyses of variance for multiple
comparisons using Scheffe's method showed that those who served a larger number of
meals felt that food production modification and computer use for accurate forecasting
would be more likely to reduce food waste (See Table 7).
Type of meal plan. Three types of meal plans were traditional meal plan, cash
based meal plan and combination of traditional and cash based meal plans. A traditional
meal plan is a plan with a set number of meals per week or per semester, whereas a cash
based meal plan is a plan with a cash deposit or credit card. Colleges and universities
also frequently offer combination plans that allow students to eat a set number of meals
per week and also have a cash-balance for additional meals. Foodservice administrators'
perceptions of the likeliness of foodservice management activities to reduce food waste
were not significantly different between those who offered a traditional meal plan and
those who did not. However, administrators who offered a cash-based meal plan
perceived that adjusting portion size, was significantly more likely (p=0.033) to reduce
food waste than those who did not offer cash-based meal plans. There were no
significant differences in perception of the likeliness of foodservice management
activities to reduce food waste between those who offered a combined traditional and
cash-based meal plan and those who did not (See Table 8).
- 40-

~ ......
Table 7 College and University Foodservice Administrators ' Perceptions of Likeliness of Foodservice Management Activities to Reduce Food Waste according_ to Number of_ Meals Served Weekly__ (N=62)
Number of Meals Served Weel<ly
:S 5,999 6,000-14,999 15,000-39,999 ~ 40,000 (n=l4) (n=16) (n=l 7) (n=l5)
Foodservice Management Activities Mean± SD Mean±SD Mean±SD Mean ±SD F p
Educate customers to reduce food 4.21 ± 0.70 4.69 ±0.48 4.71 ± 0.47 4.33 ± 0.98 2.062 0.115 waste
Modify food production practices to 3.50 ± 1.35a 4.38 ± 1.03b 4.82 ± 0.39b 4.47 ± 0.52b 5.995 0.001 * reduce food waste
Use a computer program for 3.50 ± 1.40a 4.13 ± 0.92ab 4.75 ± 0.45b 4.53 ± 0.92b 4.771 0.005* accurate forecasting
Train employees to separate food 4.14 ± 1.17 4.25 ± 1.13 4.27 ± 1.10 3.93 ± 1.00 0.289 0.833 waste and packaging
Change service methods to reduce 3.50 ± 1.56 3.88 ± 1.20 4.59 ± 0.80 4.14 ± 1.17 2.290 0.088 food waste
Adjust portion sizes to reduce food 3.36 ± 1.28 4.00 ± 1.16 4.35 ± 0.70 4.14 ± 0.86 2.640 0.058 waste
Put a trash bin to collect food scraps 3.71 ± 1.33 3.56 ± 1.37 3.94 ± 1.06 3.57 ± 1.40 0.288 0.834 for food waste program
Change menu planning to reduce 3.36 ± 1.50 3.63 ± 1.50 3.59 ± 1.58 4.14 ± 1.03 0.756 0.524 food waste
Likeliness scales: 1, very unlikely; 2, unlikely; 3, unsure; 4, likely; 5, very likely * Statistical significance at P value :S 0.05 by ANOVA with multiple comparisons using Scheffe's method; Different alphabetic superscript letters are significantly different from each other (P:S 0.05 between groups, ANOV A); SD = Standard Deviation

Table 8 College and University Foodservice Administrators' Perceptions of Likeliness of Foodservice Management Activities to Reduce Food Waste according_ to Meal Plan (N=63)
Traditional Meal Plan
Foodservice Management Activities Educate customers to reduce food waste Modify food production practices to reduce food waste Use a computer program for accurate forecasting Train employees to separate food waste and packaging Change service methods to reduce food waste Adjust portion sizes to reduce food waste
-+:>- Put a trash bin to collect food scraps for food waste program N Change menu planning to reduce food waste
YES (n=26) Mean±SD
4.38 ± 0.70 4.35 ± 0.89 4.16 ± 0.99 3.92 ± 1.09 4.12 ± 0.99 3.92 ± 0.84 3.73 ± 1.19 3.54 ± 1.39
NO (n=37) Mean±SD
4.59 ± 0.69 4.32 ± 1.06 4.33 ± 1.10 4.35 ± 1.04 4.03 ± 1.38 4.06 ± 1.19 3.71 ± 1.34 3.81 ± 1.45
Cash-based Meal Plan YES (n=19) NO (n=44)
Educate customers to reduce food waste 4.58 ± 0.69 4.48 ± 0.70 Modify food production practices to reduce food waste 4.58 ± 0.61 Use a computer program for accurate forecasting 4.39 ± 0.98 Train employees to separate food waste and packaging 4.16 ± 1.07 Change service methods to reduce food waste 4.17 ± 0.99 Adjust portion sizes to reduce food waste 4.44 ± 0.71 Put a trash bin to collect food scraps for food waste program 4.00 ± 1.20 Change menu planning to reduce food waste 4.11 ± 1.28 Likeliness scales: 1, very unlikely; 2, unlikely; 3, unsure; 4, likely; 5, very likely * Statistical significance at P value :S 0.05 by student t-test. SD= Standard Deviation
4.23 ± 1.10 4.21 ± 1.08 4.17 ± 1.09 4.02 ± 1.32 3.82 ± 1.13 3.60 ± 1.29 3.52 ± 1.46
t p
1.189 0.239 -0.086 0.932 0.633 0.529 1.551 0.126
-0.275 0.784 0.484 0.611
-0.050 0.960 0.727 0.470
t p
-0.532 0.597 -1.310 0.195 -0.608 0.546 0.043 0.966
-0.417 0.678 -2.185 0.033* -1.159 0.251 -1.495 0.140

..i:::,. U,)
Table 8 ( continued) College and University Foodservice Administrators' Perceptions of Likeliness of Foodservice Management Activities to Reduce Food Waste according_ to Meal Plan (N=63)
Foodservice Management Activities
Educate customers to reduce food waste
Modify food production practices to reduce food waste
Use a computer program for accurate forecasting
Train employees to separate food waste and packaging
Change service methods to reduce food waste
Adjust portion sizes to reduce food waste
Put a trash bin to collect food scraps for food waste program
Change menu planning to reduce food waste
Combination of Traditional and Cash-based Meal
Plans YES (n=21) NO (n=42)
Mean±SD Mean±SD
4.67 ± 0.58 4.43 ± 0.74
4.43 ± 0.81 4.29 ± 1.07
4.40 ± 1.00 4.20 ± 1.08
4.39 ± 0.92 4.07 ± 1.14
4.24 ± 1.22 3.98 ± 1.24
4.14 ± 1.01 3.93 ± 1.08
4.00 ± 1.16 3.60 ± 1.31
4.10 ± 1.18 3.49 ± 1.50
Likeliness scales: 1, very unlikely; 2, unlikely; 3, unsure; 4, likely; 5, very likely * Statistical significance at P value::; 0.05 by student t-test. SD= Standard Deviation
t p
-1.293 0.201
-0.540 0.591
-0.714 0.478
-1.048 0.299
-0.795 0.430
-0.760 0.450
-1.159 0.251
-1.745 0.087

Type of food production. College and university foodservice operations
frequently use several types of food production systems including cook to serve, cook to
order, cook-chill and assembly serve. With cook to serve production, foods are cooked
and held at a serving line. With cook to order, servers receive an order from a customer
and then cook foods right at the serving line. Cook chill is a food production method of
cooking that includes cooking, refrigerating for one or more days, reheating and serving
foods. Assembly serve production requires reheating and serving already prepared foods.
Table 9 shows results regarding the influence of cook to serve and cook to order
on college and university foodservice administrators' perception of the likeliness of
foodservice management activities to reduce food waste. No statistical analyses were
performed because there were not enough foodservice operations that did not use cook to
serve and cook to order for food production to make these analyses feasible. The
foodservice administrators' perceptions of likeliness of foodservice management
activities to reduce food waste showed no significant differences based on cook chill
and as embly serve methods of food production (See Table 9).
Source of information about food waste management. Because of the small
numbers of administrators who obtained no information about food waste management
and those who obtained information from government web pages, statistical analyses was
not conducted for thi data. Student t-tests showed no significant difference in
foodservice administrators' perception of likeliness of foodservice management activities
to reduce food waste between those who obtained information from college and
- 44 -
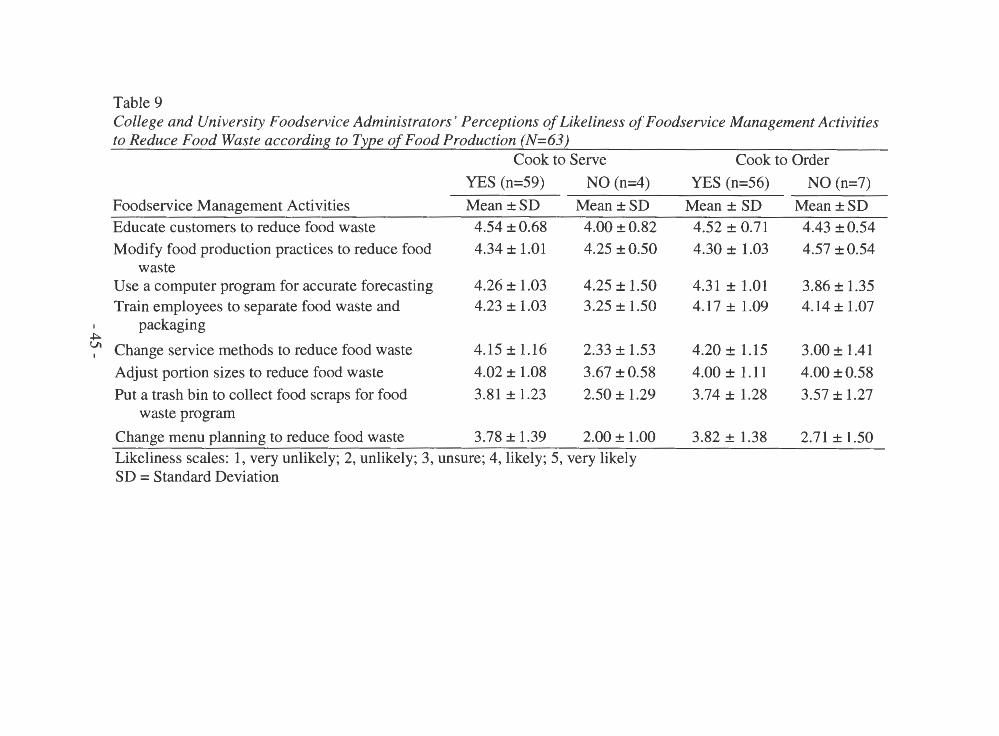
.j:::,..
Table 9 College and University Foodservice Administrators' Perceptions of Likeliness of Foodservice Management Activities to Reduce Food Waste according to Type of Food Production (N=63)
Cook to Serve Cook to Order
YES (n=59) NO (n=4) YES (n=56) NO (n=7)
Foodservice Management Activities Mean±SD Mean±SD Mean± SD Mean±SD Educate customers to reduce food waste 4.54 ±0.68 4.00 ±0.82 4.52 ± 0.71 4.43 ±0.54 Modify food production practices to reduce food 4.34 ± 1.01 4.25 ±0.50 4.30 ± 1.03 4.57 ±0.54
waste Use a computer program for accurate forecasting 4.26 ± 1.03 4.25 ± 1.50 4.31 ± 1.01 3.86 ± 1.35 Train employees to separate food waste and 4.23 ± 1.03 3.25 ± 1.50 4.17 ± 1.09 4.14 ± 1.07
packaging
'-;' Change service methods to reduce food waste 4.15 ± 1.16 2.33 ± 1.53 4.20 ± 1.15 3.00 ± 1.41
Adjust portion sizes to reduce food waste 4.02 ± 1.08 3.67 ±0.58 4.00 ± 1.11 4.00 ±0.58
Put a trash bin to collect food scraps for food 3.81 ± 1.23 2.50 ± 1.29 3.74 ± 1.28 3.57 ± 1.27 waste program
Change menu planning to reduce food waste 3.78 ± 1.39 2.00 ± 1.00 3.82 ± 1.38 2.71 ± 1.50 Likeliness scales: 1, very unlikely; 2, unlikely; 3, unsure; 4, likely; 5, very likely SD = Standard Deviation

I
Table 9 ( continued) College and University Foodservice Administrators' Perceptions of Likeliness of Foodservice Management Activities to Reduce Food Waste according to Type of Food Production (N=63)
Cook Chill YES (n=l2) NO (n=48)
Foodservice Management Activities Mean± SD Mean±SD t p
Educate customers to reduce food waste 4.50 ± 0.80 4.52 ± 0.65 0.095 0.925 Modify food production practices to reduce food waste 4.08 ± 1.38 4.40 ± 0.89 0.965 0.339 Use a computer program for accurate forecasting 4.27 ± 0.79 4.23 ± 1.13 -0.108 0.915 Train employees to separate food waste and packaging 4.36 ± 1.03 4.11 ± 1.10 -0.699 0.488 Change service methods to reduce food waste 3.92 ± 1.31 4.11 ± 1.24 0.468 0.641 Adjust portion sizes to reduce food waste 3.75 ± 1.42 4.02 ± 0.97 0.784 0.436
~ Put a trash bin to collect food scraps for food waste program 3.55 ± 1.21 3.72 ± 1.30 0.414 0.680 I Change menu planning to reduce food waste 3.83 ± 1.53 3.60 ± 1.42
Assembly Serve YES (n=40) NO (n=22)
Educate customers to reduce food waste 4.58 ± 0.64 4.45 ± 0.74 Modify food production practices to reduce food waste 4.30 ± 1.09 4.41 ± 0.80 Use a computer program for accurate forecasting 4.39 ± 0.92 4.05 ± 1.25 Train employees to separate food waste and packaging 4.22 ± 1.16 4.14 ± 0.94 Change service methods to reduce food waste 4.23 ± 1.11 3.77 ± 1.41 Adjust portion sizes to reduce food waste 4.03 ± 1.14 3.95 ± 0.95 Put a trash bin to collect food scraps for food waste program 3.79 ± 1.26 3.64 ± 1.33 Change menu planning to reduce food waste 3.79 ± 1.47 3.50 ± 1.37 Likeliness scales: 1, very unlikely; 2, unlikely; 3, unsure; 4, likely; 5, very likely SD = Standard Deviation
-0.508 0.613
t p
-0.674 0.503 0.412 0.682
-1.241 0.220 -0.274 0.785 -1.400 0.167 -0.248 0.805 -0.446 0.658 -0.770 0.445

university web pages and those who did not. However, those administrators who
obtained information about food waste management from a waste contract management
company perceived that putting a trash bin (p = 0.035) to collect food scraps for a food
waste program would be significantly more likely to reduce food waste. No significant
difference in foodservice administrators' perceptions of likeliness of foodservice
management activities to reduce food waste was found between those who obtained
information from both professional journals and trade journals compared to those who
did not (See Table 10).
- 47 -

Table 10 College and University Foodservice Administrators' Perceptions of Likeliness of Foodservice Management Activities to Reduce Food Waste according to Source of Infonnation about Food Waste Management (N=63)
I do not obtain any information about food waste management
YES (n=6) NO (n=55) Foodservice Management Activities Educate customers to reduce food waste Modify food production practices to reduce food waste Use a computer program for accurate forecasting Train employees to separate food waste and packaging Change service methods to reduce food waste Adjust portion sizes to reduce food waste
t; Put a trash bin to collect food scraps for food waste program • Change menu planning to reduce food waste
Mean±SD 5.00 ±0.00 4.50 ± 1.23 5.00 ±0.00 4.60 ±0.89 5.00 ±0.00 4.67 ±0.82 4.20 ± 1.79 4.33 ± 1.63
Mean±SD 4.46 ±0.70 4.32 ±0.97 4.18 ± 1.07 4.13 ± 1.09 3.96 ± 1.25 3.93 ± 1.06 3.68 ± 1.22 3.63 ± 1.40
Governmental Web Pages YES (n=8) NO (n=55)
Educate customers to reduce food waste 4.38 ± 0.74 Modify food production practices to reduce food waste 4.25 ± 1.17 Use a computer program for accurate forecasting 4.13 ± 1.46 Train employees to separate food waste and packaging 4.43 ± 0.79 Change service methods to reduce food waste 4.63 ± 0.74 Adjust portion sizes to reduce food waste 4.25 ± 0.71 Put a trash bin to collect food scraps for food waste program 3.86 ± 0.90 Change menu planning to reduce food waste 4.50 ± 0.76 Likeliness scales: 1, very unlikely; 2, unlikely; 3, unsure; 4, likely; 5, very likely SD= Standard Deviation
4.53 ±0.69 4.35 ±0.97 4.28 ±0.99 4.13±1.11 3.98 ± 1.27 3.96 ± 1.10 3.70 ± 1.31 3.57 ± 1.46

Table 10 ( continued) College and University Foodservice Administrators' Perceptions of Likeliness of Foodservice Management Activities to Reduce Food Waste according to Source of lnfonnation about Food Waste Management (N=63)
College and University Web Pages YES (n=41) NO (n=22)
Foodservice Management Activities Mean±SD Mean ±SD t p
Educate customers to reduce food waste 4.59 ± 0.67 4.36 ± 0.73 -1.216 0.229 Modify food production practices to reduce food waste 4.49 ± 0.78 4.05 ± 1.25 -1.729 0.089 Use a computer program for accurate forecasting 4.35 ± 1.00 4.10 ± 1.14 -0.901 0.371 Train employees to separate food waste and packaging 4.38 ± 0.90 3.75 ± 1.29 -1.941 0.062 Change service methods to reduce food waste 4.24 ± 1.07 3.71 ± 1.45 -1.631 0.108 Adjust portion sizes to reduce food waste 4.12 ± 0.90 3.76 ± 1.30 -1.277 0.206 Put a trash bin to collect food scraps for food waste program 3.95 ± 1.15 3.29 ± 1.38 -1.994 0.051
~ Change menu planning to reduce food waste 3.95 ± 1.22 3.19 ± 1.66 -1.856 0.073 \0
Waste Contract Management Company
YES (n=24) NO (n=39) Educate customers to reduce food waste 4.46 ± 0.83 4.54 ± 0.60 Modify food production practices to reduce food waste 4.50 ± 0.59 4.23 ± 1.16 Use a computer program for accurate forecasting 4.46 ± 0.78 4.14 ± 1.18 Train employees to separate food waste and packaging 4.50 ± 0.80 3.97 ± 1.17 Change service methods to reduce food waste 4.17 ± 1.03 4.00 ± 1.34 Adjust portion sizes to reduce food waste 4.09 ± 0.90 3.95 ± 1. 15 Put a trash bin to collect food scraps for food waste program 4.13 ± 1.01 3.47 ± 1.35 Change menu planning to reduce food waste 3.96 ± 1.19 3.54 ± 1.54 Likeliness scales: 1, very unlikely; 2, unlikely; 3, unsure; 4, likely; 5, very likely * Statistical significance at P value::; 0.05 by student t-test. SD = Standard Deviation
t 0.443
-1.218 -1.287 -1.863 -0.536 -0.495 -2.157 -1.198
p
0.659 0.228 0.203 0.067 0.594 0.622 0.035* 0.236

Table 10 ( continued) College and University Foodservice Administrators' Perceptions of Likeliness of Foodservice Management Activities to Reduce Food Waste according to Source of Information about Food Waste Management (N=63)
Professional J oumals YES (n=39) NO (n=24)
Foodservice Management Activities Mean±SD Mean±SD t p
Educate customers to reduce food waste 4.54 ± 0.60 4.46 ± 0.83 -0.443 0.659 Modify food production practices to reduce food waste 4.31 ± 1.03 4.38 ± 0.92 0.262 0.794 Use a computer program for accurate forecasting 4.16 ± 1.14 4.42 ± 0.88 0.926 0.358 Train employees to separate food waste and packaging 4.26 ± 1.04 4.00 ± 1.14 -0.879 0.383 Change service methods to reduce food waste 4.00 ± 1.29 4.17 ± 1.13 0.518 0.606 Adjust portion sizes to reduce food waste 4.00 ± 1.07 4.00 ± 1.06 0.000 1.000 Put a trash bin to collect food scraps for food waste program 3.79±1.17 3.59 ± 1.44 -0.601 0.550
~ Change menu planning to reduce food waste 3.76 ± 1.40 3.58 ± 1.47 -0.482 0.631 0
Trade J oumals YES (n=37) NO (n=26)
Educate customers to reduce food waste 3.81 ± 1.31 3.52 ± 1.58 Modify food production practices to reduce food waste 4.16 ± 1.09 4.58 ± 0.76 Use a computer program for accurate forecasting 4.20 ± 1. 11 4.35 ± 0.98 Train employees to separate food waste and packaging 3.86 ± 1.32 4.36 ± 1.04 Change service methods to reduce food waste 3.84 ± 1.17 4.24 ± 0.83 Adjust portion sizes to reduce food waste 4.41 ± 0.73 4.65 ± 0.63 Put a trash bin to collect food scraps for food waste program 4.14 ± 1.05 4.21 ± 1.14 Change menu planning to reduce food waste 3.73 ± 1.22 3.71 ± 1.37 Likeliness scales: 1, very unlikely; 2, unlikely; 3, unsure; 4, likely; 5, very likely * Statistical significance at P value :S 0.05 by student t-test. SD = Standard Deviation
t p
1.413 0.452 1.779 0.100 0.536 0.594 0.243 0.120 1.578 0.143 1.486 0.163
-0.064 0.809 -0.759 0.949

Methods of Food Waste Disposal
Foodservice administrators rated seven methods of food waste disposal on
likeliness to be effective based on a 5-point scale ranging from 1 (very unlikely) to 5
(very likely). Sending food scraps to a composting site (4.06±1.17) and using a food
pulper to reduce volume of food waste (3.93±1.20) were considered the most likely
effective methods. Donating non-perishable food for the needy population (3.31±0.95)
was considered the least likely to be effective. Other methods that sixteen respondents
listed likely to be effective included sending food waste to a vermiculture center and
recycling non-food items (See Table 11).
Table 11 College and University Foodservice Administrators' Perceptions of Effectiveness of Food Waste Disposal Methods
Food Waste Disposal Methods n Mean ± SD
Send food scraps to composting site ( s)
Use a food pulper to reduce the volume of the food waste
Use garbage disposals to dispose food to sewage system
Donate prepared food (ex. hot or cold foods) for the needy such as local food banks
Send food waste to landfill along with other solid waste
Donate food scraps to farmers for animal feed
Donate non-perishable food (ex. canned products) for the needy
Other
53
55
59
58
61
55
55
16
4.06 ± 1.17
3.93 ± 1.20
3.63 ± 1.41
3.41 ± 1.51
3.33 ± 1.40
3.11 ± 1.27
3.00 ± 1.47
3.31 ± 0.95
Likeliness scales: 1, very unlikely; 2, unlikely; 3, unsure; 4, likely; 5, very likely SD = Standard Deviation
- 51 -

Type of management and existence of residential area. There was no significant
difference between administrators of contract-managed and self-operated college and
university foodservice operations in perceptions of food waste disposal methods likely to
reduce food waste (See Table 12). However, there were significant differences between
college and university foodservice administrators who had residential dining halls
compared to those who did not. College and university foodservice administrators who
had residential dining halls felt that using a food pulper to reduce the volume of the food
waste (P=0.045) was more likely to be effective in reducing food waste from the
operations, whereas they considered sending waste to landfill along with other solid
waste (P=0.041) less likely to be effective (see Table 13).
Number of meals served weekly. Analysis of variance was used to determine
whether administrators' perceptions of effectiveness of food waste disposal methods
varied according to the number of meals served weekly. No significant difference was
found in college and university foodservice administrators' perceptions of effectiveness
of food waste disposal methods (See Table 14 ).
Age of foodservice administrators. There were significant differences when
college and university foodservice administrators' perceptions of food waste disposal
methods were compared based on age. For purpose of statistical analyses, administrators
were split into two groups, those 49 years and younger and those 50 years and older.
College and university foodservice administrators 49 years and younger perceived that
using garbage disposals to dispose food to the sewage system (P=0.038) and donating
- 52 -

food scraps to farmers for animal feed (P=0.034) were more likely to be effective
methods of reducing food waste than those age 50 years and older (Table 15).
Table 12 College and University Foodservice Administrators' Perceptions of Effectiveness of Food Waste Disposal Methods according to Type of Management (N=61)
Type of Management Contract-
Self-Operated Managed
(n=20) (n=41)
Food Waste Disposal Methods Mean ±SD Mean± SD t
Send food scraps to composting 4.00 ± 1.24 4.09 ± 1.18 0.258 site (s)
Use a food pulper to reduce the 4.06 ± 1.16 3.86 ± 1.24 -0.563 volume of the food waste
Use garbage disposals to dispose 4.05 ± 1.40 3.45 ± 1.39 -1.568 food to sewage system
Donate prepared food for the 2.89 ± 1.49 3.70 ± 1.43 1.974 needy such as local food banks
Send food waste to landfill along 3.50 ± 1.24 3.25 ± 1.50 -0.687 with other solid waste
Donate food scraps to farmers for 3.53 ± 1.35 2.94 ± 1.21 -1.625 animal feed
Donate non-perishable food for the 3.05 ± 1.35 2.91 ± 1.55 -0.332 needy
Likeliness scales: 1, very unlikely; 2, unlikely; 3, unsure; 4, likely; 5, very likely SD = Standard Deviation
- 53 -
p
0.797
0.576
0.122
0.053
0.496
0.110
0.741

Table 13 College and University Foodservice Administrators' Perceptions of Effectiveness of Food Waste Disposal Methods according to the Existence of Residential Dining Halls (N=63)
Food Waste Disposal Methods
Send food scraps to composting site (s)
Use a food pulper to reduce the volume of the food waste
Use garbage disposals to dispose food to sewage system
Donate prepared food for the needy such as local food banks
Send food waste to landfill along with other solid waste
Donate food scraps to farmers for animal feed
Donate non-perishable food for the needy
Residential Dining Halls YES NO
(n=47) (n=l6)
Mean ±SD Mean±SD
4.13 ± 1.13 3.86 ± 1.29
4.13 ± 1.09 3.40 ± 1.35
3.81 ± 1.37 3.13 ± 1.46
3.24 ± 1.48 3.88 ± 1.54
3.11 ± 1.43 3.94 ± 1.12
3.21 ± 1.26 2.88 ± 1.31
2.88 ± 1.45 3.36 ± 1.50
t p
0.742 0.461
2.055 0.045*
1.692 0.096
-1.449 0.153
-2.085 0.041 *
0.872 0.387
-1.057 0.295
Likeliness scales: 1, very unlikely; 2, unlikely; 3, unsure; 4, likely; 5, very likely * Statistical significance at P value s 0.05 by student t-test. SD= Standard Deviation
- 54 -

U\ U\
Table 14 College and University Foodservice Administrators' Perceptions of Effectiveness of Food Waste Disposal Methods according to Number of Meals Served Weekly(N=62)
Number of Meals Served Weekly
:'.S 5,999 6,000-14,999 15,000-39,999 2: 40,000 (n=l4) (n=16) (n=17) (n=l5)
Food Waste Disposal Methods Mean± SD Mean± SD Mean± SD Mean± SD F p
Send food scraps to composting 3.75 ± 1.42 3.92 ± 1.26 4.36 ± 1.08 4.08 ± 0.95 0.621 0.605 site (s)
Use a food pulper to reduce the 3.46 ± 1.51 3.86 ± 1.03 4.53 ± 0.83 3.67 ± 1.23 2.275 0.091 volume of the food waste
Use garbage disposals to dispose 4.08 ± 1.26 3.63 ± 1.15 3.20 ± 1.70 3.57 ± 1.51 0.892 0.451 food to sewage system
Donate prepared food for the 2.64 ± 1.55 3.56 ± 1.41 3.54 ± 1.56 3.79 ± 1.42 1.630 0.193 needy such as local food banks
Send food waste to landfill along 3.25 ± 1.77 3.50 ± 1.16 3.18 ± 1.43 3.27 ± 1.39 0.155 0.926 with other solid waste
Donate food scraps to farmers for 3.50 ± 1.57 2.80 ± 1.08 3.43 ± 1.09 2.62 ± 1.19 1.712 0.176 animal feed
Donate non-perishable food for the 2.64 ± 1.50 3.13 ± 1.30 2.83 ± 1.70 3.23 ± 1.42 0.460 0.712 needy
Likeliness scales: 1, very unlikely; 2, unlikely; 3, unsure; 4, likely; 5, very likely Statistical significance was analyzed by ANOVA with multiple comparisons using Scheffe's method SD = Standard Deviation

Table 15 College and University Foodservice Administrators' Perceptions of Effectiveness of Food Waste Disposal Methods according to Age of Foodservice Administrators (N=63)
Age
:S 49 years 2: 50 years (n=33) (n=30)
Food Waste Disposal Methods Mean±SD Mean±SD t Send food scraps to composting 4.00 ± 1.33 4.12 ± 0.97 -0.371
site (s)
Use a food pulper to reduce the 3.97 ± 1.30 3.88 ± 1.11 0.248 volume of the food waste
Use garbage disposals to dispose 4.00 ± 1.34 3.24 ± 1.41 2.123 food to sewage system
Donate prepared food for the 3.07 ± 1.57 3.79 ± 1.37 -1.850 needy such as local food banks
Send food waste to landfill along 3.26 ± 1.59 3.40 ± 1.19 -0.395 with other solid waste
Donate food scraps to farmers for 3.46 ± 1.26 2.74 ± 1.20 2.181 animal feed
Donate non-perishable food for the 2.86 ± 1.53 3.15±1.41 -0.733 needy
Likeliness scales: 1, very unlikely; 2, unlikely; 3, unsure; 4, likely; 5, very likely * Statistical significance at P value :S 0.05 by student t-test. SD = Standard Deviation
- 56 -
p
0.713
0.805
0.038*
0.070
0.694
0.034*
0.467

Type of meal plan. There were no significant differences in college and university
foodservice administrators' perceptions of effectiveness of food waste disposal methods
according to traditional meal plan and cash-based meal plan. However, those
administrators who offered a combination of traditional and cash-based meal plans felt
that donating food scraps to farmers for animal feed (P=0.004) was significantly less
likely to be an effective food waste disposal method than those who did not offer a
combination plan (See Table 16).
Type of food production. Due to the small number of colleges and universities not
using cook to serve and cook to order, statistical analysis was not conducted to compare
college and university foodservice administrators' perceptions of food waste disposal
methods based on use of these production methods. Student t-tests were used to compare
perceptions of effectiveness of food waste disposal methods for college and university
foodservice administrators between those who used cook chill and assembly serve type of
food production and those who did not. Administrators who used cook chill production
were significantly less likely (P=0.007) to feel that sending food waste to a landfill was
an effective method of food waste disposal (Table 17).
- 57 -

I
Table 16 College and University Foodservice Administrators' Perceptions of Effectiveness of Food Waste Disposal Methods according to Meal Plan (N=63)
Traditional Meal Plan YES (n=26) NO (n=37)
Food Waste Disposal Methods Mean±SD Mean±SD t p
Send food scraps to composting site (s) 4.09 ± 1.15 4.03 ± 1.20 -0.179 0.859 Use a food pulper to_ reduce the volume of the food waste 4.05 ± 0.95 3.85 ± 1.35 -0.635 0.528 Use garbage disposals to dispose food to sewage system 3.88 ± 1.30 3.46 ± 1.48 -1.147 0.257 Donate prepared food for the needy such as local food banks 2.96 ± 1.49 3.74 ± 1.46 1.978 0.053 Send food waste to landfill along with other solid waste 3.25 ± 1.23 3.38 ± 1.52 0.348 0.729 Donate food scraps to farmers for animal feed 2.91 ± 1.15 3.24 ± 1.35 0.951 0.346
~ Donate non-perishable food for the needy 3.00 ± 1.47 3.00 ± 1.48 0.000 1.000
Cash-based Meal Plan YES (n=l9) NO (n=44) t p
Send food scraps to composting site (s) 4.25 ± 1.07 3.97 ± 1.21 -0.790 0.433 Use a food pulper to reduce the volume of the food waste 4.19 ± 1.05 3.82 ± 1.25 -1.031 0.307 Use garbage disposals to dispose food to sewage system 3.88 ± 1.50 3.52 ± 1.38 -0.881 0.382 Donate prepared food for the needy such as local food banks 3.53 ± 1.66 3.37 ± 1.46 -0.372 0.711 Send food waste to landfill along with other solid waste 3.44 ± 1.38 3.28 ± 1.42 -0.418 0.677 Donate food scraps to farmers for animal feed 2.94 ± 1.44 3.18±1.21 0.637 0.527 Donate non-perishable food for the needy 3.41 ± 1.46 2.82 ± 1.45 -1.406 0.166 Likeliness scales: 1, very unlikely; 2, unlikely; 3, unsure; 4, likely; 5, very likely Statistical significance was analyzed by student t-test; SD = Standard Deviation

Table 16 ( continued) College and University Foodservice Administrators' Perceptions of Effectiveness of Food Waste Disposal Methods according_ to Meal Plan (N=63)
Combination of Both Plans
Food Waste Disposal Methods
Send food scraps to composting site (s)
Use a food pulper to reduce the volume of the food waste
Use garbage disposals to dispose food to sewage system
Donate prepared food for the needy such as local food banks
Ul Send food waste to landfill along with other solid waste \0
Donate food scraps to farmers for animal feed
Donate non-perishable food for the needy
YES (n=21)
Mean±SD
4.19 ± 1.17
3.76 ± 1.25
3.88 ± 1.36
3.16 ± 1.39
2.60 ± 1.50
3.44 ± 1.46
3.33 ± 1.33
Likeliness scales: 1, very unlikely; 2, unlikely; 3, unsure; 4, likely; 5, very likely * Statistical significance at P value :S 0.05 by student t-test. SD= Standard Deviation
NO (n=42)
Mean±SD
4.00 ± 1.18
4.00 ± 1.19
3.52 ± 1.44
3.54 ± 1.57
3.68 ± 1.21
2.97 ± 1.18
2.84 ± 1.52
t p
-0.533 0.596
0.669 0.507
-0.881 0.382
0.899 0.373
3.024 0.004*
-1.232 0.223
-1.181 0.243

Table 17 College and University Foodservice Administrators' Perceptions of Effectiveness of Food Waste Disposal Methods according to Type of Production (N=63)
Cook to Serve
YES (n=59) NO (n=4)
Food Waste Disposal Methods Mean±SD Mean±SD
Send food scraps to composting site (s) 4.12±1.15 3.00 ± 1.00
Use a food pulper to reduce the volume of 3.98 ± 1.21 3.25 ±0.96 the food waste
Use garbage disposals to dispose food to 3.67 ± 1.42 3.00 ± 1.41 sewage system
1 Donate prepared food for the needy such as 3.42 ± 1.50 3.33 ±2.08 °' o local food banks
Send food waste to landfill along with other 3.30 ± 1.40 3.75 ± 1.50 solid waste
Donate food scraps to farmers for animal 3.10 ± 1.27 3.25 ± 1.50 feed
Donate non-perishable food for the needy 3.06 ± 1.46 1.50 ±0.71
Likeliness scales: 1, very unlikely; 2, unlikely; 3, unsure; 4, likely; 5, very likely SD = Standard Deviation
Cook to Order
YES (n=56) NO (n=7)
Mean±SD Mean±SD 4.11 ± 1.15 3.67 ± 1.37
3.94 ± 1.23 3.86 ± 1.07
3.67 ± 1.45 3.29 ± 1.11
3.49 ± 1.48 2.60 ± 1.82
3.31 ± 1.40 3.43 ± 1.51
3.06 ± 1.33 3.43 ± 0.79
3.08 ± 1.45 2.00 ± 1.41

0\ ~
Table l7(continued) College and University Foodservice Administrators' Perceptions of Effectiveness of Food Waste Disposal Methods according to Type of Production (N=63)
Food Waste Disposal Methods Send food scraps to composting site ( s) Use a food pulper to reduce the volume of the food waste Use garbage disposals to dispose food to sewage system Donate prepared food for the needy such as local food banks Send food waste to landfill along with other solid waste Donate food scraps to farmers for animal feed Donate non-perishable food for the needy
Cook Chill YES (n=12) NO (n=48) Mean ±SD Mean±SD
4.20 ± 1.23 4.08 ± 1.10 3.90 ± 1.37 3.95 ± 1.19 3.27 ± 1.42 3.71 ± 1.43 3.17±1.53 3.53 ± 1.49 2.30 ± 1.34 3.58 ± 1.32 2.80 ± 1.23 3.24 ± 1.27 3.30 ± 1.34 2.95 ± 1.48
Assembly Serve YES (n=40) NO (n=22)
Send food scraps to composting site (s) 3.97 ± 1.24 4.22 ± 1.06 Use a food pulper to reduce the volume of the food waste 4.03 ± 1.24 3.80 ± 1.15 Use garbage disposals to dispose food to sewage system 3.92 ± 1.42 3.14 ± 1.32 Donate prepared food for the needy such as local food banks 3.29 ± 1.56 3.74 ± 1.41 Send food waste to landfill along with other solid waste 3.16 ± 1.42 3.59 ± 1.37 Donate food scraps to farmers for animal feed 3.29 ± 1.30 2.84 ± 1.21 Donate non-perishable food for the needy 3.03 ± 1.46 3.00 ± 1.53 Likeliness scales: 1, very unlikely; 2, unlikely; 3, unsure; 4, likely; 5, very likely * Statistical significance at P value :S 0.05 by student t-test. SD = Standard Deviation
t p
-0.315 0.754 0.122 0.904 0.916 0.364 0.755 0.454 2.794 0.007* 0.989 0.327
-0.678 0.501
t p
0.729 0.469 -0.673 0.504 -2.083 0.042 1.054 0.296 1.151 0.254
-1.227 0.225 -0.065 0.949

Source of information about food waste management. College and university
foodservice administrators' perceptions of likely effectiveness of food waste disposal
methods for those who did not use any source of information about food waste
management and those who used government web pages is summarized in Table 18. Due
to the small numbers of administrators who obtained no information about food waste
management and those who obtained information from government web pages, statistical
analyses was not conducted for that data.
Student t-tests showed that those who obtain information about food waste
disposal methods from college and university web pages believed sending food waste to
landfill along with other solid waste would be less likely to be an effective method
(P=0.001) compared to those who did not get information from college and university
web pages. Those administrators who obtained information about food waste from a
waste contract management company considered sending food scraps to composting
site(s) to be a more effective method than those who did not. There was no significant
difference in college and university foodservice administrators' perceptions of food waste
disposal methods based on source of information about food waste management from
either professional journals or trade journals (See Table 18).
- 62 -

Table 18 College and University Foodservice Administrators' Perceptions of Effectiveness of Food Waste Disposal Methods according to Source of Information about Food Waste Management (N=63)
Food Waste Disposal Methods Send food scraps to composting site ( s)
Use a food pulper to reduce the volume of the food waste
Use garbage disposals to dispose food to sewage system
1 Donate prepared food for the needy such as local 0\ w food banks
Send food waste to landfill along with other solid waste
I do not obtain any information about food waste management
YES (n=6) NO (n=55)
Mean±SD Mean±SD 5.00 ±0.00 3.98 ± 1.18
4.80 ±0.45 3.84 ± 1.22
4.20 ± 1.79 3.57 ± 1.38
3.60 ± 1.95 3.40 ± 1.49
4.17 ± 1.60 3.24 ± 1.36
Donate food scraps to farmers for animal feed 4.75 ± 0.50 2.98 ± 1.23
Donate non-perishable food for the needy 4.00 ± 1.73 2.90 ± 1.42
Likeliness scales: 1, very unlikely; 2, unlikely; 3, unsure; 4, likely; 5, very likely SD = Standard Deviation
Governmental Web Pages
YES (n=8) NO (n=55)
Mean± SD Mean±SD 4.00 ± 1.10 4.06 ± 1.19
3.67 ± 1.63 3.96 ± 1.15
3.43 ± 1.72 3.65 ± 1.39
2.29 ± 1.60 3.57 ± 1.45
3.57 ± 1.81 3.30 ± 1.36
3.33 ± 1.51 3.08 ± 1.26
3.00 ± 1.27 3.00 ± 1.50

Table 18(continued) College and University Foodservice Administrators' Perceptions of Effectiveness of Food Waste Disposal Methods to Source of Information about Food Waste Management (N=63)
College and University Web Pages YES (n=41) NO (n=22)
Food Waste Disposal Methods Mean±SD Mean±SD T p
Send food scraps to composting site ( s) 4.18±1.11 3.73 ± 1.28 -1.275 0.208 Use a food pulper to reduce the volume of the food waste 3.97 ± 1.22 3.82 ± 1.19 -0.426 0.672 Use garbage disposals to dispose food to sewage system 3.46 ± 1.43 3.95 ± 1.36 1.263 0.212 Donate prepared food for the needy such as local food banks 3.33 ± 1.49 3.58 ± 1.58 0.578 0.566 Send food waste to landfill along with other solid waste 2.95 ± 1.41 4.05 ± 1.07 3.394 0.001 *
Donate food scraps to farmers for animal feed 3.08 ± 1.28 3.18 ± 1.29 0.261 0.795 °' Donate non-perishable food for the needy 3.14 ± 1.42 2.72 ± 1.57 -0.980 0.332 ~
Waste Contract Management Company
YES (n=24) NO (n=39) Send food scraps to composting site ( s) Use a food pulper to reduce the volume of the food waste Use garbage disposals to dispose food to sewage system
4.43 ± 0.68 4.09 ± 1.15 3.27 ± 1.55
Donate prepared food for the needy such as local food banks 3.70 ± 1.22 Send food waste to landfill along with other solid waste 3.04 ± 1.43 Donate food scraps to farmers for animal feed 3.27 ± 1.24
Donate non-perishable food for the needy 3.20 ± 1.24
Likeliness scales: 1, very unlikely; 2, unlikely; 3, unsure; 4, likely; 5, very likely * Statistical significance at P value :S 0.05 by student t-test. SD = Standard Deviation
3.81 ± 1.36 3.82 ± 1.24 3.84 ± 1.30 3.23 ± 1.66 3.50 ± 1.37 3.00 ± 1.30
2.89 ± 1.59
t p
-2.190 0.033* -0.824 0.414 1.502 0.139
-1.230 0.224 1.241 0.220
-0.776 0.441 -0.762 0.449

Table 18( continued) College and University Foodservice Administrators' Perceptions of Effectiveness of Food Waste Disposal Methods according to Source of Information about Food Waste Management (N=63)
Professional J oumals
Food Waste Disposal Methods Send food scraps to composting site (s) Use a food pulper to reduce the volume of the food waste Use garbage disposals to dispose food to sewage system Donate prepared food for the needy such as local food banks Send food waste to landfill along with other solid waste Donate food scraps to farmers for animal feed
°' Donate non-perishable food for the needy Ul
YES (n=39) Mean ±SD
4.03 ± 1.09 3.86 ± 1.20 3.49 ± 1.43 3.32 ± 1.47 3.26 ± 1.39 3.19 ± 1.22 2.94 ± 1.47
NO (n=24)
Mean±SD 4.11 ± 1.33 4.05 ± 1.22 3.90 ± 1.37 3.60 ± 1.60 3.43 ± 1.44 2.95 ± 1.39 3.11 ± 1.49
Trade J oumals
YES (n=37) NO (n=26) Send food scraps to composting site ( s) 3.90 ± 1.30 4.27 ±0.94 Use a food pulper to reduce the volume of the food waste 3.68 ± 1.30 4.25 ± 0.99 Use garbage disposals to dispose food to sewage system 3.66 ± 1.33 3.58 ± 1.56 Donate prepared food for the needy such as local food banks 3.26 ± 1.54 3.63 ± 1.47 Send food waste to landfill along with other solid waste 3.19 ± 1.31 3.52 ± 1.53 Donate food scraps to f arm~rs for animal feed 3.03 ± 1.34 3.23 ± 1.19 Donate non-perishable food for the needy 2.97 ± 1.45 3.05 ± 1.53 Likeliness scales: 1, very unlikely; 2, unlikely; 3, unsure; 4, likely; 5, very likely Statistical significance was analyzed by t-test.; SD = Standard Deviation
t p
0.225 0.823 0.559 0.578 1.064 0.292 0.678 0.501 0.461 0.646
-0.682 0.498 0.384 0.703
t p
1.139 0.260 1.791 0.079
-0.195 0.846 0.893 0.376 0.892 0.376 0.559 0.578
0.186 0.853

Perceptions of Barriers Regarding Food Waste Management
College and university foodservice administrators were asked their level of
agreement regarding 19 statements relating to barriers concerning food waste
management based on a 5-point scale ranging from 1 (strongly disagree) to 5 (strongly
agree). The statements on focus were divided into four groups: operational management,
financial resources and administrative support, waste disposal methods, motivation and
public image.
Overall, college and university foodservice administrators showed a tendency not
to agree with these statements representing barriers to food waste management.
Statements with the highest level of agreement were: (a) we have very limited space to
store food items for donation (3.68±1.16), (b) government regulations do not require us to
have a specific food waste management program (3.49±0.86), and (c) employees/
customers do not like to separate food waste from soiled dishes and packaging
(3.29±1.07). Administrators also tended to agree with the statement "the public image of
our organization is an important influence on how we manage our food waste"
(3.75±1.08) (See Table 19).
Type of management. Student t-tests showed that foodservice administrators
working at contract managed foodservice operations had significantly higher level of
agreement with the statement related to liability issues (P=0.025), "our operation does not
donate foods to nonprofit organizations because of potential liability issues" than those
working at self-operated foodservice operations. There were no significant differences
- 66 -

in foodservice administrators' perceptions for other barriers regarding food waste
management based on type of management (See Table 20).
Table 19 College and University Foodservice Administrators' Perceptions of Barriers Regarding Food Waste Management
Operational Management We have very limited space to store food items for
donation.
Employees/customers do not like to separate food waste from soiled dishes and packaging.
Our operation does not donate foods to nonprofit organizations because of potential liability issues.
We were overwhelmed with the complicated government requirements for food waste programs.
Lack of resources about food waste management discouraged us.
We are satisfied with our current food waste program.
Food waste management is not a current priority issue in our operation.
The amount of food waste from our operation is not enough to implement a specific food waste management plan.
Financial Resources and Administrative Support We do not have the financial resources to initiate a food
waste program in our operation.
We do not have enough staff to initiate a food waste management program.
My administrators ( or headquarters) are not willing to support a food waste management program.
We do not see the cost benefits of a food waste program .
n Mean+ SD
60 3.68 ± 1.16
63 3.29 ± 1.07
63 2.95 ± 1.28
60 2.75 ± 0.88
63 2.71 ± 1.01
63 2.57 ± 1.00
63 2.25 ± 1.05
63 2.13 ± 0.89
63 2.94 ± 1.08
63 2.51 ± 1.01
63 2.44 ± 0.93
63 2.37 ± 0.96
Scales: 1, Strongly Disagree; 2, Disagree; 3, Neutral; 4, Agree; 5, Strongly Agree
SD = Standard Deviation
- 67 -

Table 19 (continued) College and University Foodservice Administrators' Perceptions of Barriers Regarding Food Waste Management
n Mean± SD Waste Disposal Methods
We do not want to have equipment such as a pulper 63 because of equipment maintenance.
We cannot use garbage disposals because of high sewer 63 taxes and/or state law.
Composting affects the environment through contamination 60 of water and air.
Motivation Government regulations do not require us to have a specific 63
food waste management program.
We tried several methods to reduce food waste in the past, 63 but none of them were successful.
The impact of food waste disposal on the environment is 63 not our concern
Public Image The public image of our organization is an important
influence on how we manage our food waste. 63
2.37 ± 1.07
2.24 ± 0.98
2.12 ± 0.85
3.49 ± 0.86
2.32 ± 0.69
1.60 ± 0.64
3.75 ± 1.08
Scales: 1, Strongly Disagree; 2, Disagree; 3, Neutral; 4, Agree; 5, Strongly Agree
SD = Standard Deviation
- 68 -

Table 20 College and University Foodservice Administrators' Perceptions of Barriers Regarding Food Waste Management according to TYPe of Management (N=61)
TyQe of Management
Operational Management We have very limited space to store food items for donation. Employees/customers do not like to separate food waste from soiled
dishes and packaging Our operation does not donate foods to nonprofit organizations
because of potential liability issues We were overwhelmed with the complicated government requirements
for food waste programs. $ Lack of resources about food waste management discouraged us.
We are satisfied with our current food waste program. Food waste management is not a current priority issue in our operation The amount of food waste from our operation is not enough to
implement a specific food waste management plan.
Financial Resources and Administrative Support We do not have the financial resources to initiate a food waste
program in our operation.
Contract-Managed (n=20)
Mean± SD
3.84 ± 1.02 3.50 ± 1.15
3.47 ± 1.31
2.95 ± 0.78
2.60 ± 1.00 2.65 ± 0.99 2.25 ± 1.07 2.25 ± 1.07
2.85 ± 1.09
We do not have enough staff to initiate a food waste management 2.45 ± 1.05 program.
My administrators (or headquarters) are not willing to support a food 2.30 ± 0.87 waste management program.
We do not see the cost benefits of a food waste ~am (s). 2.30 ± 0.98 Scales: 1, Strongly Disagree; 2, Disagree; 3, Neutral; 4, Agree; 5, Strongly Agree * Statistical significance at P value :'.S 0.05 by student t-test. SD = Standard Deviation
Self-Operated (n=41)
Mean± SD t p
3.56 ± 1.23 0.852 0.367 3.17 ± 1.00 1.152 0.254
2.67 ± 1.22 2.309 0.025*
2.56 ± 0.82 1.696 0.095
2.76 ± 1.02 -0.566 0.574 2.46 ± 0.98 0.698 0.488 2.29 ± 1.06 -0.148 0.883 2.29 ± 1.06 -0.594 0.555
2.98 ± 1.08 -0.424 0.673
2.49 ± 1.00 -0.136 0.892
2.54 ± 0.98 -0.920 0.361
2.41 ± 0.97 -0.431 0.668

--..J 0
Table 20 (continued) College and University Foodservice Administrators' Perceptions of Barriers Regarding Food Waste Management according to Type of Management (N=61)
Waste Disposal Methods We do not want to have equipment such as a pulper because of
equipment maintenance. We cannot use garbage disposals because of high sewer taxes and/or
state law.
Composting affects the environment through contamination of water and air.
Type of Management
Contract-Managed Self-Operated (n=20) (n=41)
Mean± SD Mean± SD
2.70 ± 1.13 2.24 ± 1.02
2.20 ± 0.83 2.27 ± 1.07
2.00 ± 0.88 2.08 ± 0.70
t p
1.584 0.119
-0.250 0.804
-0.359 0.721
• Motivation Government regulations do not require us to have a specific food
waste management program. We tried several methods to reduce food waste in the past, but none
of them were successful.
The impact of food waste disposal on the environment is not our concern
Public Image
3.35 ± 1.04
2.15 ± 0.59
1.55 ± 0.61
The public image of our organization is an important influence on 3.80 ± 1.11 how we manage our food waste.
Scales: 1, Strongly Disagree; 2, Disagree; 3, Neutral; 4, Agree; 5, Strongly Agree Statistical significance was analyzed by student t-test. SD = Standard Deviation
3.56 ± 0.78 -0.889 0.378
2.37 ± 0.70 -1.191 0.239
1.61 ± 0.67 -0.339 0. 736
3.76 ± 1.07 0.149 0.882

Number of meals served weekly. Analysis of variance using Scheff e's method
showed several significant differences in college and university foodservice
administrators' agreement on barrier statements regarding food waste management based
on numbers of meals served weekly. College and university foodservice operations
serving 5,999 or fewer meals per week had significantly stronger agreement with the
statement, "our operation does not donate foods to nonprofit organizations because of
potential liability issues" than those serving 40,000 or more meals served per week (See
Table 21).
College and university foodservice administrators serving from 6,000 to 15,000
meals per week more strongly agreed with a statement related to financial resources, "we
do not have the financial resources to initiate a food waste program in our operation" than
those serving 40,000 or more number of meals served per week. Administrators at
foodservice operations serving a smaller number of meals per week tended to have higher
level of agreement with the statement related to lack of resources. On the other hand,
college and university foodservice operations serving 40,000 or more meals per week
more strongly agreed with a statement related to food waste disposal methods, "we
cannot use garbage disposals because of high sewer taxes and/or state law" than those
serving from 6,000 to 15,000 meals per week. There was no significant difference in
college and university foodservice administrators' agreement with the statements related
to motivation and public image related to number of meals served (See Table 21).
- 71 -

-l N
Table 21 College and University Foodservice Administrators' Perceptions of Barriers Regarding Food Waste Management according to Number of Meals Served Weekly (N=62)
Operational Management We have very limited space to store food
items for donation. Employees/customers do not like to
separate food waste from soiled dishes and packaging
Our operation does not donate foods to nonprofit organizations because of potential liability issues
We were overwhelmed with the complicated government requirements for food waste programs.
Lack of resources about food waste management discouraged us.
We are satisfied with our current food waste program.
Food waste management is not a current priority issue in our operation
The amount of food waste from our operation is not enough to implement a specific food waste management plan.
:S 5,999 (n=14)
Mean± SD
3.86 ± 1.23
3.57±1.16
3.64 ± 1.15a
2.86 ± 0.86
2.79 ± 0.98
2.71 ± 1.14
2.36 ± 1.28
2.07 ± 0.83
Number of Meals Served Weeldy
6,000-14,999 15,000-39,999 (n=l6) (n=l 7)
Mean± SD Mean± SD
3.40 ± 0.99 3.87 ± 1.25
3.50 ± 1.03 3.06 ± 1.14
3.00 ± l.46ab 3.07 ± l.28ab
2.87 ± 0.83 2.60 ± 1.12
2.81 ± 1.05 2.59 ± 1.00
2.56 ± 1.15 2.53 ± 0.62
2.37 ± 1.26 2.24 ± 1.03
2.19 ± 1.05 2.24 ± 0.97
Scales: 1, Strongly Disagree; 2, Disagree; 3, Neutral; 4, Agree; 5, Strongly Agree
~ 40,000 (n=l5)
Mean± SD F p
3.60 ± 1.24 0.534 0.661
3.13 ± 0.92 0.899 0.447
2.27 ± 0.80b 3.223 0.029*
2.67 ± 0.72 0.333 0.802
2.80 ± 1.01 0.182 0.908
2.33 ± 0.90 0.381 0.767
2.13 ± 0.52 0.171 0.915
2.07 ± 0.70 0.137 0.938
* Statistical significance at P value :S 0.05 by ANOVA with multiple comparisons using Scheffe's method; Different alphabetic superscript letters are significantly different from each other (P:S 0.05 between groups, ANOVA); SD= Standard Deviation

-.J u.)
Table 21 ( continued) College and University Foodservice Administrators' Perceptions of Barriers Regarding Food Waste Management according to Number of Meals Served Weekly (N=62)
Number of Meals Served Weekly
~ 5,999 6,000-14,999 15,000-39,999 ~ 40,000 (n=l4) (n=16) (n=l7) (n=l5)
Mean± SD Mean± SD Mean± SD Mean± SD F p
Financial Resources and Administrative Support We do not have the financial resources to 3.21 ± 0.98ab 3.44 ± 1.09a 2.65 ± l.12ac 2.47 ± 0.92b 3.070 0.035*
initiate a food waste program in our operation.
We do not have enough staff to initiate a 2.71 ± 0.99 2.81 ± 0.98 2.24 ± 1.03 2.40 ± 0.99 1.162 0.332 food waste management program.
My administrators (or headquarters) are not 2.71 ± 0.91 2.62 ± 0.89 2.24 ± 0.90 2.33 ± 0.98 0.961 0.417 willing to support a food waste management program.
We do not see the cost benefits of a food 2.36 ± 0.84 2.56 ± 1.03 2.18 ± 0.88 2.47 ± 1.06 0.491 0.690 waste program (s).
Waste Disposal Methods We do not want to have equipment such as 2.14 ± 0.77 2.56 ± 1.15 2.00 ± 1.12 2.73 ± 1.10 1.679 0.182
a pulper because of equipment maintenance.
We cannot use garbage disposals because of 2.00 ± 0.56ab 1.87 ± 0.62a 2.29 ± l.16ab 2.80 ± 1.21b 2.877 0.044* high sewer taxes and/or state law.
Composting affects the environment 2.21 ± 1.12 2.07 ± 0.80 2.07 ± 0.80 2.20 ± 0.68 0.132 0.941 through contamination of water and air.
Scales: 1, Strongly Disagree; 2, Disagree; 3, Neutral; 4, Agree; 5, Strongly Agree * Statistical significance at P value~ 0.05 by ANOVA with multiple comparisons using Scheffe's method; Different alphabetic superscript letters are significantly different from each other (P~ 0.05 between groups, ANOVA); SD= Standard Deviation

-...J ~
Table 21 ( continued) College and University Foodservice Administrators' Perceptions of Barriers Regarding Food Waste Management according to Number of Meals Served Weekly_ (N=62)
Number of Meals Served Weekly
:::; 5,999 6,000-14,999 15,000-39,999 2'.: 40,000 (n=l4) (n=16) (n=l 7) (n=l5)
Mean± SD Mean± SD Mean± SD Mean± SD F p
Motivation Government regulations do not require us to 3.57 ± 0.85 3.62 ± 0.96 3.47 ± 0.87 3.40 ± 0.74 0.211 0.888
have a specific food waste management program.
We tried several methods to reduce food 2.36 ± 0.75 2.56 ± 0.63 2.12 ± 0.60 2.27 ± 0.80 1.179 0.326 waste in the past, but none of them were successful.
The impact of food waste disposal on the 1.86 ± 0.77 1.44 ± 0.51 1.47 ± 0.62 1.73 ± 0.59 1.601 0.199 environment is not our concern
Public Image The public image of our organization is an 2.14 ± 0.77 2.56 ± 1.15 2.00 ± 1.12 2.73 ± 1.10 0.023 0.995
important influence on how we manage our food waste.
Scales: 1, Strongly Disagree; 2, Disagree; 3, Neutral; 4, Agree; 5, Strongly Agree Statistical analysis conducted by ANOV A with multiple comparisons using Scheffe's method; SD = Standard Deviation

CHAPTERV
DISCUSSION AND CONCLUSIONS
Discussion
This study was designed to investigate the current food waste management in
college and university foodservice operations, foodservice administrators' attitudes
toward food waste management, and the barriers in making decisions regarding food
waste management. In order to determine differences in possible key factors impacting
decision making on food waste programs, we examined the following independent
variables: type of management, existence of residential area, number of meals served,
type of meal plan, type of food production, and source of information about food waste
management. Independent variables were categorized into (a) foodservice management
activities to reduce food waste, (b) effective food waste disposal methods previously used
and ( c) barriers regarding food waste management.
Foodservice operations at which respondents were employed provided an average
of 28,720 meals per week. Three of the operations served more than 100,000 meals per
week, which increased the average number of meals served. The frequency and cost for
collecting food waste was almost the same as frequency and cost for collecting package
waste. However, the weight of food waste collected per month was four times heavier
than package waste, whereas the volume of food waste collected a month was only one
twentieth of the volume of package waste. The mean weight and volume for food and
- 75 -

package waste in this study was very similar to a previous study in a continuing care
retirement community (Hacks, Shanklin, Kim et al. 1997). Pilot study participants also
stated that they only counted the number of times the dumpster was emptied and the cost
for a waste contract management company to collect waste.
Foodservice management activities to reduce food waste such as accurate
forecasting of food production are considered effective ways to reduce food waste from
foodservice operations (Harmon & Gerald, 2007). Among the activities listed in our
survey, educating customers was thought most likely to reduce food waste from the
foodservice operations. Previous research on trayless dining environments showed a
significant reduction in food waste from foodservice operations (Aramark, 2008; Meltzer
& Stumpf, 2008). During focus group discussions, participants from Aramark
Corporation commented that consumer education should be planned to encourage trayless
programs in foodservice operations. However, there was no significant difference in
college and university foodservice administrators' perceptions for educating customers to
reduce food waste related to any of the independent variables used in this study. This
may be because trayless service is a relatively new concept in foodservice operations and
not all focus group participants were delegates of the National Association of College and
University Foodservice (NACUFS).
Modifying food production practices and using computer programs for accurate
forecasting were perceived as the next most likely activities to reduce food waste by
college and university foodservice administrators. These two foodservice management
- 76 -

activities were also emphasized in focus group discussion. Focus group discussion
participants stated that frequent cooking of small batch size and accurate forecasting
depending on either computer programs or history were also helpful in reducing food
waste from the operations. In the national survey, these foodservice activities were
considered more likely to reduce food waste by college and university foodservice
administrators working at operations serving from 15,000 to 39,999 meals per week
compared to those serving less than 5,999 meals per week. Interestingly, college and
university foodservice administrators serving more than 40,000 meals per week showed a
tendency of believing that most foodservice activities including these two were less likely
to reduce food waste from the operations than those administrators at operations serving
from 15,000 to 39,999 meals per week. It is possible that foodservice administrators at
colleges and universities serving large number of meals might not be actively involved in
food production at their campuses.
There was no significant difference in college and university foodservice
administrators ' perceptions of using employee training, service method change and menu
adjustment to reduce food waste according to any of the independent variables used in
this study. However, college and university foodservice administrators having cook to
serve and cook to order types of food production showed a tendency of believing that
changing service methods such as implementing trayless dining and charging by item in
the cafeteria might be more likely to reduce food waste. Foodservice administrators at
operations with residential dining halls also tended to believe changing service methods
- 77 -

might be more likely to reduce food waste. Foodservice administrators obtaining
information about food waste management from government web pages were more likely
to believe that menu adjustment would reduce food waste.
Adjusting portion sizes was perceived as a significant foodservice activity to
reduce food waste by foodservice administrators who offered cash-based
inclining/declining balance meal plans to their student customers. On the other hand,
foodservice administrators offering traditional meal plans tended to believe that adjusting
portion sizes might be less likely to reduce foods waste from the operation. Traditional
meal plans offer a certain number of meals per week, month or semester. Most college
and university foodservice operations offering traditional meal plans provide an "all you
can eat" type of cafeteria. "All you can eat" type of service allows customers to take as
much food as they wish, which frequently results in a large amount of food waste from
the operation. Students purchasing cash-based inclining/declining balance meal plans
can also purchase meals at "all you can eat" type cafeteria, but they are not mandated to
go to the cafeteria a certain number of times per week. They can also use their meal
plans for a la carte menu items and to-go food items, which may allow foodservice
operations to have better control over portion sizes.
Placing a trash bin to collect food waste was mentioned during the focus group
discussion. However, survey results showed that use of a trash bin to collect food waste
was perceived as more likely to reduce food waste only by foodservice administrators
- 78 -

who obtained information about a food waste management from a waste contract
management company.
College and university foodservice administrators' perceptions of the
effectiveness of food waste disposal methods ranged from 3.00 to 4.06 (unsure to likely),
whereas their perceptions of likeliness of foodservice management activities to reduce
food waste ranged from 3.61 to 4.51 (likely to very likely). Therefore, it appears that
foodservice administrators were more knowledgeable and confident that foodservice
management activities could reduce food waste than they were confident that food waste
disposal methods could be effective.
Composting is one of the food waste disposal methods that has dramatically
increased in the United States since 1985 (Miller, 2007). Although disadvantages of
composting were mentioned such as possible contamination of water and air (Department
of HRIM, 2002), foodservice administrators in this study did not agree that composting
affects the environment through contamination of water and air (2.12±0.85).
In the focus group discussions, composting was one of the recommended food
waste disposal methods. In the national survey, college and university foodservice
administrators also perceived composting as the most likely effective method of food
wa te disposal ( 4.06±1.17). However, the limited space to hold food scraps in
foodservice operations seemed to be a major barrier (3.68±1.16). Interestingly,
food ervice administrators who obtained information from a waste contract management
company perceived ending food scraps to composting sites more likely to be effective in
- 79 -

reducing food waste. Waste contract management companies may be helpful in solving a
major barrier related to limited space to store food waste by frequently picking up food
scraps or providing containers for collecting food waste.
The EPA recommended a hierarchy of food waste management methods ranging
from source reduction, feed hungry people, feed animals, industrial use, composting to
landfill in order (EPA, 2009). Using a pulper or a garbage disposal was suggested as a
method for source reduction. College and university foodservice administrators thought
using a pulper and garbage disposal would be likely to reduce food waste in foodservice
operations. In focus group discussions, however, using a pulper was not the first choice
for foodservice operations because of the maintenance of equipment. Some foodservice
administrators commented that pulper equipment requires high maintenance and they did
not plan to use one again. Inconsistent to those comments, foodservice administrators
who completed the survey thought that using a pulper and garbage disposal would be
likely to reduce food waste (3.93±1.20 and 3.63±1.41, respectively) and that problems
possibly caused by these methods were less likely to be barriers regarding food waste
management (2.37±1.07and 2.24±0.98, respectively).
College and university foodservice administrators who were 49 years of age or
younger perceived food disposal as a more likely way to reduce food waste from the
operations. On the other hand, those serving 40,000 or more meals per week tended to
disagree le s with the statement (2.80±1.21), "we cannot use garbage disposals because
of high sewer taxes and/or state law", than those serving from 6,000 to 14,999 meals per
- 80 -

week (1.87±1.07). This result may be related to the amount of food waste produced in
college and university foodservice operations because a higher amount of food waste
would result in additional cost for sewer fees. This result may also be related to the fact
that a higher number of college and university foodservice administrators older than 50
years fell into the group serving a greater number of meals in their operations.
College and university foodservice administrators working in contract managed
operations perceived that donating prepared food for the needy such as to local food
banks was less likely to be an effective method of disposing of food waste. Consistent
with these results, they also agreed more strongly with a statement regarding the liability
issue related to donating foods, "our operation does not donate foods to nonprofit
organizations because of potential liability issues". The liability issues related to
donating foods were also clearly stated in focus group discussion by one of foodservice
administrators working at contract managed operations. Contract foodservice operations
are managed by professional foodservice contract company such as Aramark, Sodexo and
Compass. Due to the large volume of business and contract management, these contract
companies tend to tightly monitor productivity and liabilities. Their activities are also
closely related to their success in continuing contract management with colleges and
universities where they have contracts (Aramark Risk Management, 2008).
Landfill is the least recommended waste disposal method by EPA (EPA, 2009).
College and university foodservice administrators perceived landfills as less likely to be
effective for food waste disposal than several other methods including composting, use of
- 81 -

food pulper, garbage disposal and food donation. College and university foodservice
administrators working at operations with residential dining halls thought that landfill
was less likely to be effective in reducing food waste than those operations with no
residential dining halls. Landfill was also considered less likely to be effective in
reducing food waste by foodservice administrators who used cook chill type of food
production and obtained information about food waste management from college and
university web pages than counterparts.
Unlike recycling programs for non-food items, food waste management has not
been extensively implemented in foodservice operations. The previous report by the
Center for Ecological Technology (CET) and Massachusetts Department of
Environmental Protection (DEP) stated several barriers such as limited access to the
processing site, training issues, the nature of food waste, inconsistent governmental and
financial support and no proactive governmental requirements (CET, 1999).
Foodservice administrators in this study were asked their opinions about these
barriers. Limited space to store food items for donation was more strongly believed to be
a barrier out of eight statements describing barriers in operational management. The
liability issue also was clearly considered as a barrier by foodservice administrators
working in contract managed operations (3.47±1.31) compared to self-operated
operations (2.67±1.22). The liability issues related to food donation were more strongly
perceived as barriers by foodservice administrators serving less than 5,999 meals per
week (3.64±1.15) than those serving more than 40,000 meals per week (2.27±0.80).
- 82 -

Foodservice administrators working in small size foodservice operations would not be
able to receive much support for possible legal issues, and, therefore, do not want to be
involved in a lawsuit (Aramark Risk Management, 2008).
Lack of financial resources to initiate a food waste program was more strongly
perceived to be a barrier than other statements concerning financial resources and/or
administrative support. Lack of resources to initiate a food waste program in foodservice
operations was more strongly perceived as a barrier by foodservice administrators serving
less than 5,999 meals per week (3.21±0.98) compared to those serving more than 40,000
meals per week (2.47±0.92). Compared to large size operations, those working in small
size foodservice operations might not have enough financial resources to implement a
new project such as a food waste disposal program, which would be a barrier regarding
food waste management.
None of the three statements regarding waste disposal methods of a food pulper,
garbage disposal and composting were considered barriers by foodservice administrators
in this study. However, foodservice administrators serving 40,000 or more meals per
week had neutral opinions (2.80±1.21) regarding barriers such as use of garbage
disposals, whereas those serving from 6,000 to 14,999 meals per week disagreed
(1.87±1.07) this was a barrier. This result might be related to the large amount of food
waste produced in these foodservice operations resulting in higher expenses for sewer
u e.
- 83 -

Statements for motivation were related to government regulation, success or
failure in the past and belief about impact of food waste disposal on environment. The
difficulty of following the changes in government regulation was mentioned as a barrier
in focus group discussions when donating food scraps to farmers for animal feed. A
report from the Center for Ecological Technology in collaboration with the
Massachusetts Department of Environmental Protection also mentioned that no strong
vision or proactive actions from state government as one of barriers to executing food
waste programs (CET, 1999). In this study, the statement related to governmental
requirements, "government regulations do not require us to have a specific food waste
management program" was strongly considered (3.49±0.86) a barrier under the category
of motivation.
Overall, college and university foodservice administrators tended not to agree
with most statements on barriers regarding food waste management except those that
focused on liability issue, lack of financial resources and high sewer fees regarding food
waste management. However, foodservice administrators agreed that public image of
foodservice operations was an important influence on how they managed food waste in
their operations.
Conclusions
To the knowledge of the researchers, food waste management in foodservice
operations is one of the least researched areas related to improving environmental
sustainability even though food waste is closely related to the increased food costs in
- 84 -

operations. Through focus group discussions and a national survey, this study was able
to determine opinions of a small group of college and university foodservice
administrators regarding foodservice activities and methods of food waste disposal that
could effectively reduce the amount of food waste in foodservice operations. Their
perceptions regarding barriers to foodservice management were also investigated. Even
though data from only a small number of respondents was available, this study was able
to identify several foodservice activities and food disposal methods that administrators
believed would be likely to reduce food waste at college and university foodservice
operations. This study was also able to determine significant differences in foodservice
administrators' perceptions of likeliness of foodservice activities and food disposal
methods according to type of management, meal plan and food production, existence of
residence area, number of meals served, and source of information about food waste
management.
Limitations
The low response rate for this study with only 63 respondents was the biggest
limitation. The initial estimation of minimum sample size was 125 data, but statistical
analyses for several variables such as type of food production and source of information
about food waste management were not made due to the small number of data collected
for national survey. A second limitation was that voting delegates of the National
Association of College and University Food Services (NACUFS) were not all
foodservice directors or operating managers, which might have contributed to the low
- 85 -

response rate and possibly inaccurate information about characteristics of foodservice
operations. For example, some of their titles were Associate Vice President of Business
Operations, Associate Dean of Students, Contract Administrator, Vice President Student
Affairs and Vice President of Finance and Administration. Researchers dealt with this
possible problem by asking the recipient of the survey to pass it on to the foodservice
director if they did not have knowledge of the foodservice operation. The NACUFS
delegates can also not be considered a representative group for college and university
foodservice operations. Of 6,441 colleges and universities in the United States (National
Center for Education Statistics, 2007), only about 10% of college and university
foodservice administrators join NACUFS. Therefore, the results from this study may not
represent all college and university foodservice operations.
Recommendations
These study results may provide a glimpse into food waste management practices
and waste disposal methods in college and university foodservice operations. Most
foodservice administrators indicated they were interested in solid and food waste
management. However, they appeared to have different attitudes regarding food waste
management based on their demographic characteristics and that of their operations.
Results from this study can provide ·guidelines for governmental or educational agencies
to develop user friendly materials for foodservice operations.
Resources to support food waste disposal methods will vary according to the size
of the college and university foodservice operation and type of management. The
- 86 -

feasibility of using some food waste disposal methods such as composting, donation of
food scraps to farmers and donation of foods to the needy may depend upon size of
operation and location. Therefore, foodservice administrators should be well informed
prior to implementing any food waste management programs. Each administrator also
should select effective methods of food waste management to suit their operation based
upon available resources.
In future studies, researchers should simplify and clarify questions regarding
foodservice management activities and food waste disposal methods in order to have a
greater response rate for the survey. Also, the terms used for type of meal plan, type of
food production and source of information about food waste management should be
clearly defined in the survey so participants in the future study will understand questions
well and answer them accordingly.
Further study with a larger number of colleges and universities should be
conducted to verify and identify the accuracy and reliability of the results in this study.
In order to have more participants, researchers will need contact information of
foodservice directors who are more closely responsible for managing foodservice
operations. Secondly, future study should focus on prioritizing foodservice activities,
food waste disposal methods and barriers regarding food waste management. Thirdly,
food waste management research should also be expanded to school and healthcare
foodservice operations. The factors affecting the perceptions, practices and barriers
regarding food waste management would likely be different in school or healthcare
- 87 -

foodservice operations compared to the factors in college and university foodservice
operations.
- 88 -

REFERENCES
15 green colleges and universities. (2007). Retrieved November 15, 2007, from
http://www.grist.org/news/maindish/2007 /08/ 1 Of colleges/.
Abusabha R., & Woelfel M.L. (2003). Qualitative vs. quantitative methods: Two
opposites that make a perfect match. J oumal of the American Dietetic
Association, 103, 566-569.
Aramark Higher Education (2008). The business and cultural acceptance case for
trayless dining. Retrieved March 25, 2009, from
http://www.aramarkhighered.com/ThoughtLeadership/Articles.asp.
Aramark Risk Management (2008). Donation of food items. Retrieved May 20, 2009,
from http://www.aramarkslp.com/files/Risk%20Recommendation%20-
%20Food %20Donation.doc.
Association for the Advancement of Sustainability in Higher Education (AASHE).
(2006). University of British Columbia 2006 Campus Sustainability Achievement
Award application. Retrieved November 23, 2007, from
http://www.aashe.org/resources/profiles/u britishcolumbia2006. php.
Association for the Advancement of Sustainability in Higher Education (AASHE).
(2007). About AASHE. Retrieved November 23, 2007, from
http://www.aashe.org/about/about.php.
Bisk, T. (2007). The energy project: independence by 2020. Futurist, 41(1), 25-34.
Bloom, J. (2009). Blog: Wasted food. Retrieved on March 11, 2009, Available at
http://www.wastedfood.com/trayless/.
- 89 -
Buchthal, K. (2006). Slow bum: Frustrated by heating-cost increases, operators weigh
responses. Restaurants and Institutions, 116, 55-56.
California Integrated Waste Management Board (CIWMB). (2007). Waste reduction
awards program (WRAP). Retrieved November 27, 2007, from
http://www.ciwmb.ca.gov/WRAP/.
Campus composts. (2006). FoodService Director, 19(11), 1-1.
Center for Ecological Technology (CET). (1999). Strategies to increase food waste
recycling in the greater Boston area. Retrieved November 27, 2007, from
http://www.cetonline.org/Publications/Strategies%20to%20Increase%20Food%20
W aste%20Recycling%20in %20the%20Greater%20Boston %20Area. pdf.
Cole, C. (2005). America wastes half its food. Futurist, 39(3), 12.
Department of Dining Services. (2006). Environmental programs and practices.
Retrieved November 11, 2007, from
http://www.dining.umd.edu/greendining/Env _Prog.cfm.
Department of Hotel, Restaurant, Institution Management and Dietetics, Kansas State
University (2002). Module 3: management of waste/residues in interdisciplinary
modules to teach waste or residue management in the food chain. Retrieved Mar.
20, 2008, from http://www.oznet.ksu.edu/swr/Module3/Introduction.htm.
Edmunds, H. ( 1999). The focus group research handbook. Lincolnwood, IL: NTC
Contemporary.
Environmental Protection Agency (EPA). (2006). Solid waste management and
greenhouse gases: A life-cycle assessment of emissions and sinks. Retrieved
November 20, 2007, from
http://epa.gov/climatechange/wycd/waste/SWMGHGreport.html.
- 90-

Environmental Protection Agency (EPA). (2007a). Our history. Retrieved November 20,
2007, from http://www.epa.gov/epahome/aboutepa.htm#history.
Environmental Protection Agency (EPA). (2007b ). Municipal Solid Waste generation,
recycling, and disposal in the United States: Facts and figures for 2006.
Retrieved November 20, 2007, from http://www.epa.gov/epaoswer/non
hw/muncpl/pubs/msw06.pdf.
Environmental Protection Agency (EPA). (2007c). Food scraps: Basic information, food
waste recovery hierarchy, generators, success stories, frequent questions, and
resources. Retrieved Nov. 20, 2007, from
http://www.epa.gov/epawaste/conserve/materials/organics/food/index.htm.
Friendland, A., & Lawn, J. (2007). The Stanford way. Food Management, 42(10), 36-50.
Hackes, B., Shanklin, C. W., Kim, T., & Su, A. (1997). Tray service generates more food
waste in dining areas of a continuing-care retirement community. Journal of the
American Dietetic Association, 97(8), 879-882.
Harmon, A.H., & Gerald B.L. (2007). Position of the American Dietetic Association:
Food and nutrition professionals can implement practices to conserve natural
resources and support ecological sustainability. Journal of the American Dietetic
Association, 107( 6), 1033-1043.
Helmer, M., & Hilhorst, D. (2006). Natural disasters and climate change. Disasters,
30(1), 1-4.
Herrmann, M . (2007). Service with a star. University Business, 10(8), 46-50.
Meltzer, J., & Stumpf, S. (2008). IWU Bertholf Commons Tray-Less trial final report.
Retrieved March 25, 2009, from http://digitalcommons.iwu.edu/green docs/18.
- 91 -

Merriam-Webster Online Dictionary. (2005). Sustain. Retrieved November14, 2007,
from http://www. webster .com/dictionary /sustain.
Miller, C. (2007). Food waste: Increased composting could reduce the third largest part of
the waste stream. Waste Age. May, 92.
National Center for Education Statistics. (2007). Title IV institutions, by level and control
of institution and state or other jurisdiction: Academic year 2005-2006. Retrieved
June 3, 2009, from
http://nces.ed.gov/ipeds/factsheets/pdf/fct_title_IV _03072007 _ 4.pdf.
National Recycling Coalition. (2007). RecycleMania 2007 spurs college campuses to
score big for the "Green team". Retrieved November 11, 2007, from
http://www.recyclemania.org/.
National Recycling Coalition (2008). RecycleMania 2008 spurs college campuses to
score big for the "Green Team". Retrieved March. 10, 2008, from
http://www.recyclemania.org/.
Regional Ecosystem Office (U.S.). REO Information Center Definitions (2003).
Northwest Forest Plan (NWFP). Definition of ecological sustainability. Retrieved
on March 10, 2009, from http://www.reo.gov/general/definitions_r-s.htm#S.
Stanford celebrates 'eat local'. (2007). FoodService Director, 20(5), 26-26.
The Evans McDonough Co. (2002). Castro Valley foods scraps recycling pilot program:
Presentation of focus group findings (No. EMC 02-2567). Retrieved November
21, 2007, from http://www.stopwaste.org/docs/foodscrap-focus.pdf.
The Evans McDonough Co. (2004). Residential food scrap program: Survey results
Retrieved November 21, 2007, from http://www.stopwaste.org/docs/foodscrap-
survey.pdf.
- 92 -

Webster, P. J., Holland, G. J., Curry, J. A., & Chang, R.R. (2005). Changes in tropical
cyclone number, duration, and intensity in a warming environment. Science, 309,
1844-1846.
Wie, S., Shanklin, C., & Lee, K. (2003). A decision tree for selecting the most cost
effective waste disposal strategy in foodservice operations. Journal of the
American Dietetic Association, 103(4), 475-482.
Young, R., & Cartwright, R. (2007). How to build a sustainable kitchen. Penton Media.
Retrieved October. 17, 2007, from http://food
management.com/webinars/build_kitchen/index.html [ webinar].
- 93 -

APPENDIX A
Approval of the Study from Institutional Review Board
- 94 -

June 6, 2008
Dr. Sockju Kwon
Dear Dr. Kwon:
tnsti-h.1ticnal Review Soard Office of Rosenrch arid Sponsored Program!> PO &ox 425619, C'AJnk;,n, TX 76204-5619 940-898·3378 Fox 940-898-3416 e-rnoil'. fRB@tw1;,1.edu
Re: lnves1igating Food Waste Management in College and Universiry Foodservice Operations
The above referenced study has been reviewed by the TWU Institutional Review Board {IRB) and appears to meet our requirements for the protection of individuals' rights.
Lf applicabl \ agency approval letters must be submitted to the IRB upon receipt PRIOR to any data collection at that agency. A copy of the approved c.onsem Jbnn with th!:! IRB approval starnp and a copy of the annual/final report are enclosed. Please use the consent form with the most recent approval date stamp when obt.aining consent from your participants. The signed consent forms and final report must be filed with the Institutional Review Board at the completion of the study.
This approval is valid one year from June 6, 2008. According to regulations from the Department of Health and Human ervices, another review by the IRB is required if your project changes in any way, an<l the IRB must be notified immediately regarding .any adverse events. If you have any questions, f"'e l free to call the TWU In ·titutional Review Board.
enc.
Dr. David Nichols, Chair
Institutional Review Board ~ Denton
cc. Dr. Chandan Prasad, Department of Nutrition & Food Sciences
Dr. Carolyn Bednar, Department oL utrit-ion & Food Sciences
Ms. Jane Graham, Research Compliance oordinator, Research & Sponsored Programs
Graduate School
- 95 -

APPENDIXB
Focus Group Questioning Route
- 96 -

Focus Group Questioning Route
"Investigating food waste management in college and university foodservice operations"
Objectives:
- to obtain the previous and present experience about food waste management
- to collect the pros and cons of each method from participants' experience
- to evaluate the attitudes and barriers of foodservice directors regarding food waste
management
Questions and time-line
Categories Questions Time-line
Opening 1. Tell us your name and briefly describe your foodservice 5 mins operation.
Introductory 2. How do you manage food waste from your operation 5 mins now?
Transition 3. Think back to your 6. Think back to your 8 mins previous experience of previous experience of each food waste management. food waste management. What method do you What method do you think think was the most was not recommendable successful and why? and why?
Discussion 4. What were the 7. What were the 5 mins Questions advantages of the disadvantages of the each
method? method? 5. What would you 8. What would you
recommend to modify recommend to modify the the method? method?
Ending 9. If you have to implement a new food waste program, 8 mins
Questions which method would you use and why? 10. Is there anything you want to make comments about food
waste management?
- 97 -
APPENDIXC
Cover Letter
- 98 -

u EXAS WOMAN 'S UNIVERSITY
DENTON DAtlAS HOUS TON
Febrnary 10, 2009
Depattment of N.ufrition and Food Sciences P:O. Box 425885, D~riton, TX 76204·5888 9,10-898 ,2636 F-ox 940·898~2634
Dear Foodservice Administrator:
You are invited to participate in a national survey focusing on food waste management in college and university foodservice (CUFS) operations. This study is supported by a grant from the Foodservice Systems management
Education Council (FSMEC). The purpose of this study is to investigate the present status of food waste management in CUFS, foodservice administrators' attitudes toward food waste management, and ba.ITiers against making decisions regarding food waste management.
We would like to obtain information on your foodservice operation including the type of food waste and packaging waste generated. We are also requesting your opinions on various practices that would affect food
waste management. If you do not have access to specific information on food waste management at your facility, please ask your foodservice manager to complete this survey.
Your name, E-mail address, and operation were obtained from the members' directory of the National
Association of College and University Food Service. Pa1ticipation in this survey is completely voluntary, and
you may withdraw your participation from the study at any time without penalty. Direct benefits of
patticipating in the survey will be a $5.00 gift ce1tificate of either Target or Starbucks. Also a summary of the
study results will be sent within 6 months of completion of the research proj ect.
If you would like to participate, please complete this survey by Feb 20, 2009 and send the result back to us.
An electronic version of questionnaire is also available at https://www.psychdata.com/s.asp?S1D=127724. You can register your e-mail for the questionnaire and come back to complete rest of the survey if you would.
Compl etion of this survey should take no longer than 20 minutes.
If you have questions about this research study, you should ask the researchers; their phone numbers are at the bottom of this form. If you have questions about your ri ghts as a participant in this research or the way thi s
study has been conducted, you may contact the Texas Woman's University Office of Research and Sponsored
Programs at 940-898-3378 or v ia e-mail at IRB@twu. edu.
Your participation wi ll be hi ghly appreciated.
Sinl:erely,
Sockju Kwon, Ph.D. Graduate Student
Carolyn M. Bednar, Ph.D., RD., L.D. Professor
- 99 -

APPENDIXD
Mailed Survey Questionnaire
100

The return of your completed questionnaires is considered as your informed consent to act as a participant in this research.
Investigating Food Waste Management in College and University Foodservice Operations
Department of Nutrition and Food Sciences, Texas Woman's University February 2009
Parl A: Please answer these questions about your foodservice operation.
1. What is the average number of meals or meal equivalents served per week excluding catering events? meals/week -------
2. If you have catering service, what is the average number of meal events and meals per week? ____ events/week or _____ meals/week
**Beginning with Question 3, please answer based on the
number of meals produced (your answer above).
3. Which one is predominantly used for your facility?
D Self-operated
D Contract managed
D Combination of self-operated and contract managed
D Other (Please specify): ______ _ _
4. Do you have a Residential dining area?
D Yes D No
If yes, what is the estimated sales volume(%) from the
residential dining area(s)? _____ %
5. What kind of meal plans do you provide for students?
(Please check all apply)
D Traditional meal plan ( ex. set # of meals per week or
per semester)
D Cash-based declining/inclining meal plan
(ex. cash deposit, credit card)
D Combination of both plans
D Other (Please specify): _____ _
6. Please indicate types of production you have in your
facility. (Please check all apply)
D Cook to serve D Cook to order
D Cook-chill (Cook-freeze) D Assembly serve
D Other (Please specify): _______ _
7. Please provide an estimated value for each question regarding waste from your facility.
Food waste Packaging waste
The frequency of waste collection __ times per week _ times per week
Estimated cost for waste removal $ per month $ per month
Estimated amount of waste per month lbs or cu ft --lbs or --cu ft -- --
Parl B: Please answer these questions about yourself as a foodservice director.
8. Gender: D Male D Female
9. Range of age D 20-29 □ 30-39 D 40-49 D 50-59 D 60 and higher
10. How long have you worked for this college/university operation? Years Months
11. How long have you worked in food service operations in total? Years Months
12. What is the highest level of education you have obtained?
□ Associate Degree D Bachelor's degree D Master's degree D Doctoral degree
D Other (Please specify)
101

13. Where do you obtain information about food waste management options (please check all that apply)?
D I do not obtain any information about food waste management
D Governmental web pages □ College and university web pages
D Waste contract Management Company D Professional journals
D Trade journals □ Other (Please specify): ____ _
14. How much are you interested in waste management in your facility? (please indicate 1 for not interested at all and 5 for very interested)
Not interested at all Very Interested Solid Waste Management: ----------- 1 ------------ ----------- 2 ------------ ----------- 3 ------------ ----------- 4 ------ ------ ----------- 5 -----------Food Waste Management: ----------- 1 ------------ ----------- 2 ------------ ----------- 3 ------------ ----------- 4 ------------ ----------- 5 ------------
Part C: Please answer these questions about food waste management at your facility.
15. The following foodservice activities could reduce the amount of food waste from a college/university foodservice operation. How likely would the following activities be to reduce food waste at your college/university foodservice operation. Please check appropriate one for each activity. (If you did not use these activities in the past or do not use now, please select NI A)
1) Change menu planning to reduce food waste (ex. reduce number of menu items produced, reduce portion size) □
3) Use a computer program to have accurate forecasting and · · · · · · · □ managing food production
:u~~*ru~~t.i;~~t:~~lt~~!~~pc.~:~
□
□
□ □ □ □
□ □ □ □
5) Adjust portion sizes to reduce food waste □ . □ .. .. □ □ □ □
,?X~~:H~?t~i~t~~i•~iii~~l[~~•~~~i~,mm~mmm~mmmrn•~i Iilitimirnmi: •i;im P-Im rn:•mm rnm i i~mim~m imi ~i rni•t 11 ti rnmt •:.•"· ;····••, :: □:t .::,~:.• :i:14 .,.,, 7) Train employees to separate food waste and packaging
( ex. animal feeds, composting) □ □ □ □ □
-~~lW~~i~~~t~~~~fi~IR:~:::::: .:·: 9) Other (Please specify): ______ _ □ □ □ □ □
16. Based on your experience, which of the following are likely to be effective methods of food waste disposal for college/university foodservice operations? Please check appropriate one based on likeliness to be effective for each program. (If you did not use programs in the past or do not use currently at your facility, please check N/ A)
1) Donate prepared food (ex. hot or cold foods) for the needy such as local food banks
·2) .Dob~ttfiti~i~~:·' ih~i· : :: \ 11i~~t):iM!:f:tL: :
5) Use a food pulper to reduce the volume ?!.1?.~fo~? :".'~~~~ ... -~X~~~tg¥.tb.*-i¢;4.i.§t1¢.$~i~~l~~*pij~~lii~~~lj~9!i~~i*8~!~~~~!itl!~!;:!l 7) Send food ~a~t~ t~ l~~dfill with other solid waste
102
□
□
□
□
□ □ lJ □
□ □ □ □
□ □ □ □
□ □ □ □
□
□
□
□
□
□

Part D: Please answer these questions regarding the issues you may feel difficult in food waste management at your facility.
17. Please indicate your level of agreement with each statement.
1) The amount of food waste from our operation is not enough to implement a specific food waste management plan.
3) Lack of resources about food waste management
5) We do not have the financial resources to initiate a food waste program in our op1~ran01t1. in~llr,;,,,.,, ,,
7) We do not have enough staff to initiate a food waste
9) We were overwhelmed with the complicated government requirements for food waste programs.
11) We have very limited space to store food items for donation.
15) We but none of them were uccessful.
:16)m~;;m~:;1~~=~r1'P#
17) Government regulations do not require us to have a specific food waste management program.
:1t?il¥l~ii~1~:,,,IlffllP,~•1::,, .. 19) F~~d waste management is not a current pnonty
our operation.
□
□
□
□
□
□
□
□
□ □ □
□ □ □
□ □ □
□ □ □
□ □ □
□ □ □
□ □ □
□ □ □
□ □
18. Please describe any difficulties that you may have had with food waste management activities in the past.
103
□
□
□
□
□
□
□
□
□

19. If your operation does not currently implement any of the following food waste management programs, which one would you prefer to start first? (please select only one):
D Donate cooked food to nonprofit organizations O Donate canned or dry food to nonprofit organizations
D Donate food scraps to farmers for animal feed D Send food scraps to composting site (s)
D Use a food pulper to reduce the volume of food waste O Use garbage disposals to dispose foods to sewage system D Other (Please specify): __________ _
20. Why did you choose this method as first? Please explain.
If you would you like to receive a $5.00 gift card and summary of results, please fill out contact information. Which gift card would you like to receive? D Target D Starbucks
Name of Recipient Address _______________ _
City _____ State___ Zip __ _
------------------------------------ ------------------------------------------------------------------------------------
Bednar 19.350.10.0602.xxxx.00701362
BUSINESS REPLY MAIL FIRST CLASS MAlL PERMIT NO. 13 DENTON, TEXAS
POSTAGE WILL BE PAID BY ADDRESSEE
TEXAS WOMAN'S UNTVERSITY DEPARTMENT OF NUTRJTION AND FOOD SCIENCES P.O. BOX 425619 DENTON TX 76204-9982
111111
II 1111,11, 11.I .Ill 1111 I II II ,111 I.I, ,I 11111il, 1,.11,1
NO POSTAGE NECESSARY IF MAILED
JNTHE UNITED ST ATES
---------------------------------------------------------
Thank you very much for completing the survey.
104