Embed Size (px)
Citation preview

Invesco Global Factor Investing Study 2019
For public use in the United States and Canada.

Important informationAll material presented is compiled from sources believed to be reliable and current, but accuracy cannot be guaranteed. This is not to be construed as an offer to buy or sell any financial instruments and should not be relied upon as the sole factor in an investment making decision. Diversification does not guarantee a profit or eliminate the risk of loss. As with all investments there are associated inherent risks. This should not be considered a recommendation to purchase any investment product. This does not constitute a recommendation of any investment strategy for a particular investor. Investors should consult a financial professional before making any investment decisions if they are uncertain whether an investment is suitable for them. Please obtain and review all financial material carefully before investing. The opinions expressed are those of the author, are based on current market conditions and are subject to change without notice. These opinions may differ from those of other Invesco investment professionals. Diversification does not guarantee a profit or eliminate the risk of loss. Past performance is not indicative of future results.
Investors should be aware of the material differences between active and passive strategies. Unlike passive strategies, active strategies have the ability to react to market changes and the potential to outperform a stated benchmark. Other differences include, but are not limited to, expenses, management style and liquidity. Investors should consult their financial adviser before investing. About RiskFactor investing (as known as smart beta or active quant) is an investment strategy in which securities are chosen based on certain characteristics and attributes that may explain differences in returns. Factor investing represents an alternative and selection index based methodology that seeks to outperform a benchmark or reduce portfolio risk, both in active or passive vehicles. There can be no assurance that performance will be enhanced or risk will be reduced for strategies that seek to provide exposure to certain factors. Exposure to such investment factors may detract from performance in some market environments, perhaps for extended periods. Factor investing may underperform cap-weighted benchmarks and increase portfolio risk. There is no assurance that the investment strategies discussed in this material will achieve their investment objectives.
In general, equity values fluctuate, sometimes widely, in response to activities specific to the company as well as general market, economic and political conditions. Fixed-income investments are subject to credit risk of the issuer and the effects of changing interest rates. Interest rate risk refers to the risk that bond prices generally fall as interest rates rise and vice versa. An issuer may be unable to meet interest and/or principal payments, thereby causing its instruments to decrease in value and lowering the issuer’s credit rating.
A value style of investing is subject to the risk that the valuations never improve or that the returns will trail other styles of investing or the overall stock markets.
Momentum style of investing is subject to the risk that the securities may be more volatile than the market as a whole or returns on securities that have previously exhibited price momentum are less than returns on other styles of investing.
Low volatility cannot be guaranteed.
Commodities and currencies may subject an investor to greater volatility than traditional securities such as stocks and bonds and can fluctuate significantly based on weather, political, tax, and other regulatory and market developments.
The use of environmental and social factors to exclude certain investments for non-financial reasons may limit market opportunities available to funds not using these criteria. Further, information used to evaluate environmental and social factors may not be readily available, complete or accurate, which could negatively impact the ability to apply environmental and social standards. Alternative products typically hold more non-traditional investments and employ more complex trading strategies, including hedging and leveraging through derivatives, short selling and opportunistic strategies that change with market conditions. Investors considering alternatives should be aware of their unique characteristics and additional risks from the strategies they use. Like all investments, performance will fluctuate. You can lose money.
The beauty of dataRyoji Ikeda is a Japanese sound and visual artist who lives and works in Paris. His critically acclaimed installation The Transfinite in New York featured a wall flooded by finely articulated numerical and graphic data, a physical manifestation of information in its rawest form.
This proved to be the perfect backdrop to factor investing, a purely quantitative approach based on observable data rather than on opinion or speculation. The installation used light and music to bring this data to life in an utterly captivating way, showing how data can be beautiful. In fact, Ikeda says: “The purest beauty is the world of mathematics.” Images: © James Ewing/OTTO

03
04 Introduction
06 Key metrics
10 Theme 1 Factor investing adoption continues at pace as asset owners pursue a long-term approach Some 59% of existing global factor investors plan to increase their allocations to factor investing strategies, and 66%-70% of respondents reported their factor investing strategies met or exceeded the performance of their traditional active or market-weighted allocations in the year to March 2019. While some factors and strategies experienced performance pressure, investors are taking a long-term approach to factor investing, including to factors that experience periods of underperformance.
20 Theme 2 Investors embrace active implementation as they move to dynamic approaches The majority of factor investors prefer an active implementation approach and believe it is important to constantly evolve this approach. Greater use of multi-factor dynamic implementation has led to rebalancing in favour of low volatility, momentum and quality factors, with a reduction in allocations to the value factor. However, in terms of belief the value factor continues to have the widest level of support among both wholesale and institutional investors.
36 Theme 3 Factor investing and Environmental, Social and Governance (ESG): parallel developments, uncertain linkages Adoption of factor investing and ESG are often occurring in parallel. With ESG moving beyond simplistic exclusion of securities to include quantitative scoring, questions arise as to whether ESG and factor investing are synergistic or conflicting; Investors’ analysis of their ESG portfolios suggests a positive correlation1 with the quality factor and negative correlation with the value factor.
46 Theme 4 Future of factors: overcoming the barriers to scaling up The optimisation of risk and portfolio exposures is seen as a key benefit of the factor approach. However, many investors see their capabilities as immature and needing further investment. Client interest is limiting the adoption of factor investing within the wholesale segment, with the perceived complexity of factor investing a hurdle to overcome.
56 Theme 5 Fixed income: the next frontier for factor investing Investors increasingly believe that factor investing can be extended to fixed income, and investors have been increasing their allocations to fixed income factors – especially larger and more experienced factor investors. Over 80% of investors believe their product needs in fixed income are not yet adequately addressed.
64 Appendix
Past performance is not a guarantee of future results.
1 Correlation is a statistical measure that indicates the extent to which two or more variables fluctuate together.

04
Vincent de MartelSenior Solutions Strategist, North AmericaInvesco Investment [email protected]+1 (650) 316-6509
Mo HaghbinChief Operating OfficerInvesco Investment Solutions [email protected]+1 (212) 323-0485

05
IntroductionWelcome to our fourth annual Global Factor Investing Study, based on an interview programme with 241 factor investors. Incorporating the views of 132 institutional investors and 109 wholesale investors that are together responsible for managing over US$25 trillion in assets (as of 31 March 2019), the study is the largest and most in-depth examination of global factor investing currently being undertaken.
Factor investing, broadly, is a type of investment strategy in which securities are chosen based on certain characteristics and attributes – which are often termed 'factors' – that have tended to offer favourable risk and return patterns over time. While the discipline of factor investing has existed since the 1950s, the strategy has gained more acceptance and adoption in recent years, as investors learn more about what factor investing strategies can achieve and how they can be used as part of a portfolio. This year’s study is an opportunity to understand paths of adoption, experiences, methods of implementation, future intentions and challenges to be overcome in factor investing. We explore these topics through five key themes:
– Theme one focuses on recent experiences and future allocation intentions, showing that 59% of existing factor investors plan to increase their allocations to factor investing strategies over the next three years. Some 66%-70% of respondents reported their factor investing strategies met or exceeded the performance of their traditional active or market-weighted allocations. In the 12 months leading up to our programme of interviews, several factors, including momentum, low volatility, and quality, outperformed market-cap weighted benchmarks, while some of the most common factor strategies, including value and size, underperformed. For most factor investors, the more challenging year has not dampened their belief in the long-term case for factor investing, with most self-identifying as strategic investors looking to harvest factor premia over the long term and planning to further increase allocations.
– In theme two, we discuss approaches to implementation and find that investors increasingly believe that capturing the benefits of factor investing is in part dependent on adopting a dynamic approach. In 2019, respondents have continued to increase both the number of factors they target and their usage of multi-factor strategies. Investors have also taken more active decisions about which factors to include or exclude. One of the results is a rebalancing in favour of factors such as low volatility, momentum, and quality, with some decline in exposure to the value factor (but which remains the most widely allocated factor).
– In our third theme, we look at how factor investing and ESG are developing in parallel, and the questions this raises around whether the two initiatives are synergistic, in conflict – or neither. We found wide-ranging views on how ESG fits within a factor framework and the nature of the interaction. However, we also found investors keen to develop their capabilities, seeing factor analysis as an avenue for adding more rigour to the debate around the impact of ESG on portfolios and excited about the potential to build factor models which both incorporate ESG requirements and take this impact into account.
– In theme four we look at some of the obstacles that need to be overcome for factor allocations to scale up further. Only around a quarter of factor investors feel confident that they have full knowledge of their portfolio factor exposures – a challenge that risks undermining some of key benefits of the factor approach. Further challenges were identified around a lack of suitable factor products; a significant minority of investors still see the equity asset class as insufficiently covered by quality factor products, while in fixed income and liquid alternatives the picture was even more pronounced. For wholesale investors, scaling up challenges also centred on client and advisor understanding.
– We conclude with a focus on the extension of factor investing into fixed income portfolios. In the past 12 months, there has been a substantial increase in the view that factor investing can be applied to this asset class. This is reflected in around a third of investors having added to fixed income factors over the past year as well as increased allocations to yield/carry strategies. In this theme, we also discuss how the spread of factor allocations across portfolios suggests that factor investing is gaining a more strategic footing in investing, not just a low-cost substitute for traditional active management, but as a more transparent and efficient way of building a holistic portfolio.

06
Key metrics
Approaches to factor investing (% citations)
Allocation to factor alongside active and passive strategiesSystematic monitoring of risk factor exposures across portfolioFactor based allocation at a portfolio level across asset classes
Sample size: Institutional = 131, Wholesale = 108.
Institutional Wholesale
86
76
47
3741
37
Reasons for investing in factor strategies (average score out of 10)
InstitutionalWholesale
Sample size: Institutional = 128, Wholesale = 104.
Increase return 7.72
7.75
Reduce risk 7.88
7.56
Control portfolioexposures
7.08
6.82
Outperform fundamentalmanagers
6.89
6.54
Reduce cost 7.22
6.20
Substitute indexingportfolio
6.78
6.64
Improve transparency 6.95
6.07
Improve benchmarking 6.53
5.69
07
Factors within portfolio1 (% citations, by year of study)
Sample size: 2016 = 56, 2017 = 98, 2018 = 26, 2019 = 236. 1 Factor definitions can be found in the appendix.
2016201720182019
Yield/CarrySizeQualityMomentumLow volatility
84
Value
383834
5053
616161
46
57
6469
53
60
6868
62
76
69
788077
43
Method of executing factor strategies (% citations)
Sample size: Active Institutional = 124, Active Wholesale = 90, Passive Institutional = 82, Passive Wholesale = 72.
Segregated mandatesETF/ETNCo-mingled mutual fundsOther pooled vehiclesDerivatives
Active factor strategies
Institutional Wholesale
Passive factor strategies
Institutional Wholesale
52
42
58
33
13
3641
70
28
10
6266
3832
9
36
77
36
20
8

08
Timeframe to assess factor strategies (% citations)
Sample size: Institutional = 131, Wholesale = 107.
InstitutionalWholesale
Over 10 years
11
5-10 years3-5 years2-3 yearsOne year
13
21
18
47 46
1719
4 4
Investors adjusting factor strategies tactically (% citations)
Sample size: Institutional = 126, Wholesale = 108.
YesNo
WholesaleInstitutional
4648
5452

09
Percentage of respondents that believe factor investing can be extended to fixed income, commodities and currencies (% citations)
Sample size: Institutional = 128, Wholesale = 108.
Fixed Income CommoditiesCurrencies
Planned change in factor allocations over next three years (% citations)
Sample size: Passive Institutional = 108, Active Institutional = 129, Passive Wholesale = 96, Active Wholesale = 105.
DecreaseNo changeIncrease
Active factor strategies
Wholesale
Passive factor strategiesActive factor strategies
Institutional
Passive factor strategies
426 5
6843 64 52
26
55
32
43
Institutional Wholesale
78
7068
58
53
41

Theme 1 Factor investing adoption continues at pace as asset owners pursue a long-term approach
Key takeaways– Factor investing allocations have increased further, and
the intention to continue doing so remains elevated.– Investors are evaluating factor investing results over
a long-term period, treating their factor strategies more like asset classes (in contrast to their active management allocations).
– While many factors and strategies performed well over the previous year, two of the most popular strategies underperformed over the year to March 2019, putting pressure on performance for some respondents.
– Sources of funding for increased factor allocation include not just traditional active1 but also market-cap passive allocations, contrary to the view that factor investing is predominantly a threat to active management.
1 For the purposes of this report the term ‘traditional active’ means an investment style employed by portfolio managers who select investments based on independent assessment of each investment’s worth and attempt to choose those that are most attractive investments, with the objective to outperform a particular market and/or market-weighted index. Past performance is not a guarantee of future results.


12
The 2018 study found factor investing still early in its adoption process. While almost half of institutions worldwide had made some allocation to factors, most allocations were still small; i.e. under 20% of their equity allocation. The vast majority of investors were happy with the performance of their allocations: a significant majority had experienced better than expected performance. While investors reported difficulties in some areas of factor adoption (hiring staff, selling strategies internally), they were optimistic about the direction of travel.
Investors are increasing allocations, but are also looking to do things differentlyWith over half of the factor investors in the study intending to increase allocations over the next three years, adoption momentum is likely to continue (figure 1.1). However, after the experience of 2018, investors are increasingly of the belief that successful factor adoption requires evolution, with many moving from discrete single factor funds within an equity allocation, to sophisticated multi-factor approaches investing across asset classes.
This will help push factor investing towards the mainstream. As these strategies become a larger part of the portfolio, it will also be necessary for investors to change the way factors are monitored – from a typically asset class approach to a portfolio-level approach, as we discuss in theme four.
One of the notable characteristics of factor investors as a whole is that few have experienced a serious performance downturn. Most adopted factor investing after the financial crisis and those who adopted it in more recent years have enjoyed a backdrop of rising equity markets. It was observed that successful navigation of a period of more challenging performance was likely to be a pre-requisite for the migration of factor investing from the early adoption phase to mainstream.
Past performance is not a guarantee of future results.

13
Fig 1.1. Investors looking to increase factor allocations over next three years (% citations, by region, 2019)
Sample size: North America = 65, Europe, Middle East and Africa (EMEA) = 73, Asia-Pacific (APAC) = 66.
North America 65
APAC 55
EMEA 59
14
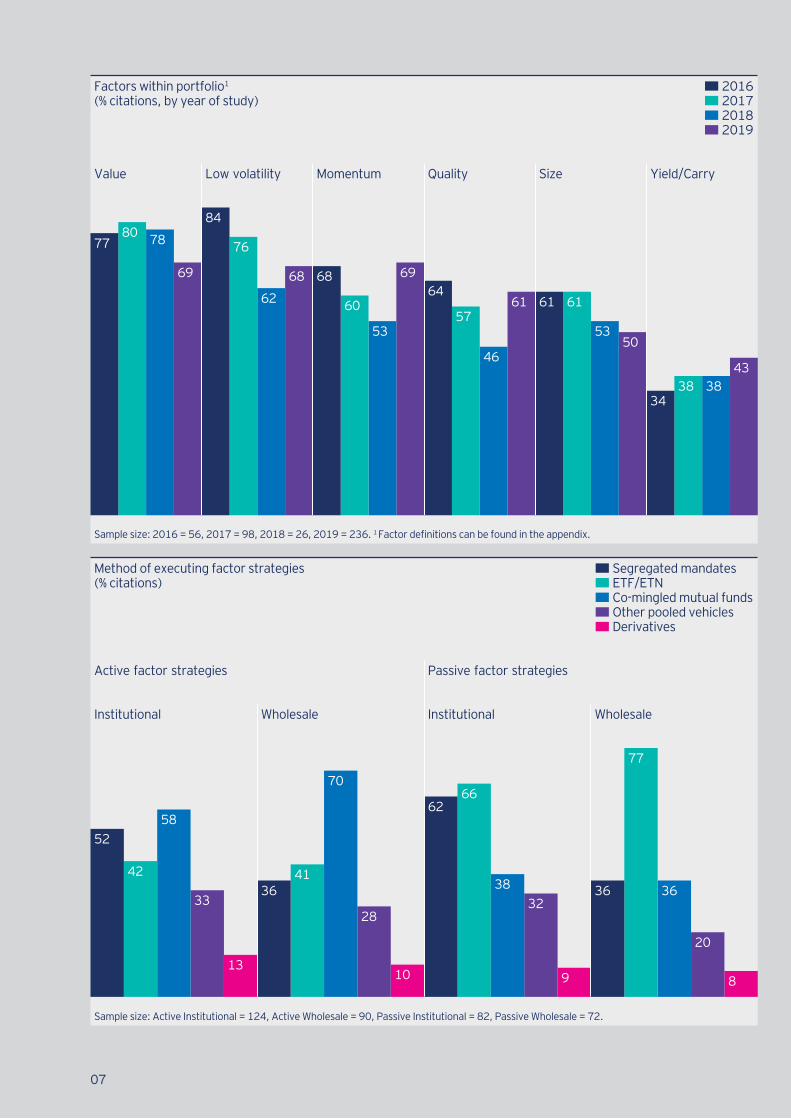
Fig 1.4. Perceptions of performance of factor allocations relative to active and market-weighted allocations 2018/2019 (% citations)
Sample size: In 2018, Institutional = 138, Wholesale = 158. In 2019, Institutional = 126, Wholesale = 106.
OutperformedIn lineUnderperformed
2018
Institutional
vs. Active vs. Market weighted
Wholesale
vs. Active vs. Market weighted
2019
Institutional
vs. Active vs. Market weighted
Wholesale
vs. Active vs. Market weighted
25 24 16 22 19 235238
61
56
68
41
53
4850
43
14
68 7
31 30 3134
Fig 1.2. 12-Month US Index Total Returns1 (%, as of 31 March 2019)
Total returns for the 12 months ended 31 March 2019. 'Low volatility' refers to the S&P 500 Low Volatility index; 'Momentum' refers to the S&P 500 Momentum index; 'Quality' refers to the S&P 500 Quality index; 'Size' refers to the S&P 500 Equal-Weighted index; 'Value' refers to the S&P 500 Enhanced Value index. Past performance is not a guarantee of future results. An investment cannot be made directly into an index. 1 Index definitions can be found in the appendix.
Low volatility 14.92
Momentum 12.74
Quality 9.74
Size 7.22
Value 2.17
S&P 500 9.50
Fig 1.3. 12-Month Global Index Total Returns2 (%, as of 31 March 2019)
Total returns for the 12 months ended 31 March 2019. 'Low volatility' refers to the MSCI World Minimum Volatility index; 'Momentum' refers to the MSCI World Momentum index; 'Quality' refers to the MSCI World Quality index; 'Size' refers to the MSCI World Equal Weight index; 'Value' refers to the MSCI World Value Weighted index. Past performance is not a guarantee of future results. An investment cannot be made directly into an index. 1 Index definitions can be found in the appendix.
Low volatility 9.71
Quality 9.27
Momentum 6.97
Value -0.62
Size -1.02
MSCI World 4.01

15
For US equity markets, the 12 months through March 2019 saw several factors outperform their respective cap-weighted benchmarks, including low volatility, momentum, and quality (figure 1.2 and 1.3). However, some of the most common factor strategies underperformed the S&P 500, most noticeably value. This was a largely global trend, with similar performance patterns also evident versus the MSCI World Index (figure 1.3).
With fieldwork for the 2019 study conducted in the second quarter of 2019, this global performance pattern was partly reflected in respondents’ report of performance. Some 66% -70% of factor investors participating in the 2019 study reported their factor investing strategies met or exceeded the performance of their traditional active or market-weighted allocations, but respondents were more likely to report recent underperformance than they were in 2018 (figure 1.4).
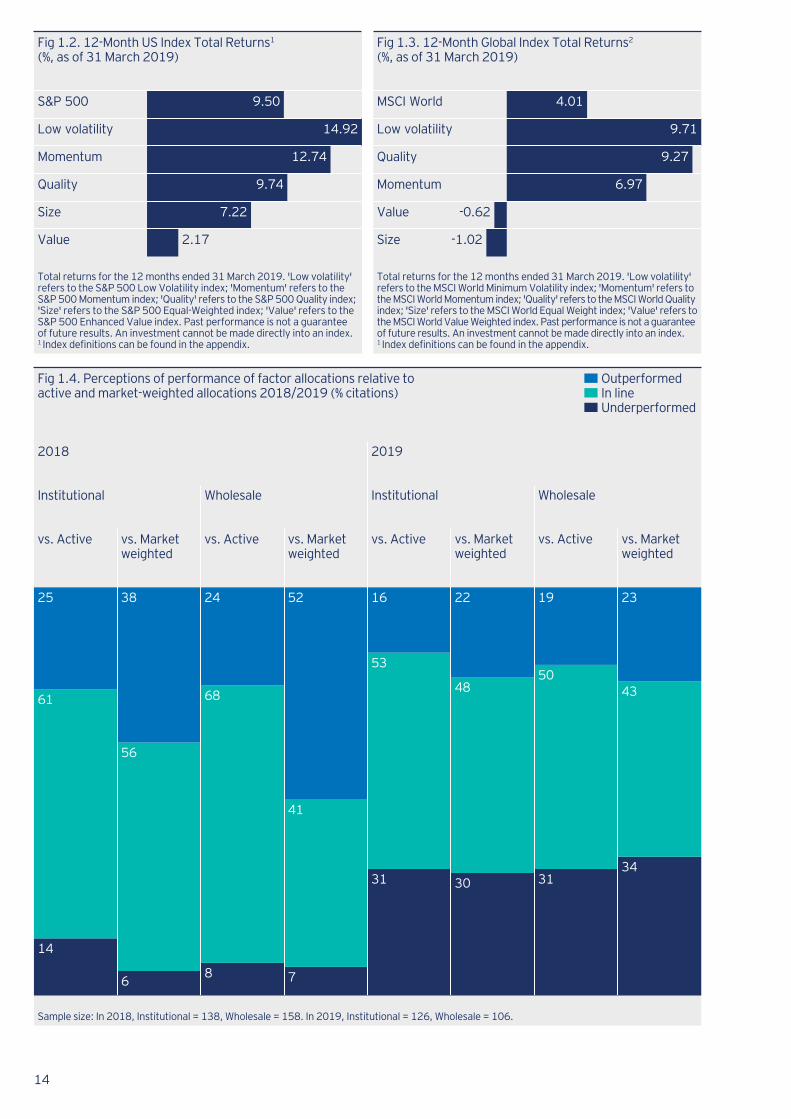
Looking at the regional experience:– 69% of North American investors reported their factor
investing allocations met or exceeded the performance of their market-weighted allocations – vs 59% against traditional active (figure 1.5).
– APAC investors fared best as a region; while ~25% experienced underperformance against both market-cap weighted and active allocations, this was outweighed by almost a third of investors reporting overperformance (figure 1.5). The outcomes experienced in APAC were supported by good results for factor strategies in Japan.
Another consequence is that factor investors shifted their strategy allocations, rebalancing exposure to quality, momentum and low volatility, with a reduction in allocations to value, as we explore later in the report. The value factor remains, however, as the factor with the largest overall allocation across respondents (figure 2.10) and continues to have the widest level of support among both wholesale and institutional investors, despite recent performance challenges (figure 2.11).
Past performance is not a guarantee of future results.

16
Factor investors take a relatively long-term performance lensGiven the lack of investor experience in dealing with more difficult years for factor strategies, a key question was how they would respond when such an event arrived. For most, more challenging conditions have not dampened their belief in the long-term case for factor investing or their appetite to continue along the adoption curve: ~45% of respondents increased factor allocations over the last 12 months.
As a result, average allocations to factor strategies have ticked up further for both institutional and wholesale investors – from 16% to 18% for institutional factor investors and 11% to 14% for wholesale (using a common cohort approach) (figure 1.6). In common with last year, the increase in factor allocations grew at the expense of both traditional active and market-cap passive strategies, reflecting that most investors are funding allocations from a mixture of sources. The trend continues to suggest that investors see factor investing playing a distinct role in the portfolio, augmenting and sometimes displacing both traditional active and market weighted passive strategies.
In regions where active managers are likely to have delivered outperformance, or where there was a heavy bias towards active management, asset owners are more likely to source funding for factor strategies from existing active strategies. This is the case in North America and APAC, where investors have been rebalancing portfolios after periods of sustained growth (figure 1.7).
The resilience of factor allocations through a period of underperformance is demonstrated by the relatively long timeframe that most investors are applying to their assessment. Most factor investors are strategic investors intending to harvest factor premia1 over the long term. Few are seeking short-term tactical gains – and as recent experience indicates, are therefore unlikely to be dissuaded by a short-term period of underperformance (which for most was within their expectations in any event).
This long-term perspective reflects the years of internal consideration and investment in research which most asset owners undertake before commencing investing in factor strategies, something which we observed in the 2018 study. Many investors in this year’s study noted they were making a long-term commitment, some incorporating factors into their strategic asset allocations and as a key part of their portfolio construction process as well as discrete allocations within asset classes.
1 Additional return due to exposure to factors.
17
Fig 1.5. Perceptions of performance of factor allocations relative to active and market-weighted allocations by region 2019 (% citations by region)
Sample size: Return vs. Traditional Active, APAC = 69, EMEA = 88, North America = 75. Return vs. Market weighted allocations, APAC = 68, EMEA = 80, North America = 71.
UnderperformedIn lineOutperformed
Return vs. Traditional Active
APAC EMEAEMEA North America
Return vs. Market weighted
APAC North America
23 28 41 25 39 31
4761
30
11 12
47
2649
25
36
15
54
Fig 1.7. Source of funding for increased factor allocations (% citations)
Fundamental activeMarket-cap weightedNew money
Sample size: APAC = 69, EMEA = 61, North America = 64.
North AmericaEMEAAPAC
78
42
28
62
54
69
83
53
30
Fig 1.6. Portfolio allocation (average allocation, common cohort)
Sample size: Institutional = 45, Wholesale = 25.
2019
Wholesale
20182019
Institutional
2018
16 18 11 14
26
58 57
25
24
65
24
62
Factor investingMarket-cap weightedFundamental active

18
Fig 1.9. Reasons for investing in factor strategies (rank, by region)
Sample size: Institutional = 128, Wholesale = 104.
Below total rankEqual to total rankAbove total rank
Wholesale Total APAC EMEA North America
Increase return 1 3 1 2
Reduce risk 2 1 2 1
Control portfolio exposures 3 2 5 5
Substitute indexing portfolio 4 6 4 4
Outperform fundamental managers 5 5 3 6
Reduce cost 6 4 8 3
Improve transparency 7 7 6 7
Improve benchmarking 8 8 7 8
Institutional Total APAC EMEA North America
Reduce risk 1 1 1 2
Increase return 2 2 2 1
Reduce cost 3 3 3 4
Control portfolio exposures 4 4 4 5
Improve transparency 5 6 7 3
Outperform fundamental managers 6 7 5 6
Substitute indexing portfolio 7 5 6 7
Improve benchmarking 8 8 8 8
Fig 1.8. Timeframe to assess factor strategies (% citations by region)
Sample size: APAC = 70, EMEA = 91, North America = 77.
APAC
EMEA
North America
4
4
3
17
14
22
44
44
52
15
29
14
20
9
9
One year2-3 years3-5 years
5-10 yearsOver 10 years
19
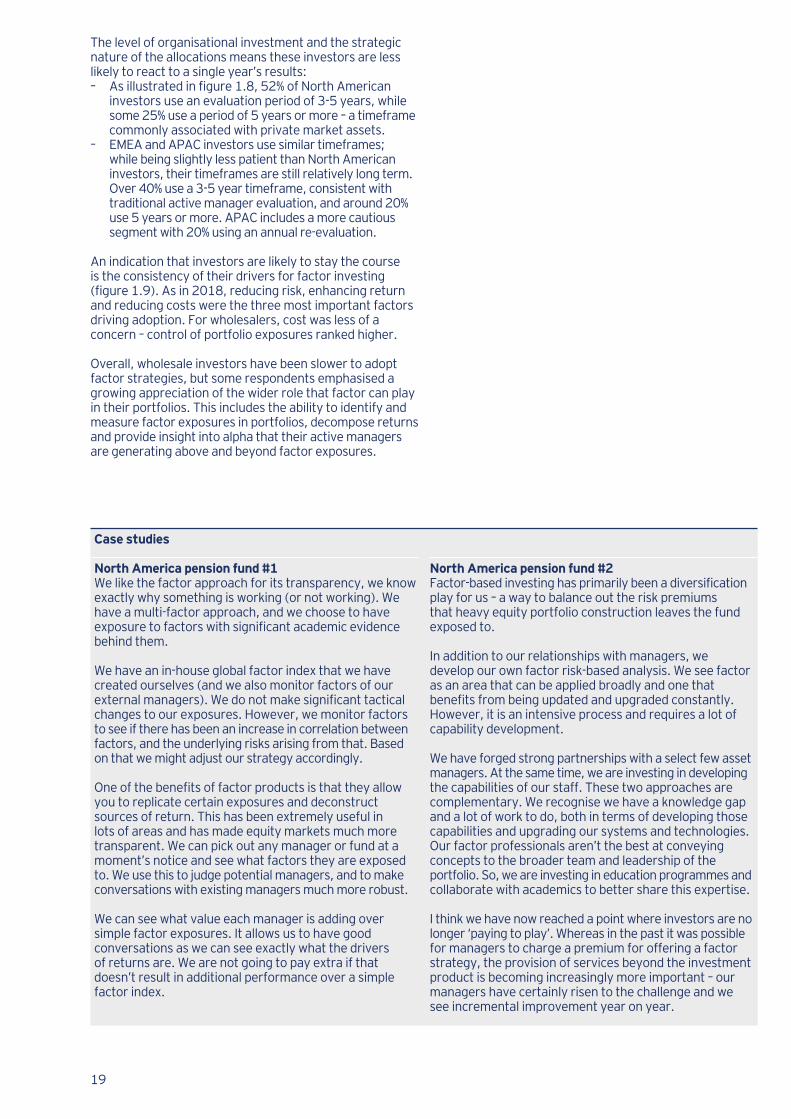
The level of organisational investment and the strategic nature of the allocations means these investors are less likely to react to a single year’s results:– As illustrated in figure 1.8, 52% of North American
investors use an evaluation period of 3-5 years, while some 25% use a period of 5 years or more – a timeframe commonly associated with private market assets.
– EMEA and APAC investors use similar timeframes; while being slightly less patient than North American investors, their timeframes are still relatively long term. Over 40% use a 3-5 year timeframe, consistent with traditional active manager evaluation, and around 20% use 5 years or more. APAC includes a more cautious segment with 20% using an annual re-evaluation.
An indication that investors are likely to stay the course is the consistency of their drivers for factor investing (figure 1.9). As in 2018, reducing risk, enhancing return and reducing costs were the three most important factors driving adoption. For wholesalers, cost was less of a concern – control of portfolio exposures ranked higher. Overall, wholesale investors have been slower to adopt factor strategies, but some respondents emphasised a growing appreciation of the wider role that factor can play in their portfolios. This includes the ability to identify and measure factor exposures in portfolios, decompose returns and provide insight into alpha that their active managers are generating above and beyond factor exposures.
Case studies
North America pension fund #1 We like the factor approach for its transparency, we know exactly why something is working (or not working). We have a multi-factor approach, and we choose to have exposure to factors with significant academic evidence behind them.
We have an in-house global factor index that we have created ourselves (and we also monitor factors of our external managers). We do not make significant tactical changes to our exposures. However, we monitor factors to see if there has been an increase in correlation between factors, and the underlying risks arising from that. Based on that we might adjust our strategy accordingly.
One of the benefits of factor products is that they allow you to replicate certain exposures and deconstruct sources of return. This has been extremely useful in lots of areas and has made equity markets much more transparent. We can pick out any manager or fund at a moment’s notice and see what factors they are exposed to. We use this to judge potential managers, and to make conversations with existing managers much more robust.
We can see what value each manager is adding over simple factor exposures. It allows us to have good conversations as we can see exactly what the drivers of returns are. We are not going to pay extra if that doesn’t result in additional performance over a simple factor index.
North America pension fund #2 Factor-based investing has primarily been a diversification play for us – a way to balance out the risk premiums that heavy equity portfolio construction leaves the fund exposed to.
In addition to our relationships with managers, we develop our own factor risk-based analysis. We see factor as an area that can be applied broadly and one that benefits from being updated and upgraded constantly. However, it is an intensive process and requires a lot of capability development.
We have forged strong partnerships with a select few asset managers. At the same time, we are investing in developing the capabilities of our staff. These two approaches are complementary. We recognise we have a knowledge gap and a lot of work to do, both in terms of developing those capabilities and upgrading our systems and technologies. Our factor professionals aren’t the best at conveying concepts to the broader team and leadership of the portfolio. So, we are investing in education programmes and collaborate with academics to better share this expertise.
I think we have now reached a point where investors are no longer ‘paying to play’. Whereas in the past it was possible for managers to charge a premium for offering a factor strategy, the provision of services beyond the investment product is becoming increasingly more important – our managers have certainly risen to the challenge and we see incremental improvement year on year.

Theme 2 Investors embrace active implementation as they move to dynamic factor approaches
Key takeaways– A large majority of factor investors choose an active
implementation approach and believe it is important to constantly evolve.
– On aggregate, allocations to the value factor decreased compared with prior years, and allocations to low volatility, momentum and quality factors increased.
– Factor strategies of the same name are increasingly not identical as customisation spreads: nearly 40% of institutional and wholesale investors prefer custom benchmarks over standard formulations.
– Concerns over crowding out are subdued as dynamic implementation sees strategies becoming increasingly wide ranging and diverse.


22
The case for factor investing is founded on the observation that the long-term performance of both individual securities and asset classes can be explained by their exposure to quantifiable investment factors. Academic research1 has shown that certain factors have earned a long-term premium, and therefore an investment strategy constructed around these investment factors can deliver enhanced risk-adjusted returns. However, factor theory research generally looks at sources of return over decades, and therefore successful implementation of factor investing requires a commensurately long-term approach and view of performance.2
As discussed in theme one, most respondents are in fact taking a long-term view of their factor exposures. However, this does not mean that factor users can afford to take a static approach to their allocations; respondents we spoke to in 2019 increasingly recognise it is not advisable to set and forget. This view is particularly prevalent amongst the more sophisticated factor investors with longer track records.
By a three-to-one majority factor investors now prefer an active approach to implementation (figure 2.1), and view success in factor investing as being contingent on constant evolution through the introduction of new factors, definitions, data sources, technologies and asset classes (figures 2.2 and 2.3).
In an implementation context:– The term 'active implementation' is used to describe
the implementation of a factor strategy being changed regularly at the discretion of the manager. This includes the use of single-factor or multi-factor models that are constantly monitored and enhanced.
– This contrasts with 'passive implementation', in which factor allocations closely follow an index in which factor definitions, allocation rules, rebalancing schedules, and other criteria are determined within the index construction methodology which is infrequently changed.
Past performance is not a guarantee of future results.1 Eugene F. Fama, Kenneth R. French (1992), “The Cross-Section of Expected Stock Returns”, The Journal of Finance 47(2); M.M. Carhart (1997), “On Persistence in Mutual Fund Performance”, Journal of Finance 52(1).
2 There is no assurance that factors will be successful or achieve their investment objective.

23
Fig 2.3. Envisaged approaches to evolution (% citations)
Sample size: Institutional = 110, Wholesale = 88.
Adopt newdata sources
Apply factors to new asset classes
Adopt new technology tools
Introduce new factors
Modify factor tilting and timing
6258 58
61 59 59
50 49
3843
Institutional Wholesale
Fig 2.1. Principle method of implementation of factor strategies (% citations)
PassiveActive
Sample size: Institutional = 129, Wholesale = 109.
Wholesale
29
Institutional
20
80
71
Fig 2.2. Investors believing factor approach evolution is important (% citations)
NoYes
Sample size: Institutional = 129, Wholesale = 108.
Wholesale
17
Institutional
14
8683

24
Fig 2.5. Return vs. market-weighted allocations over past 12 months (% citations)
Sample size: Active = 161, Passive = 55.
Preferred method of implementation
PassiveActive
30 40
24
16
46
44
UnderperformedIn lineOutperformed
Fig 2.4. Planned change in allocations to types of factor strategies over the next three years (% citations)
Sample size: Indexed factor strategies = 204, Active factor strategies = 234.
Indexed factorstrategies
5
Active factorstrategies
3
66
48
29
49
IncreaseNo changeDecrease

25
More dynamic approach to implementation offers multiple benefitsThe preference for active implementation highlights an important finding from this year’s study: investors increasingly believe that capturing the benefits of factor investing is in part dependent on a dynamic approach to implementation.
Over the next three years, nearly half of investors plan to increase their allocations to active implementation factor strategies, compared to a smaller 29% planning to increase their allocations to passive implementation strategies (figure 2.4). In addition to the view that this will deliver more sustainable factor performance, investors consider that an active mode of implementation can better deliver some of the key non-performance benefits of a factor approach, such as the control of risk exposures of the wider portfolio and tail risk management.1
This belief was rewarded in 2018-2019; investors that adopted an active approach were more likely to have registered outperformance within their factor allocations over the past 12 months (figure 2.5).
1 There is no assurance these views will come to pass.

26
Even where investors are implementing passively via a factor index, just under half of respondents prefer a custom approach to index design. This stands in stark contrast to the commonly accepted view that all factor strategies are identical and demonstrates how users increasingly tailor factor strategies towards specific outcomes.
Custom indices offer some of the same advantages as active implementation, including the potential for better management of factors within the wider portfolio and more control over factor definitions and metrics. In contrast, standard indexes are primarily used because of their ease, and to limit complexity (figures 2.6, 2.7 and 2.8).
Investors cite corollary benefits to taking a more hand-on approach, including knowledge sharing and expertise derived from working with asset managers to develop active strategies and custom indexes. Investors who have come to factor investing and are pursuing a test-and-learn approach see such relationships as a way of furthering their knowledge and strengthening their internal capabilities.
Separate to their preference for active vs passive implementation, respondents were divided on the case for adjusting factors tactically (shorter-term decisions to adjust factor weights to take advantage of perceived mispricing), with those in EMEA and North America more likely to make tactical adjustments (figure 2.9). This result is consistent with the more advanced stage of factor deployment in these regions. More sophisticated factor investors are more likely to entertain making tactical adjustments to enhance performance, and as a response to a change in correlations between factors.

27
Fig 2.7. Reasons for preferring standard factor index (% citations)
Sample size: Institutional = 59, Wholesale = 50.
Institutional Wholesale
Ease ofmonitoring
80
Ease ofimplementation
Complexity Cost Performance
66
5662
58
48 49 48
37
26
Fig 2.6. Passive implementation, preferred factor index (% citations)
Sample size: Institutional = 108, Wholesale = 97.
Wholesale
44
Institutional
42
58 56
CustomStandard
Fig 2.8. Reasons for preferring custom index (% citations)
Sample size: Institutional = 45, Wholesale = 42.
Institutional Wholesale
ESGTradingcosts/flawsof standardbenchmark
Ease ofimplementation
PerformancePreference offactor definitions/metrics
Control/integration offactors withinwider portfolio
6979
58
83
5645
38
1929
249
14

28
Fig 2.10. Factors within portfolio (% citations, by year of study)
Sample size: 2016 = 56, 2017 = 98, 2018 = 260, 2019 = 236.
2016201720182019
Value 77
Low volatility 84
Momentum 68
Quality 64
Size 61
Yield/Carry 34
80
78
69
76
62
68
60
53
69
46
57
61
61
53
50
38
38
43
Fig 2.9. Investors tactically adjusting exposures (% citations, by segment and region)
Sample size: APAC = 71, EMEA = 89, North America = 74.
YesNo
41 59 49 51 51 49
North AmericaEMEAAPAC
Fig 2.11. Belief in rationale for various factors (% citations)
Sample size: Institutional = 121, Wholesale = 90.
Value 86
Low volatility 76
Size 78
Quality 73
Momentum 68
Yield/Carry 72
Liquidity 63
91
89
83
75
76
68
73
Institutional Wholesale

29
Rise of multi-factor and active implementation suggest that active factor timing is occurring In 2018, we observed that following a rigorous internal research process, factor investors typically go on from their starting point (usually within equities) to implement multiple factor strategies either within the starting asset class or across the portfolio.
In 2019, we find this multi-year trend extending, reflected in the recent rise in usage of factors such as low volatility, momentum and quality (figure 2.10). At the same time as investors are moving to multi-factor, they are taking more active decisions about which factors to include or exclude. This is most notable via:– The gradual but steady reduction in use of the value factor.– A concurrent increase in the use of other factors,
particularly low volatility, momentum, and quality, which has resulted in a ‘flattening out’ of factors in use, and a narrowing in the gap between the most used and least used factors.
The decline in the use of the value factor (figure 2.10) comes after over a decade of regular underperformance.1 The rise in other factors with better performance over that time, such as quality and low-volatility,2 points to some loss of faith in value, but may hint at the possibility of factor performance chasing. While the academic community largely supports a long-term static approach to factor investing, in practice investors are taking a more dynamic approach.
Despite some decline in its use, the value factor continues to have the widest level of support among both wholesale and institutional investors, despite recent performance challenges (figure 2.11). This provides credence to the view that the decline in its utilisation and the inclusion of factors such as momentum and quality is in part due to a long-term trend towards multi-factor adoption.
Some of the more sophisticated investors in this year’s study noting the underperformance of value questioned how the value factor should be defined and captured in the prevailing economic environment, rather than raising serious questions about its viability as a factor. These respondents centred their comments on the increasing impact of technology, its long-term impact on the wider economy, and the potential creation of more ‘value traps’3 in sectors such as brick and mortar retail. The traditional definition of the value factor is seen by some investors as making it vulnerable to the increasing incidence of such value traps, with the performance implications that entails.
Past performance is not a guarantee of future results.1 MSCI ACWI Value Index (USD), Factsheet by MSCI, 25 September 2019.2 MSCI ACWI Quality Index (USD), Factsheet by MSCI, 30 September 2019 and MSCI ACWI Minimum Volatility Index (USD), Factsheet by MSCI, 30 September 2019.
3 A value trap is a stock that appears to be cheap because the stock has been trading at a low valuation metric for an extended time period. The trap springs when investors buy into the company at low prices and the stock continues to drop further.

30
Dynamic implementation requires new capabilitiesA preference for a dynamic approach to implementation is reflected in two of the most significant factor challenges being deciding which factors to include in the portfolio, and then how to best monitor these exposures. In contrast, while investors recognise the risk of factor crowding, they are generally not greatly concerned, and it is currently rated as the least important challenge (figure 2.12). However, active implementation of factor strategies requires new skills and internal capabilities, and in 2019, we find investors continuing to develop their internal factor capabilities (65% Institutional, 75% Wholesale) (figure 2.13). This is primarily manifested in an intention to develop expertise, either through education programmes, or by hiring additional factor specialists (figure 2.14). Education, be it formal academic material, or more informally delivered content, is considered particularly valuable.
While factor investing may be well understood by particular teams, it is often not well understood throughout the asset owner organisation, meaning that it can be difficult to communicate successes and challenges both internally and externally, and difficult to expand factor applications outside particular portfolio teams.
Some large institutional investors reported an interest in developing strategic partnerships with third parties, especially universities: one Asian sovereign reported a partnership with a prominent university to develop and apply factor theory to the local market, while other investors described ‘strategy share’ arrangements with managers. For these investors, collaboration is a valuable element of a necessary process of evolution.

31
Fig 2.12. Challenges of implementing factor strategies (average, rated 1-10)
Sample size: 215.
Risk/performance offactor strategies (i.e. poorperformance/high vol)
7.18
Monitoring factorexposures
6.93
Deciding on factor exposure (i.e. tiltingto specific factors)
6.54
Transparency concernse.g. understanding factormanager's strategy
6.53
Choosing newfactor products
6.50
Understanding wherefactor investing fitswithin the total portfolio
6.13
High turnover costsof factor strategies
5.91
Crowding out of factors 5.77
Assessing whether to add or remove factors in the portfolio
7.35
Fig 2.13. Current level of development of internal factor investing expertise (% citations)
Sample size: Institutional = 132, Wholesale = 108.
Wholesale
25
Institutional
35
49
16
54
21
No developmentSome developmentSignificant development

32
Fig 2.15. Method of executing factor strategies (active implementation) (% citations, by segment and assets under management)
Segregated mandatesETF/ETNCo-mingled mutual fundsOther pooled vehiclesDerivatives
Large (AUM>US$50bn)
Institutional Wholesale
Medium (AUM US$10bn-US$50bn)
Institutional Wholesale
Small (AUM <US$10bn)
Institutional Wholesale
78
4359
38 1678
28 67 220
2773531320
36604860
13
31
694423
83055
3835 13
Sample size: Large (AUM>US$50bn), Institutional = 37, Wholesale = 18, Medium (AUM US$10bn-US$50bn), Institutional = 25, Wholesale = 15, Small (AUM <US$10bn), Institutional = 60, Wholesale = 48.
Fig 2.16. Method of executing factor strategies (passive implementation) (% citations, by segment and assets under management)
Segregated mandatesETF/ETNCo-mingled mutual fundsOther pooled vehiclesDerivatives
Large (AUM>US$50bn)
Institutional Wholesale
Medium (AUM US$10bn-US$50bn)
Institutional Wholesale
Small (AUM <US$10bn)
Institutional Wholesale
254250
7510
2635
588
77
854
7723184147
718
76
2332
84
325343768
945
Sample size: Large (AUM>US$50bn), Institutional = 31, Wholesale = 12, Medium (AUM US$10bn-US$50bn), Institutional = 17, Wholesale = 13, Small (AUM <US$10bn), Institutional = 38, Wholesale = 44.
Fig 2.14. Areas of capability development (% citations)
Sample size: Institutional = 86, Wholesale = 80.
Institutional Wholesale
Staff with experience in factor investing 50
Consultants from academia or industry 50
Risk systems with specialised factor analytics 47
Structured education programmes for staff 41
Strategic partnerships with managers, academicinstitutions or index providers
36
Informal education efforts 51
21
38
41
34
49
56

33
Multiple implementation vehicles are used, with exchange-traded products used both passively and activelyInvestors have a wide range of factor implementation vehicles to choose from, and many use more than one type of vehicle across their portfolio to meet their objectives. – For active implementation there is a preference for
segregated mandates among larger institutional and wholesale investors, while mid-sized and small investors are more likely to opt for co-mingled mutual funds (figure 2.15).
– For passive implementation, larger investors are again more likely to use segregated mandates, but mid-sized and small investors are more likely to use exchange-traded products (ETPs) including exchange-traded funds (ETFs) and exchange-traded notes (ETNs) (figure 2.16).
However, the picture is not clear cut and other types of pooled vehicle play an important role for around a third of investors; while derivatives are used in the implementation of around 15% of active strategies.
Notably the use of ETPs is not limited to one type of investor or to just the implementation of passive strategies. These products also play an important part in the implementation of active strategies for nearly 60% of large institutional investors (AUM>US$50bn), usually in combination with other types of vehicle.
34
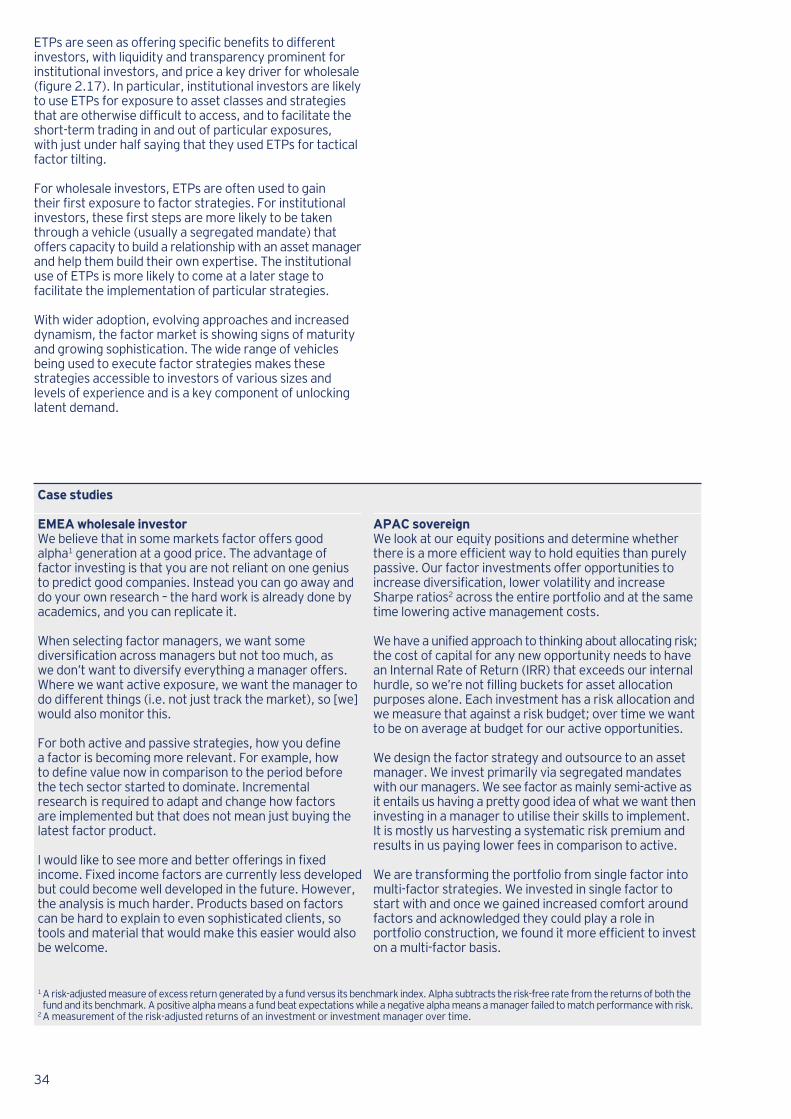
ETPs are seen as offering specific benefits to different investors, with liquidity and transparency prominent for institutional investors, and price a key driver for wholesale (figure 2.17). In particular, institutional investors are likely to use ETPs for exposure to asset classes and strategies that are otherwise difficult to access, and to facilitate the short-term trading in and out of particular exposures, with just under half saying that they used ETPs for tactical factor tilting. For wholesale investors, ETPs are often used to gain their first exposure to factor strategies. For institutional investors, these first steps are more likely to be taken through a vehicle (usually a segregated mandate) that offers capacity to build a relationship with an asset manager and help them build their own expertise. The institutional use of ETPs is more likely to come at a later stage to facilitate the implementation of particular strategies.
With wider adoption, evolving approaches and increased dynamism, the factor market is showing signs of maturity and growing sophistication. The wide range of vehicles being used to execute factor strategies makes these strategies accessible to investors of various sizes and levels of experience and is a key component of unlocking latent demand.
Case studies
EMEA wholesale investor We believe that in some markets factor offers good alpha1 generation at a good price. The advantage of factor investing is that you are not reliant on one genius to predict good companies. Instead you can go away and do your own research – the hard work is already done by academics, and you can replicate it. When selecting factor managers, we want some diversification across managers but not too much, as we don’t want to diversify everything a manager offers. Where we want active exposure, we want the manager to do different things (i.e. not just track the market), so [we] would also monitor this. For both active and passive strategies, how you define a factor is becoming more relevant. For example, how to define value now in comparison to the period before the tech sector started to dominate. Incremental research is required to adapt and change how factors are implemented but that does not mean just buying the latest factor product. I would like to see more and better offerings in fixed income. Fixed income factors are currently less developed but could become well developed in the future. However, the analysis is much harder. Products based on factors can be hard to explain to even sophisticated clients, so tools and material that would make this easier would also be welcome.
APAC sovereign We look at our equity positions and determine whether there is a more efficient way to hold equities than purely passive. Our factor investments offer opportunities to increase diversification, lower volatility and increase Sharpe ratios2 across the entire portfolio and at the same time lowering active management costs. We have a unified approach to thinking about allocating risk; the cost of capital for any new opportunity needs to have an Internal Rate of Return (IRR) that exceeds our internal hurdle, so we’re not filling buckets for asset allocation purposes alone. Each investment has a risk allocation and we measure that against a risk budget; over time we want to be on average at budget for our active opportunities. We design the factor strategy and outsource to an asset manager. We invest primarily via segregated mandates with our managers. We see factor as mainly semi-active as it entails us having a pretty good idea of what we want then investing in a manager to utilise their skills to implement. It is mostly us harvesting a systematic risk premium and results in us paying lower fees in comparison to active. We are transforming the portfolio from single factor into multi-factor strategies. We invested in single factor to start with and once we gained increased comfort around factors and acknowledged they could play a role in portfolio construction, we found it more efficient to invest on a multi-factor basis.
1 A risk-adjusted measure of excess return generated by a fund versus its benchmark index. Alpha subtracts the risk-free rate from the returns of both the fund and its benchmark. A positive alpha means a fund beat expectations while a negative alpha means a manager failed to match performance with risk.
2 A measurement of the risk-adjusted returns of an investment or investment manager over time.

35
Fig 2.17. Reasons for using ETFs for exposure to factors (% citations)
Sample size: Institutional = 81, Wholesale = 78.
Institutional 16Price
Transparency 17
Liquidity 35
Tactical factor tilting
15
Mandaterestrictions
17
Wholesale 38Price
Transparency 16
Liquidity 14
Tactical factor tilting
14
Mandaterestrictions
20
28 25
25 25
21 7
11 19
15 9
29 14
31 21
10 9
6 6
15 31
Rank 1Rank 2Rank 3

Theme 3 Factor investing and ESG: parallel developments, uncertain linkages
Key takeaways– With ESG moving beyond simplistic exclusion of
securities to include quantitative scoring, questions arise as to whether ESG and factor investing are synergistic or conflicting.
– The vast majority of respondents (existing factor investors) have also incorporated ESG; nearly half believe ESG complements factor investing, nearly half see it as neither complementing nor detracting, while 5%-10% see ESG as detracting from factor effectiveness.
– Environmental aspects of ESG are viewed as being most compatible with factor investing, ahead of Governance and Social aspects.
– Investors’ analysis of their ESG portfolios suggests a positive correlation with the quality factor and negative correlation with the value factor.
– A lack of tools, and the complexity of analysis, explain why only about a third of investors have conducted a factor analysis of their ESG portfolio.


38
All study respondents are factor investors of varying levels of adoption and sophistication, and around 85% are incorporating ESG considerations in parallel (figure 3.1). Equities is usually the initial focal point for both efforts. Most investors incorporating ESG considerations into the investment decision-making process start with equities (figure 3.2); theme one of the study reiterates the findings of past years that factor adoption also usually commences with equities, before fanning out into other parts of the portfolio. As they tread the path of ESG adoption and integration alongside their factor journey, investors are starting to consider the implications of these twin developments and the extent to which they interact in a synergistic or conflicting manner.
– ESG implementation by asset owners has typically been done with a significant qualitative element supported by quantitative measures such as ESG screens and scores. Such an approach can be resource-intensive in terms of internal governance teams and supporting capabilities, especially as ESG efforts move beyond equities. Some investors have questioned whether it may be possible for ESG implementation to be performed in a fully quantitative manner, such as via a factor approach, and thus reduce the burden of implementing ESG while improving outcomes.
– Investors have observed that factors such as quality can help explain the risk and return of a portfolio. ESG characteristics are considered by many to do similarly, raising questions of whether an ESG factor may exist, or whether ESG strategies are effectively a form of quality and/or other factors.
Factor and ESG initiatives are seen by many investors as interacting, usually for the betterThe parallel adoption of factor and ESG has led many investors to ask if the two initiatives could prove complementary. This is also a function of the evolution of ESG. In its early application, ESG consisted primarily of excluding certain stocks or sectors from portfolios. More recently, the availability of ESG scores across multiple dimensions has led to portfolio construction techniques very similar to those used in factor investing, whereby securities are ranked according to their scores on specific attributes.
Figure 3.3 illustrates that nearly half of respondents believe ESG complements the performance of factor strategies, while around half currently see ESG as not impacting factor strategy performance in either direction. However, a small – but not immaterial – proportion of respondents (9% for institutional and 5% for wholesale) believe ESG initiatives negatively impact factor strategy performance.

39
Fig 3.1. Respondents incorporating ESG by channel (% citations)
Sample size: Institutional = 132, Wholesale = 109.
Wholesale
85
Institutional
84
Fig 3.2. Asset classes incorporating ESG (% citations)
Sample size: 204.
Equities Fixed income Multi-asset Liquid alternatives Commodities
67
5346
34
12
Fig 3.3. Opinions on whether ESG complements or detracts from performance of factor strategies (% citations)
Sample size: Institutional = 116, Wholesale = 96.
ComplementsDetractsNeither complements nor detracts
Institutional 45
Wholesale 53
9
42
46
5
40
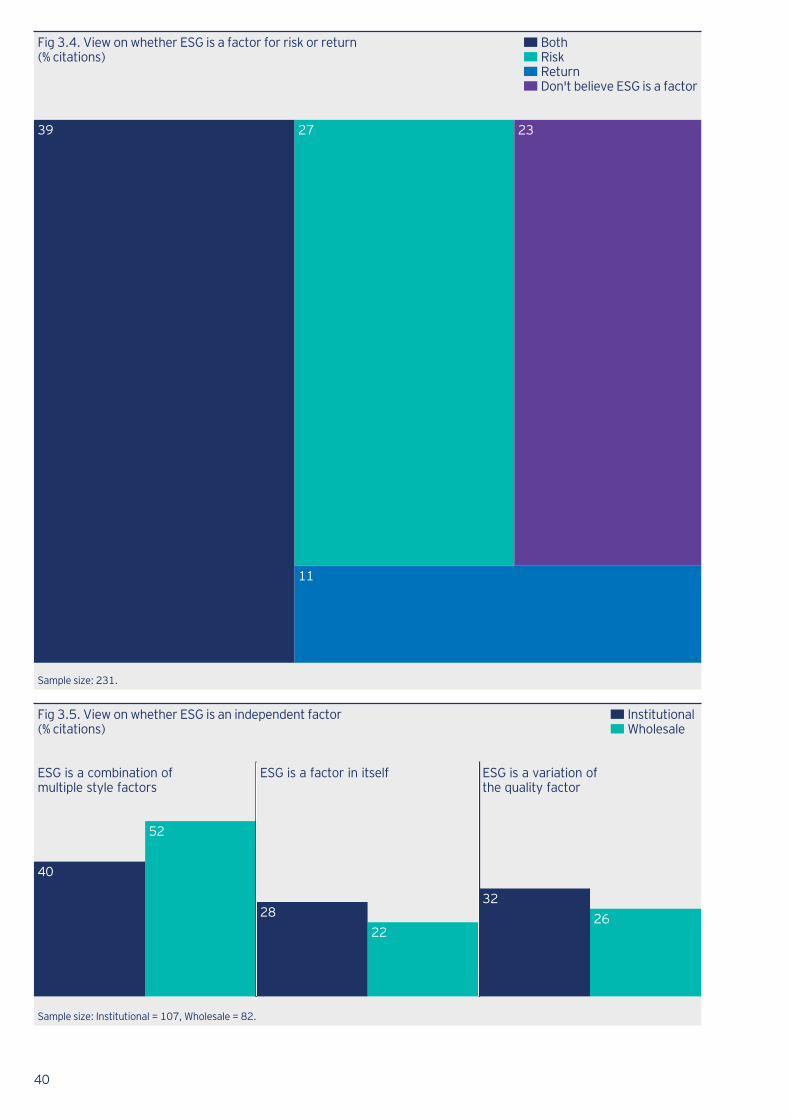
Fig 3.4. View on whether ESG is a factor for risk or return (% citations)
Sample size: 231.
39 27 23
11
BothRiskReturnDon't believe ESG is a factor
Fig 3.5. View on whether ESG is an independent factor (% citations)
Sample size: Institutional = 107, Wholesale = 82.
ESG is a combination ofmultiple style factors
ESG is a factor in itself ESG is a variation ofthe quality factor
40
52
28
22
32
26
Institutional Wholesale

41
This creates a picture where just over half of institutional factor investors, and just under half of wholesale, believe that their factor and ESG initiatives interact – usually for the better. They may be parallel implementations, but for many investors they are not independent of each other. This mostly positive or neutral perspective of interaction is important, because one of the main challenges for investors introducing ESG considerations to their portfolios has been gaining comfort that doing so would not dilute long-term performance. This is especially the case for defined benefit pension funds seeking to close deficits – their tolerance for initiatives which might create performance drag is low.
Understanding of the role played by ESG within factor is still limitedAs reaffirmed in theme one, factor investors are motivated by factor investing’s risk benefits, in addition to improvements in returns. Investors’ view of ESG as a factor is complementary to this prioritisation. Figure 3.4 shows that 27% of investors view ESG as a risk factor while 11% believe it is a return factor. A substantial 39% of investors currently see it as both, while only around a quarter (23%) don’t believe ESG is a factor at all.
For many this supports the view that ESG adoption can prove complementary to factor adoption. However, the widespread view that the two initiatives interact, and the existence of different views about how they interact, creates an impetus for investors to find evidence of the nature of the interaction and how the interaction works (e.g. ESG as a risk and/or return factor).
This has implications for how investors design their strategy to harvest these factors systematically and for implementation within the portfolio construction and risk monitoring framework. The existence of different schools of thought is also evident in views of whether ESG is an investment factor alongside traditional factors such as value (figure 3.5): – A significant minority (28% of institutional respondents
and 22% of wholesale) believe that ESG is an independent investment factor.
– A slightly larger proportion, just over one quarter, see ESG as a variation of the quality factor.
– The most common view – but far from dominant – is that ESG is a combination of style factors.
The broad range of views is partly a function of the current limitations around ESG data relative to the financial metrics that underpin traditional investment factors.

42
There is theoretical scope for one or more specific ESG factors to emerge as data becomes more reliable. For example, it is feasible that companies with stronger environmental credentials may deliver more sustainable earnings over the very long term in a way that is not currently priced into valuations. Equally, it is possible that outperformance (or underperformance) of an ESG influenced portfolio may prove to be a function of a resulting tilt towards certain established investment factors.
Despite the uncertainties, ESG and factors are being combined into portfolios. When asked how ESG was incorporated into their portfolio, 38% of investors cited the use of an ESG-specific index while 33% were doing so via a custom ESG index, both of which are rules-based approaches to ESG investment (figure 3.6). Most investors believed that elements of ESG could be incorporated through factor investing, particularly environmental aspects (figure 3.7), and several respondents had embraced ESG investing within the context of multi-factor portfolios. They highlighted the correlation between ESG factors and other factors such as quality and low volatility, and that a factor approach allowed them to best address their ESG needs.
One such investor implementing ESG and multi-factor via a custom index noted that ESG was the principal driver of their factor adoption. They had pursued a custom index approach as this offered more transparent implementation, critical to understanding exposures and correlations with other portfolio factors. Investors such as this observed that as a form of investing built around rules, factor models are well-placed to incorporate quantitative ESG criteria in a relatively low-cost manner.

43
Fig 3.6. Methods of implementing ESG into portfolios (% citations)
Sample size: 198.
Incorporate ESG intothe investment decision-making process
55
ESG specific index 38
Specific ESG mandate 36
Custom ESG index 33
Fig 3.7. Aspects of ESG that could be incorporated through factor investing (% citations)
Sample size: 182.
EnvironmentalSocialGovernance
84
64
66

44
Fig 3.8. Have conducted a factor exposure analysis on ESG portfolio/mandate (% citations)
Sample size: Institutional = 119, Wholesale = 99.
Wholesale
71
Institutional
66
3429
NoYes
Fig 3.9. Factor exposures of ESG portfolio/mandate (% citations)
Positive exposure Negative exposure
Sample size: Positive exposure = 61, Negative exposure = 49.
Quality
70
Momentum Low volatility Size Yield/Carry Liquidity Value
38
27
3633
30 29
15
37
18
53
4 2 2
Fig 3.10. Reasons for not conducting factor exposure analysis on ESG portfolio/mandate (% citations)
Rank 1Rank 2Rank 3
Sample size: 96.
Complexity 22
Lack of tools to beable to
16
Lack of internal resources (human)
17
Cost 19
2347
2725
1923
256

45
Better analysis will improve understanding of both factors and ESGBetter attribution analysis is seen as essential to untangling the effects of ESG implementation from traditional investment factors, and it is expected to assist in better combining the two in portfolio construction.
Both initiatives can benefit from this. Investors see factor analysis adding more rigour to the debate around how ESG impacts portfolio risk-return characteristics, as well as the potential to build factor models which both incorporate ESG requirements and take the impact of their interaction into account.
To date the implementation of factors and ESG have typically been separate efforts by asset owners, despite the evident interaction. Only around a third of factor investors have conducted a factor analysis of their ESG portfolio or mandate (figure 3.8). Investors that have conducted this analysis have found useful insights, in particular that ESG portfolios commonly have positive exposure to the quality factor and negative exposure to value (figure 3.9). With relatively few investors conducting this type of analysis, there is a risk that many do not have a clear view of how ESG integration affects their intended factor exposures. This highlights the potential for unintentional factor tilts that could affect risk-adjusted returns.
The issue is unlikely to disappear anytime soon. Factor adoption is usually driven bottom up by investment teams, while ESG adoption is often driven top down by asset owner stakeholders. Adoption of both taking place simultaneously or close in time is distinctly likely. The more sophisticated investors in our study see the potential issues in this confluence and are working to reconcile them.
This commitment is being supported by the investment of time and budget in research and analysis capabilities (another potential tailwind that could spur the pace of factor adoption). However, it is an area where many asset owners need assistance from external partners, given that the key obstacles are complexity of analysis and a lack of available tools (figure 3.10), traditional problems of internal teams with limited resources.

Theme 4 Future of factors: overcoming the barriers to scaling up
Key takeaways– Investors adopting factor investing see particular
advantages for the optimisation of risk and control over portfolio exposures through the use of technology. However, many see their capabilities as immature and needing further investment.
– Technology is seen as a route to the development of new factor strategies via the adoption of new data sources and techniques to harness innovative data sets.
– In APAC and EMEA, wholesale segment respondents see a lack of explicit client interest in limiting the adoption of factor investing. Client interest is more evident for North American respondents, but in all regions, the perceived complexity of factor investing is a hurdle for wholesale investor adoption.


48
Once adopted, most factor investors have subsequently increased their allocation intentions for factor strategies as their experience (typically within equities) meets or exceeds expectations. For some, allocation intentions also grow as they identify new ways to utilise factors.
Whether investors intend to deepen or broaden factor usage, scaled-up adoption can be hampered by a series of issues either not fully resolved at adoption, or not encountered until later. Investors cited practical and complex barriers, but with a hope that a focus on technology and innovation could lead to progress in overcoming them.
Scaling up demands better tools and systemsTwo of the most important drivers of factor adoption are the ability to optimise risk and exert more control over portfolio exposures, but for many this remains challenging to fully implement in practice. Only around a quarter of factor investors feel very confident they understand the full extent to which they are currently exposed to factors (figure 4.1).
This is particularly the case for less sophisticated and newer factor investors lacking the tools and experience to view their portfolio through a factor lens. But even very sophisticated investors are often yet to master the ability to monitor factor exposures across the multiple asset classes constituting their portfolio. Across all three regions, most investors identified a need for better tools that can help them monitor factor exposures and assist with portfolio construction (figures 4.2 and 4.3).

49
Fig 4.1. Confidence in knowledge of current factor exposures (% citations)
Sample size: 236.
Not confident
39
Somewhat confidentVery confident
35
26
Fig 4.2. Help needed from external asset managers to support factor strategies (% citations by region)
Sample size: APAC = 70, EMEA = 85, North America = 74.
64
58
32
34
56
50
35
38
35
45
36
34
22
16
Technology tools 74
New products 47
White papers 46
Custom factor portfolios 36
Tactical recommendations 36
Online education 24
Model portfolios 14
APAC EMEANorth America

50
Fig 4.4. Investors monitoring factor risk within portfolio (% citations)
Sample size: Institutional = 128, Wholesale = 107.
NoYes
Wholesale
45
Institutional
23
77
55
Fig 4.5. Methods for monitoring factor risk within portfolio (% citations)
Sample size: Institutional = 97, Wholesale = 58.
Off-the-shelfProprietary
Wholesale
50
Institutional
61
39
50
Fig 4.3. Most helpful tools (% citations by region)
Sample size: APAC = 70, EMEA = 81, North America = 74.
Factor allocationtools
41
Factor performancetools
26
Automated portfoliodiagnostics
37
Portfolio constructiontools
43
Factor exposuretools
47
52
42
49
36
44
14
33
41
19
53
APAC EMEA North America

51
A consequence of the need for better tools to measure factor exposures across the whole portfolio is a limitation in the ability to measure and monitor portfolio-wide factor risks. Around a quarter of institutional factor investors and nearly half of wholesale investors do not or cannot monitor overall factor risk within their portfolio (figure 4.4). Those that have implemented the monitoring of portfolio factor risks use a mixture of off-the-shelf and proprietary methods (ranging from the simple to the complex). Institutional investors are more likely to use off-the-shelf tools (figure 4.5). The more sophisticated factor investors have distinct characteristics in how they do so:– They combine outputs from tools from multiple
suppliers to generate a robust view of their exposures. – They are able to quickly examine potential new
investments to see how they would affect those exposures.
– They use such processes to drive discussions with active managers around their ability to deliver alpha above and beyond simple factor exposures, and the appropriate level of fees given the additional projected alpha.
Despite investors making the best of what is currently available in terms of tools, dissatisfaction is common, with systems criticised as being hard to customise, simplistic in their treatment of factors and unable to combine multiple asset classes and derivatives in a meaningful way.
For wholesale investors cost was also cited as a restriction, leaving many reliant on proprietary methods which may be rudimentary internal models, manually updated and requiring significant resources to maintain. A common refrain was the lack of integration between factor products and the tools used to monitor them, with demand for a single solution that could monitor exposures, offer recommendations in line with stated desired exposure, and then provide a shortlist of products that could help achieve these objectives.

52
Demand for factor products remains unsated Despite extensive industry development of factor products, a significant minority of equity investors still see the asset class as insufficiently covered by existing offerings. ln fixed income and liquid alternatives there remains high dissatisfaction with the offerings currently available (figures 4.6 and 4.7). This is especially the case among institutional investors and more experienced factor users, who are often looking to implement factor strategies that can play a very specific role within a portfolio. For example, an insurance company may look to gain exposure to equity premiums while controlling maximum capital loss using low volatility strategies.
These specific roles require a high-quality factor capability in tandem with a targeted product or strategy. In these instances, respondents generally craft strategies internally or in collaboration with external managers that can offer this combination. However, off-the-shelf products which can do the heavy lifting in more complex applications (and were seen as both desirable and necessary), often do not exist.
Education and technology support can help wholesale investorsAmongst the retail clients of wholesale investors, adoption of factor investing remains relatively low, with most wholesale investors indicating that less than a quarter of their clients have funds allocated to specific factor strategies (figure 4.8). Complexity of the theory is seen as a major obstacle to clear explanation and communication across all regions; client interest is also viewed as a substantial barrier particularly in EMEA and APAC (figure 4.9). North America is the exception; wholesale investors there are significantly more likely to be answering client questions about factor exposures (figure 4.10).

53
Fig 4.6. Asset classes not well covered by existing products (% citations)
Sample size: Institutional = 114, Wholesale = 101.
Institutional Wholesale
Liquid alternativesFixed income
88
Equities
25
15
86
75 75
Fig 4.7. Experience of those investors citing equity product coverage as inadequate (% citations)
Sample size: Institutional = 114, Wholesale = 101.
WholesaleInstitutional
79
21 13
87
Fig 4.8. Proportion of clients with specific factor investing strategies (% citations, wholesale only)
Sample size: 70.
70
7 10
13
0%–24%25%–50%More than 50%No clients
Low experience High experience

54
Fig 4.9. Main obstacles preventing clients adopting factor investing strategies (% citations, wholesale only by region)
Sample size: APAC = 22, EMEA = 31, North America = 17.
Complexity of theory Client interest
76
Lack of resources Complexity of exposure
6874
64
74
4741
23
41 41
3224
APAC EMEA North America
Fig 4.11. Methods of communicating about factor investing to clients and financial advisers (% citations, wholesale only)
Sample size: Advisers = 67, Clients = 46.
VideosWhite papersConferencesSeminars/Training days
82
46
58
46
5852
31 28
AdvisersClients
Fig 4.10. Frequency of client questions about factor exposures (% citations, wholesale only by region)
Sample size: APAC = 25, EMEA = 32, North America = 16.
EMEA 3
NorthAmerica
19
APAC 4
31
31
24
66
50
72
Rarely/not at allModerately frequentlyVery frequently

55
Respondents see education as essential. Most wholesale investors have taken steps to educate product distributors – usually through seminars and training days, although white papers and conferences were also seen to be useful (figure 4.11). Investors reported setting aside time in quarterly adviser and client briefings to improve factor understanding, as well as running adviser training programmes to try to address this knowledge gap. Many wholesale investors also struggle to maximise their use of technology. As discussed, the full benefits of factor investing require dedicated attribution tools and the ability to process data from custodians and asset managers. For wholesale investors building portfolios for clients, this is made more difficult given that each client might well have a different positioning. Tools which can easily produce customised factor reports for individual clients are seen as desirable and a route to furthering understanding and wholesale usage.
Tools to adequately evaluate and monitor strategies, and effective communication to stimulate and encourage adviser demand, are essential if the adoption of factor investing by a dedicated early vanguard is to progress to the wholesale mainstream. Asset manager assistance and support will be essential, as will the provision of better and affordable tools, if factor investing is to be fully embraced by wholesale investors.
Case studies
APAC pension fund For us, factor is primarily a question of boosting return, without taking on significant additional risk. It is a fundamentally long-term agenda. We have been using factor strategies for many years and the approach has become central to the portfolio. We are relatively experienced investors. A lot of the early challenges we faced have been addressed, at least to some degree. Internal capability supports the case for and execution of increases in use, so we are investing and developing capability to support any expansion. This is one of reason for our stepped approach. Having said that, monitoring is still a challenge. We looked at building in-house tools and buying off-the-shelf solutions. The off-the-shelf solutions are pretty basic. It is more likely we will invest in a full solution ourselves to support further usage; we are talking about risk attribution software, but it will take time. We allocate some part of our overall factor portfolio to asset managers; understanding their strategies has often been difficult. Being a public fund, transparency is increasingly important, and the Board is very sensitive to short-term performance. We are looking at expanding coverage outside conventional asset classes. This requires a significant amount of additional research and will probably take some time to implement.
EMEA wholesale investor We run model portfolios and private client portfolios. The two have recently come together to be run in a more aligned way. Portfolios were previously structured on a line-by-line basis, where we selected funds that we liked, and then fitted them within our asset allocation framework that underpinned all our models. That approach meant we struggled at times with high tracking error. So, we would have large allocations to value managers at a time when growth was outperforming, for example. We were looking for a way to deliver alpha alongside lower tracking error1 and decided to blend factors and largely isolate unwanted and excessive factor risk to ensure we weren’t taking unintended big bets. We then created more balanced factor portfolios, with simple tilts towards value, growth or quality. We think factors are a good way to drive conversations with clients, but it can be difficult as our funds are marketed by advisers and we are effectively talking to the distribution team. We explain that we are trying to build a cohesive portfolio that delivers alpha from several different regions, and that the use of factors allows us to structure a portfolio with lower volatility while also allowing us to use managers that might be too extreme in isolation. We focus on not selling the portfolio as line items but in that way it’s managed holistically – the risk characteristics and performance.
1 The divergence between the price behavior of a position or a portfolio and the price behavior of a benchmark.

Theme 5 Fixed income: the next frontier for factor investing
Key takeaways– There has been a substantial increase in the proportion
of respondents who believe factor investing can be applied to fixed income.
– Investors identify yield/carry as the top factor that can be identified in fixed income, partly explaining the increase to such strategies over the past 12 months, especially by sophisticated investors.
– Around one third of institutional and wholesale investors have been increasing their allocations to factor strategies within fixed income, led by institutional investors that already have high factor allocations across their overall portfolio.
– Despite the increased demand, over 80% of investors believe their factor product needs in fixed income are not yet adequately addressed.


58
The past 12 months has seen a notable increase in the proportion of respondents who believe that factor investing can be extended to fixed income. Some 70% of institutional investors and 78% of wholesalers now view the approach as being applicable to fixed income, up from 62% and 57% respectively in 2018 (figure 5.1). Respondents cited increasing research efforts in this area, as well the strong theoretical justification for factor premiums in a market that offers ample scope for inefficiencies. The growing belief in the applicability of factor investing to fixed income is tied to widespread recognition that the returns of all fixed-income portfolios, whether they are built utilising a factor-based approach or not, will be implicitly driven by exposure to factors. Of the potential factors identifiable within fixed income, belief in a yield/carry factor is the most prevalent, followed by liquidity, value and quality factors (figure 5.2).
There was recognition that any fixed-income manager could increase the potential return of their portfolio by increasing allocations to higher yielding assets. It was widely felt that this could be done systematically in a factor-based approach; for example:– The additional yield gained by holding less-liquid bonds
of older vintage or smaller issue size was viewed by respondents as being achievable via a strategy that targeted a liquidity factor.
– The strategy of buying ‘fallen angels’1 following credit downgrades (and forced sales by certain institutional investors with minimum credit rating requirements) was viewed as strategy that could be targeted through a value factor.
Demand for transparent and efficient targeting of fixed income factorsBond market inefficiencies, coupled with a near four-decade bull-market run have helped support the case for active management within fixed income, and active managers have been more likely to outperform their respective indexes than their counterparts in equities.2 This has made fixed income less susceptible to the wider industry trend towards index-based investing, with investors often preferring to avoid market cap-weighted indexes that by definition target the most highly indebted governments and companies.
Factor investing in fixed income would include many of the benefits that have driven the strong performance of active fixed-income strategies, while also offering transparency and a potentially attractive cost.
1 Bonds that at the time of issue were considered investment grade (BBB or higher) but that have dropped below that rating over time. A credit rating is an assessment provided by a nationally recognized statistical rating organization (NRSRO) of the creditworthiness of an issuer with respect to debt obligations, including specific securities, money market instruments or other debts. Ratings are measured on a scale that generally ranges from AAA (highest) to D (lowest); ratings are subject to change without notice.
2 Morningstar blog published on 23 August 2018, Active vs. Passive Managed Funds: Takeaways From Our Midyear Report.

59
Fig 5.2. Factors that can be identified in fixed income (% citations)
Sample size: 156.
QualityValueLiquidityYield/Carry
SizeLow volatilityMomentum
5464 46 42
39 39 19
Fig 5.1. Percentage of respondents that believe factor investing can be extended to fixed income (% citations)
Sample size: 2018 = 284, 2019 = 231.
WholesaleInstitutional
6270
57
78
20182019

60
Fig 5.3. Respondents increasing exposure to particular factors over past 12 months (% citations)
Sample size: 195. Respondents were asked to score their level of factor investing sophistication; those who self-scored as 4 or 5 out of 5 were placed into a ‘sophisticated factor investor’ segment while those who self-scored as 1–3 out of 5 were placed into a ‘less sophisticated factor investor’ segment.
Unsophisticated Sophisticated
Yield/CarryLow volatilitySizeQualityMomentumValue
20
34 34
30
44
35
19
31
29
39
15
26

61
Over the past 12 months there has been an uptick in adoption of carry strategies, particularly among more experienced factor users – something which can be partly explained by the rapid increase in the use of fixed income factors among this sub-set of respondents (figure 5.3).
Product issues remainDespite demand for the application of factor strategies within fixed income, a shortage of appropriate products is still evident, with nearly nine in ten respondents describing this asset class as not well covered by factor offerings (this reflects perceptions of coverage in terms of quality, not just quantity). As such only a minority of factor investors have made an allocation to fixed income.
Respondents also discussed the following issues:– Lack of consensus around definitions of factors in
fixed income.– Potential for confusion due to common terms being
applied to factors across equities and fixed income that do not necessarily correlate. For example, there was uncertainty around how the performance of the quality factor within equities (based on companies with low debt, stable earnings growth and profitability) would relate to the performance of a quality factor within fixed income (based on low volatility bonds with short maturities and low default risk).
– The research burden and data requirements of applying factor investing to fixed income may be beyond existing capabilities for some investors, resulting in less confidence in the ability to develop in-house strategies.
– Price modelling challenges given that issuances do not trade on an exchange, may trade infrequently, and may entail higher transaction costs due to lower liquidity.
In general, there was a view that for fixed income it was harder to simulate performance and as such some investors exploring fixed income allocations were planning to run paper portfolios to understand how theoretical results played out in a quasi-real-world setting.
Despite the challenges allocations to fixed income factors are increasingAs noted in theme one, investors have continued to build factor exposures over the past 12 months and are planning to continue this evolution in the coming years. Notably, we found investors are building factor exposures in two principle ways:– Adding to existing allocations (most commonly
equities), reflecting what is for some a staged approach to adoption.
– Introducing factor investing in other asset classes, especially fixed income.

62
Some 42% of institutional investors added to equities factors in 2018, while 35% added to fixed income factors (figure 5.4). For wholesalers, the figures were 46% and 32% respectively.
Among institutional investors, those adding to equities and fixed income tended to have distinct profiles. Over half of those investors increasing equity factor allocations have relatively low allocations to factor across their portfolio (less than 10%), while those increasing fixed income exposure tend to be experienced investors with high existing allocations to factors.
This supports the view of factor following the two-stage process of adoption identified last year:– Factor exposure is built first within equities.– After an evaluation period (during which exposure
might well be increased), factor implementation may be extended to fixed income.
In the wholesale segment, the picture is slightly different: investors with small allocations are more likely to be making allocations to fixed income. This is likely to be due to two reasons:– Wholesale investors are often users of solutions
products, which include fixed income strategies. – Wholesale investors are more often thematic investors,
looking to take advantage of a theme as efficiently as possible. For many of these investors, factor exposure is achieved through multi-asset factor funds that reduce the burden of research and monitoring.
In 2018, interest in extending factors across fixed income (and other asset classes) was predominantly something exhibited by more sophisticated investors. This year’s findings suggest that as investors move along the experience curve, demand for fixed income factor strategies will likely increase further. The fact that allocations are continuing to spread across portfolios suggests that factor is gaining a strategic footing in investing as a more transparent and efficient way of building a holistic portfolio.
Case study
EMEA insurer We are currently exploring the use of investment factors in our fixed income portfolio. Currently we look at our credit portfolio through the lens of macroeconomic exposures such as growth and inflation. However, it is rather rudimentary as it is hard to isolate macroeconomic exposure in the same way as investment factors. We are working with providers to discuss what a factor mandate in fixed income would look like and how it would work in real life. Factor strategies look great on paper, with the back-tested results offering impressive results. However, a question we need to answer is whether outperformance really exists or is it just an artefact of the model. One possibility is that we run a paper portfolio and look at the results. In particular we are interested in a systematic strategy that
can target a value factor in fixed income while avoiding the value traps (securities that appear cheap based on valuation metrics but which are actually not selling below their intrinsic value due to long-term factors not reflected in these metrics). We are also interested in momentum but as an insurance company we are currently undecided if a momentum factor can fit into our investment process given constraints around gain/loss realisation. ESG is also another area where we see factor playing a role. In our experience, fixed income securities with higher ESG ratings perform better in times of stress.1 We would be interested in exploring if there is a systematic way of harnessing this. However, the data needs to improve to make this possible and we are therefore looking at new technologies and solutions around big data that can provide more timely assessments of ESG to feed into a model.
1 Henke (2016), The effect of social screening on bond mutual fund performance, Journal of Banking & Finance, 67, 69-84.

63
Fig 5.4. Change in factor allocations by asset class over past 12 months (% citations)
Institutional
Equity Fixed income
Wholesale
Equity Fixed income
18
40
42
12 14 16
5340
52
35
46
32
Decreased MaintainedIncreased
Sample size: Institutional = 124, Wholesale = 107.
Factor allocation <10%10%-20%20%-30%Factor allocation >30%
32
73
128
51
145 5
Sample size: Equity = 52, Fixed Income = 34.
Fig 5.5. Portfolio allocations to factor of institutional investors increasing allocations (% citations, institutional investors increasing allocations)
EquityFixed income

Appendix


Sample and methodology The fieldwork for this study was conducted by NMG’s strategy consulting practice. Invesco chose to engage a specialist independent firm to ensure high-quality, objective results. Key components of the methodology include:– A focus on the key decision makers conducting
interviews using experienced consultants and offering market insights.
– In-depth (typically 1-hour) face-to-face interviews using a structured questionnaire to ensure quantitative as well as qualitative analytics were collected.
– Results interpreted by NMG’s strategy team with relevant consulting experience in the global asset management sector.
In 2019, the fourth year of the study, NMG conducted interviews with 241 different pension funds, insurers, sovereign investors, asset consultants, wealth managers and private banks globally. Together these investors are responsible for managing US$25.1 trillion in assets (as of 31 March 2019).
In this year’s study, all respondents were ‘factor users’, defined as any respondent investing in a factor product across their entire portfolio and/or using factors to monitor exposures. We deliberately targeted a mix of investor profiles across multiple markets, with a preference for larger and more experienced factor users. The breakdown of the 2019 interview sample by investor segment and geographic region is displayed in figures 6.1, 6.2 and 6.3. Institutional investors are defined as pension funds (both defined benefit and defined contribution), sovereign wealth funds, insurers, endowments and foundations.
Wholesale investors are defined as discretionary managers or model portfolio constructors for pools of aggregated retail investor assets, including discretionary investment teams and fund selectors at private banks and financial advice providers, as well as discretionary fund managers serving those intermediaries. Invesco is not affiliated with NMG Consulting.
66

67
Fig 6.1. Assets under management by segment (US$ trillion, as of 31 March 2019)
WholesaleInstitutional
16.9
8.2
Fig 6.2. Sample by segment
WholesaleInstitutional
52
80
144132
28
156
109
14
Fig 6.3. Sample by region
APAC EMEA North America
1629
6573
3247
145
91
1832
9077
2016201720182019
2016201720182019

68
Definitions Value: Seeks to capture excess returns to securities that have low prices relative to similar peers and higher expected returns than a benchmark index in the long run. Low volatility: Seeks to capture improved risk adjusted returns of less volatile securities compared to more volatile securities or the average volatility of the market.
Momentum: Seeks to capture excess returns to securities with stronger past performance.
Quality: Seeks to capture excess returns to securities that are characterised by ‘quality’ metrics such as low debt, stable earnings growth, and profitability of stocks for instance.
Size: Seeks to capture excess returns of smaller firms (by market capitalisation) for stocks or smaller issues for bonds relative to their larger counterparts.
Yield/carry: Seeks to capture the excess returns from higher-yielding assets relative to lower-yielding assets.
Institutional investors are defined as pension funds (both defined benefit and defined contribution), sovereign wealth funds, insurers, endowments and foundations. Wholesale investors are defined as discretionary managers or model portfolio constructors for pools of aggregated retail investor assets, including discretionary investment teams and fund selectors at private banks and financial advice providers, as well as discretionary fund managers serving those intermediaries.
The S&P 500, or just the S&P, is a stock market index that measures the stock performance of 500 large companies listed on stock exchanges in the United States.
The S&P 500® Low Volatility index measures performance of the 100 least volatile stocks in the S&P 500.
The S&P 500® Momentum index is designed to measure the performance of securities in the S&P 500 universe that exhibit persistence in their relative performance.
The S&P 500® Quality index is designed to track high quality stocks in the S&P 500 by quality score, which is calculated based on return on equity, accruals ratio and financial leverage ratio.
The S&P 500® Equal Weight index (EWI) is the equal-weight version of the widely-used S&P 500. The index includes the same constituents as the capitalization weighted S&P 500, but each company in the S&P 500 EWI is allocated a fixed weight – or 0.2% of the index total at each quarterly rebalance. The S&P 500 Enhanced Value index is designed to measure the performance of the top 100 stocks in the S&P 500® with attractive valuations based on “value scores” calculated using three fundamental measures: book value-to-price, earnings-to-price, and sales-to-price.
The MSCI World index is a broad global equity index that represents large and mid-cap equity performance across 23 developed markets countries.
The MSCI World Minimum Volatility (USD) index aims to reflect the performance characteristics of a minimum variance strategy applied to the MSCI large and mid cap equity universe across 23 Developed Markets countries*. The index is calculated by optimizing the MSCI World Index, its parent index, for the lowest absolute risk (within a given set of constraints). Historically, the index has shown lower beta and volatility characteristics relative to the MSCI World Index.
The MSCI World Momentum index is based on MSCI World, its parent index. It is designed to reflect the performance of an equity momentum strategy by emphasizing stocks with high price momentum, while maintaining reasonably high trading liquidity, investment capacity and moderate index turnover.
The MSCI World Quality index is based on MSCI World, its parent index. The index aims to capture the performance of quality growth stocks by identifying stocks with high quality scores based on three main fundamental variables: high return on equity (ROE), stable year-over-year earnings growth and low financial leverage. The MSCI Quality Indexes complement existing MSCI Factor Indexes and can provide an effective diversification role in a portfolio of factor strategies.
The MSCI World Equal Weighted index represents an alternative weighting scheme to its market cap weighted parent index, the MSCI World Index. The index includes the same constituents as its parent (large and mid cap securities from 23 Developed Markets countries). However, at each quarterly rebalance date, all index constituents are weighted equally, effectively removing the influence of each constituent’s current price (high or low). Between rebalances, index constituent weightings will fluctuate due to price performance.
The MSCI World Value Weighted index is based on a traditional market cap weighted parent index, the MSCI World Index. The MSCI World Value Weighted Index reweights each security of the parent index to emphasize stocks with lower valuations. Index weights are determined using fundamental accounting data—sales, book value, earnings and cash earnings—rather than market prices.

Important information All data provided by Invesco as at 31 March 2019, unless otherwise stated. The opinions expressed are current as of the date of this publication, are subject to change without notice and may differ from other Invesco investment professionals.
The document contains general information only and does not take into account individual objectives, taxation position or financial needs. Nor does this constitute a recommendation of the suitability of any investment strategy for a particular investor. This is not an invitation to subscribe for shares in a fund nor is it to be construed as an offer to buy or sell any financial instruments. Past performance is not indicative of future results. Diversification does not guarantee a profit or eliminate the risk of loss.
Survey participants experience may not be representative of others, nor does it guarantee the future performance or success of any factor, strategy or product. There may be material differences in the investment goals, liquidity needs, and investment horizons of individual and institutional investors.
Invesco Ltd., Two Peachtree Pointe, 1555 Peachtree Street, N.E., Suite 1800, Atlanta, GA 30309.
Publication date: 21 October 2019.