Embed Size (px)
Citation preview

Inverter Control Center
USER MANUAL
We are the only author of ICC. Buy only at ICCSoftware.co.za. Only Clients from ICC website will be supported !

2
Table of Contents ABOUT THIS MANUAL ....................................................................................................................................................... 3
Purpose ...................................................................................................................................... 3 SAFETY INSTRUCTIONS ...................................................................................................................................................... 3 INTRODUCTION ................................................................................................................................................................. 5
Features ..................................................................................................................................... 5 BASIC METHOD OF OPERATION ........................................................................................................................................ 6 INSTALLATION ................................................................................................................................................................... 7
Unpacking and Inspection .......................................................................................................... 7 Preparation ................................................................................................................................. 7 First Things First ......................................................................................................................... 8 Configuring ICC Software - Battery Settings .............................................................................. 9 Configuring ICC Software - Cloud Posting ............................................................................... 10 Configuring ICC Software - Email Settings .............................................................................. 12 Configuring ICC Software - Updates ........................................................................................ 12 Configuring ICC Software - Setup ............................................................................................ 14
OPERATION ..................................................................................................................................................................... 17 Operation - Dashboard Tab ..................................................................................................... 17 Operation - Dashboard2 Tab ................................................................................................... 19 Operation - Inverter/Battery Values Tab .................................................................................. 20 Operation - Grid Trends Tab .................................................................................................... 23 Operation - Load Trends Tab ................................................................................................... 24 Operation - PV Trends Tab ...................................................................................................... 25 Operation - Battery Trends Tab ............................................................................................... 26 Operation - Hour Totals Tab .................................................................................................... 27 Operation - Threads Info Tab ................................................................................................... 28 Operation - Totals Tab ............................................................................................................. 29 Operation - Error Logs Tab ...................................................................................................... 31 Operation - Cluster Info Tab ..................................................................................................... 32
REPORTING -‐ EMONCMS ................................................................................................................................................. 33 Overview .................................................................................................................................. 33 Reporting - Understanding Emoncms Inputs ........................................................................... 33 Reporting - Understanding Emoncms Feeds ........................................................................... 40
3
REPORTING -‐ EMONCMS DASHBOARDS ......................................................................................................................... 41 Reporting - Emoncms Dashboards (Single) ............................................................................. 41 Reporting - Emoncms Dashboards (Grid Consumption) .......................................................... 42 Reporting - Emoncms Dashboards (Power Generated) .......................................................... 42 Reporting - Emoncms Dashboards (Battery Consumption) ..................................................... 43 Reporting - Emoncms Dashboards (Battery Health) ................................................................ 43 Reporting - Emoncms Dashboards (Overview Of The Different Power Sources) .................... 44 Reporting - Emoncms Dashboards (General) .......................................................................... 45 IMPORTANT CUSTOMIZATION NOTE: ................................................................................. 45 Accessing ICC remotely ........................................................................................................... 47
WARRANTY INFORMATION ............................................................................................................................................. 48 TROUBLESHOOTING ........................................................................................................................................................ 49 DOCUMENT CONTROL .................................................................................................................................................... 50
ABOUT THIS MANUAL Purpose
This manual describes the installation, operation and troubleshooting of the Inverter Control Center based on Raspberry PI technology. Please read this manual carefully before installation and operation. Keep this manual for reference.
SAFETY INSTRUCTIONS WARNING: This chapter contains important safety and operating instructions. Please
read this section carefully before proceeding.
• To reduce risk of electric shock, ensure that all electrical connections are made by qualified personnel.
• For optimum operation, ensure that the power supply to the Raspberry PI is connected to an uninterruptable source.
• Be very cautious when working with metal tools on or around batteries. A potential risk exists to drop a tool to spark or short circuit batteries or other electrical parts and could cause an explosion.
• Ensure that the inverter used is connected to a permanent grounded wiring system. Be sure that your installation complies with local requirements and regulation before installing or connecting the Raspberry Pi to your system.

4
• The Raspberry PI contains no serviceable parts and as such should be disposed of properly.

5
INTRODUCTION Inverter Control Center software was designed to monitor a wide variety of popular inverters available on the market today. It runs on a Raspberry PI model 3B, and consumes very little power. It is small enough to be installed with the solar system of your choice, and once configured it can run headless (without screen, keyboard or mouse). Its comprehensive dashboard for both single and multiple inverter setups give the end user a true reflection of how the system is performing in real time and allows for tracking the performance of the system over time.
Features • Monitor all power sources together with what is used when in real time. • Calculate total amount of power produced and consumed from both solar panels, batteries and/or grid.
• Determine the maximum load per hour / per day. • Determine the maximum PV produced per hour / per day. • Monitor a host of different variables from the attached inverter(s) in real time. • Comprehensive monitoring of the batteries attached to a system including state of charge
(SOC), voltage, wattage used, amps used. • Can optionally be connected to a Victron BMV-702 battery monitor for precise battery
monitoring. • Switch between grid and battery power at specific times or based on certain state of charge
(SOC) values. • Ability to email end user with any errors the system may experience like overload,
overheating, low battery warnings, etc. • Built-in dashboard for viewing everything happening in the solar system in an easy to use
and understand manner. • Support for both USB and serial (RS232) connection to the inverter of your choice.

6
BASIC METHOD OF OPERATION The following illustration depicts the basic method of operation of the system:
The Raspberry PI is in constant communication with the inverter and gathers all the performance and operating data exposed by the system, which is then logged to a database while being displayed on an interactive dashboard in real time.

7
INSTALLATION Unpacking and Inspection Before installation, please inspect the package to ensure that nothing is damaged. You should have received the following items:
• 1 x Raspberry PI in a casing • 1 x 16GB Micro SD Memory card (pre-installed in unit) • 1 x Raspberry PI Power supply
Preparation Before connecting the system to your inverter, please ensure that you have the following items available for first-time use. These items may not be necessary after the initial configuration:
• Monitor with HDMI interface and cable. • USB keyboard. • USB mouse. • Wi-Fi network with internet access • USB Communication cable for your inverter
Lastly, please make sure that the power supply for the Raspberry PI is powered by your inverter, so that it gets clean constant power. Connect the one end of your USB communication cable to the respective communications port on your inverter, and the other end of the cable into any one of the 4 USB ports on the Raspberry PI. Connect the USB keyboard and mouse to the remaining USB ports and plug in the HDMI cable. Once done, you may connect the power supply to the unit. It will run through the startup sequence and load the operating system. The ICC software will start automatically once the operating system is loaded.

8
First Things First The first thing to configure is to join the Raspberry Pi to a Wi-Fi network with Internet access. This is required for updates, as well as viewing the dashboard remotely. Wireless connections can be made via the network icon at the right hand side of the menu bar.
The icons on the right show whether a network is secured or not, and its signal strength. Click the network that you want to connect to. If it is secured, a dialogue box is will prompt you to enter the network key:
Enter the key and press OK, then wait a couple of seconds. The network icon will flash briefly to show that a connection is being made. When it is ready, the icon will stop flashing and show the signal strength. At this point ICC is ready to be configured.
9
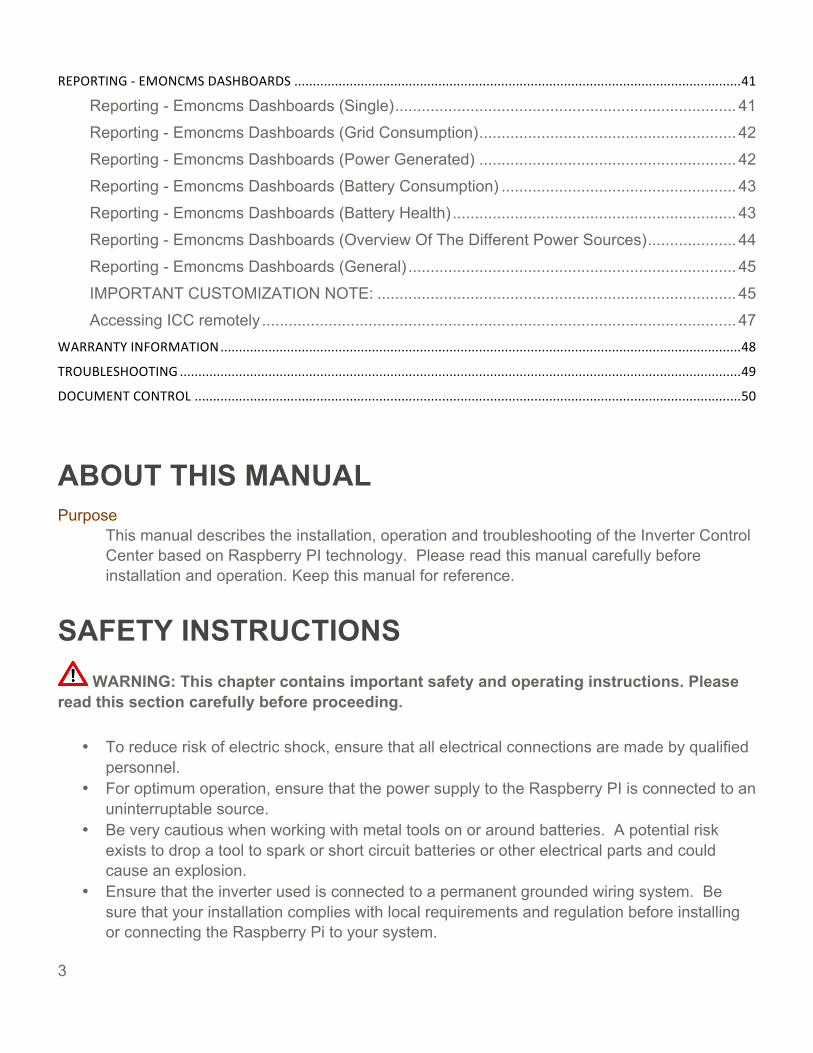
Configuring ICC Software - Battery Settings On the ICC console, click on the "Settings" Tab and then on "Battery" and configure the following settings:
The software can be configured to use the State of Charge (SOC) of the batteries to control whether the system is running on grid power or battery power. To enable it, tick "Use SOC for Control", and then configure the percentage at which the batteries will fail over to grid power, as well as when they will automatically go back to batteries. In the example above, the batteries can discharge until 20% has been drained from them (so they still have 80% left in them), at which point the system will tell the inverter to fail over to grid power. It will then stay on grid power until the batteries are 100% charged again, and only then will it go back to solar/battery mode.
CAUTION: Different batteries will have different settings. If this setting is used, please ensure that the correct SOC is chosen, as the wrong settings can harm your batteries and/or substantially reduce their performance and expected lifetime.
Another way of changing the system between grid and solar power is to let it run on grid power and solar power at different times of the day. To use this setting, tick "Use Time for Control", and configure the time of the day that the system will start using batteries, as well as the time that it will change back over to grid power.
CAUTION: Different batteries will have different settings. If this setting is used, please ensure that the correct SOC is chosen, as the wrong settings can harm your batteries and/or substantially reduce their performance and expected lifetime.
If you have a Victron BMW-702 Battery Monitor, you can optionally connect it to the Raspberry Pi as well and tick the box to enable the system to use it. This will instruct the system to rather look at the values received from the BMW-702 for precise battery monitoring and SOC control, and ultimately ensure the best possible lifetime for the connected battery stack.
10
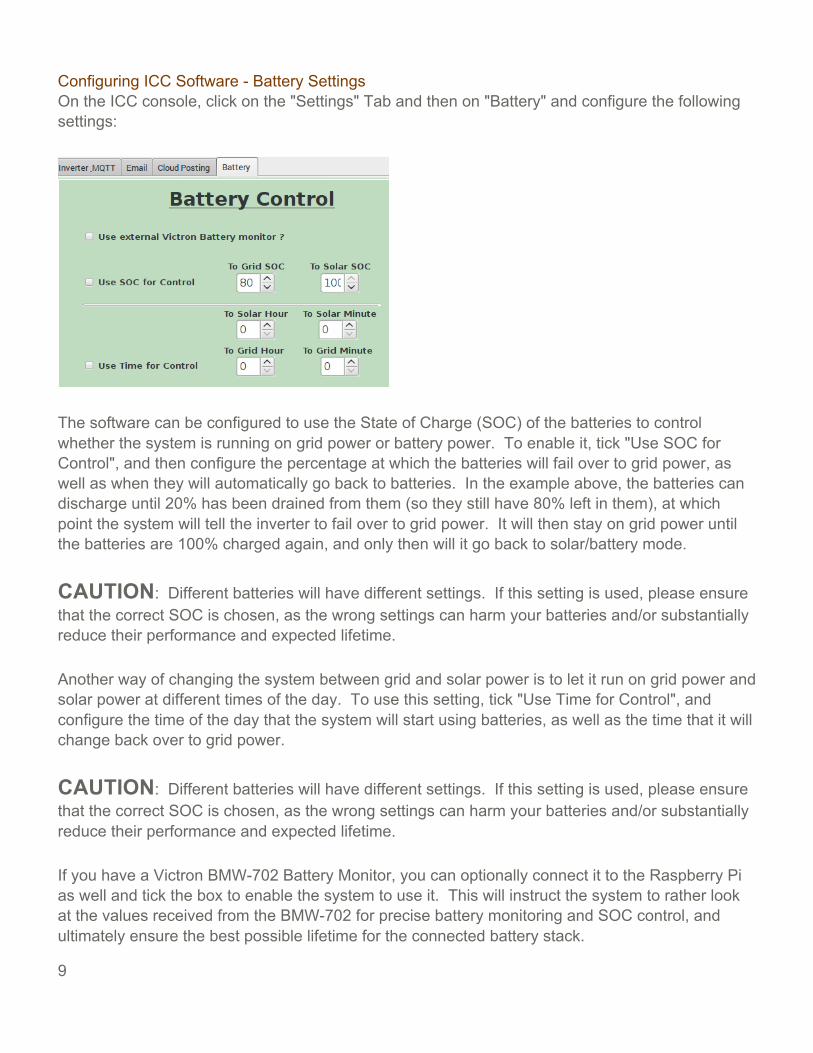
Configuring ICC Software - Cloud Posting
A key feature of ICC is the ability to push all the data collected from the inverter(s) to Emoncms, where it is stored in a database and presented as a series of graphs that make it easy to understand what's going on in the solar system as a whole. As of version 2.2.0, ICC can push data both to the local instance of Emoncms running directly on the Raspberry Pi as well as to Emoncms.org which is hosted in the internet at the same time. This allows for the end user to see what's happening in the solar system, and also push the same data to the installer.
The result is that the installer can monitor all of the systems they built in a single dashboard, and also have the ability to drill down to the respective client's system if they need to see more information about the system.
The locally configured instance of Emoncms running directly on the Raspberry Pi has been pre-configured with dashboards for both single and parallel inverter setups, and can be edited easily to match the setup of the installed system.
To have data posted to Emoncms hosted in the cloud, go to www.emoncms.org and register a new account free of charge. Once logged in, click on "Setup" in the top right, and select "My Account". In the page that opens up, note the "Write API Key". Back in ICC on the Raspberry Pi, under "Emoncms Server 2", enter https://emoncms.org/ and paste the API key copied form the "My Account" page. Tick the box that says "Post Emoncms 2" to complete the configuration.
11
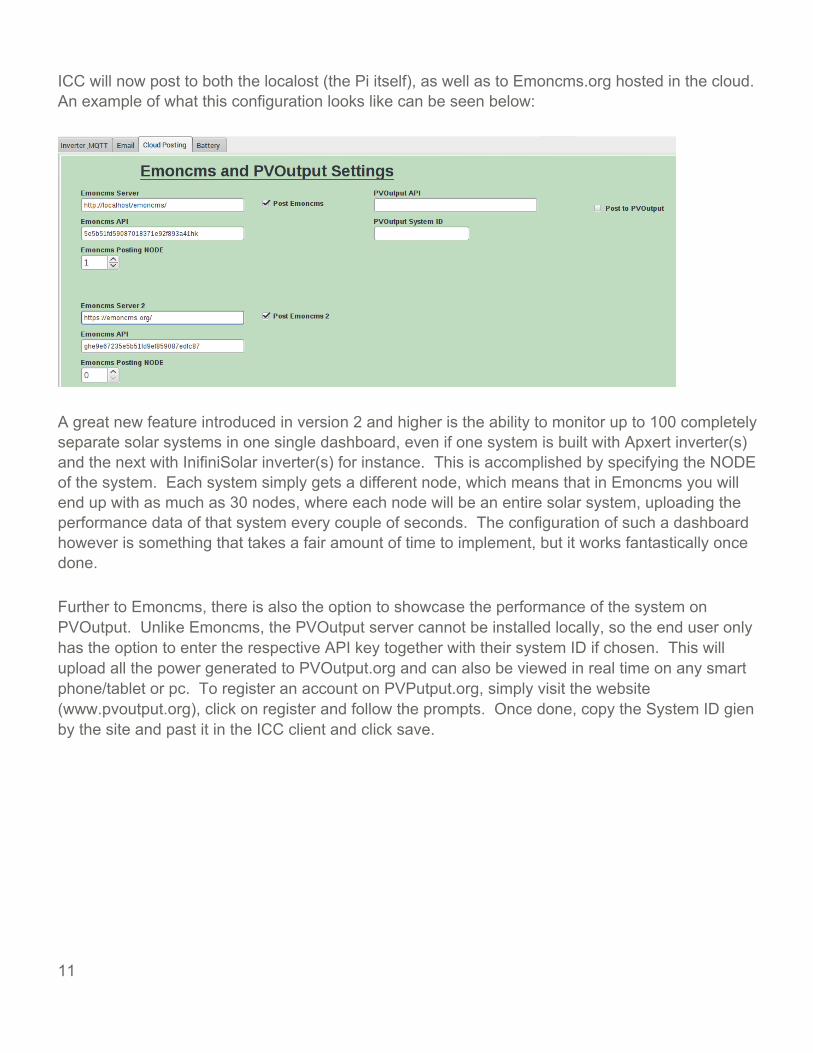
ICC will now post to both the localost (the Pi itself), as well as to Emoncms.org hosted in the cloud.An example of what this configuration looks like can be seen below:
A great new feature introduced in version 2 and higher is the ability to monitor up to 100 completelyseparate solar systems in one single dashboard, even if one system is built with Apxert inverter(s)and the next with InifiniSolar inverter(s) for instance. This is accomplished by specifying the NODEof the system. Each system simply gets a different node, which means that in Emoncms you willend up with as much as 30 nodes, where each node will be an entire solar system, uploading theperformance data of that system every couple of seconds. The configuration of such a dashboardhowever is something that takes a fair amount of time to implement, but it works fantastically oncedone.
Further to Emoncms, there is also the option to showcase the performance of the system onPVOutput. Unlike Emoncms, the PVOutput server cannot be installed locally, so the end user onlyhas the option to enter the respective API key together with their system ID if chosen. This willupload all the power generated to PVOutput.org and can also be viewed in real time on any smartphone/tablet or pc. To register an account on PVPutput.org, simply visit the website(www.pvoutput.org), click on register and follow the prompts. Once done, copy the System ID gienby the site and past it in the ICC client and click save.

12
Configuring ICC Software - Email Settings
In the Email Settings dialog box, configure the SMTP server address and port of your ISP. If SSL is required, tick the SSL box. Remember that the "Send From" address will always be the account you are configuring, otherwise the server will not allow you to relay. The "Send Faults" tick box is very useful for getting informed about what happens in the system, and will send alerts like overload, over temperature, under voltage and more to your email address the moment they occur. Once done, click the "Email Test" button to test the setup and ensure it works properly. Click the "Save" button in the bottom right hand corner to save the settings.
Configuring ICC Software - Updates
As new features, bug fixes, etc become available, they are pushed to the internet. Click on "Check Version" to let the system compare its current version to that of the latest version available. A dialog box displaying the change logs will pop up and also indicate if there is a new available for download. If there is a new version, the "Download" button will become available, and you can update the software from there. Once downloaded, the software will quit automatically and replace the current version with the latest version. If your operating system was updated recently, it may be required to manually set the permission to run the software after upgrading. To do this, open the file explorer (the yellow button on the bottom left of the screen), and click on the ICC folder on the left hand side. Look for the file called ICC, right click on it, and select "properties":

13
On the properties page, select the "Permissions" tab and ensure that all three drop-down boxes display "Anyone" as per the below picture:
Click OK and your upgrade will be complete.

14
Configuring ICC Software - Setup
The most important step in setting up the ICC software is to select the correct inverter(s) for the system in question. Firstly, select the type of connection used in your system. For most users USB will be used, but serial (RS232) is also supported for inverters that only have a serial communications port. If serial is selected, ensure that the correct port is selected where the USB to RS232 converter is connected.
The next step is to specify the inverter(s) that the system need to monitor. All inverters talk to the software using different protocols, so it is imperative that the right selection be made under "Inverter Selection".
As of version 2.2.0 the following inverters are supported:

15
Select the correct inverter for your system. If the system is in parallel, select the 5kva Parallel for instance, and then specify the "Number of Inverters" to let the software know how many inverters to look for.
Specify how much PV panels are used in the connected system. For instance, if 12 x 300W panels are used the "PV Size" will 3600.
Fill out the "Capital Cost" of the system, as well as the Utility Tariff per kWh. This will be used to calculate cost savings over time, and is very useful for determining the return on investment of the system.
If the system will run without a monitor, keyboard or mouse attached, it is recommended that the "Auto Start" option be ticked, to ensure that the software automatically starts the communication with the server in the event of a reboot.
MQTT support is also included for advanced users, and may be turned on by ticking the "Publish MQTT" option. This allows the system to be monitored remotely with any MQTT capable client. At the time of writing MQTT Dash is available free of charge for Android. The pre-configured details for MQTT is:
UN: icc
PW: raspberry
Follow the procedure below to change the username and password if required:
1. Open the Terminal application on the Raspberry Pi. Once open, enter the following command, replacing <user_name> with the new username of your choice.
sudo mosquitto_passwd -c /etc/mosquitto/passwd <user_name>
Press enter, and the system will ask for the new password to be used and also ask to confirm it. Enter the password you would like to use and confirm it. Once one, restart the system by typing sudo restart now
2. Once restarted, go to the Settings tab and enter the new username and password for MQTT and click save. Remember to configure the corresponding details in the MQTT client of your choice.
16
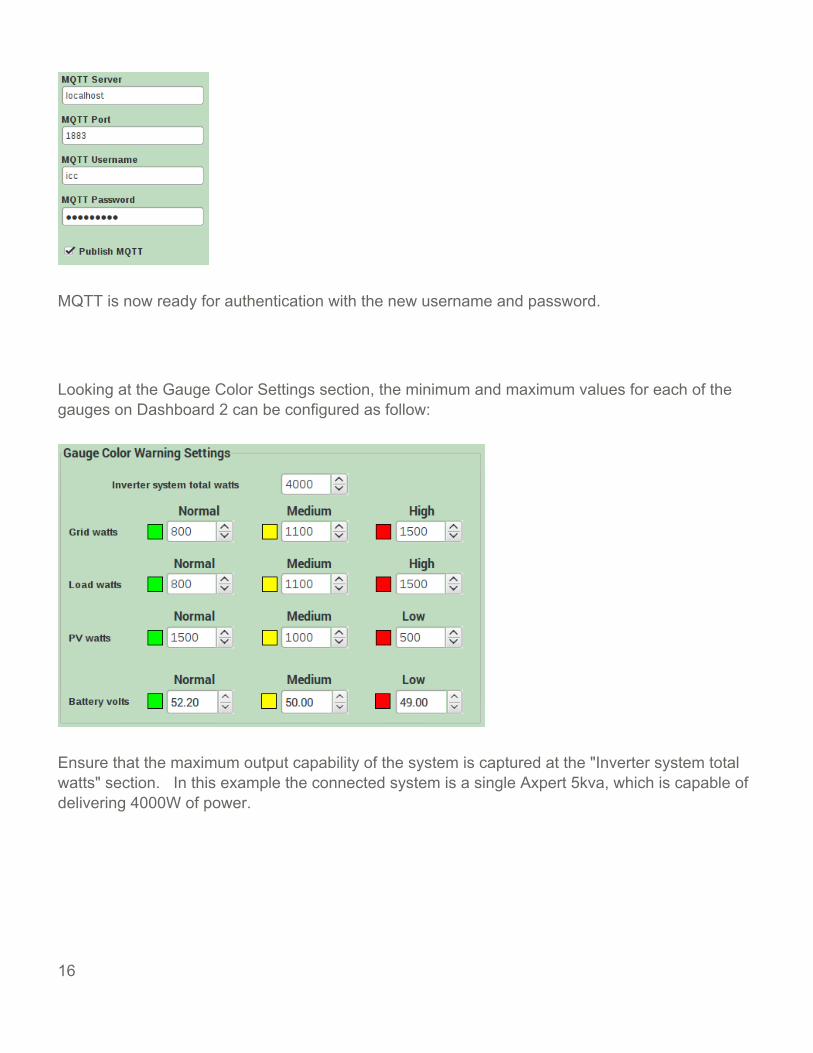
MQTT is now ready for authentication with the new username and password.
Looking at the Gauge Color Settings section, the minimum and maximum values for each of the gauges on Dashboard 2 can be configured as follow:
Ensure that the maximum output capability of the system is captured at the "Inverter system total watts" section. In this example the connected system is a single Axpert 5kva, which is capable of delivering 4000W of power.
17
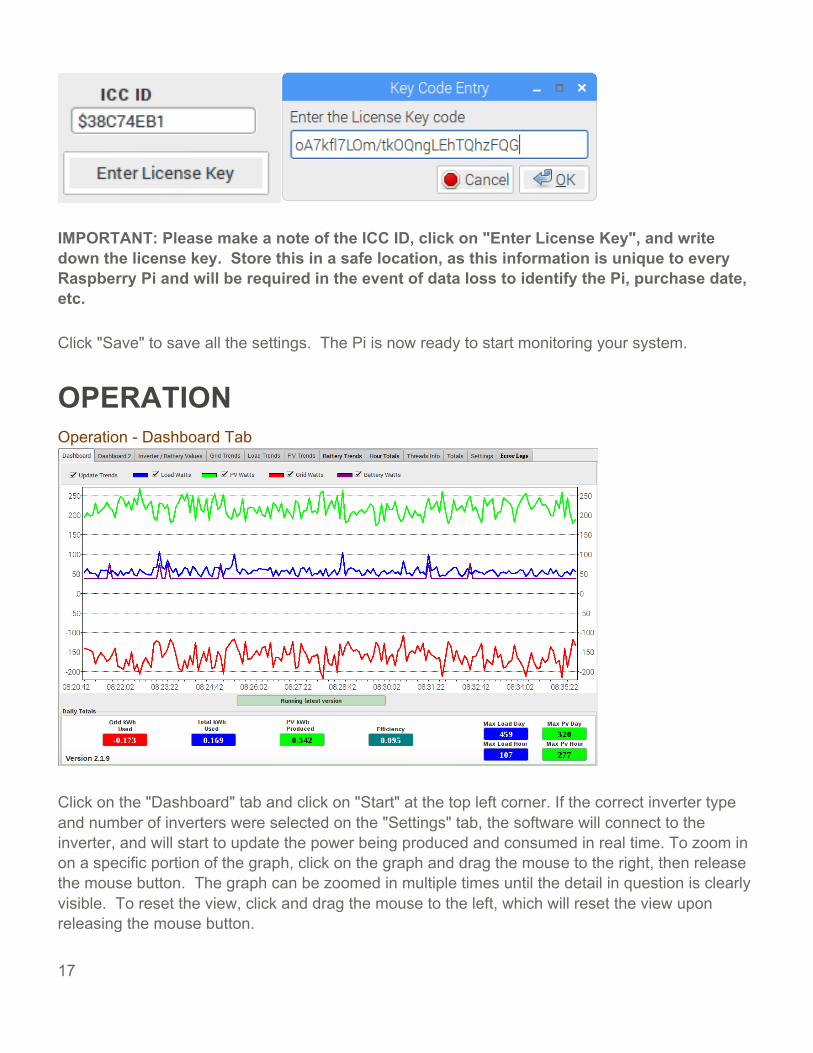
IMPORTANT: Please make a note of the ICC ID, click on "Enter License Key", and write down the license key. Store this in a safe location, as this information is unique to every Raspberry Pi and will be required in the event of data loss to identify the Pi, purchase date, etc.
Click "Save" to save all the settings. The Pi is now ready to start monitoring your system.
OPERATION Operation - Dashboard Tab
Click on the "Dashboard" tab and click on "Start" at the top left corner. If the correct inverter type and number of inverters were selected on the "Settings" tab, the software will connect to the inverter, and will start to update the power being produced and consumed in real time. To zoom in on a specific portion of the graph, click on the graph and drag the mouse to the right, then release the mouse button. The graph can be zoomed in multiple times until the detail in question is clearly visible. To reset the view, click and drag the mouse to the left, which will reset the view upon releasing the mouse button.
18
Below is a list of the detail displayed on the "Dashboard" tab:
• RunTime: The total amount of hours the system has been running for. • Update Trends: If ticked the graph will update in real time to show the respective power sources in use on the system.
• Load Watts: The load on the system at any given point in time, regardless of what source is used to power that load.
• PV Watts: The amount of power generated by the solar panels connected to the system. • Grid Watts: The amount of power used from the utility grid. • Battery Watts: The amount of power used from the batteries. • Grid kWh Used: The total amount of power consumed from the utility Grid during the past
24 hours. This counter resets at midnight every day. • Total kWh Used: The total amount of power used from all available sources for the past 24
hours. This counter resets at midnight every day. • PV kWh Produced: The total amount of power produced by the solar panels attached to
the system during the past 24 hours. This counter resets at midnight every day. • Efficiency: The efficiency of the system, calculated by taking the "PV Size" of all the solar
panels (specified on the "Settings" tab), and dividing that by the total daily power yield. The higher the number, the more efficient the system.
• Max Load Day: The maximum load the system had to supply during the past 24 hours. This counter resets at midnight every day.
• Max Load Hour: The maximum load the system had to supply during the past hour. This counter resets every hour.
• Max PV Day: The maximum amount of power generated by the system during the past 24 hours. This counter resets at midnight every day.
• Max PV Hour: The maximum amount of power generated by the system during the past hour. This counter resets every hour.
NOTE: If the Battery Watts display is below the zero line, it means that the system is drawing power from the batteries to power the load. Likewise, as per the above example, if the Battery Watts display is above zero, it means that power is going into the batteries and they are being charged. In an off-grid system with sufficient solar panels and batteries, there should be enough energy generated that the green line (PV Watts) is the highest visible line during the day, followed by the line for the load and then the line for the batteries. The Grid Watts line should be at zero during the day (or below zero in a grid-tied system), and if there are enough batteries in the system, should remain at zero during the night, but this will differ from system to system.

19
Operation - Dashboard2 Tab
A great new feature introduced in version 2.2.0 and up is the ability to see all the data captured from a system in an easy to understand graphical interface with gauges, giving the end user a quick overview of what's happening in the system at a single glance. This is especially useful if the system will have a dedicated monitor connected to it, where all the values can be displayed in real-time. To configure when each gauge will be green, yellow or red based, please see the "Configuring ICC Software - Setup" portion of this manual.
20
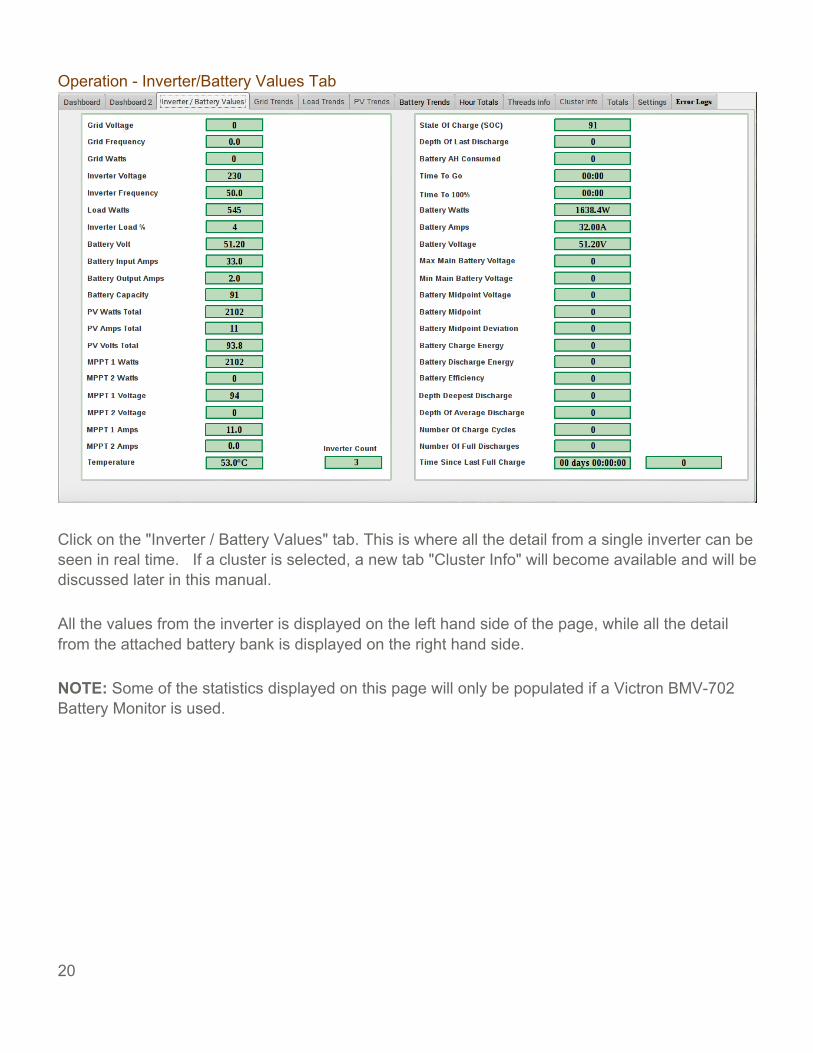
Operation - Inverter/Battery Values Tab
Click on the "Inverter / Battery Values" tab. This is where all the detail from a single inverter can be seen in real time. If a cluster is selected, a new tab "Cluster Info" will become available and will be discussed later in this manual.
All the values from the inverter is displayed on the left hand side of the page, while all the detail from the attached battery bank is displayed on the right hand side.
NOTE: Some of the statistics displayed on this page will only be populated if a Victron BMV-702 Battery Monitor is used.

21
Below is a list of all the detail displayed on the "Inverter / Battery Values" tab.
Inverter Stats
• Grid Voltage: The voltage of the Utility grid connected to the system. • Grid Frequency: The frequency of the Utility grid connected to the system. • Grid Watts: The amount of power consumed from the Utility grid by the system. • Inverter Voltage: The voltage being produced by the inverter. • Inverter Frequency: The frequency that the voltage generated by the inverter is running at. • Load Watts: The load in watts on the system. • Inverter Load %: The percentage load on the system. • Battery Volt: The voltage of the connected battery stack. • Battery Input Amps: The amount of amps going into the battery bank. • Battery Output Amps: The amount of amps being drawn form the attached battery bank. • Battery Capacity: The percentage of power left in the battery bank. • PV Watts Total: The total amount of power being generated by all the panels connected to
the system. • PV Amps Total: The total amount of amps being generated by all the panels connected to
the system. • PV Volts Total: The voltage of the solar panels connected to the system. • MPPT 1 Watts: The amount of power from MPPT1 (In systems with more than 1 MPPT controller).
• MPPT 2 Watts: The amount of power from MPPT2 (in systems with more than 1 MPPT controller).
• MPPT 1 Voltage: The voltage from MPPT 1 (in systems with more than 1 MPPT controller) • MPPT 2 Voltage: The voltage from MPPT 2 (in systems with more than 1 MPPT controller) • MPPT 1 Amps: The amperage from MPPT 1 (in systems with more than 1 MPPT controller) • MPPT 2 Amps: The amperage from MPPT 2 (in systems with more than 1 MPPT controller) • Temperature: The temperature of the inverter. • Inverter Count: The amount of inverter(s) in the system.
Battery Info
• State Of Charge (SOC): The current state of charge of the attached battery bank. • State Of Last Discharge (SOC): This figure is only available when using a Victron Battery Monitor, and will show how deep the battery bank was discharged before it started charging again.
• Battery AH Consumed: This figure is only available when using a Victron Battery Monitor, and will show the amount of power consumed from the battery bank during the last discharge cycle.
22
• Time To Go: This figure is only available when using a Victron Battery Monitor, and will show the amount of time to go at the current load until a certain discharge level is reached.
• Time to 100%: This figure is only available when using a Victron Battery Monitor, and will show the amount of time left at the current charge level before the battery bank will be charged to 100%.
• Battery Watts: The amount of power being drawn or put into the battery bank. If this figure is positive, it means the battery bank is being charged. If this figure is negative, it means that the battery is being discharged at the wattage shown.
• Battery Amps: This amount of amps being drawn from the attached battery bank. • Battery Voltage: The current voltage of the attached battery bank. • Max Main Battery Voltage: The maximum voltage that the connected battery bank reached during the last charge cycle. Only available on some inverters or when using a Victron Battery Monitor.
• Min Main Battery Voltage: The minimum voltage that the connected battery bank reached during the last charge cycle. Only available on some inverters or when using a Victron Battery Monitor.
• Battery Midpoint Voltage: This figure is only available when using a Victron Battery Monitor, and will show the midpoint voltage determined by the BMV-702 battery monitor.
• Battery Midpoint: Some inverters calculate the battery midpoint and will be displayed in this variable if supported.
• Battery Midpoint Deviation: This figure is only available when using a Victron Battery Monitor, and will show the midpoint deviation if configured.
• Battery Charge Energy: This figure is only available when using a Victron Battery Monitor, and will show the same value as "Battery Watts", but it will be the value calculated by the BMV-702.
• Battery Discharge Energy: This figure is only available when using a Victron Battery Monitor, and will show the same value as "Battery Watts" when in negative, but it will be the value calculated by the BMV-702.
• Depth Deepest Discharge: This figure is only available when using a Victron Battery Monitor, and will show the highest percentage that the connected battery bank was discharged.
• Depth Of Average Discharge: This figure is only available when using a Victron Battery Monitor, and will show the average percentage that the connected battery bank is discharged per cycle.
• Number Of Charge Cycles: This figure shows the amount of times the connected battery bank was charged and discharged.
• Number Of Full Discharges: This figure shows the amount of times the connected battery bank was discharged to it's maximum level, and is useful in off-grid systems to determine how hard the batteries have worked.
• Time Since Last Full Charge: The amount of time that have passed since the connected battery stack was last charged to 100%.
23
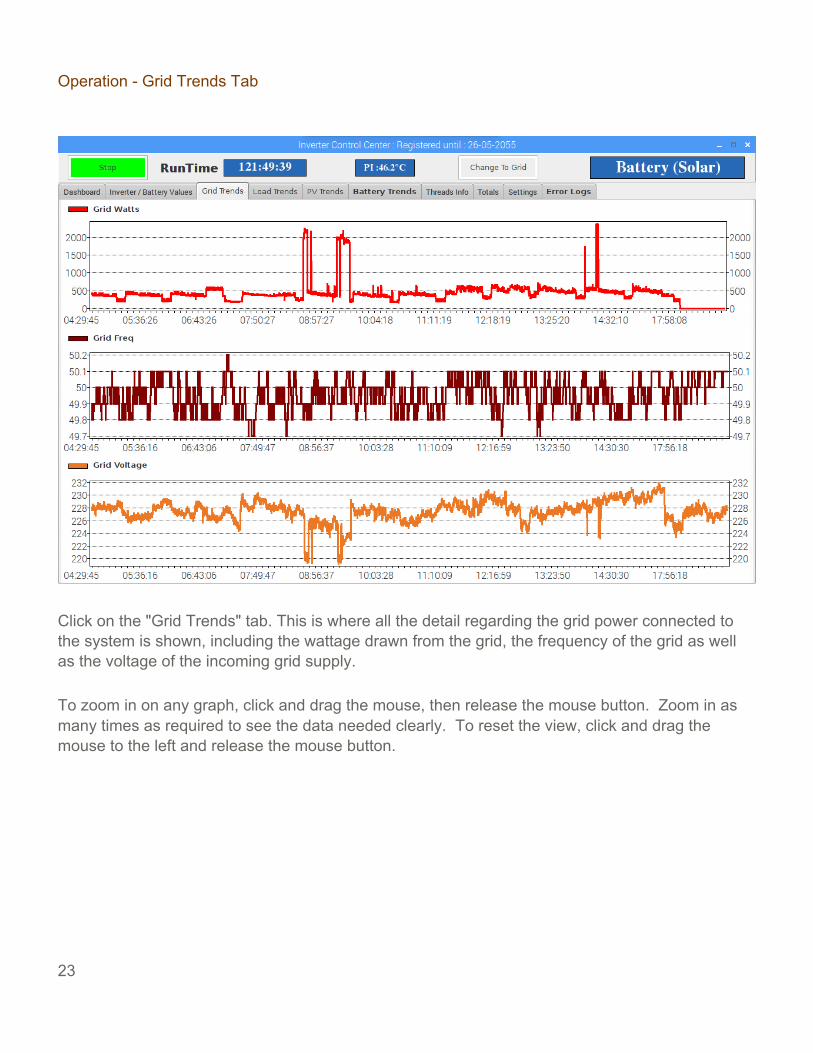
Operation - Grid Trends Tab
Click on the "Grid Trends" tab. This is where all the detail regarding the grid power connected to the system is shown, including the wattage drawn from the grid, the frequency of the grid as well as the voltage of the incoming grid supply.
To zoom in on any graph, click and drag the mouse, then release the mouse button. Zoom in as many times as required to see the data needed clearly. To reset the view, click and drag the mouse to the left and release the mouse button.
24
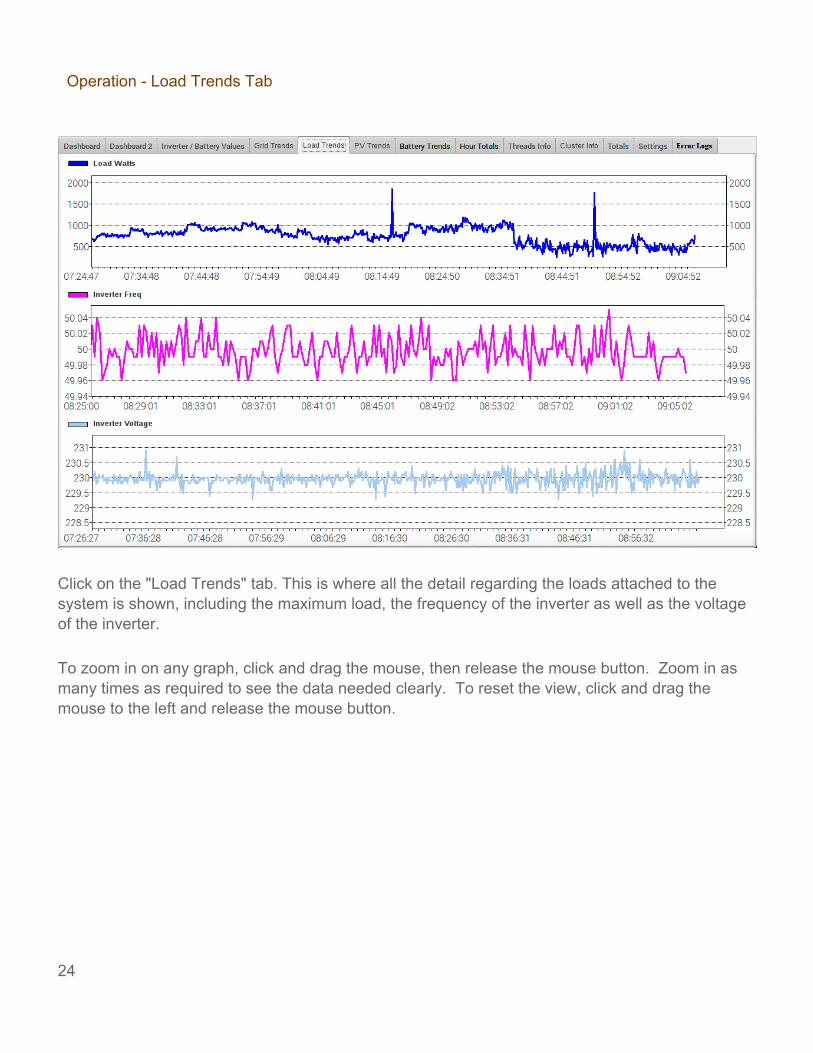
Operation - Load Trends Tab
Click on the "Load Trends" tab. This is where all the detail regarding the loads attached to the system is shown, including the maximum load, the frequency of the inverter as well as the voltage of the inverter.
To zoom in on any graph, click and drag the mouse, then release the mouse button. Zoom in as many times as required to see the data needed clearly. To reset the view, click and drag the mouse to the left and release the mouse button.
25
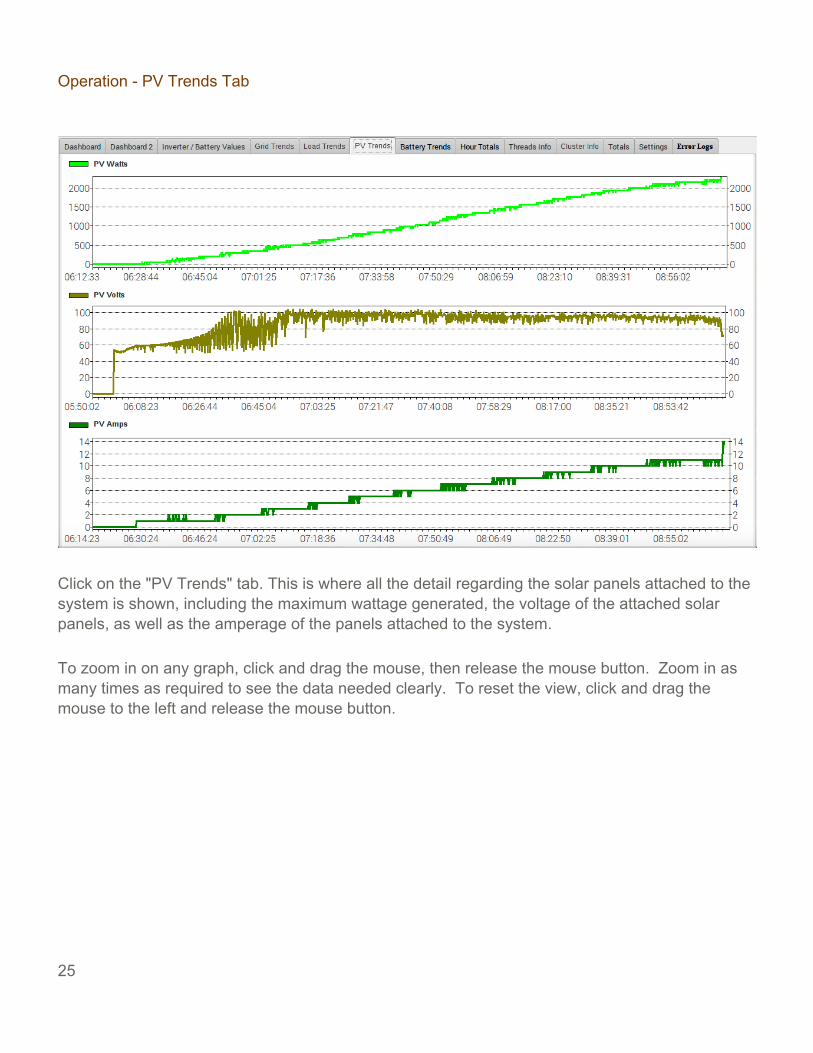
Operation - PV Trends Tab
Click on the "PV Trends" tab. This is where all the detail regarding the solar panels attached to the system is shown, including the maximum wattage generated, the voltage of the attached solar panels, as well as the amperage of the panels attached to the system.
To zoom in on any graph, click and drag the mouse, then release the mouse button. Zoom in as many times as required to see the data needed clearly. To reset the view, click and drag the mouse to the left and release the mouse button.
26
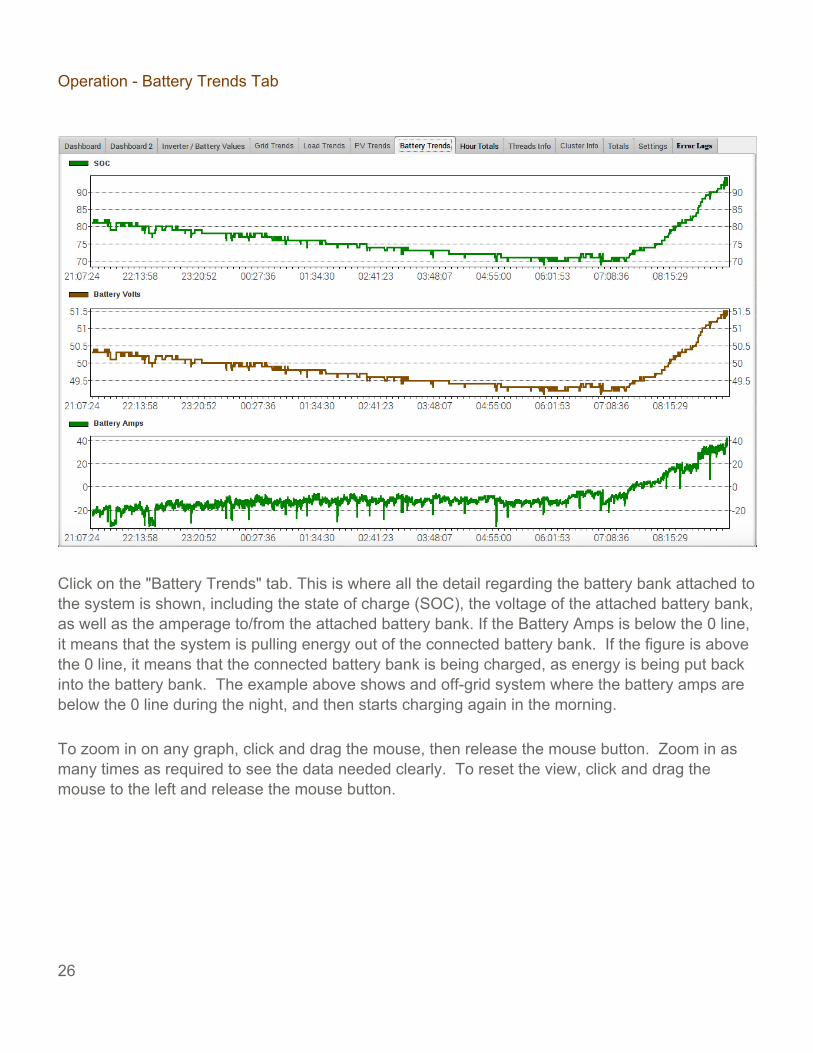
Operation - Battery Trends Tab
Click on the "Battery Trends" tab. This is where all the detail regarding the battery bank attached to the system is shown, including the state of charge (SOC), the voltage of the attached battery bank, as well as the amperage to/from the attached battery bank. If the Battery Amps is below the 0 line, it means that the system is pulling energy out of the connected battery bank. If the figure is above the 0 line, it means that the connected battery bank is being charged, as energy is being put back into the battery bank. The example above shows and off-grid system where the battery amps are below the 0 line during the night, and then starts charging again in the morning.
To zoom in on any graph, click and drag the mouse, then release the mouse button. Zoom in as many times as required to see the data needed clearly. To reset the view, click and drag the mouse to the left and release the mouse button.

27
Operation - Hour Totals Tab
A new feature introduced in version 2.2.0 and up is the ability to what the solar system did for the past 24 hours on an hourly basis. The hourly grid usage, incoming PV power, as well as the total load on the system are all displayed, making it easy to see when the system performed at its best of worst during the past day.
To zoom in on any graph, click and drag the mouse, then release the mouse button. Zoom in as many times as required to see the data needed clearly. To reset the view, click and drag the mouse to the left and release the mouse button.

28
Operation - Threads Info Tab
The info on this tab has nothing to configure, and is used purely for troubleshooting and/or verification during and after upgrades. As such it can be ignored during normal operation.

29
Operation - Totals Tab
Click on the "Totals" tab. This view will present an overview of how the system performed for a specific time period. The information found is broken up into the following columns:
• TOTAL kWh LOAD: The total amount of power that the inverter had to supply for the period specified.
• SOLAR KWH PRODUCED: The total amount of power produced by the system for the period specified.
• GRID KWH USED: The total amount of power consumed from the utility grid for the period specified.
• COST SAVING: The total amount of money saved by the system. This is useful for calculating the return on investment for the period specified.
• EFFICIENCY: The efficiency of the system, calculated by taking the "PV Size" of all the solar panels (specified on the "Settings" tab), and dividing that by the total daily power yield. The higher the number, the more efficient the system.

30
There are also four date range blocks:
The top block displays the data above, calculated on a daily basis.
The second block displays the data above, calculated on a weekly basis.
The third block displays the data above, calculated on a monthly basis.
The last block at the bottom displays the overall information since the system was commissioned.

31
Operation - Error Logs Tab
The "Error Logs" tab displays any possible errors that might occur, and will only be used for informational or troubleshooting purposes, should any error occur.
As such this tab can be ignored during normal operation.

32
Operation - Cluster Info Tab
If your system comprises of two or more inverters configured in cluster mode and they are specified like that on the "Settings" tab, the "Cluster Info" tab will become visible.
Here we can see all the information available for every individual inverter in the cluster. Please see "Operation - Inverter/Battery Values Tab" for a detailed explanation of each of these values.

33
REPORTING - EMONCMSOverviewThe ICC software has been designed to interface with Emoncms, a free reporting portal thatenables the collection of various data sources into an easily understandable dashboard. ThisRaspberry Pi comes pre-installed with a locally hosted version of Emoncms that can be accessedby visiting the IP address of the Raspberry Pi, eg. http://192.168.0.18/emoncms. The manual willfocus on the locally installed version of Emoncms, as the required counters are already created,together with sample dashboards for both single and parallel inverter setups.
If chosen though, the user can also send all the data collected to the Emoncms site hosted on theinternet, however, the dashboard and performance counters will have to be configured manually,and is recommended for advanced users. The configuration of Emoncms is covered in great detailat the following website: https://github.com/emoncms/emoncms, however, the cloud based setup isnot required or recommended for the average home user. If you are an installer that want tomonitor multiple clients on a custom dashboard where all your clients are displayed.
Reporting - Understanding Emoncms InputsAccess the Emoncms login page by clicking on the icon on the bottom left of the Raspberry Pi,or from another browser on the same network by entering the IP address of the Raspberry Pi, eghttp://192.168.0.18/emoncms.
Login with the following detail:
Username: ICC
Password: raspberry

34
In the top right corner, click on "Setup" and select "Inputs".
Emoncms works by getting a host of different inputs that are updated in near real time, and then doing something with those inputs. For instance, some values are already calculated by the ICC software before being sent to Emoncms, and as such, they can just be logged to a feed. A feed is something that contains all the values of a specific input over time, allowing us to track and plot the change of that value and also refer back to its value at a specific point in time. Some values however need conversion, especially those that deal with power. Emoncms provides that conversion out of the box, and as such a certain wattage of power can easily be converted into a kilowatt-hour (kWh) or kilowatt-hour per day (kWh/d) figure.
35
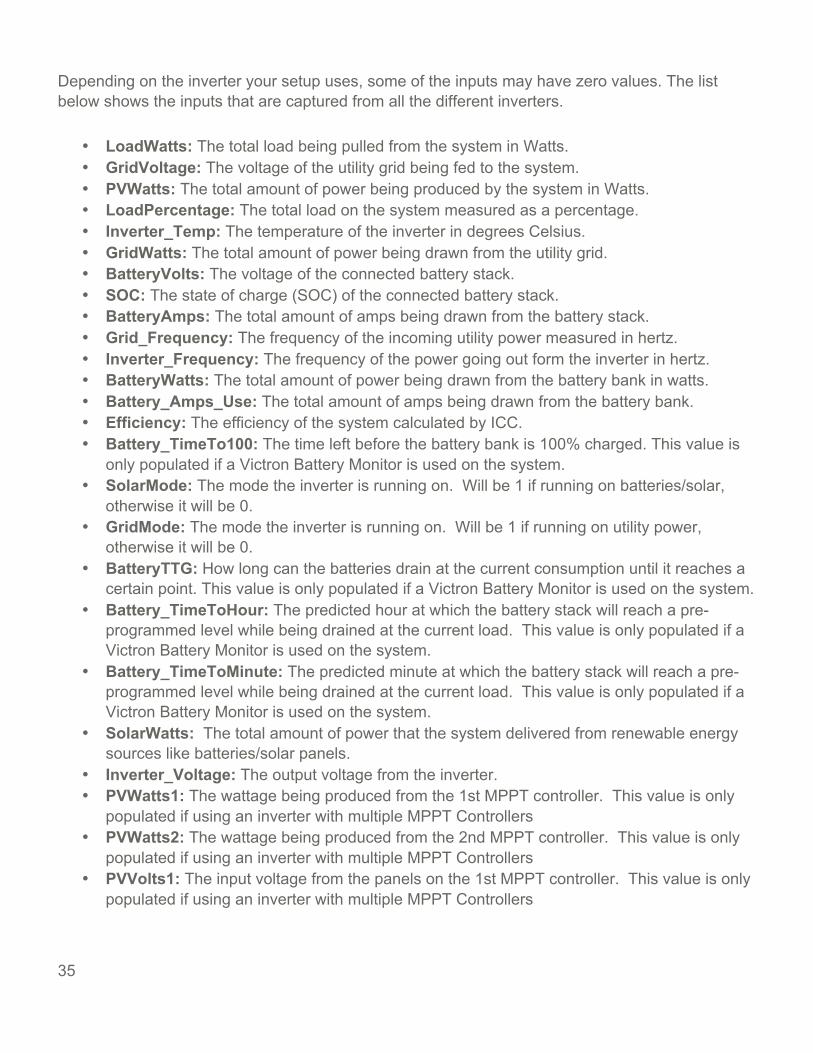
Depending on the inverter your setup uses, some of the inputs may have zero values. The list below shows the inputs that are captured from all the different inverters.
• LoadWatts: The total load being pulled from the system in Watts. • GridVoltage: The voltage of the utility grid being fed to the system. • PVWatts: The total amount of power being produced by the system in Watts. • LoadPercentage: The total load on the system measured as a percentage. • Inverter_Temp: The temperature of the inverter in degrees Celsius. • GridWatts: The total amount of power being drawn from the utility grid. • BatteryVolts: The voltage of the connected battery stack. • SOC: The state of charge (SOC) of the connected battery stack. • BatteryAmps: The total amount of amps being drawn from the battery stack. • Grid_Frequency: The frequency of the incoming utility power measured in hertz. • Inverter_Frequency: The frequency of the power going out form the inverter in hertz. • BatteryWatts: The total amount of power being drawn from the battery bank in watts. • Battery_Amps_Use: The total amount of amps being drawn from the battery bank. • Efficiency: The efficiency of the system calculated by ICC. • Battery_TimeTo100: The time left before the battery bank is 100% charged. This value is only populated if a Victron Battery Monitor is used on the system.
• SolarMode: The mode the inverter is running on. Will be 1 if running on batteries/solar, otherwise it will be 0.
• GridMode: The mode the inverter is running on. Will be 1 if running on utility power, otherwise it will be 0.
• BatteryTTG: How long can the batteries drain at the current consumption until it reaches a certain point. This value is only populated if a Victron Battery Monitor is used on the system.
• Battery_TimeToHour: The predicted hour at which the battery stack will reach a pre-programmed level while being drained at the current load. This value is only populated if a Victron Battery Monitor is used on the system.
• Battery_TimeToMinute: The predicted minute at which the battery stack will reach a pre-programmed level while being drained at the current load. This value is only populated if a Victron Battery Monitor is used on the system.
• SolarWatts: The total amount of power that the system delivered from renewable energy sources like batteries/solar panels.
• Inverter_Voltage: The output voltage from the inverter. • PVWatts1: The wattage being produced from the 1st MPPT controller. This value is only
populated if using an inverter with multiple MPPT Controllers • PVWatts2: The wattage being produced from the 2nd MPPT controller. This value is only
populated if using an inverter with multiple MPPT Controllers • PVVolts1: The input voltage from the panels on the 1st MPPT controller. This value is only
populated if using an inverter with multiple MPPT Controllers
36
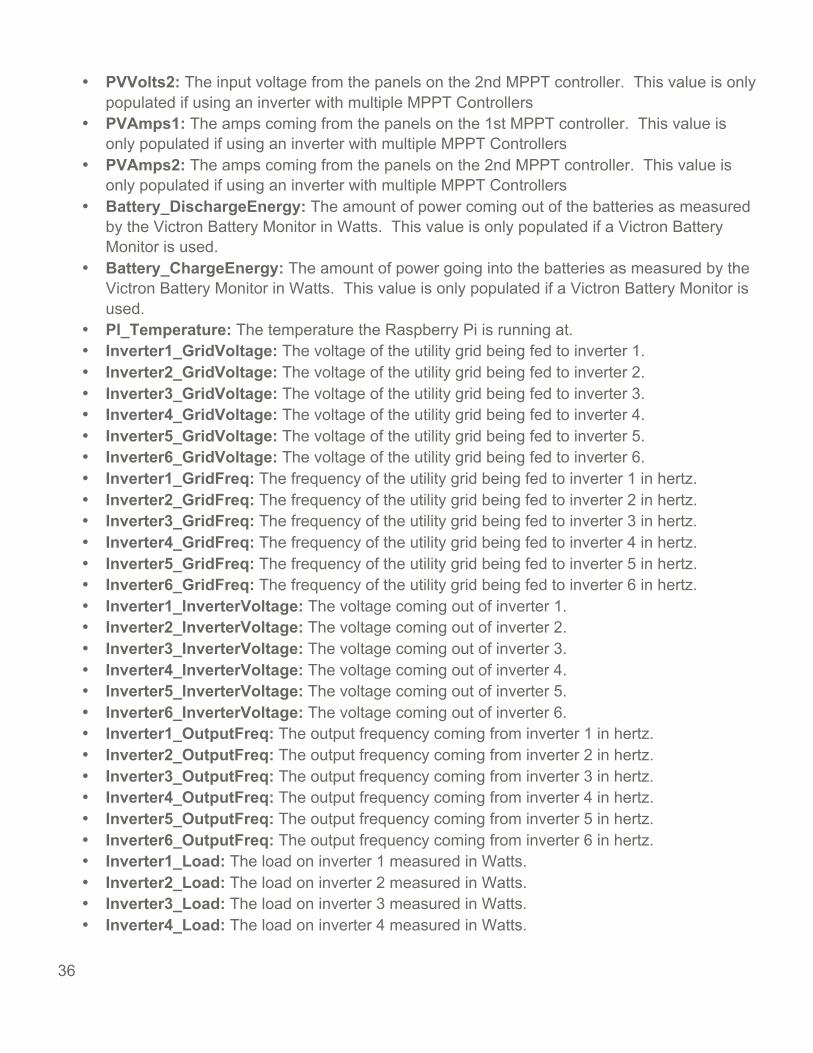
• PVVolts2: The input voltage from the panels on the 2nd MPPT controller. This value is only populated if using an inverter with multiple MPPT Controllers
• PVAmps1: The amps coming from the panels on the 1st MPPT controller. This value is only populated if using an inverter with multiple MPPT Controllers
• PVAmps2: The amps coming from the panels on the 2nd MPPT controller. This value is only populated if using an inverter with multiple MPPT Controllers
• Battery_DischargeEnergy: The amount of power coming out of the batteries as measured by the Victron Battery Monitor in Watts. This value is only populated if a Victron Battery Monitor is used.
• Battery_ChargeEnergy: The amount of power going into the batteries as measured by the Victron Battery Monitor in Watts. This value is only populated if a Victron Battery Monitor is used.
• PI_Temperature: The temperature the Raspberry Pi is running at. • Inverter1_GridVoltage: The voltage of the utility grid being fed to inverter 1. • Inverter2_GridVoltage: The voltage of the utility grid being fed to inverter 2. • Inverter3_GridVoltage: The voltage of the utility grid being fed to inverter 3. • Inverter4_GridVoltage: The voltage of the utility grid being fed to inverter 4. • Inverter5_GridVoltage: The voltage of the utility grid being fed to inverter 5. • Inverter6_GridVoltage: The voltage of the utility grid being fed to inverter 6. • Inverter1_GridFreq: The frequency of the utility grid being fed to inverter 1 in hertz. • Inverter2_GridFreq: The frequency of the utility grid being fed to inverter 2 in hertz. • Inverter3_GridFreq: The frequency of the utility grid being fed to inverter 3 in hertz. • Inverter4_GridFreq: The frequency of the utility grid being fed to inverter 4 in hertz. • Inverter5_GridFreq: The frequency of the utility grid being fed to inverter 5 in hertz. • Inverter6_GridFreq: The frequency of the utility grid being fed to inverter 6 in hertz. • Inverter1_InverterVoltage: The voltage coming out of inverter 1. • Inverter2_InverterVoltage: The voltage coming out of inverter 2. • Inverter3_InverterVoltage: The voltage coming out of inverter 3. • Inverter4_InverterVoltage: The voltage coming out of inverter 4. • Inverter5_InverterVoltage: The voltage coming out of inverter 5. • Inverter6_InverterVoltage: The voltage coming out of inverter 6. • Inverter1_OutputFreq: The output frequency coming from inverter 1 in hertz. • Inverter2_OutputFreq: The output frequency coming from inverter 2 in hertz. • Inverter3_OutputFreq: The output frequency coming from inverter 3 in hertz. • Inverter4_OutputFreq: The output frequency coming from inverter 4 in hertz. • Inverter5_OutputFreq: The output frequency coming from inverter 5 in hertz. • Inverter6_OutputFreq: The output frequency coming from inverter 6 in hertz. • Inverter1_Load: The load on inverter 1 measured in Watts. • Inverter2_Load: The load on inverter 2 measured in Watts. • Inverter3_Load: The load on inverter 3 measured in Watts. • Inverter4_Load: The load on inverter 4 measured in Watts.

37
• Inverter5_Load: The load on inverter 5 measured in Watts. • Inverter6_Load: The load on inverter 6 measured in Watts. • Inverter1_BatteryCapacity: The state of charge (SOC) measured on inverter 1. • Inverter2_BatteryCapacity: The state of charge (SOC) measured on inverter 2. • Inverter3_BatteryCapacity: The state of charge (SOC) measured on inverter 3. • Inverter4_BatteryCapacity: The state of charge (SOC) measured on inverter 4. • Inverter5_BatteryCapacity: The state of charge (SOC) measured on inverter 5. • Inverter6_BatteryCapacity: The state of charge (SOC) measured on inverter 6. • Inverter1_BatteryVolt: The voltage of the battery bank measured on inverter 1. • Inverter2_BatteryVolt: The voltage of the battery bank measured on inverter 2. • Inverter3_BatteryVolt: The voltage of the battery bank measured on inverter 3. • Inverter4_BatteryVolt: The voltage of the battery bank measured on inverter 4. • Inverter5_BatteryVolt: The voltage of the battery bank measured on inverter 5. • Inverter6_BatteryVolt: The voltage of the battery bank measured on inverter 6. • Inverter1_PVVoltage: The voltage of the PV panels connected to inverter 1. • Inverter2_PVVoltage: The voltage of the PV panels connected to inverter 2. • Inverter3_PVVoltage: The voltage of the PV panels connected to inverter 3. • Inverter4_PVVoltage: The voltage of the PV panels connected to inverter 4. • Inverter5_PVVoltage: The voltage of the PV panels connected to inverter 5. • Inverter6_PVVoltage: The voltage of the PV panels connected to inverter 6. • Inverter1_PVAmps: The amperage coming from the PV panels connected to inverter 1. • Inverter2_PVAmps: The amperage coming from the PV panels connected to inverter 2. • Inverter3_PVAmps: The amperage coming from the PV panels connected to inverter 3. • Inverter4_PVAmps: The amperage coming from the PV panels connected to inverter 4. • Inverter5_PVAmps: The amperage coming from the PV panels connected to inverter 5. • Inverter6_PVAmps: The amperage coming from the PV panels connected to inverter 6. • Inverter1_PVWatts: The total amount of power being produced by inverter 1. • Inverter2_PVWatts: The total amount of power being produced by inverter 2. • Inverter3_PVWatts: The total amount of power being produced by inverter 3. • Inverter4_PVWatts: The total amount of power being produced by inverter 4. • Inverter5_PVWatts: The total amount of power being produced by inverter 5. • Inverter6_PVWatts: The total amount of power being produced by inverter 6. • Inverter1_LoadWatts: The load on inverter 1 measured in Watts. • Inverter2_LoadWatts: The load on inverter 2 measured in Watts. • Inverter3_LoadWatts: The load on inverter 3 measured in Watts. • Inverter4_LoadWatts: The load on inverter 4 measured in Watts. • Inverter5_LoadWatts: The load on inverter 5 measured in Watts. • Inverter6_LoadWatts: The load on inverter 6 measured in Watts. • DaysLast_Full_Charge: The amount of days since the system has been recharged fully. This value is only populated if a Victron Battery Monitor is used.
38
• HourLast_Full_Charge: The amount of hours since the system has been recharged fully. This value is only populated if a Victron Battery Monitor is used.
• MinuteLast_Full_Charge: The amount of minutes since the system has been recharged fully. This value is only populated if a Victron Battery Monitor is used.
• SecondsLast_Full_Charge: The amount of seconds since the system has been recharged fully. This value is only populated if a Victron Battery Monitor is used.
• TotalSecondsLast_Full_Charge: The amount of days since the system has been recharged fully. This value is only populated if a Victron Battery Monitor is used.
• Battery_Efficiency: The efficiency of the attached battery stack. This value is only populated if a Victron Battery Monitor is used.
• Number_of_charge_cycles: The amount of times the attached battery stack has been recharged. This value is only populated if a Victron Battery Monitor is used.
• BMVMidvoltage: The midvoltage setting of the attached battery stack. This value is only populated if a Victron Battery Monitor is used.
• Cumulative_Amp_Hours_drawn: The total amount of Amp Hours drawn from the connected battery stack. This value is only populated if a Victron Battery Monitor is used.
• Depth_of_the_average_discharge: The average depth of discharge of the connected battery stack. This value is only populated if a Victron Battery Monitor is used.
• Depth_of_the_deepest_discharge: The deepest depth of discharge of the connected battery stack. This value is only populated if a Victron Battery Monitor is used.
• Minimum_main_Battery_voltage: The lowest voltage that the connected battery stack has been drained to. This value is only populated if a Victron Battery Monitor is used.
• Max_main_Battery_voltage: The maxmimum voltage that the connected battery stack has been charged to. This value is only populated if a Victron Battery Monitor is used.
• Number_of_automatic_synchronizations: The number of automatic synchornizations that has been performed on the connected battery stack. This value is only populated if a Victron Battery Monitor is used.
• Number_of_Low_voltage_alarms: How many low voltage alarms have been generated for the connected battery stack. This value is only populated if a Victron Battery Monitor is used.
• Number_of_High_voltage_alarms: How many high voltage alarms have been generated for the connected battery stack. This value is only populated if a Victron Battery Monitor is used.
• Depth_of_the_last_discharge: The depth of discharge reached during the last discharge cycle. This value is only populated if a Victron Battery Monitor is used.
• Days_TimeTo_100: Displays the amount of days until the connected battery stack is charged at the current input power. This value is only populated if a Victron Battery Monitor is used.
• Hour_TimeTo_100: Displays the amount of hours until the connected battery stack is charged at the current input power. This value is only populated if a Victron Battery Monitor is used.
• Minute_TimeTo_100: Displays the amount of minutes until the connected battery stack is charged at the current input power. This value is only populated if a Victron Battery Monitor is used.

39
• Seconds_TimeTo100: Displays the amount of seconds until the connected battery stack is charged at the current input power. This value is only populated if a Victron Battery Monitor is used.
• Days_Off_Grid: Displays the amount of days the connected system has operated without any grid usage. This counter resets as soon as grid mode is enabled, or if the ICC client is restarted.
• Hour_Off_Grid: Displays the amount of hours the connected system has operated without any grid usage. This counter resets as soon as grid mode is enabled, or if the ICC client is restarted.
• Minute_Off_Grid: Displays the amount of minutes the connected system has operated without any grid usage. This counter resets as soon as grid mode is enabled, or if the ICC client is restarted.
• Seconds_Off_Grid: Displays the amount of seconds the connected system has operated without any grid usage. This counter resets as soon as grid mode is enabled, or if the ICC client is restarted.
• BMVMidPoint: The midpoint configured on the BMV battery monitor. This value is only populated if a Victron Battery Monitor is used.
• BMVMidpoint_Deviate_Voltage: The deviate voltage of the connected battery stack. This value is only populated if a Victron Battery Monitor is used.
• Max_Load_Day: Displays the maximum load that the system had to handle during the past day.
• Max_Load_Hour: Displays the maximum load that the system had to handle during the past hour.
• Max_PV_Day: Displays the maximum wattage of solar power that was generated by the panels during the past day.
• Max_PV_Hour: Displays the maximum amount of solar power that was generated by the panels during the past hour.
• Grid_KWh_Used: Displays the amount of energy used from the utility grid during the past day in kWh.
• Total_KWh_Used: Displays the total amount of energy used from all available sources during the past day in kWh.
• PV_KWh_Produced: Displays the total amount of energy produced by the solar panels for the day.
• Grid_Amps: The amount of amps pulled from the utility grid by the system (if in grid mode). • Inverter_Amps: The amount of amps being pulled by the load from the inverter.

40
Reporting - Understanding Emoncms Feeds In the top right corner, click on "Setup" and select "Feeds".
A list of all the different feeds will be displayed. They are all the same as the list described under the "Reporting - Understanding Emoncms inputs" - section of this manual, apart from the fact that they store all the values of the different inputs over time and are used to create the respective dashboards, graphs, dials and so forth.
There are a few more feeds that are not listed on the "Inputs" page. They are described below:
• LoadWattskWh: The load on the system as an hourly rate, measured in kilowatt-hour • LoadWattskWhd: The load on the system as a daily rate, measured in kilowatt-hour per day.
• PVWattskWh: The wattage produced by the PV panels as an hourly rate, measured in kilowatt-hour.
• PVWattskWhd: The wattage produced by the PV panels as a daily rate, measured in kilowatt-hour per day.
• GridWattskWh: The power consumed from the utility grid as an hourly rate, measured in kilowatt-hour.
• GridWattskWhd: The power consumed from the utility grid as a daily rate, measured in kilowatt-hour per day.
• BatteryWattskWh: The power consumed from the batteries as an hourly rate, measured in kilowatt-hour.
• BatteryWattskWhd: The power consumed from the batteries as a daily rate, measured in kilowatt-hour per day.
41
• SolarWattskWh: The power consumed from renewable energy sources like the batteries or solar panels as an hourly rate, measured in kilowatt-hour.
• SolarWattskWhd: The power consumed from renewable energy sources like the batteries or solar panels as a daily rate, measured in kilowatt-hour per day.
REPORTING - EMONCMS DASHBOARDS As described in the previous chapters, Emoncms enable us to take a lot of data in real time, capture it, and then display everything in a manner that makes logical sense on a common dashboard.
This Raspberry Pi has been pre-configured with two beautiful dashboards running on the local instance of Emoncms. The first is a dashboard for Single inverters, with performance counters, data and settings that should get most users in a single inverter environment up and running quickly. A second dashboard for clustered inverter environments is also provided, which was pre-configured in such a way to assist the user in customizing everything for the specific setup they run easily. The values used on both single and parallel dashboards are the same, apart from the fact that the parallel dashboard has dials for each inverter.
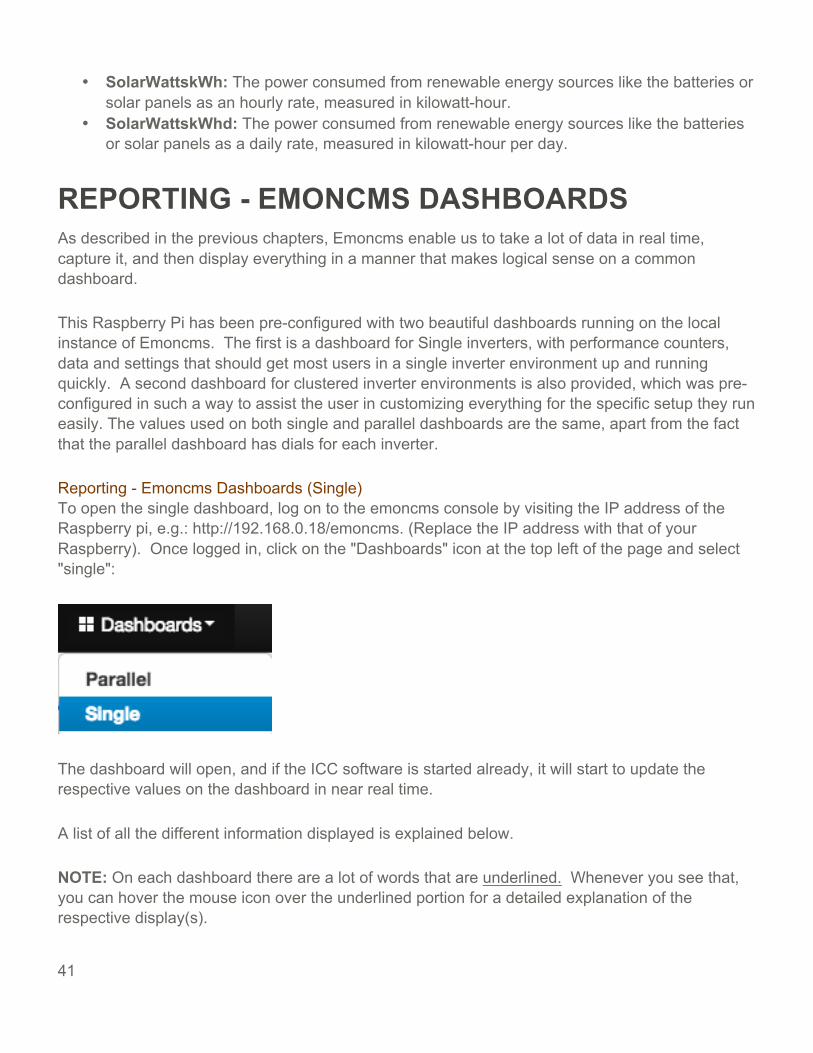
Reporting - Emoncms Dashboards (Single) To open the single dashboard, log on to the emoncms console by visiting the IP address of the Raspberry pi, e.g.: http://192.168.0.18/emoncms. (Replace the IP address with that of your Raspberry). Once logged in, click on the "Dashboards" icon at the top left of the page and select "single":
The dashboard will open, and if the ICC software is started already, it will start to update the respective values on the dashboard in near real time.
A list of all the different information displayed is explained below.
NOTE: On each dashboard there are a lot of words that are underlined. Whenever you see that, you can hover the mouse icon over the underlined portion for a detailed explanation of the respective display(s).

42
Reporting - Emoncms Dashboards (Grid Consumption)
This section deals with power to/from the utility grid. The "Load Percentage" dial shows the total load on the system measured as a percentage, while the "Load Watts" dial shows what that load is in watts. If the "Load Watts" dial goes towards the green side, the watts will show as negative, meaning that you are exporting power into the utility grid. This will only happen when a grid tie inverter is used. The graph on the right will show the total utility consumption for the period specified. Hover the mouse icon over "Total gird power used today" for a detailed description of all the values found in this section.
Reporting - Emoncms Dashboards (Power Generated)
This section shows us how much power is being generated by the solar panels. The "Solar Generation" dial will show the amount of power being generated in watts. the "Efficiency Factor" dial will show us how efficient the system is, and the graph will show what the production per day was over a period of time. Hover the mouse icon over "Total power generated today" for an in-depth description of each of the dials, as well as how the efficiency factor is determined.

43
Reporting - Emoncms Dashboards (Battery Consumption)
The Battery Consumption section shows us how much energy we are putting into or pulling out of the batteries any point in time. The "Battery Amps" dial will show how many amperes we are dealing with. If this dial is in the green, the figure will be positive, and it will mean that we are putting power into the batteries. If the dial is in the red and the accompanying figure is negative, it means we are pulling power out of the batteries. The same applies for the "Battery watts" dial. Likewise, if the graph on the right is above the 0 line, it means power was being put into the batteries, and if it's under the 0 line, it means power was being pulled out of it. Hover the mouse over "Total power to/from batteries" for an in-depth description of all the dials and graph in this section.
Reporting - Emoncms Dashboards (Battery Health)
This is one of the most important sections on the dashboard, and shows us the "Battery Voltage" as well as "State of Charge" in real time, and also draws a graph to plot these two figures opposite each other over time.
44
This functionality allows us to track the performance of the connected battery stack over time, and also assist in detecting faulty batteries before the rest of the stack get hurt. Hover the mouse over "Tracking the performance of the battery bank" for more information on this section.
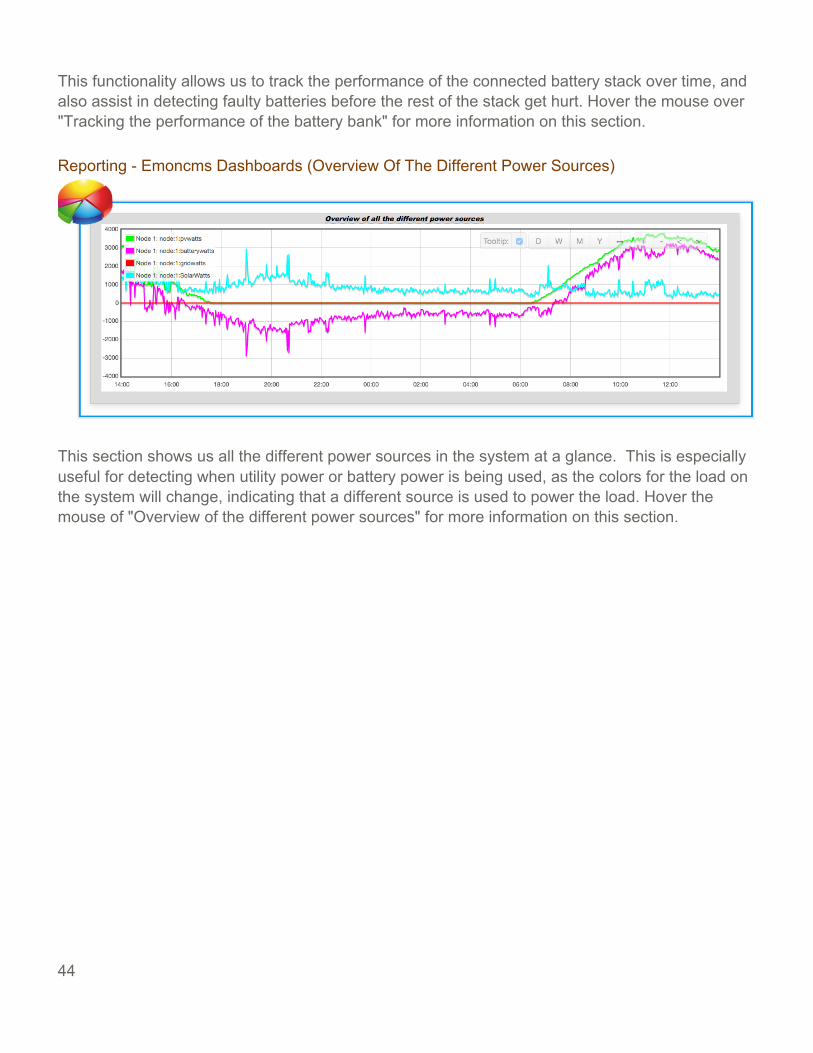
Reporting - Emoncms Dashboards (Overview Of The Different Power Sources)
This section shows us all the different power sources in the system at a glance. This is especially useful for detecting when utility power or battery power is being used, as the colors for the load on the system will change, indicating that a different source is used to power the load. Hover the mouse of "Overview of the different power sources" for more information on this section.

45
Reporting - Emoncms Dashboards (General)
The final section provides some general information about the system, and shows the mode the inverter is running in (red for grid, green for solar), as well as an overview of how much power was produced and consumed for the day. These values are rounded estimates that are calculated throughout the day, and as such will never be 100% correct, but should be quite close to the actual values measured directly by the ICC software. It also shows the highest values for the day as well as the highest values for the past hour, together with the operating temperature of the Raspberry PI as well as the temperature for the inverter. Lastly the voltage coming in from the utility as well as the voltage being generated by the inverter is shown.
IMPORTANT CUSTOMIZATION NOTE: Every solar system is different and will require customization of the dials, widgets and graphs. Please ensure that you adjust the minimum and maximum values of each display to match your system. Click on the icon in the top right corner of the dashboard to enable editing.
Select a widget and click on the spanner icon to edit its properties:

46
Ensure that the correct feed is selected for the widget you are editing (see the list of inputs and feeds described earlier), then adjust the maximum value of the widget to match that of your system. A single 5kva Axpert inverter will have a maximum load ability of 4000W for instance, so we can enter 4000 as the maximum value, and ensure that the unit of measurement is W:
Repeat this process for every dial, widget or graph on your dashboard to ensure proper reporting.
47
Accessing ICC remotelyThere are multiple ways to access the data acquired by ICC remotely. The most suitable scenariofor the system being implemented will have to be decided on by the person doing the install, andthen the required action should be taken to accomplish it.
Below is a short list of the different methods one can use to access ICC and the accompanyingdashboard(s):
1. Forward a port on the internet router - This method involves allowing the router thatconnects ICC to the internet to listen for communication on a specific port and then forwardthat traffic to the internal IP address of the Raspberry Pi. This is by far the easiest method toview everything happening on the Raspbery, as it requires very little configuration from anend user perspective. A Dynamic DNS client is already installed on this Raspberry Pi, andonce configured, a port can be forwarded from the router that supplies the Pi with Internet tomap communication from a certain port to it's web server.2. Configure ther router to allow VNC traffic to the Raspberry Pi. This is exactly the samemethod as described above, but in this instance VNC traffic is allowed as opposed to webtraffic. With this configuration the Raspberry can be controlled from anywhere in the worldand all the info, etc on it can be viewed and consumed in real-time.
3. Use MQTT. Using MQTT, the Raspberry Pi together with all the info that it supplies can bemonitored remotely simply by connecting to the IP address of the Raspberry. This may alsorequire some form of port forwarding if the data is to be consumed remotely. MQTT is soldas a separate package and allows an administrator to connect to many Raspberry Pi'squickly and easily and is aimed at the installer more than the home user.
4. Create a custom dashboard on Emoncms.org and push all the data to the cloud. Emoncmsoffers a free service to display data received from inverters in the cloud. Using this method a usercan register an account for free and create a dashboard in the cloud. The result will be a link that auser can visit (eg. http://emoncms.org to view anything and everything happening on the solarsystem.

48
WARRANTY INFORMATION The operating system contained on this Raspberry PI as well as the accompanying Inverter Control Center software is distributed in the hope that it will be useful, but without any warranty whatsoever. It is provided "as is" without any warranty of any kind, either expressed or implied, including, but not limited to, the implied warranties of merchantability and fitness for a particular purpose. The entire risk as to the quality and performance of the program and accompanying hardware is with the user. Should the program or hardware prove defective, the user assumes the cost of all necessary servicing, repair or correction to any affected systems, programs or otherwise.
In no event will the author be held liable for any damages, including any general, special, incidental or consequential damages arising out of the use or inability to use the Inverter Control Center software or any accompanying hardware.

49
TROUBLESHOOTING Problem Explanation / Possible Cause What To Do No info is displayed when clicking "Start".
USB Cable might be disconnected The wrong inverter may be selected. The "Update Trends" box is not ticked.
Make sure that the USB cable is plugged in properly at the inverter and the Raspberry PI. Ensure that the correct inverter is specified on the "Settings" tab. Depending on the age of your firmware, it might be required to select "Axpert 5kva parallel" and specify only 1 inverter under "Number of Inverters (Cluster)". Ensure the "Update Trends" box is ticked on the "Dashboard" tab.
ICC Refuse to start after upgrading to a new version.
Permissions to run the new new version may not be set properly.
Browse to /home/pi/ICC, right click the ICC file and change all permissions to show "Everyone"
Cannot access the dashboard from another computer.
The Raspberry PI may not be joined to a Wi-Fi hotspot.
Ensure that the Raspberry PI is joined to a Wi-Fi hotspot and that the machine you are using to connect to the dashboard is joined to the same Wi-Fi hotspot as well.
The graph displayed on the 'Dashboard" tab is difficult to read.
You may be viewing too much data at once.
Click and drag to the right inside the graph to zoom in and make the values more readable. Reset the view by clicking and dragging to the left once done to zoom out.
"Change to Battery" or "Change to Grid" is greyed out.
"Use SOC for Control" or "Use Time for Control" may be specified on the "Settings" tab, preventing manual switching between battery and utility.
Un-tick the check boxes for either "Use SOC for Control" or "Use Time for Control", which will make the switch buttons accessible again.
The "Inverter Selection" drop down box is greyed out and cannot be changed.
The ICC Software is running and as such inverter selections cannot be changed.
Click on "Stop" to stop the software from communicating with the inverter and then select the correct inverter on the "settings" tab. Click "Save" once done to save the settings.
When clicking "EmailTest", a failure is returned.
The port number and username and/or password may be incorrect.
Ensure the correct details for username, password and port number is used. Also ensure that the correct setting is specified for the "Use SSL to Connect" option.


![Inverter Pairairconservice.ru/d/1098676/d/sm_sibe07-618_c_rxs50e2(3)v1brxs50f2v... · SiBE07-618_C [Applied Models] Inverter Pair : Cooling Only ... 4.18 CT or Related Abnormality](https://img.dokumen.tips/doc/110x75/5aeb1d117f8b9ae5318d5145/inverter-3v1brxs50f2vsibe07-618c-applied-models-inverter-pair-cooling-only.jpg)


![Inverter-Based Generation Only—An Analysis on Dynamic ......microgrid [6]. Inverter-interfaced energy resources behave completely di erent compared to synchronous generators [7],](https://img.dokumen.tips/doc/110x75/612503dbe636eb70250656b7/inverter-based-generation-onlyaan-analysis-on-dynamic-microgrid-6-inverter-interfaced.jpg)


![Service Manual - daikinac.com … · Service Manual Inverter Pair Wall Mounted Type K-Series SiUS041111 [Applied Models] Inverter Pair : Cooling Only Inverter Pair : Heat Pump](https://img.dokumen.tips/doc/110x75/5a702af57f8b9ab1538bb927/service-manual-daikinaccomwwwdaikinaccomcontentassetsdocservicemanualssius041111.jpg)