Embed Size (px)
Citation preview
December 11, 2012
City of CambriDge Corporate
Greenhouse Gas Emissions Inventory and Forecast

City of Cambridge Corporate Greenhouse Gas Emissions Inventory and Forecast
Stantec Consulting Ltd. i
TABLE OF CONTENTS Table of Contents i
List of Figures ii
List of Tables ii
1.0 Introduction 1
1.1 Background 1 1.2 Green Energy Act 1 1.3 Partners for Climate Protection (PCP) 2
2.0 Methodology 4
2.1 Inventory Protocol 4 2.2 Emission Sources and Emission Factors 6 2.3 Data Collection 7 2.4 Monitoring 7
3.0 Corporate inventory 8
3.1 Inventory Summary 8 3.2 Buildings 10 3.3 Fleet - Vehicles 11 3.4 Fleet - Small Engines 12 3.5 Sewage Pumping 13 3.6 Streetlighting 14 3.7 Corporate Waste 14 3.8 Forecast Summary 15
4.0 Opportunities For Improvement 17
4.1 Gasoline and Diesel Fuel Consumption 17 4.2 Facilities 17 4.3 Waste 17
5.0 Next Steps 19
6.0 References 20

Stantec Consulting Ltd. ii
LIST OF FIGURES Figure 1. Five Milestone Framework ........................................................................... 2 Figure 2. City of Cambridge 2009 GHG Emissions by Sector ...................................... 9 Figure 3. City of Cambridge 2009 GHG Emissions by Source ...................................... 9 Figure 4. City of Cambridge 2009 GHG Emissions by Scope .................................... 10 Figure 5. City of Cambridge Forecast GHG Emissions by Sector ................................. 16 Figure 6. City of Cambridge Forecasted Corporate GHG Emissions ............................ 16
LIST OF TABLES Table 1: Emission Sources by Scope .......................................................................... 4 Table 2: Global Warming Potentials .......................................................................... 5 Table 3: Data Sources .............................................................................................. 7 Table 4: GHG Emissions by Sector ............................................................................ 8 Table 5: GHG Emissions from Buildings and Facilities ................................................ 11 Table 6: GHG Emissions from Vehicles .................................................................... 12 Table 7: GHG Emissions from Small Engines ............................................................ 12 Table 8: GHG Emissions from Sewage Pumping ....................................................... 13 Table 9: GHG Emissions from Streetlights ................................................................. 14 Table 10: GHG Emissions from Corporate Waste ..................................................... 14

Stantec C
1.01.1
The CiapproxlocatedsouthwTorontolargestmake Cambrindustradjacemanufaof the knowleplay aConestinterna
In 201was deactionsincludethe City
As parthe Cityprograthe Gre
1.2
The Prorenewaenergy agenciehospita
Rin
onsulting Ltd.
0 INBACKG
ity of Cambximately 1d on the G
western Ontao. The Cityt of the sevup the Regiridge has ial based
ent to Hacturing con
city’s econedge-based an increasintoga Colleg
ational comp
1, the City oeveloped as s in the existied in the Susy’s corporate
rt of developy of Cambrid
am (see beloween Energy A
GREEN
ovince of Onable energy g
jobs” (Minises (including
als) to:
eport annuanformation o
NTRODGROUND
bridge is a 31,000 re
Grand and ario, 100 ky of Cambridven local mon of Watehistorically economy
Highway tinues to be
nomy, the psectors are g role for te and the Uanies.
of Cambridgan overarching and futurstainability Pe Greenhous
ing this GHGdge is particw), as well aAct (see belo
N ENERGY
tario has degeneration, stry of Energg municipalit
lly on energynline; and,
DUCT
mid-sized cesidents an
Speed Rivekilometers wdge is the semunicipalitieserloo. The C
had a sand is lo401. Althan importan
post-industriadeveloping
the city’s gUniversity o
e developedhing documere City Mastlan was a rese Gas (GHG
G Inventory ocipating voluas completingow).
Y ACT
eveloped the encourage ey, 2012). Aies, universit
y use and G
TION
city of nd is ers in est of econd s that
City of strong ocated hough nt part l and
g and rowing econf Waterloo’
d and adoptent that will ger and Strate
ecommendatG) emissions
of corporate ntarily in theg mandatory
Green Energenergy conse
A new regulaties and colle
GHG emission
N
nomy. The ’s School of
ed a Corporguide the Cityegic Plans. ion to develos in 2013.
operations e Partners fory Provincial r
rgy Act (GEAervation andtion under theges, as wel
ns beginning
City of Caf Architectur
rate Sustainay of CambridFor exampleop an invent
for the baser Climate Proreporting req
A) as “a mecd promote thehe GEA will ll as school b
g July 1, 201
mbridge is re, as well
ability Plan. dge’s corpoe, a new inititory and rep
line year of otection (PCPquirements a
hanism to exe creation ofrequire publboards, and
13 and post
1
home to as many
The Plan rate iative ort on
2009, P) as part of
xpand f clean lic
that
Stantec C
Do
Accountypes othe allo
1.3
The PCemissioMuniciCanadgovern
The PCto take
Cost srenewaoperat
Respocommu
Figure
onsulting Ltd.
Develop five-ynline.
nting for the of services procation of se
PARTNE
CP program ons and actinpalities (FCM
dian componnments.
CP program pe action to re
savings: Incable energy ions.
onsible Corunity on GHG
e 1. Five Mi
Milestoemissions
Milestonered
Mileston
MilestoLo
Milestoneand
year energy
GHG emissrovided to thervices betwe
ERS FOR C
is a networng on climatM) and ICLEnent of ICL
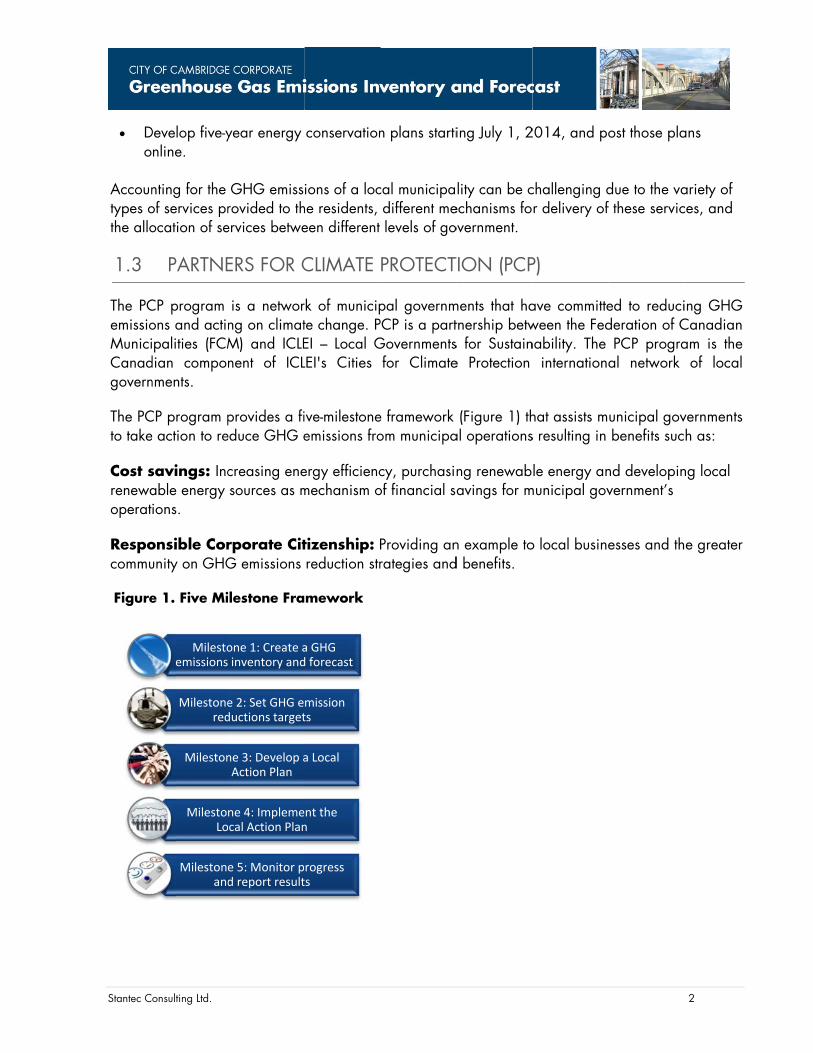
provides a fieduce GHG e
creasing enesources as m
rporate CitG emissions
ilestone Fra
one 1: Create ainventory and
e 2: Set GHG eductions target
ne 3: Develop aAction Plan
ne 4: Implemecal Action Plan
e 5: Monitor pd report result
conservation
ions of a loche residents, een different
CLIMATE
rk of municipte change. PEI – Local GLEI's Cities
ive-milestoneemissions fro
ergy efficiencmechanism o
tizenship: Preduction str
amework
a GHG d forecast
mission ts
a Local
ent the n
rogress ts
n plans starti
cal municipadifferent melevels of go
PROTECT
pal governmPCP is a partGovernmentsfor Climate
e frameworkom municipa
cy, purchasinof financial sa
Providing anrategies and
ing July 1, 2
lity can be cechanisms foovernment.
TION (PCP
ments that hatnership betws for Sustaine Protection
(Figure 1) thal operations
ng renewabavings for m
n example tod benefits.
2014, and po
challenging dr delivery of
P)
ave committeween the Fednability. The
internationa
hat assists ms resulting in
le energy anmunicipal gov
o local busine
ost those pla
due to the vaf these servic
ed to reducideration of CPCP progra
al network
unicipal govbenefits suc
nd developinvernment’s
esses and th
2
ans
ariety of ces, and
ing GHG Canadian am is the
of local
vernments h as:
ng local
e greater

Stantec Consulting Ltd. 3
These benefits to the corporation of the City of Cambridge may in turn be a catalyst for the business and residential community to protect the climate as well as encourage many other benefits such as:
Job creation and local economic development: Creating new markets for renewable energy technologies, energy efficiency and sustainable public transit to stimulate the community's economy and increase competitiveness.
Reduced traffic congestion: Promoting public transit, cycling, car sharing, and active transportation encourages the community to choose more affordable and environmentally friendly travel modes. Improving alternative mobility reduces costs of road maintenance for local governments.
Improved air quality: Reducing pollutants and airborne particles improves air quality and reduces the incidence of respiratory diseases (PCP, 2012, 1).
Stantec Consulting Ltd. 4
2.0 METHODOLOGY 2.1 INVENTORY PROTOCOL
The methods used to develop the City of Cambridge’s corporate GHG inventory are in keeping with the PCP best practices and guidance (PCP, 2012, 1). To quantify GHG emissions in the identified corporate sectors, the International Government GHG Emissions Analysis Protocol (IEAP) was utilized as the preferred inventory guidance document for municipalities participating in the PCP program (ICLEI, 2012).
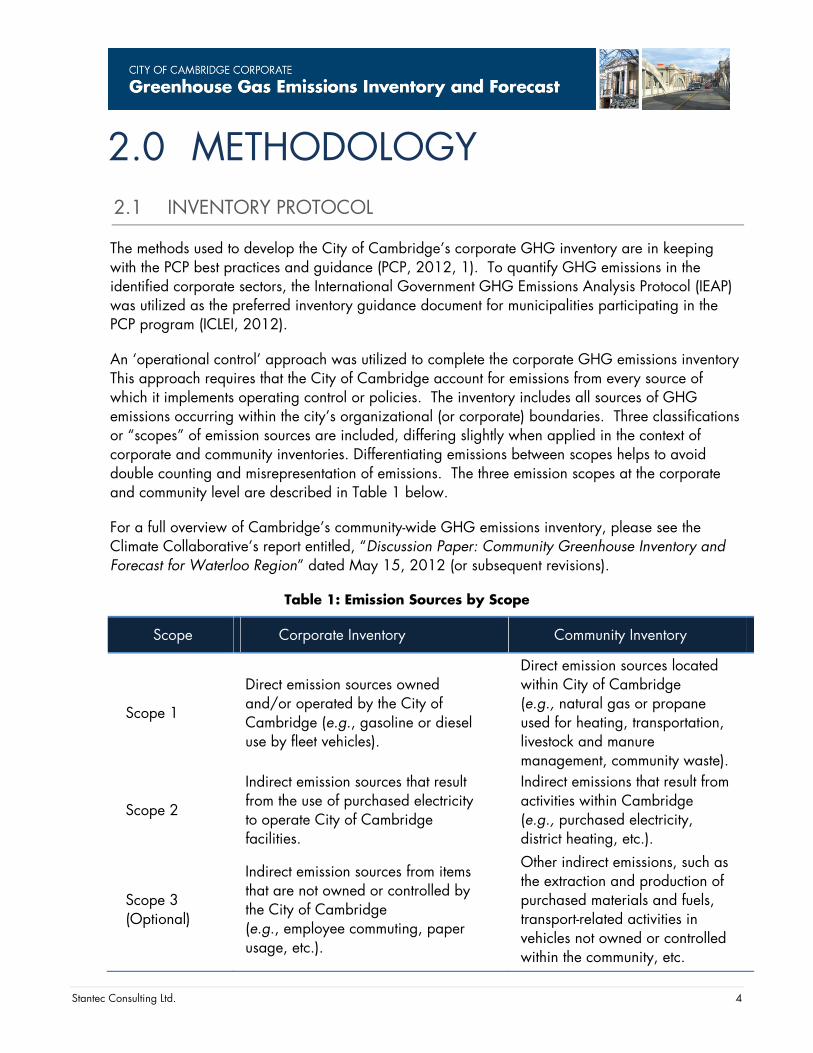
An ‘operational control’ approach was utilized to complete the corporate GHG emissions inventory This approach requires that the City of Cambridge account for emissions from every source of which it implements operating control or policies. The inventory includes all sources of GHG emissions occurring within the city’s organizational (or corporate) boundaries. Three classifications or “scopes” of emission sources are included, differing slightly when applied in the context of corporate and community inventories. Differentiating emissions between scopes helps to avoid double counting and misrepresentation of emissions. The three emission scopes at the corporate and community level are described in Table 1 below.
For a full overview of Cambridge’s community-wide GHG emissions inventory, please see the Climate Collaborative’s report entitled, “Discussion Paper: Community Greenhouse Inventory and Forecast for Waterloo Region” dated May 15, 2012 (or subsequent revisions).
Table 1: Emission Sources by Scope
Scope Corporate Inventory Community Inventory
Scope 1
Direct emission sources owned and/or operated by the City of Cambridge (e.g., gasoline or diesel use by fleet vehicles).
Direct emission sources located within City of Cambridge (e.g., natural gas or propane used for heating, transportation, livestock and manure management, community waste).
Scope 2
Indirect emission sources that result from the use of purchased electricity to operate City of Cambridge facilities.
Indirect emissions that result from activities within Cambridge (e.g., purchased electricity, district heating, etc.).
Scope 3 (Optional)
Indirect emission sources from items that are not owned or controlled by the City of Cambridge (e.g., employee commuting, paper usage, etc.).
Other indirect emissions, such as the extraction and production of purchased materials and fuels, transport-related activities in vehicles not owned or controlled within the community, etc.

S
Stantec Consulting
Based Cambr
Emissiosum of This is individthe atmconside
The ememissioCO2e ewas chsimilar baselinof Cam
g Ltd.
on the ICLEI ridge are as
Buildings;
Vehicle Flee
Small Equip
Street Lighti
Sewage Pu
Municipal S
ons are repothe individuaccomplisheual GHGs.
mosphere relaered within t
C
Sourc
missions fromons. The finaemitted fromhosen throug
baselines thne will providmbridge will
IEAP, sectorfollows:
et;
pment;
ing;
mping; and,
Solid Waste
orted as carbual GHGs weed by utilizinThe GWP isative to the ithis inventory
Tab
Greenhou
Carbon Diox
Methane
Nitrous Oxid
e: Intergovernm
m a source aral CO2e valu Cambridgeh consultatio
hroughout thede the basis be participa
rs in which d
,
.
bon dioxide eeighted to reng the appros a measure mpact of COy and their re
ble 2: Globa
use Gas
xide (CO2)
(CH4)
de (N2O)
mental Panel on
re multiplied es are summ
e’s corporateon with the Ce Region of Wfor all future
ating in, as p
data was com
equivalents (epresent the apriate Globaof the warm
O2 (the most espective GW
al Warming
n Climate Chan
by the apprmed by scopee operations City of CambWaterloo foe annual enepart of the G
mpiled and r
(tonnes of COatmospherical Warming
ming effect thaabundant GWPs are pre
g Potentials
Global War(100
2
3
nge, Second As
ropriate GWe and by secfor the base
bridge coordr corporate G
ergy and GHGEA reporting
reported for
O2e) with CO effects of caPotentials (Gat a particul
GHG). A sumesented in Ta
rming Potent0 year)
1
21
310
ssessment Repo
WP to determictor to providline year 20
dinating staffGHG invent
HG emission g.
the City of
O2e represenarbon dioxidGWP) of eacar GHG wilmmary of GHable 2.
tial
ort
ine the CO2ede the total t009. This baf, and is in liories. The 2tracking tha
5
nting the de (CO2). ch of the l have on HGs
e tonnes of aseline ne with
2009 t the City
Stantec Consulting Ltd. 6
2.2 EMISSION SOURCES AND EMISSION FACTORS
The following is a summary of methods used for determining emissions from various sources utilizing PCP approved emission intensity values (emission factors). All emission factors for the City of Cambridge’s corporate GHG inventory were derived from the most recent and available Canadian National Inventory Report, unless otherwise stated. The following equation is the general equation that was applied to the City of Cambridge 2009 GHG inventory for calculating emissions.
∗
∗
Energy Use
Emissions resulting from energy consumption in City of Cambridge facilities due to electricity usage are calculated by utilizing the appropriate emission factor, determined by Province, multiplied by the electricity consumed (in kilowatt hours (kWh)).
Natural Gas and Diesel Combustion
Emissions resulting from the stationary combustion of natural gas and diesel used for heating and other processes at City of Cambridge facilities are calculated by utilizing the appropriate natural gas or diesel emission factors based on the properties of the fuel, multiplied by the quantity of fuel consumed (in m3 or L).
Vehicle and Equipment Fleet Fuel Use
Emissions resulting from fuel use in the City of Cambridge fleet, including vehicles and small non-road equipment are calculated by multiplying the total fuel use (in L) by the appropriate emission factor, determined by fuel type (e.g., gasoline or diesel) as well as year, make and model of the vehicle or piece of equipment.
Municipal Waste
The GHG emissions from waste generated by City of Cambridge facilities are calculated using the quantity of waste produced and the emission factor for municipal solid waste found in the spreadsheet tool developed by PCP for use by Canadian municipalities to aid in GHG inventory development (PCP, 2012, 2).
Stantec Consulting Ltd. 7
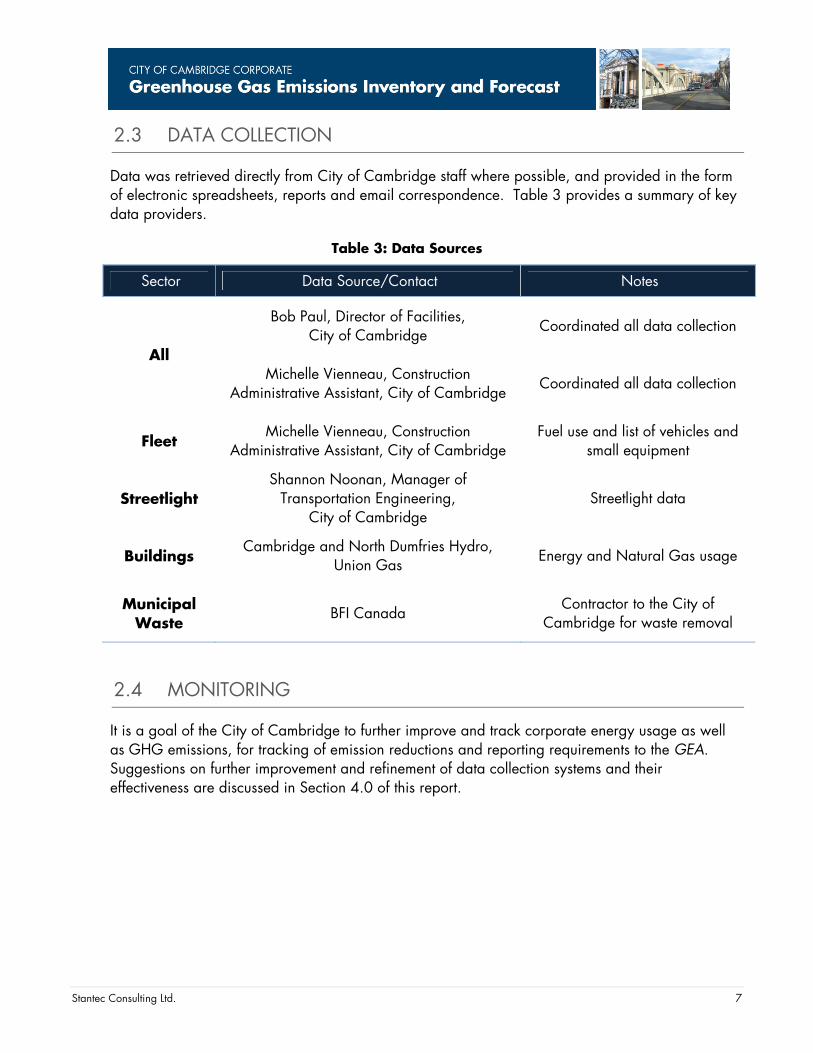
2.3 DATA COLLECTION
Data was retrieved directly from City of Cambridge staff where possible, and provided in the form of electronic spreadsheets, reports and email correspondence. Table 3 provides a summary of key data providers.
Table 3: Data Sources
Sector Data Source/Contact Notes
All
Bob Paul, Director of Facilities, City of Cambridge
Coordinated all data collection
Michelle Vienneau, Construction Administrative Assistant, City of Cambridge
Coordinated all data collection
Fleet Michelle Vienneau, Construction
Administrative Assistant, City of Cambridge Fuel use and list of vehicles and
small equipment
Streetlight Shannon Noonan, Manager of
Transportation Engineering, City of Cambridge
Streetlight data
Buildings Cambridge and North Dumfries Hydro,
Union Gas Energy and Natural Gas usage
Municipal Waste
BFI Canada Contractor to the City of
Cambridge for waste removal
2.4 MONITORING
It is a goal of the City of Cambridge to further improve and track corporate energy usage as well as GHG emissions, for tracking of emission reductions and reporting requirements to the GEA. Suggestions on further improvement and refinement of data collection systems and their effectiveness are discussed in Section 4.0 of this report.

Stantec Consulting Ltd. 8
3.0 CORPORATE INVENTORY 3.1 INVENTORY SUMMARY
A GHG emissions inventory of the City of Cambridge was completed for the 2009 baseline year. The total GHG emissions from the 2009 corporate operations are estimated to be 7,448 tonnes of CO2e.
A summary of the GHG emissions by sector is provided in Table 4. Buildings produced the largest amount of CO2e for the City of Cambridge corporate operations, with the Fleet Vehicles producing the second largest CO2e for the City of Cambridge.
Table 4: GHG Emissions by Sector
Sector GHG Emissions (tonnes CO2e)
Buildings 4,373
Vehicles 1,727
Street Lighting 828
Sewage Pumping 245
Waste 232
Small Engines 43
Total 7,448
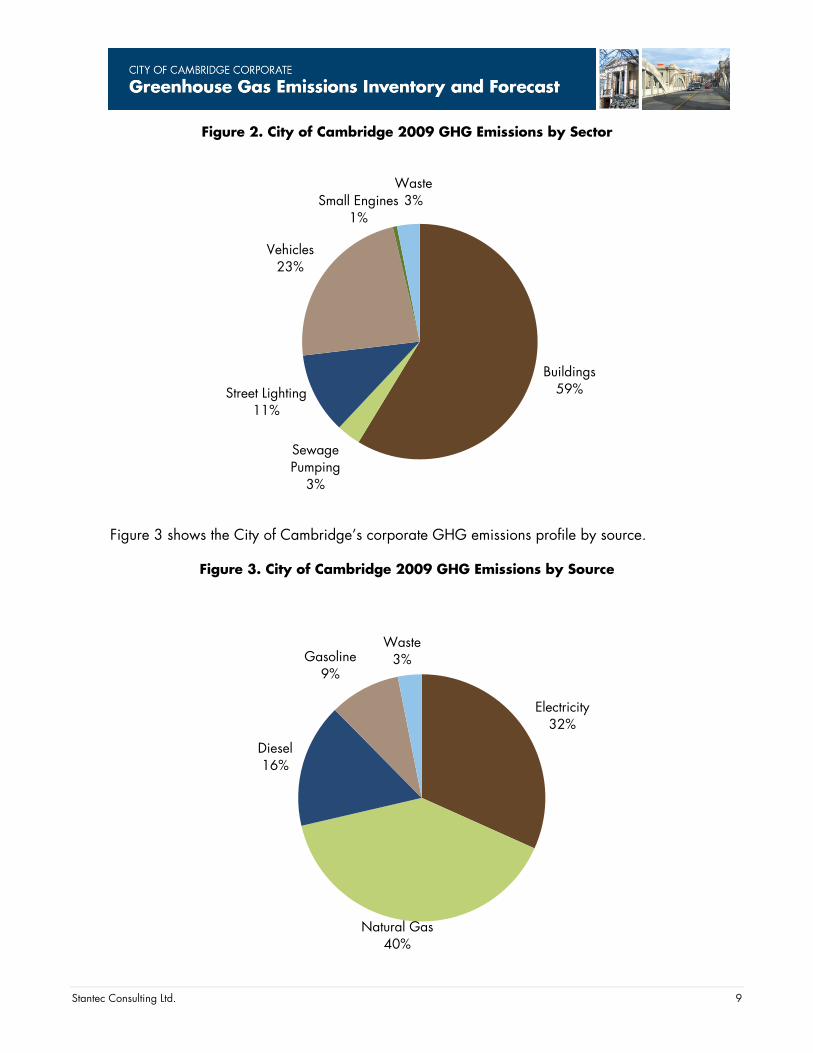
Figure 2 shows the City of Cambridge’s corporate GHG emissions profile by sector.
Stantec Consulting Ltd. 9
Figure 2. City of Cambridge 2009 GHG Emissions by Sector
Figure 3 shows the City of Cambridge’s corporate GHG emissions profile by source.
Figure 3. City of Cambridge 2009 GHG Emissions by Source
Buildings59%
Sewage Pumping
3%
Street Lighting11%
Vehicles23%
Small Engines1%
Waste3%
Electricity32%
Natural Gas40%
Diesel16%
Gasoline9%
Waste3%
S
Stantec Consulting
Figure
The GH
3.2
In 200approxoperat87,000some majoritmanagHowevthe Citybusinesboard.
Buildin4,373 emissioresulted(or 4%
g Ltd.
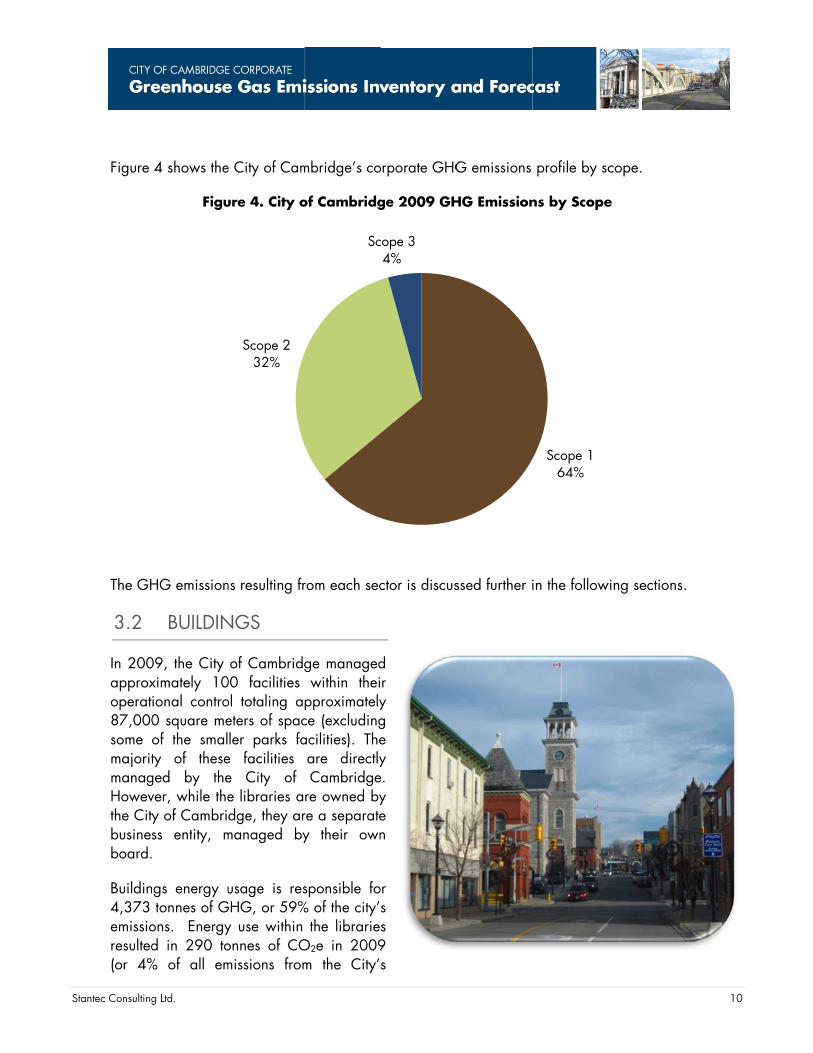
4 shows the
Figu
HG emission
BUILDIN
09, the City ximately 10ional contro0 square meof the smalty of these
ged by thever, while they of Cambriss entity, m
gs energy utonnes of G
ons. Energyd in 290 to% of all em
e City of Cam
ure 4. City o
ns resulting fr
NGS
of Cambrid00 facilities ol totaling aeters of spacler parks fa
e facilities e City of e libraries adge, they ar
managed by
usage is resGHG, or 59%y use within onnes of COmissions from
Scope 232%
mbridge’s co
of Cambridg
rom each sec
ge managedwithin thei
pproximatelyce (excludingacilities). Theare directlyCambridge
re owned byre a separatey their own
sponsible fo% of the city’
the librarieO2e in 2009m the City’
Sc
orporate GHG
ge 2009 GH
ctor is discus
d r y g e y
e. y e n
or s s 9 s
cope 34%
G emissions
HG Emission
ssed further i
profile by sc
ns by Scope
in the follow
Scope 164%
cope.
e
wing sections.
10
.

Stantec Consulting Ltd. 11
operations). There were also a number of facilities for which no energy or natural gas consumption could be attributed to, due to lack of data. The electricity and natural gas usage for these facilities were estimated based on average consumption data, where possible. This is discussed further in Section 4.2.
Table 5 provides a summary of energy use and emissions generated by City of Cambridge facilities.
Table 5: GHG Emissions from Buildings and Facilities
Facility Electricity Use
(kWh) Natural Gas Use
(m3) Total GHG
(tonnes CO2e)
Administrative Buildings 1,299,550 107,202 359
Arenas & Entertainment Facilities
5,383,831 400,675 1,404
Arts Buildings 575,194 58,054 179
Cemeteries 114,817 37,765 85
Fire Stations 420,054 154,957 343
Heritage Buildings 306,897 82,882 194
Libraries 1,031,120 88,120 290
Other Facilities 384,992 67,758 174
Outdoor Pools & Buildings 155,790 73,614 158
Parks 569,100 39,696 143
Recreation/Community Centre 833,206 166,415 415
Service Buildings 648,079 190,906 439
Soccer Facilities (Indoor) 275,555 83,424 191
Total 11,998,186 1,551,468 4,373
3.3 FLEET - VEHICLES
Fleet vehicles included within this inventory include: snow removal, construction, maintenance, and other on- and off-road vehicles used by City of Cambridge employees.
The Grand River Transit bus system is operated by the Regional Municipality of Waterloo, and therefore not included within this inventory, as it falls within the operational control of the Region of Waterloo.
Vehicle fleet is responsible for 1,727 tonnes of GHG, or 23% of the city’s emissions. Inaccuracies associated with the fuel data were identified and discussed further in Section 4.1. Table 6 provides a summary of vehicle fleet GHG emissions broken down by vehicles and equipment as well as their associated fuel type.
Stantec Consulting Ltd. 12
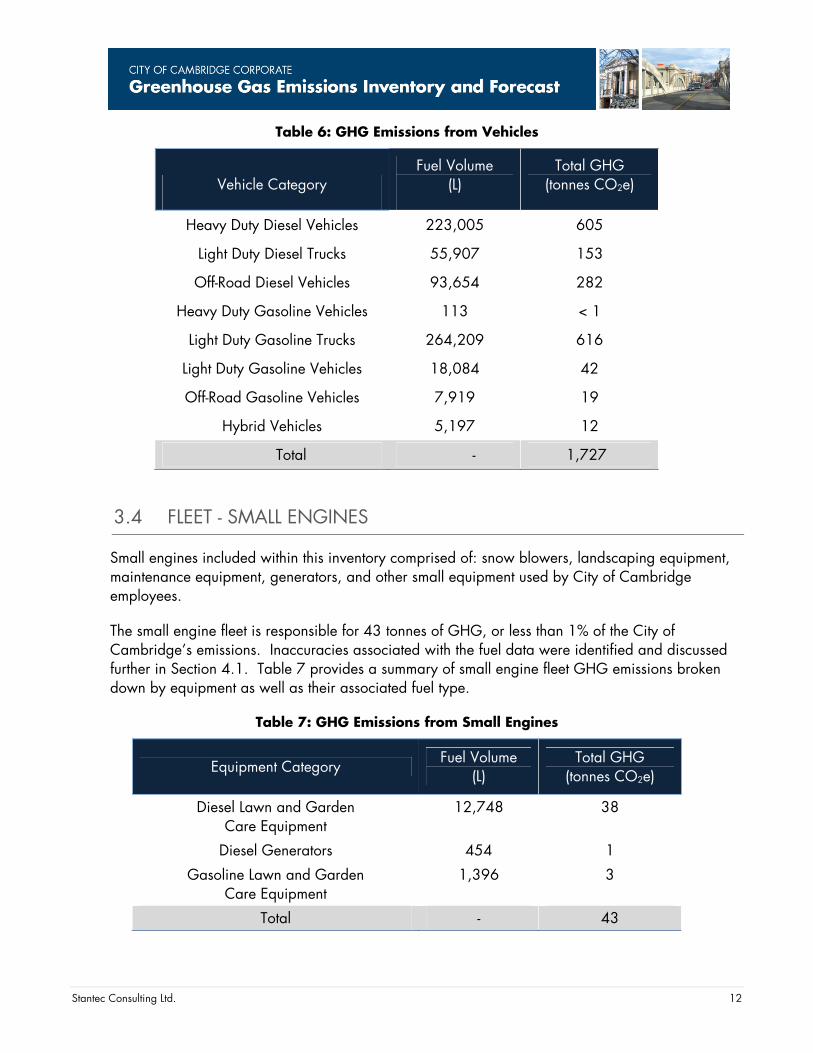
Table 6: GHG Emissions from Vehicles
Vehicle Category Fuel Volume
(L) Total GHG
(tonnes CO2e)
Heavy Duty Diesel Vehicles 223,005 605
Light Duty Diesel Trucks 55,907 153
Off-Road Diesel Vehicles 93,654 282
Heavy Duty Gasoline Vehicles 113 < 1
Light Duty Gasoline Trucks 264,209 616
Light Duty Gasoline Vehicles 18,084 42
Off-Road Gasoline Vehicles 7,919 19
Hybrid Vehicles 5,197 12
Total - 1,727
3.4 FLEET - SMALL ENGINES
Small engines included within this inventory comprised of: snow blowers, landscaping equipment, maintenance equipment, generators, and other small equipment used by City of Cambridge employees.
The small engine fleet is responsible for 43 tonnes of GHG, or less than 1% of the City of Cambridge’s emissions. Inaccuracies associated with the fuel data were identified and discussed further in Section 4.1. Table 7 provides a summary of small engine fleet GHG emissions broken down by equipment as well as their associated fuel type.
Table 7: GHG Emissions from Small Engines
Equipment Category Fuel Volume
(L) Total GHG
(tonnes CO2e)
Diesel Lawn and Garden Care Equipment
12,748 38
Diesel Generators 454 1
Gasoline Lawn and Garden Care Equipment
1,396 3
Total - 43
S
Stantec Consulting
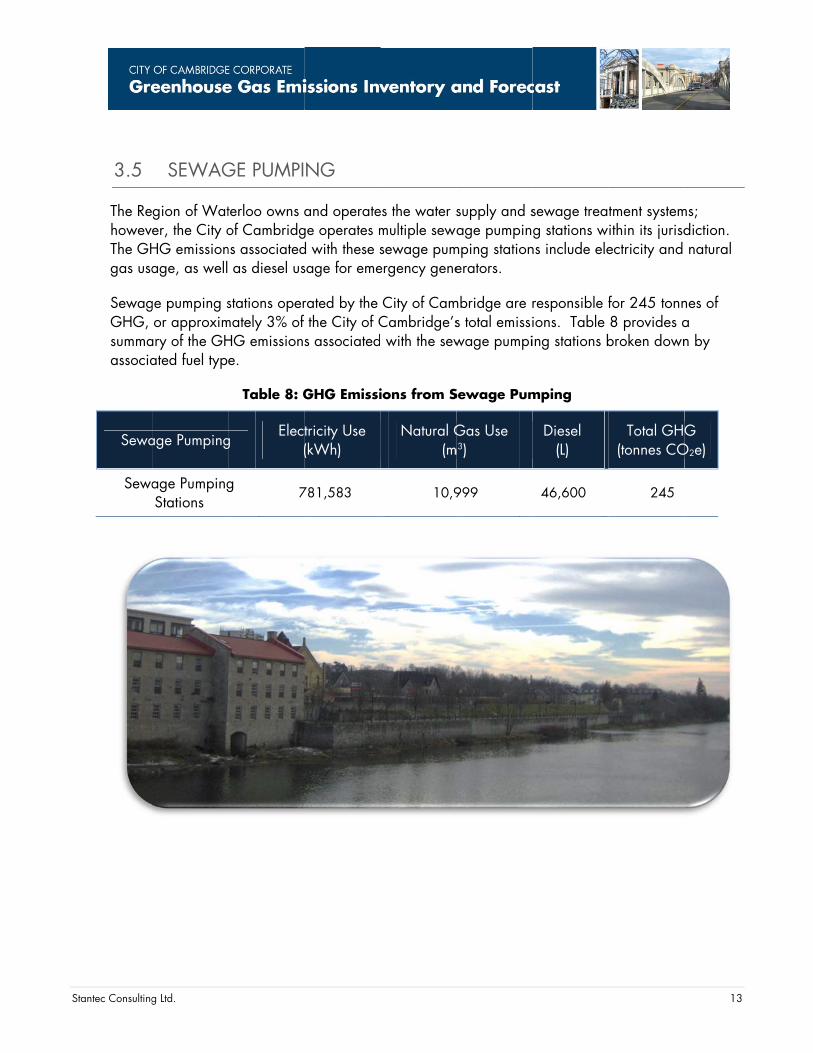
3.5
The RehowevThe GHgas usa
SewagGHG, summaassocia
Sewa
Sewa
g Ltd.
SEWAG
gion of Water, the City oHG emissionage, as well
ge pumping sor approxim
ary of the GHated fuel typ
age Pumping
age PumpingStations
GE PUMPI
terloo owns of Cambridgns associated as diesel us
stations opermately 3% of HG emissione.
Table 8: G
g Elec
(
g 7
NG
and operatege operates md with these ssage for eme
rated by the the City of Cs associated
GHG Emissi
tricity Use (kWh)
781,583
es the water smultiple sewasewage pumergency gene
City of CamCambridge’s with the sew
ions from S
Natural G(m
10,9
supply and sage pumpin
mping stationerators.
mbridge are rs total emissiwage pumpi
Sewage Pum
Gas Use m3)
999
sewage treag stations w
ns include ele
responsible fions. Table ing stations b
mping
Diesel (L)
46,600
tment systemithin its jurisdectricity and
for 245 tonn8 provides abroken down
Total GH(tonnes CO
245
13
ms; diction. natural
nes of a n by
G O2e)

Stantec Consulting Ltd. 14
3.6 STREETLIGHTING
This sector includes streetlights operated by the City of Cambridge as well as various lighting required around the City of Cambridge such as sign lighting and parking lot lighting.
Streetlights operated by the City of Cambridge are responsible for 828 tonnes of GHG, or 11% of the City of Cambridge’s emissions. Table 9 provides a summary of total streetlight energy use and GHG emissions.
Table 9: GHG Emissions from Streetlights
Street Lighting Electricity Use
(kWh) Total GHG
(tonnes CO2e)
All Street Lighting 6,896,128 828
3.7 CORPORATE WASTE
The corporate waste sector only includes waste that is generated within corporately owned facilities. Community waste is controlled and operated at the Regional level, and the City of Cambridge owns no landfills, so emissions from the community overall have been omitted from this inventory.
Corporate waste generated by City of Cambridge facilities is responsible for 232 tonnes of GHG, or 3% of the City of Cambridge’s emissions. Table 10 provides a summary of corporate waste GHG emissions broken down by facility type, those areas that display “n.a” do not have any data associated with them.
Table 10: GHG Emissions from Corporate Waste
Facility Quantity of Waste
(tonnes) Total GHG
(tonnes CO2e)
Administrative Buildings 42 20
Arenas & Entertainment Facilities 139 67
Arts Buildings n.a. n.a.
Cemeteries 32 16
Fire Stations 64 31
Heritage Buildings n.a. n.a.
Libraries n.a. n.a.
Other Facilities n.a. n.a.
Outdoor Pools & Buildings 9 4
Stantec Consulting Ltd. 15
Parks 100 48
Recreation/Community Centre 53 26
Service Buildings 42 20
Soccer Facilities (Indoor) n.a. n.a.
Total 482 232 n.a.: data not available
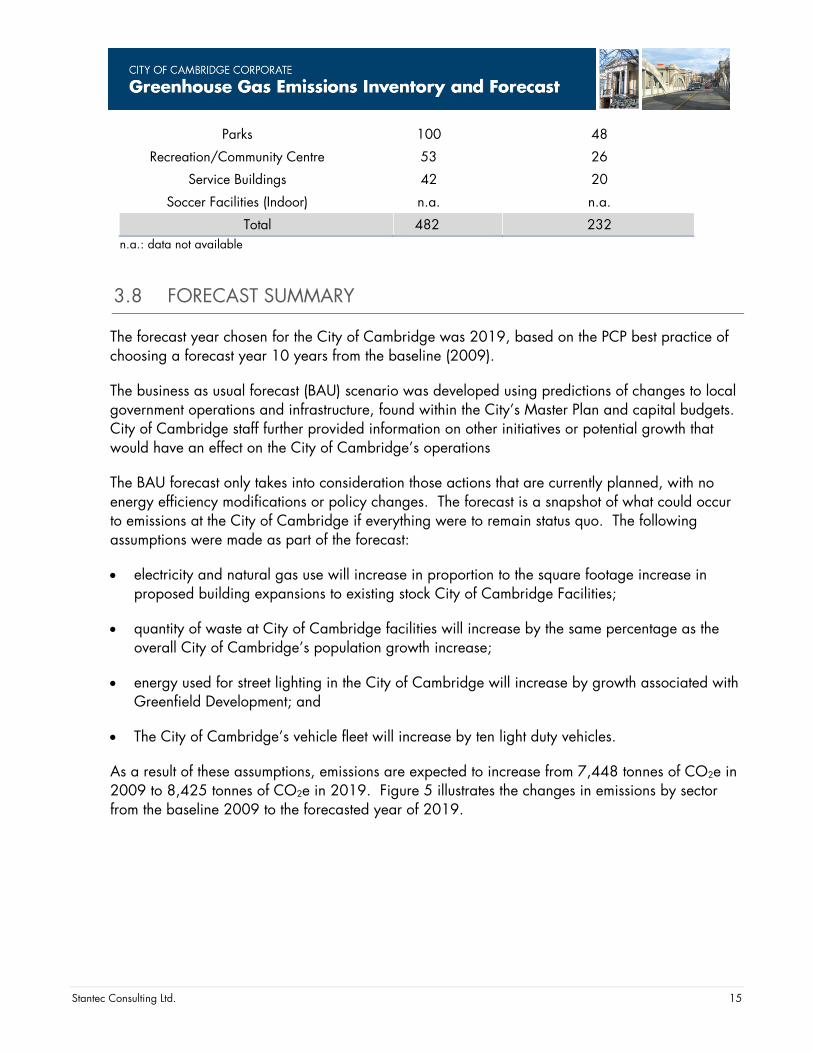
3.8 FORECAST SUMMARY
The forecast year chosen for the City of Cambridge was 2019, based on the PCP best practice of choosing a forecast year 10 years from the baseline (2009).
The business as usual forecast (BAU) scenario was developed using predictions of changes to local government operations and infrastructure, found within the City’s Master Plan and capital budgets. City of Cambridge staff further provided information on other initiatives or potential growth that would have an effect on the City of Cambridge’s operations
The BAU forecast only takes into consideration those actions that are currently planned, with no energy efficiency modifications or policy changes. The forecast is a snapshot of what could occur to emissions at the City of Cambridge if everything were to remain status quo. The following assumptions were made as part of the forecast:
electricity and natural gas use will increase in proportion to the square footage increase in proposed building expansions to existing stock City of Cambridge Facilities;
quantity of waste at City of Cambridge facilities will increase by the same percentage as the overall City of Cambridge’s population growth increase;
energy used for street lighting in the City of Cambridge will increase by growth associated with Greenfield Development; and
The City of Cambridge’s vehicle fleet will increase by ten light duty vehicles.
As a result of these assumptions, emissions are expected to increase from 7,448 tonnes of CO2e in 2009 to 8,425 tonnes of CO2e in 2019. Figure 5 illustrates the changes in emissions by sector from the baseline 2009 to the forecasted year of 2019.
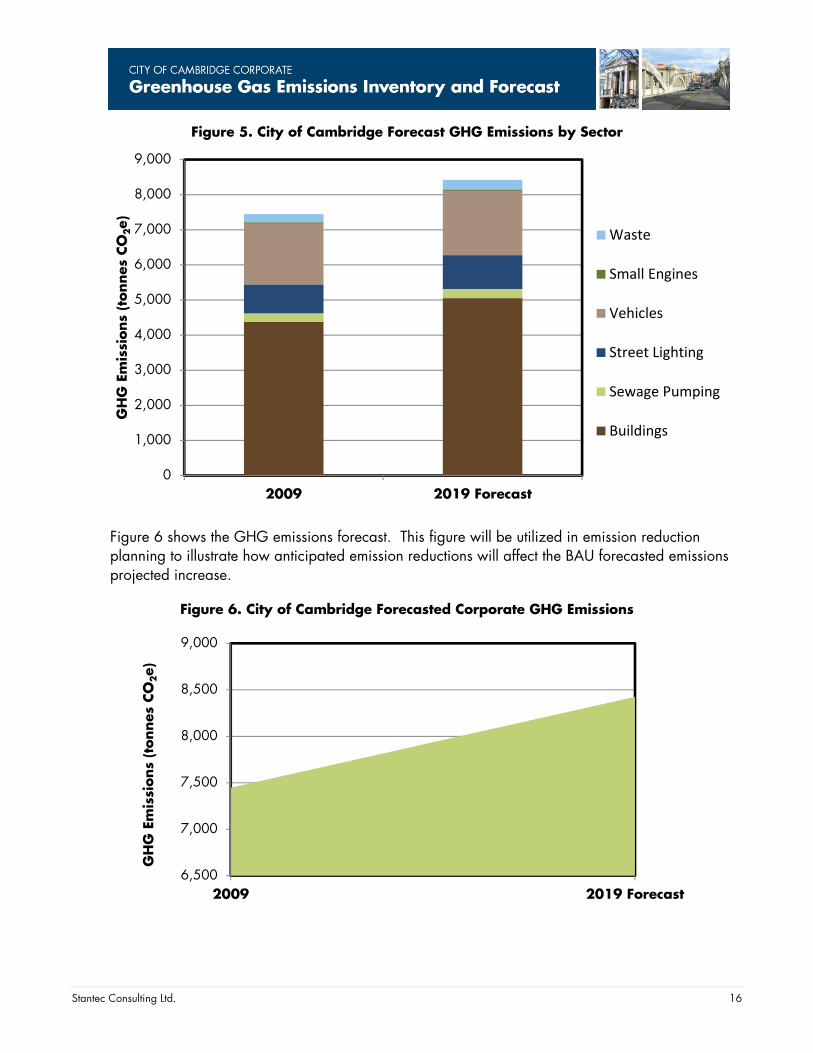
Stantec Consulting Ltd. 16
Figure 5. City of Cambridge Forecast GHG Emissions by Sector
Figure 6 shows the GHG emissions forecast. This figure will be utilized in emission reduction planning to illustrate how anticipated emission reductions will affect the BAU forecasted emissions projected increase.
Figure 6. City of Cambridge Forecasted Corporate GHG Emissions
0
1,000
2,000
3,000
4,000
5,000
6,000
7,000
8,000
9,000
2009 2019 Forecast
GH
G E
mis
sions
(tonnes
CO
2e)
Waste
Small Engines
Vehicles
Street Lighting
Sewage Pumping
Buildings
6,500
7,000
7,500
8,000
8,500
9,000
2009 2019 Forecast
GH
G E
mis
sions
(tonnes
CO
2e)
S
Stantec Consulting
4.0
Duringincreassignificpotenti
4.1
It was identifithere isconsumonwardenginedescripaccoun
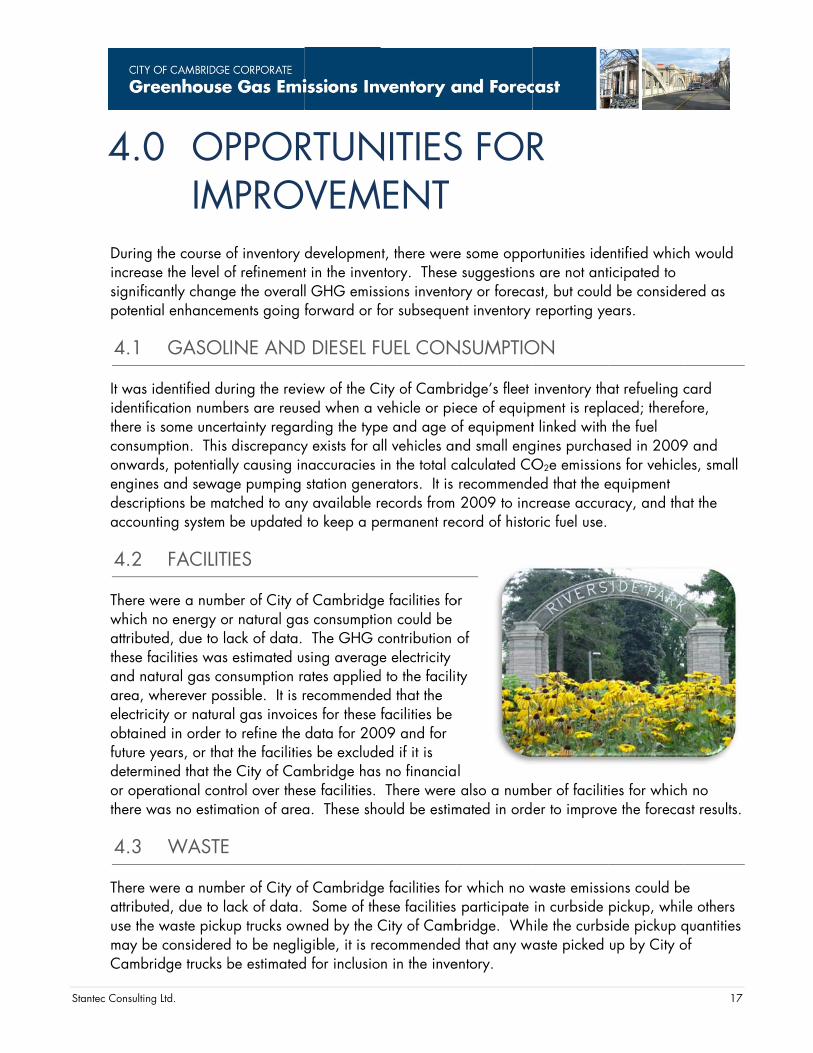
4.2
There wwhich attributthese faand naarea, welectricobtainefuture ydetermor opethere w
4.3
There wattributuse themay beCambr
g Ltd.
0 OPIM
the course ose the level ocantly changal enhancem
GASOL
identified ducation numbs some uncemption. This ds, potential
es and sewagptions be manting system
FACILIT
were a numbno energy oted, due to laacilities was atural gas cowherever pocity or naturaed in order tyears, or tha
mined that therational con
was no estim
WASTE
were a numbted, due to lae waste pickue consideredridge trucks b
PPORMPRO
of inventory of refinemente the overal
ments going
LINE AND
uring the revibers are reusrtainty regardiscrepancyly causing inge pumping atched to anybe updated
IES
ber of City or natural gasack of data. estimated u
onsumption rassible. It is ral gas invoicto refine the at the facilitiee City of Camtrol over thesation of area
E
ber of City oack of data. up trucks owd to be negligbe estimated
RTUNVEMdevelopment in the invenl GHG emissforward or f
D DIESEL F
iew of the Csed when a vrding the typy exists for anaccuracies station gene
y available rto keep a pe
f Cambridges consumptio The GHG csing averageates appliedrecommendees for these data for 200
es be excludembridge hasse facilities.a. These sho
f Cambridge Some of the
wned by the Cgible, it is re
d for inclusio
NITIESENTt, there were
ntory. Thesesions inventofor subseque
UEL CON
ity of Cambrvehicle or piee and age oll vehicles anin the total c
erators. It is records from ermanent rec
e facilities foon could be contribution e electricity
d to the facilied that the facilities be 09 and for ed if it is s no financia There were ould be estim
e facilities foese facilities City of Cambecommendedn in the inve
S FOR
e some oppoe suggestionsory or forecaent inventory
NSUMPTIO
ridge’s fleet ece of equipof equipmentnd small engcalculated COrecommend2009 to inc
cord of histo
or
of
ty
l also a numb
mated in ord
or which no w participate bridge. Whd that any wentory.
R
ortunities ides are not antast, but couldreporting ye
ON
inventory thapment is replt linked with gines purchaO2e emissioed that the ecrease accuroric fuel use.
ber of facilitier to improv
waste emissiin curbside ile the curbsaste picked
entified whichticipated to d be consideears.
at refueling caced; therefthe fuel
ased in 2009ns for vehicleequipment racy, and tha
ies for whichve the foreca
ons could bepickup, whilside pickup qup by City o
17
h would
ered as
card ore,
9 and es, small
at the
h no st results.
e e others quantities of

Stantec Consulting Ltd. 18
Another opportunity of improvement for waste emissions estimation arises from the lack of data for the weight of waste from the bin collection. As an approximation, the total volume of the entire bin was used, whereas the actual volume or weight was unknown. It is suggested that the waste be weighed for future iterations of the inventory.

S
Stantec Consulting
5.0The neapprovplan toand caGHG e
The Citcomplewill alswill betargetstargetsCambr
This baenergybut wil
The fol
Bui
Vehequ
Co
Stre
Sew
g Ltd.
0 NExt steps and ve GHG emio communicaan implemenemissions.
ty of Cambriete a corporaso assist the C compared t will also be will be submridge and pr
aseline GHGy usage on al help to esta
lowing muni
ildings and F
hicle and Equipment, righ
orporate Wa
eet Lighting -
wage Pumpi
EXT SPCP milestossion reduct
ate and detert in order to
idge has sucate emissionCity of Camto goals of oe investigatedmitted to the resented to th
G inventory wa yearly basisablish a syste
icipal focus a
Facilities - en
quipment Fleeht- and down
ste - waste g
- energy con
ng – energy
STEPSones for the Cion targets (Mrmine what mreduce ener
ccessfully recs reduction pbridge in set
other Canadid and incorpMunicipal S
he Mayor an
will allow thes. This will aem to reduce
areas will be
nergy and na
et - fuel consn-sizing;
generation re
nsumption red
efficiency a
S City of CambMilestone 2)measures anrgy consump
ceived Greenplan, also kntting a targean municipa
porated into Sustainabilitynd Council.
City of Camallow the Cite emissions.
e addressed
atural gas co
sumption red
eduction, inc
duction, use
and pump siz
WinCthth
bridge is to d), as well as nd initiatives ption and fue
n Municipal nown as a Loet for reductioalities. The cthe ten year
y Task Force
mbridge to rety to be proa
in the final C
onsumption r
uction, alter
rease in alte
of efficient t
zing.
With the comnventory andCity of Cambheir energy ahe next level.
develop andto create a cthe City of C
el use, and th
Funding (GMocal Action Pons. The tarcost benefit ocapital budthat was for
eport and traactive and co
Corporate G
reduction;
native fuels,
ernate divers
technologies
mpletion of thd the successbridge is weland emission.
d have Counccorporate acCambridge wherefore redu
MF) from FCMPlan. The furgets for reduof these reduget process.rmed by the
ack emissionomply with t
GHG Reducti
choice of
ion rates;
s; and,
is GHG emisful GMF gral-positioned tns planning e
19
cil ction wants to uce
M to nding uction uction These City of
s and he GEA,
on Plan:
ssions ant, the to take efforts to
Stantec Consulting Ltd. 20
6.0 REFERENCES
Intergovernmental Panel on Climate Change, 2012. Accessed online: http://www.ipcc.ch/pdf/climate-changes-1995/ipcc-2nd-assessment/2nd-assessment-en.pdf
ICLEI-Local Governments for Sustainability, 2012. Accessed online: http://www.iclei.org/index.php?id=ghgprotocol
Ministry of Energy, Green Energy Act, 2012. Accessed online: http://www.energy.gov.on.ca/en/green-energy-act/
PCP, 2012. Partners for Climate Protection - Five-Milestone Framework for Reducing Greenhouse Gas Emissions. Accessed online: http://www.fcm.ca/Documents/reports/PCP/Five_Milestone_Framework_for_Reducing_Greenhouse_Gas_Emissions_EN.pdf
PCP, 2012 (1), Developing Inventories for Greenhouse Gas Emissions and Energy Consumption. Accessed online: http://www.fcm.ca/Documents/reports/PCP/Developing_Inventories_for_Greenhouse_Gas_Emissions_and_Energy_Consumption_EN.pdf
PCP, 2012 (2). Partners for Climate Protection Inventory Quantification Support Spreadsheet. Accessed online: http://www.fcm.ca/home/programs/partners-for-climate-protection/program-resources/milestone-toolkit/milestone-1.htm.
Region of Waterloo, Planning, Housing and Community Services, 2012 - ‘Places to Grow’ projections for Waterloo Region to 2031.