Embed Size (px)
Citation preview

Official address Domenico Scarlattilaan 6 ● 1083 HS Amsterdam ● The Netherlands
An agency of the European Union
Address for visits and deliveries Refer to www.ema.europa.eu/how-to-find-us Send us a question Go to www.ema.europa.eu/contact Telephone +31 (0)88 781 6000
27 February 2020 EMA/135313/2020 Committee for Medicinal Products for Human Use (CHMP)
Extension of indication variation assessment report
Invented name: Otezla
International non-proprietary name: apremilast
Procedure No. EMEA/H/C/003746/II/0029
Marketing authorisation holder (MAH) Amgen Europe B.V.
Note
Assessment report as adopted by the CHMP with all information of a commercially confidential nature deleted.

Extension of indication variation assessment report EMA/135313/2020 Page 2/102
Table of contents
1. Background information on the procedure .............................................. 5 1.1. Type II variation .................................................................................................. 5 1.2. Steps taken for the assessment of the product ........................................................ 6
2. Scientific discussion ................................................................................ 6 2.1. Introduction ........................................................................................................ 6 2.2. Non-clinical aspects .............................................................................................. 7 2.2.1. Ecotoxicity/environmental risk assessment ........................................................... 7 2.2.2. Conclusion on the non-clinical aspects ................................................................. 7 2.3. Clinical aspects .................................................................................................... 8 2.3.1. Introduction...................................................................................................... 8 2.3.2. Pharmacokinetics .............................................................................................. 9 2.3.3. Pharmacodynamics .......................................................................................... 10 2.3.1. Discussion on clinical pharmacology ................................................................... 16 2.4. Clinical efficacy .................................................................................................. 17 2.4.1. Dose response study........................................................................................ 17 2.4.2. Main studies ................................................................................................... 17 2.4.3. Discussion on clinical efficacy ............................................................................ 73 2.4.4. Conclusions on the clinical efficacy .................................................................... 77 2.5. Clinical safety .................................................................................................... 77 2.5.1. Discussion on clinical safety .............................................................................. 90 2.5.2. Conclusions on clinical safety ............................................................................ 92 2.5.3. PSUR cycle ..................................................................................................... 92 2.6. Risk management plan ....................................................................................... 92 2.7. Update of the Product information ........................................................................ 95 2.7.1. User consultation ............................................................................................ 95
3. Benefit-Risk Balance ............................................................................. 95 3.1. Therapeutic Context ........................................................................................... 95 3.1.1. Disease or condition ........................................................................................ 95 3.1.2. Available therapies and unmet medical need ....................................................... 96 3.1.3. Main clinical studies ......................................................................................... 96 3.2. Favourable effects .............................................................................................. 97 3.3. Uncertainties and limitations about favourable effects ............................................. 97 3.4. Unfavourable effects ........................................................................................... 98 3.5. Uncertainties and limitations about unfavourable effects ......................................... 98 3.6. Effects Table ...................................................................................................... 99 3.7. Benefit-risk assessment and discussion ............................................................... 100 3.7.1. Importance of favourable and unfavourable effects ............................................ 100 3.7.2. Balance of benefits and risks .......................................................................... 101 3.7.3. Additional considerations on the benefit-risk balance ......................................... 101 3.8. Conclusions ..................................................................................................... 101

Extension of indication variation assessment report EMA/135313/2020 Page 3/102
4. Recommendations ............................................................................... 101
5. EPAR changes ..................................................................................... 102

Extension of indication variation assessment report EMA/135313/2020 Page 4/102
List of abbreviations AE adverse event AESI adverse event of special interest ANCOVA analysis of covariance APR apremilast AUC area under the curve AUC0-12 area under the plasma concentration-time curve from 0 to 12 hours AUC0-t area under the plasma concentration-time curve from 0 to last quantifiable hour AUCW0-12 area under the curve for the number of oral ulcers from baseline through Week 12 BD Behçet’s disease BDCAF Behçet's Disease Current Activity Form BDCAI Behçet’s Disease Current Activity Index BSAS Behçet’s Syndrome Activity Score BID twice daily BMI body mass index cAMP cyclic adenosine monophosphate CI confidence interval CL/F apparent total body clearance Cmax maximum concentration CNS central nervous system CSR clinical study report EAIR exposure-adjusted incidence rate EMA European Medicines Agency EU European Union EULAR European League Against Rheumatism GCP Good Clinical Practice GI gastrointestinal IBDDAM Iranian Behçet's Disease Dynamic Measure IFN interferon IL interleukin IP investigational product ISG International Study Group ITT intent-to-treat LOCF last observation carried forward LS least squares MACE major adverse cardiac events MCID minimum clinically important difference MedDRA Medical Dictionary for Regulatory Activities MI multiple imputation MMRM mixed-effects model for repeated measures NRI nonresponder imputation PCS physical component summary PDE phosphodiesterase PDE4 phosphodiesterase type 4 PGA Physician’s Global Assessment PK pharmacokinetic(s) Pmi placebo multiple imputation PsA psoriatic arthritis PT preferred term QoL quality of life SAP statistical analysis plan SCE Summary of Clinical Efficacy SCQ Sponsor Created Queries SCS Summary of Clinical Safety SE standard error SF-36v2 Medical Outcome Study Short form 36-Item Health Survey, Version 2 SmPC Summary of Product Characteristics SMQ Standardized MedDRA Queries SOC system organ class t½ terminal half-life

Extension of indication variation assessment report EMA/135313/2020 Page 5/102
1. Background information on the procedure
1.1. Type II variation
Pursuant to Article 16 of Commission Regulation (EC) No 1234/2008, Celgene Europe BV submitted to the European Medicines Agency on 5 June 2019 an application for a variation.
The following variation was requested:
Variation requested Type Annexes affected
C.I.6.a C.I.6.a - Change(s) to therapeutic indication(s) - Addition of a new therapeutic indication or modification of an approved one
Type II I and IIIB
Extension of Indication to include treatment of adult patients with oral ulcers associated with Behçet’s disease (BD) who are candidates for systemic therapy. As a consequence, sections 4.1; 4.2; 4.8 and 5.1 of the SmPC are updated. The Package Leaflet is updated in accordance. Furthermore, the PI is brought in line with the latest QRD template version 10.1. The updated RMP version 12.0 has also been submitted.
The variation requested amendments to the Summary of Product Characteristics and Package Leaflet and to the Risk Management Plan (RMP).
Information on paediatric requirements
Pursuant to Article 8 of Regulation (EC) No 1901/2006, the application included an EMA Decision P/0398/2018 on the agreement of a paediatric investigation plan (PIP).
At the time of submission of the application, the PIP was not yet completed as some measures were deferred.
Information relating to orphan market exclusivity
Similarity
Pursuant to Article 8 of Regulation (EC) No. 141/2000 and Article 3 of Commission Regulation (EC) No 847/2000, the MAH did not submit a critical report addressing the possible similarity with authorised orphan medicinal products because there is no authorised orphan medicinal product for a condition related to the proposed indication.
MAH request for additional market protection
The MAH requested consideration of its application in accordance with Article 14(11) of Regulation (EC) 726/2004 - one year of market protection for a new indication.
Scientific advice
The MAH did not seek Scientific Advice at the CHMP.

Extension of indication variation assessment report EMA/135313/2020 Page 6/102
1.2. Steps taken for the assessment of the product
The Rapporteur and Co-Rapporteur appointed by the CHMP were:
Rapporteur: Peter Kiely Co-Rapporteur: Janet Koenig
Timetable Actual dates
Submission date 5 June 2019
Start of procedure: 20 July 2019
CHMP Rapporteur Assessment Report 13 September 2019
CHMP Co-Rapporteur Assessment Report 13 September 2019
PRAC Rapporteur Assessment Report 20 September 2019
PRAC members comments 25 September 2019
PRAC Outcome 3 October 2019
CHMP members comments 7 October 2019
Updated CHMP Rapporteur(s) (Joint) Assessment Report 10 October 2019
Request for supplementary information (RSI) 17 October 2019
CHMP Rapporteur Assessment Report 29 January 2020
PRAC Outcome 13 February 2020
CHMP members comments 13 February 2020
Updated CHMP Rapporteur Assessment Report 20 February 2020
Opinion 27 February 2020
The marketing authorisation for Otezla was transferred to Amgen Europe B.V. during the procedure.
2. Scientific discussion
2.1. Introduction
Behçet's disease (BD) is a chronic, relapsing, multisystemic inflammatory disorder of unknown aetiology characterized by 4 major symptoms (oral aphthous ulcers, genital ulcers, skin lesions, and ocular lesions) and occasionally by 5 minor symptoms (arthritis, gastrointestinal [GI] ulcers, epididymitis, vascular lesions, and central nervous system [CNS] symptoms) (Cho, 2012). The main clinical feature of BD is recurrent (exacerbations and remissions), painful oral ulcerations appearing either alone or in combination with painful ulcers of the genitals, as well as lesions of the skin, and eyes, and involvement of joints and other organs.
Genital ulcerations generally occur less frequently (approximately 80% of adults, range, 55% to 97% of cases). Skin involvement (eg. nodosum-like lesions, papulopustular lesions, pathergy reaction, and erythema multiforme) ranges from 39% to 93% of cases in adults. Ocular and joint involvement affects approximately 50% of patients, but there is variability amongst the studies reviewed (Davatchi, 2010). Inflammatory disease of the eye manifesting as uveitis remains one of the leading causes of blindness in some parts of the world (Cho, 2012).

Extension of indication variation assessment report EMA/135313/2020 Page 7/102
Classification criteria for the diagnosis of BD were established by the International Study Group (ISG) (ISGBD, 1990). The diagnosis of BD is based on a manifestation of recurrent oral ulcerations plus two of the following criteria: recurrent genital ulceration, eye lesions, skin lesions, or positive pathergy test.
Apremilast (CC-10004) is an oral small-molecule inhibitor of phosphodiesterase type 4 (PDE4) that works intracellularly to modulate a network of proinflammatory and anti-inflammatory mediators. Phosphodiesterase 4 is a cyclic adenosine monophosphate (cAMP)-specific PDE and the dominant PDE in inflammatory cells. The PDE4 inhibition elevates intracellular cAMP levels, which in turn down-regulates the inflammatory response by modulating the expression of TNF-α, IL-23, IL-17, and other inflammatory cytokines. Otezla (apremilast) is authorised in the treatment of patients with psoriatic arthritis and psoriasis. This application is to extend the therapeutic indications to the treatment of adult patients with oral ulcers associated with Behcet’s disease who are candidates for systemic therapies.
2.2. Non-clinical aspects
No new non-clinical data have been submitted in this application, which was considered acceptable by the CHMP.
2.2.1. Ecotoxicity/environmental risk assessment
An updated environmental risk assessment (ERA) was performed to include the proposed new indication, Behcet’s disease (BD), in addition to the approved ones (psoriasis and psoriatic arthritis (PsA)).
The partition coefficient (n-octanol/water) for apremilast was experimentally determined by the shake flask method. In a non-GLP study (comparable to OECD Test Method 107) the resulting logKow for APREMILAST was 1.77. In a second study in accordance with GLP and OECD Test Method 107, the logKow was determined to be 1.8. Both values are comparable and below the trigger of 4.5. Therefore, on the basis of this evaluation, apremilast is not considered to be persistent, bioaccumulative and toxic (PBT). The estimation of the predicted environmental concentration (PEC) has been calculated based on a refined market penetration factor (Fpen = 0.045), and a maximum daily dose of 60 mg. The phase I PECsurfacewater of Aprelimast was 1.35 µg/L and exceeds the action limit of 0.01 µg/L, triggering a Phase II environmental fate and effects assessment.
A phase II assessment was previously triggered in the initial application and therefore no further studies are warranted for this extension of indication application.
2.2.2. Conclusion on the non-clinical aspects
The updated data submitted in this application do not lead to a significant increase in environmental exposure further to the use of apremilast.
Considering the above data, apremilast is not expected to pose a risk to the environment.

Extension of indication variation assessment report EMA/135313/2020 Page 8/102
2.3. Clinical aspects
2.3.1. Introduction
GCP
The Clinical trials were performed in accordance with GCP as claimed by the MAH.
The MAH has provided a statement to the effect that clinical trials conducted outside the community were carried out in accordance with the ethical standards of Directive 2001/20/EC.
• Tabular overview of clinical studies
Study Number/ Countries Study Design Population
Treatment Duration
Treatment Groups
Total Number of Subjects Randomized/ Completed/Discontinued
BCT-002 France, Germany, Greece, Israel, Italy, Japan, Lebanon, Republic of Korea, Turkey, US
Phase 3, multicenter, randomized, placebo-controlled, double-blind, parallel-group efficacy and safety study
Adult subjects with oral ulcers that occurred ≥ 3 times in the 12-month period prior to screening, met ISG criteria for BD, without any active major organ involvement of BD, and had ≥ 2 oral ulcers at randomizationa
12-week Placebo-controlled Phase; 52-week Active Treatment Phase
Placebo APR 30 BID
Randomized: 207 Placebo-controlled Phase (n = 207): 179 completed, 28 discontinued Active Treatment Phase (n = 178)b: 143 completed, 35 discontinued 138 completed the studyc
BCT-001 US, Turkey
Phase 2, multicenter, randomized, placebo-controlled, double-blind, parallel-group efficacy and safety study
Adult subjects with active ulcer disease (oral and/or genital) in the 28-day period prior to screening, met ISG criteria for BD, without any active major organ involvement of BD, and had ≥ 2 oral ulcers at randomization
12-week, Placebo-controlled Treatment Phase 12-week, blinded Extension (Active Treatment) Phase
Placebo APR 30 BID
Randomized: 111 Placebo-controlled Phase (n = 111): 95 completed, 16 discontinued Active Treatment Phase (n = 95): 91 completed, 4 discontinued
APR = apremilast; BD = Behçet’s disease; BID = twice daily; ISG = International Study Group; US = United States. a Subjects were required to have ≥ 2 oral ulcers at randomization when randomization occurred at least 14 days after the Screening Visit OR ≥ 3 oral ulcers at randomization when randomization occurred between 1 day and 42 days after the Screening Visit.

Extension of indication variation assessment report EMA/135313/2020 Page 9/102
b One subject completed the Placebo-controlled Phase and did not enter the Active Treatment Phase. c Subjects who completed the study completed the Placebo-controlled Phase, the Active Treatment Phase, and the Observational Follow-up Phase.
2.3.2. Pharmacokinetics
In the pivotal Study BCT-002 (see Clinical efficacy section for study design), serial blood samples were collected from 14 subjects (7 Japanese and 7 non-Japanese) at Week 16 from pre-dose to 12 hours post-AM dose. Pharmacokinetic parameters were calculated based on the plasma concentration-time data from the 14 subjects and are presented in Table 1.
The pharmacokinetics (PK) of apremilast in subjects with BD is compared to the apremilast exposure in subjects with Psoriatic arthritis (PsA) or psoriasis (PSOR) receiving the same doses of 30 mg BID.
Table 1. Geometric Mean (Geometric CV%) Estimates of Apremilast Pharmacokinetic Parameters at Week 16 by Region (CC-10004-BCT-002)
APR 30 BID
Pharmacokinetic Parameter (unit)
Japanese (n = 7)
non-Japanese (n = 7)
Total (n = 14)
AUC0-t (ng•h/mL) 2071 (49.5) 3100 (29.6) 2534 (44.9)
AUC0-12 (ng•h/mL) 2076 (49.5) 3120 (30.0) 2545 (45.2)
Cmax (ng/mL) 374.2 (31.3) 380.9 (27.9) 377.6 (28.4)
Tmax (h)a 1.08 (1.00, 2.00) 2.00 (1.00, 3.00) 1.88 (1.00, 3.00)
t1/2 (h) 4.23 (26.9) 8.07 (64.8) 5.84 (59.9)
CL/F (L/h) 14.45 (49.5) 9.6 (30.0) 11.8 (45.2)
Vz/F (L) 88.3 (46.1) 112.0 (58.0) 99.4 (51.8)
AUC0-12 = area under the plasma concentration-time curve from time zero to 12 hours post-dose; AUC0-t = area under the plasma concentration-time curve from time zero to last quantifiable time point; CL/F = apparent clearance of drug from plasma after extravascular administration; Cmax = maximum observed plasma concentration, t1/2 = terminal phase elimination half-life; Tmax = time to maximum observed plasma concentration; Vz/F = apparent volume of distribution during the terminal phase. aMedian (range)
Absorption
Apremilast was rapidly absorbed with a median time to maximum plasma concentrations (Tmax) occurring approximately 1 to 2 hours after oral administration of apremilast 30 BID for both Japanese and non-Japanese subjects with BD.
Distribution
At steady-state, apremilast plasma concentrations declined with a geometric mean terminal elimination half-life (t½) of approximately 5.84 hours and a CL/F of 11.8 L/h. The geometric mean t½ and CL/F for Japanese subjects with BD were 4 hours and 14.45 L/h, respectively. Non-Japanese subjects had a geometric mean t½ of 8 hours and a CL/F of 9.6 L/h, demonstrating a faster elimination of apremilast in Japanese subjects.

Extension of indication variation assessment report EMA/135313/2020 Page 10/102
The PK of apremilast was previously characterized in Caucasian and Japanese subjects with moderate-to-severe plaque-type psoriasis (CC-10004-PSOR-011-PK). After 30 mg BID administration of apremilast, the overall exposure (AUC0-12) and Cmax in Japanese subjects with BD (2076 ng•h/mL and 374.2 ng/mL, respectively) was similar to the exposure and Cmax of apremilast in Japanese subjects with moderate-to-severe plaque-type psoriasis (2397 ng•h/mL and 374 ng/mL, respectively). Similarly, the overall exposure of apremilast in non-Japanese subjects with BD was comparable to Caucasian subjects with moderate-to-severe plaque-type psoriasis after receiving 30 mg BID apremilast.
Following multiple oral doses of APR 30 BID, overall exposure (AUC0-12 and AUC0-t) was approximately 33% lower for Japanese subjects with BD compared to non-Japanese subjects with BD, while Cmax was comparable between the two populations. The geometric CV% (inter-subject variability) of AUC0-12 and Cmax at steady state ranged from approximately 30% to 50%.
Apremilast steady-state exposure (AUC0-τ) was slightly less for Japanese subjects with BD when compared to non-Japanese subjects; however, the exposures are comparable to the exposures observed previously in Japanese subjects with moderate-to-severe plaque-type psoriasis.
The intersubject variability (CV%) of AUC ranged from 30% - 49.6%, indicating overlap of exposure between inflammatory disorders. The Cmax and Tmax of APR 30 BID was similar irrespective of indication and ethnicity.
Elimination
Elimination was not studied in BD patients; however, it is not expected to differ from subjects with PsA or psoriasis.
Dose proportionality and time dependencies
Dose proportionality and time dependencies were not further studied in BD patients; however, it is not expected to differ from subjects with PsA or psoriasis
Special populations
The PK of apremilast characterised in Caucasian and Japanese BD subjects is similar to the PK previously characterized in subjects with PsA and psoriasis
2.3.3. Pharmacodynamics
PD effects for apremilast were discussed in the psoriasis and psoriatic arthritis programme. Apremilast works intracellularly to modulate a network of pro-inflammatory and anti-inflammatory mediators. PDE4 is a cAMP-specific PDE and the dominant PDE in inflammatory cells. PDE4 inhibition elevates intracellular cAMP, which in turn down-regulates the inflammatory response by modulating the expression of TNF-α, IL-23, IL-17 and other inflammatory cytokines. Elevation of cAMP also modulates anti-inflammatory cytokines, such as IL-10, produced by endotoxin-stimulated mononuclear cells. A reduction in inducible nitric oxide synthase was also observed. An exploratory biomarker/leukocyte subtype and correlative study was performed in two subsets of patients with active BD from Study BCT-002 to assess the effect of apremilast on 6 plasma biomarkers and 3 leukocyte subtypes associated with inflammation and/or with biological plausibility for involvement in BD.
These subset subjects were from 11 centers in Japan and 26 centers in the rest of the world and provided a baseline and at least 1 postbaseline sample for biomarker and/or leukocyte subset analysis. This

Extension of indication variation assessment report EMA/135313/2020 Page 11/102
biomarker subset was composed of 54 subjects randomized to the placebo group and 62 subjects randomized to the apremilast group. The leukocyte subset was composed of 43 subjects randomized to the placebo group and 53 subjects randomized to the apremilast group.
Subjects in the biomarker and leukocyte subsets had demographic and disease characteristics and primary efficacy results as measured by the area under the curve for the number of oral ulcers from baseline through Week 12 (oral ulcer AUCW0-12) that were generally similar (no clinically important differences) to those of the 207 subjects in the ITT population.
Six plasma biomarkers and 3 leukocycte subsets associated with inflammation and/or with biological plausibility for a role in BD were analyzed to explore the PD effects of apremilast using immunoassays for interleukin (IL)-6, IL-8, IL-17A, IL-23, tumor necrosis factor alpha (TNF-α), and interferon gamma (IFN-y) (Myriad RBM) and quantitative polymerase chain reaction (PCR) assays for total T cells, type 17 T helper cells (Th17), and regulatory T cells (Treg) (Epiontis).
A rank analysis of covariance (Rank ANCOVA) on treatment differences (apremilast vs placebo) in the change (and percent change) from baseline for each biomarker/leukocyte subset was carried out over the 12 weeks of treatment using the last observation carried forward (LOCF) method. Biomarker/leukocyte subset-clinical response correlation at Week 12 (LOCF) within each treatment group was examined using a univariate regression model. A separate regression model was used to assess the interaction between treatment and the biomarker/leukocyte subset-clinical response correlation.
Biomarker/Leukocyte Subtype Changes from Baseline
Biomarker (IL-6, IL-8, IL-17A, IL-23, IFN-γ, and TNF- α) and leukocyte subtype (total T cells, Th17, and Treg) changes (and percent changes) from baseline at Weeks 4 and 12 (observed data) and Week 12 LOCF were summarized. Changes and percent changes from baseline at Week 12 LOCF were analyzed using a rank ANCOVA model.
Table 2. Biomarker Actual Values at Baseline (Observed Data) and Week 12 LOCF (Biomarker Subset)
Biomarker Statistic
Baseline Week 12 LOCF Placebo (N=54)
APR 30 BID (N=62)
Placebo (N=54)
APR 30 BID (N=62)
IL-6 (pg/mL) Mean (SD) 4.1 (6.51) 4.2 (5.10) 4.4 (8.15) 8.7 (46.65) Median 2.1 2.0 2.2 1.4 Q1, Q3 1.2, 3.7 1.0, 5.1 1.2, 4.4 1.0, 2.7 Min, Max 0, 44 0, 25 0, 57 0, 369 IL-8 (pg/mL) Mean (SD) 9.3 (4.69) 8.5 (1.80) 8.6 (1.59) 16.0 (53.65) Median 7.9 7.9 7.9 7.9 Q1, Q3 7.9, 9.3 7.9, 7.9 7.9, 8.1 7.9, 7.9 Min, Max 8, 41 8, 18 8, 14 8, 429 IL-17A (pg/mL)a
Mean (SD) 0.4 (0.48) 0.4 (0.37) 0.5 (0.49) 0.4 (0.25) Median 0.3 0.3 0.3 0.3 Q1, Q3 0.2, 0.5 0.2, 0.4 0.2, 0.6 0.2, 0.5 Min, Max 0, 3 0, 2 0, 3 0, 1 IL-23 (ng/mL) Mean (SD) 1.6 (0.29) 1.6 (0.28) 1.5 (0.07) 1.6 (0.18) Median 1.5 1.5 1.5 1.5 Q1, Q3 1.5, 1.5 1.5, 1.5 1.5, 1.5 1.5, 1.5

Extension of indication variation assessment report EMA/135313/2020 Page 12/102
Min, Max 2, 3 2, 3 2, 2 2, 3 IFN-γ (pg/mL) Mean (SD) 0.4 (0.42) 0.4 (0.66) 0.4 (0.54) 0.3 (0.63) Median 0.3 0.2 0.2 0.1 Q1, Q3 0.1, 0.4 0.1, 0.4 0.1, 0.4 0.1, 0.3 Min, Max 0, 2 0, 4 0, 3 0, 4 TNF-α (pg/mL) Mean (SD) 1.5 (0.46) 1.4 (0.83) 1.6 (0.57) 1.5 (0.97) Median 1.5 1.3 1.5 1.2 Q1, Q3 1.2, 1.9 1.1, 1.6 1.2, 1.8 1.0, 1.5 Min, Max 0, 3 1, 7 1, 4 1, 8
APR 30 BID = apremilast 30 mg twice daily\; IFN-γ = interferon gamma; IL-6 = interleukin-6; IL-8 = interleukin-8; IL-17A = interleukin-17A; IL-23 = interleukin-23; LOCF = last observation carried forward; Max = maximum; Min = minimum; N = number of subjects; Q1 = 25th percentile; Q3 = 75th percentile; SD = standard deviation; TNF-α = tumor necrosis factor alpha. a Only 61 of 62 subjects in the APR 30 BID group had IL-17A data.
Table 3. Leukocyte Subtype Actual Values at Baseline (Observed Data) and Week 12 LOCF (Leukocyte Subset)
Leukocyte Subtype Statistic
Baseline Week 12 LOCF Placebo (N=43)
APR 30 BID (N=53)
Placebo (N=43)
APR 30 BID (N=53)
Total T Cells (%) Mean (SD) 29.1 (8.42) 31.9 (8.75) 29.0 (8.69) 33.6 (8.99) Median 27.8 32.0 28.6 35.4 Q1, Q3 24.0, 35.0 27.2, 37.7 22.1, 34.4 28.1, 38.8 Min, Max 12, 49 13, 53 10, 47 7, 49 Th17 (%) Mean (SD) 1.5 (0.67) 1.5 (0.67) 1.5 (0.59) 1.7 (0.83) Median 1.4 1.4 1.4 1.6 Q1, Q3 1.0, 1.8 1.1, 1.7 1.0, 1.9 1.1, 2.0 Min, Max 1, 3 1, 4 0, 3 0, 4 Treg (%) Mean (SD) 1.3 (0.46) 1.4 (0.49) 1.4 (0.53) 1.5 (0.62) Median 1.3 1.4 1.3 1.4 Q1, Q3 1.0, 1.7 1.1, 1.8 1.1, 1.6 1.1, 1.9 Min, Max 1, 2 1, 2 1, 3 1, 4
APR 30 BID = apremilast 30 mg twice daily; LOCF = last observation carried forward; Max = maximum; Min = minimum; N = number of subjects; Q1 = 25th percentile; Q3 = 75th percentile; SD = standard deviation; Th17 = type 17 T helper cells; Treg = regulatory T cells.
Based on rank ANCOVA, apremilast treatment was associated with a significant increase in mean plasma levels of IFN-γ (mean percent change from baseline = 107.38%) compared with placebo (78.81%) at Week 12 LOCF (p = 0.0077). However, the median percent change from baseline was actually lower in the apremilast group (-19.17%) than in the placebo group (7.88%). The discrepancy between the results for mean and median percent changes from baseline was caused by individual outlier values in the apremilast group (maximum percent change from baseline was much higher in the apremilast group than in the placebo group). Also, the mean ± SE of percent change from baseline for the placebo group was contained entirely within the mean ± SE of the percent change from baseline for the apremilast group.

Extension of indication variation assessment report EMA/135313/2020 Page 13/102
At Week 12 LOCF, the mean percent change from baseline in TNF-α plasma levels was numerically lower in the apremilast group (2.90%) compared with the placebo group (7.07%), and the mean percent change from baseline in IL-17A plasma levels in the apremilast group (2.37%) was numerically lower compared with the placebo group (21.10%). However, neither of these differences was statistically significant.
Biomarker-Clinical Response Correlative Analyses (Week 12 LOCF)
Using a univariate regression model, two biomarkers (TNF-α and IL-8) had significant positive associations with efficacy in the apremilast group as measured by the oral ulcer AUCW0-12. The correlation of clinical efficacy with the percent change from baseline for TNF-α was high (regression coefficient = 0.90, p = 0.0140). The correlation of clinical efficacy with the percent change from baseline for IL-8 was low (regression coefficient = 0.04, p = 0.0333). However, the IL-8 dataset was confounded because 69.8% of the plasma samples had IL-8 levels that were below the limit of quantification (BLOQ). One leukocyte subtype (Treg) had a significant positive association with efficacy in the placebo group (regression coefficient = 0.94, p = 0.0182).
Th17 had a significant negative association with efficacy in the apremilast group (regression coefficient = -0.79, p = 0.0392).
In a regression model using treatment as a factor, of all the biomarkers and leukocyte subtypes examined, only Treg had a statistically significant interaction for treatment (p = 0.0069).

Extension of indication variation assessment report EMA/135313/2020 Page 14/102
Figure 1. Correlation of AUCW0-12 for Number of Oral Ulcers Versus Biomarker Percent Change From Baseline (Biomarker Subset)
IL-6
IL-8
IL-17A
IL-23
IFN-γ
TNF-α
30 mg BID = apremilast 30 mg BID group; AUCW0-12 = area under the curve through 12 weeks of treatment; IFN-γ = interferon gamma; IL = Interleukin; TNF-α = tumor necrosis factor alpha. Note: AUC is based on last observation carried forward (LOCF) approach and adjusted for the actual study duration by dividing the total AUC by total study duration (in days) and multiplying this quantity by 84 days.

Extension of indication variation assessment report EMA/135313/2020 Page 15/102
Figure 2. Correlation of AUCW0-12 for Number of Oral Ulcers Versus Leukocyte Subtype Percent Change From Baseline (Leukocyte Subset)
Total T Cells Th17 Treg
30 mg BID = apremilast 30 mg BID group; AUCW0-12 = area under the curve through 12 weeks of treatment; Th17 = type 17 T helper cells; Treg = regulatory T cells. Note: AUC is based on last observation carried forward (LOCF) approach and adjusted for the actual study duration by dividing the total AUC by total study duration (in days) and multiplying this quantity by 84 days.

Extension of indication variation assessment report EMA/135313/2020 Page 16/102
2.3.1. Discussion on clinical pharmacology
Apremilast (CC-10004), an oral small-molecule inhibitor of phosphodiesterase type 4 (PDE4), works intracellularly to modulate a network of proinflammatory and anti-inflammatory mediators. Phosphodiesterase 4 is a cyclic adenosine monophosphate (cAMP)-specific PDE and the dominant PDE in inflammatory cells. The PDE4 inhibition elevates intracellular cAMP levels, which in turn down-regulates the inflammatory response by modulating the expression of TNF-α, IL-23, IL-17, and other inflammatory cytokines. The pharmacologic profile of apremilast suggests a potential therapeutic benefit in the treatment of BD by a mechanism that involves restraining proinflammatory cytokine levels that occurs in active BD, through modulation of TNF-α, IL-2, IL-8, IL-12, IL-17, and IFN-γ production.
Pharmacokinetics:
The absorption, distribution, metabolism and elimination of apremilast have been already described and assessed in the initial MAA.
The PK of apremilast was also characterized in 14 subjects with BD (7 Japanese and 7 non-Japanese subjects) following multiple oral doses of APR 30 BID at Week 16. Following multiple oral doses of APR 30 BID, overall exposure (AUC0-12 and AUC0-t) was approximately 33% lower for Japanese subjects with BD compared to non-Japanese subjects with BD, while Cmax was comparable between the two populations. The geometric CV% (inter-subject variability) of AUC0-12 and Cmax at steady state ranged from approximately 30% to 50%. Apremilast steady-state exposure (AUC0-τ) was slightly less for Japanese subjects with BD when compared to non-Japanese subjects; however, the exposures are comparable to the exposures observed previously in Japanese subjects with moderate-to-severe plaque-type psoriasis
The PK of apremilast in BD subjects is similar to the PK previously characterised in subjects with PsA and psoriasis.
Pharmacodynamics
In the exploratory biomarker study conducted in study BCT-002, the biomarker subset (116 subjects) and the leukocyte subset (96 subjects) were found similar to the overall ITT population in terms of demographics, baseline BD characteristics, and primary efficacy results. Although there were no clear significant changes in plasma cytokines levels between the treatment groups, the TNF-α and IL-17A plasma levels had numerically lower mean percent changes from baseline in the apremilast group compared with the placebo group at Week 12 LOCF. For TNF-α, this is consistent with the significant correlation between the percent change from baseline in TNF-α with clinical efficacy (oral ulcer AUCW0-12) in the apremilast group.
2.3.2. Conclusions on clinical pharmacology
The clinical pharmacology as the PK and PD effects appear to be similar in BD and PSA or Psoriasis populations. Overall, the description of the pharmacokinetic and pharmacodynamic profile of apremilast in subjects with BD is acceptable by CHMP.

Extension of indication variation assessment report EMA/135313/2020 Page 17/102
2.4. Clinical efficacy
2.4.1. Dose response study
There was no formal dose response study conducted.
2.4.2. Main studies
Phase 3 Study CC-10004-BCT-002
Methods
Study BCT-002 was a multicentre, randomised, double blind, placebo-controlled, parallel-group study (12 weeks), followed by an Active Treatment Phase (52 weeks) and 4 weeks of follow-up (Table 4. ).
Table 4. Study Design Through Week 68
BID = twice daily.
Study participants
Approximately 204 subjects with BD were to be enrolled, with 1:1 randomization for approximately 102 subjects in the APR 30 BID treatment group and 102 subjects in the placebo treatment group. Approximately 45 sites were planned to be included in this study. This study was to include sites in North America, Europe, and Asia. Subjects were stratified by gender, history of uveitis, and region (Japan and non-Japan).
Key inclusion criteria
Subjects were to be enrolled into this study if they met the following conditions:
• Male or female ≥ 18 years of age.
Extension of indication variation assessment report EMA/135313/2020 Page 18/102
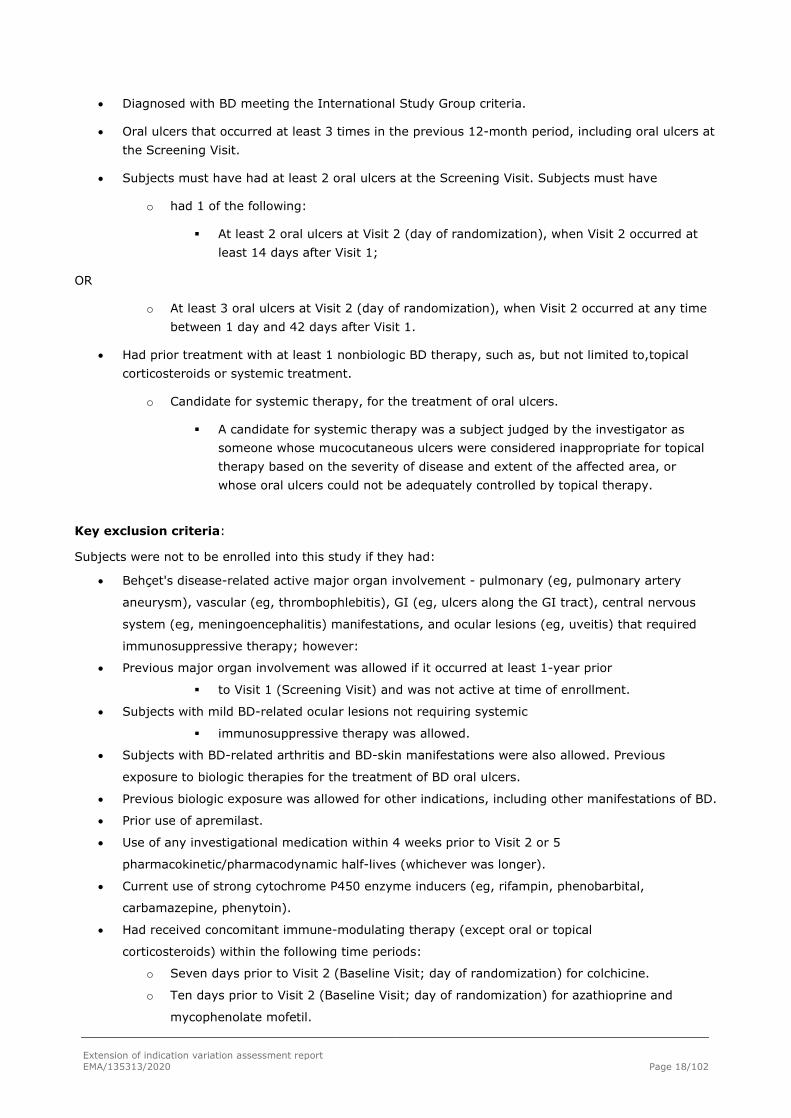
• Diagnosed with BD meeting the International Study Group criteria.
• Oral ulcers that occurred at least 3 times in the previous 12-month period, including oral ulcers at the Screening Visit.
• Subjects must have had at least 2 oral ulcers at the Screening Visit. Subjects must have
o had 1 of the following:
At least 2 oral ulcers at Visit 2 (day of randomization), when Visit 2 occurred at least 14 days after Visit 1;
OR
o At least 3 oral ulcers at Visit 2 (day of randomization), when Visit 2 occurred at any time between 1 day and 42 days after Visit 1.
• Had prior treatment with at least 1 nonbiologic BD therapy, such as, but not limited to, topical corticosteroids or systemic treatment.
o Candidate for systemic therapy, for the treatment of oral ulcers.
A candidate for systemic therapy was a subject judged by the investigator as someone whose mucocutaneous ulcers were considered inappropriate for topical therapy based on the severity of disease and extent of the affected area, or whose oral ulcers could not be adequately controlled by topical therapy.
Key exclusion criteria:
Subjects were not to be enrolled into this study if they had:
• Behçet's disease-related active major organ involvement - pulmonary (eg, pulmonary artery
aneurysm), vascular (eg, thrombophlebitis), GI (eg, ulcers along the GI tract), central nervous
system (eg, meningoencephalitis) manifestations, and ocular lesions (eg, uveitis) that required
immunosuppressive therapy; however:
• Previous major organ involvement was allowed if it occurred at least 1-year prior
to Visit 1 (Screening Visit) and was not active at time of enrollment.
• Subjects with mild BD-related ocular lesions not requiring systemic
immunosuppressive therapy was allowed.
• Subjects with BD-related arthritis and BD-skin manifestations were also allowed. Previous
exposure to biologic therapies for the treatment of BD oral ulcers.
• Previous biologic exposure was allowed for other indications, including other manifestations of BD.
• Prior use of apremilast.
• Use of any investigational medication within 4 weeks prior to Visit 2 or 5
pharmacokinetic/pharmacodynamic half-lives (whichever was longer).
• Current use of strong cytochrome P450 enzyme inducers (eg, rifampin, phenobarbital,
carbamazepine, phenytoin).
• Had received concomitant immune-modulating therapy (except oral or topical
corticosteroids) within the following time periods:
o Seven days prior to Visit 2 (Baseline Visit; day of randomization) for colchicine.
o Ten days prior to Visit 2 (Baseline Visit; day of randomization) for azathioprine and
mycophenolate mofetil.

Extension of indication variation assessment report EMA/135313/2020 Page 19/102
o Four weeks (28 days) prior to Visit 2 (Baseline Visit; day of randomization) for
cyclosporine, methotrexate, cyclophosphamide, thalidomide, and dapsone.
o At least 5 terminal half-lives for all biologics
• Had received intra articular or parenteral corticosteroids within 6 weeks (42 days) prior to Visit 2
(Baseline Visit; day of randomization).
Treatments
Apremilast was supplied for oral administration in tablets containing 10, 20, or 30 mg active ingredient.
Placebo tablets were provided as appearing identical to apremilast 10, 20, or 30 mg tablets.
Patients received assigned treatment (placebo or apremilast) BID.
Topical corticosteroids were prohibited for ulcers and skin disease during the first 12-week Placebo
controlled Treatment Phase of the study (through Visit 9 [Week 12]).
Use of colchicine was prohibited during the 12-week Placebo-controlled Treatment Phase of the study
(through Visit 9 [Week 12]).
Systemic therapy other than colchicine, including, but not limited to, systemic corticosteroids (including
low doses), cyclosporine, methotrexate, cyclophosphamide, hydroxychloroquine, thalidomide, dapsone,
AZT, and mycophenolate mofetil, were prohibited for the treatment phases of the study.
Biologic agents, including, but not limited to, adalimumab, infliximab, etanercept, and rituximab, were prohibited for the treatment phases of the study.
Objectives
Primary Objective
The primary objective of the study was to evaluate the efficacy of apremilast in the treatment of
oral ulcers in active BD.
Secondary Objectives
The secondary objectives of the study were:
• To evaluate the efficacy of apremilast in subjects with active BD.
• To evaluate the effect of apremilast on patient-reported outcomes (PROs) in subjects with active
BD.
Safety Objective
The safety objective of the study was to evaluate the safety and tolerability of apremilast in
subjects with active BD.
Exploratory Pharmacokinetic/Pharmacodynamic Objectives
The exploratory PK/PD objectives of the study were:
• To characterize the PK of apremilast in subjects with active BD.
• To evaluate the effect of apremilast on inflammatory biomarkers and leukocyte subsets
associated with active BD.

Extension of indication variation assessment report EMA/135313/2020 Page 20/102
Exploratory Pharmacogenetic Objective
The exploratory pharmacogenetic objective of the study was to evaluate pharmacogenetic
markers associated with clinical and PD interaction with apremilast in subjects with active BD.
Exploratory Objective
The exploratory objective of the study was to evaluate the effect of apremilast on disease activity in
subjects with active BD.
Outcomes/endpoints
Primary Efficacy Endpoint
• Area under the curve for the number of oral ulcers from baseline through Week 12 (AUCW0-12).
Secondary Efficacy Endpoints (key secondary endpoints)
• Complete response rate for oral ulcers at Week 12.
o A complete response was defined as the proportion of subjects who were oral
ulcer-free.
• Change from baseline in the pain of oral ulcers as measured by visual analog scale (VAS) at Week
12.
• Complete response rate for genital ulcers at Week 12 for subjects who had genital ulcers at
baseline.
o A complete response was defined as the proportion of subjects who were genital
ulcer-free.
• Change from baseline in the pain of genital ulcers, as measured by VAS at Week 12 in subjects
who had genital ulcers at baseline.
• Change from baseline in disease activity as measured by Behçet’s disease Current Activity Scores
(BD Current Activity Form [BDCAF]) at Week 12.
• Change from baseline in the BD QoL score at Week 12.
• Change from baseline in Behçet’s Syndrome Activity Score (BSAS) at Week 12.
Additional endpoints included Safety, exploratory PK/PD and Pharmacogenetic endpoints.
Sample size
The sample size estimation was based on the consideration from the results of the Phase 2 study CC-
10004-BCT-001. A two-sided t-test at a 0.05 significance level would have 90% power to detect a
treatment difference of 66 in the AUC of oral ulcer counts from Day 1 through Week 12 (AUC of placebo –
drug 66), the primary efficacy endpoint, when the sample size in each group is 102, assuming a common
standard deviation of 144.

Extension of indication variation assessment report EMA/135313/2020 Page 21/102
Randomisation
At the day of randomization (Visit 2/Baseline Visit), subjects who met study entry criteria were randomized using a permuted block randomization in parallel 1:1 to receive either APR 30 BID or placebo, using a centralized interactive response technology (IRT). Eligible subjects were stratified according to gender, history of uveitis, and region (Japan and non-Japan).
Blinding (masking)
For dose titration, 10-mg, 20-mg, and 30-mg apremilast tablets (or identically appearing placebo tablets) were dispensed in dose titration cards at Week 0.
During Weeks 12 to 64, the investigational product was to remain blinded, to prevent study site personnel and subjects from knowing the assignment in the Placebo-controlled Treatment Phase. To maintain the blind regarding the initial treatment assignment, all subjects received dose titration cards at Visit 9 (Week 12). Although only subjects originally randomized to placebo were dose titrated during their first week of the Active Treatment Phase, all subjects entering the Active Treatment Phase received identically appearing titration/treatment cards to retain the blinding.
Blinding to treatment assignment was maintained at all study sites prior to the Week 68 database lock.
Statistical methods
All efficacy analyses are performed on the ITT population. In addition, analysis using the PP population
are provided for the primary efficacy endpoint.
Efficacy results are to be considered statistically significant after consideration of the control of
Multiplicity. All statistical tests are conducted at the α = 0.05 (2-sided) level, and 2-sided p-values and
CIs are reported.
Multiplicity
Statistical tests for comparing the APR 30 BID and placebo groups are conducted for the primary endpoint and other efficacy endpoints. The multiplicity of the analyses of the primary and other efficacy endpoints are adjusted using a Gate-Keeping Procedure to preserve the Family Wise Error Rate of the multiple analyses. The analyses were performed in sequence until one of the analyses has failed to show the significant difference or all analyses are completed at a significance level of 0.05.
Primary Analysis for Primary Efficacy Endpoint
The primary efficacy endpoint is the AUC for the number of oral ulcers from Day 1 through Week 12. It is compared between the placebo and APR 30 BID groups using an analysis of covariance (ANCOVA) model with the AUC as the response variable, the treatment, gender and region as factors, and the number of oral ulcers at baseline as a covariate. Multiple imputation method is used to impute missing oral ulcer counts when the AUC is derived.
Sensitivity analyses including missing data imputations are conducted for the primary efficacy endpoint to
assess the robustness of the primary analysis.
Analysis for Secondary Efficacy and Exploratory Endpoints

Extension of indication variation assessment report EMA/135313/2020 Page 22/102
Secondary efficacy endpoints and exploratory endpoints are summarized and analysed similarly to that
described for the primary efficacy endpoint. For continuous endpoints, such as change from baseline in
the pain VAS, descriptive statistics (N, mean, median, standard deviation, quartiles, minimum and
maximum) are provided by treatment group at specified visits per study phase. The endpoints at Week
12 are also compared between the placebo and APR 30 BID groups using a similar ANCOVA mode.
The proportions of subjects who achieve a response at Week 12 between the APR 30 BID and placebo
groups are compared using the Cochran-Mantel-Haenszel (CMH) test at the 0.05 level, controlling for
stratification factors as specified in the SAP, using the ITT population.
Subjects who have discontinued early prior to Week 12, or who do not have data at Week 12, are
regarded as non-responders at Week 12.
Table 5. Rank of the Endpoints (Including Primary Efficacy Endpoint) in the Hierarchy of Multiplicity Adjustment
Endpoints Rank of Endpoints in Multiple Testing
AUC for the number of oral ulcers from baseline through Week 12 1
Change from baseline in the pain of oral ulcers as measured by VAS at Week 12 2 Change from baseline in Behçet’s Syndrome Activity Score (BSAS) at Week 12 3 Change from baseline in disease activity as measured by Behçet’s Disease Current Activity scores (BD Current Activity Form) at Week 12
4
Proportion of subjects achieving an oral ulcer complete response (oral ulcer-free) by Week 6, after start of dosing, and who remain oral ulcer free for at least 6 additional weeks during the 12-week Placebo-controlled Treatment Phase
5
Time to oral ulcer resolution (complete response), ie, the first instance when a subject has a complete response, during the Placebo-controlled Treatment Phase
6
Complete response rate for oral ulcers at Week 12 7
Change from baseline in the BD QoL score at Week 12 8 Complete response rate for genital ulcers at Week 12 for subjects who had genital ulcers at baseline
9
Proportion of subjects with no oral ulcers following complete response, ie, the first time when a subject has a complete response, during the Placebo- controlled Treatment Phase
10
Time to recurrence of oral ulcers following loss of complete response, ie, the first instance when a subject has a reappearance of oral ulcers following a complete response, during the Placebo-controlled Treatment Phase
11
Number of oral ulcers following loss of complete response, ie, the first instance when a subject has a reappearance of oral ulcers following a complete response, during the Placebo-controlled Treatment Phase
12
Change from baseline in the total score of the Static Physician’s Global Assessment (PGA) of skin lesions (acne-like lesions, folliculitis and erythema nodosum) of BD at Week 12 in subjects who had BD skin lesions at baseline
13
Change from baseline in the pain of genital ulcers as measured by VAS at Week 12 in subjects who had genital ulcers at baseline
14
Efficacy Evaluation for the Active Treatment Phase

Extension of indication variation assessment report EMA/135313/2020 Page 23/102
For continuous endpoints, descriptive statistics (N, mean, median, standard deviation, quartiles, minimum and maximum) are provided by treatment group at specified visits per study phase.
Frequency count and percentage will be provided for categorical variables.
Subgroup Analyses
Subgroup analyses for the primary efficacy endpoint based upon baseline demographics (eg, age, sex, race), baseline disease characteristics (eg, prior use of colchicine, duration of BD disease), and region (eg, Japan, Europe, North America) were performed to determine the clinical responsiveness of subpopulations and the robustness of the treatment effect.
Handling of Dropouts or Missing Data
Missing data were imputed using MI, LOCF, or NRI, as follows:
• An MI procedure was used to impute missing oral ulcer counts for the primary efficacy endpoint
on study visits from Day 1 through Week 12 when deriving the AUC for the number of oral ulcers.
The procedure replaces each missing value with a set of plausible values, generating multiple
complete datasets.
• The LOCF approach was used to impute the missing assessment at Week 12 for the primary
endpoints, exploratory endpoints, and the following secondary endpoints: pain VAS of oral ulcers,
pain VAS of genital ulcers, BDCAF Scores, BD QoL, and BSAS.
• The NRI approach was used for some analyses of categorical secondary efficacy endpoints.
Subjects with missing data at Week 12, including subjects who discontinued early prior to Week
12 or who did not have data at Week 12, were classified as nonresponders. This method was used
for binary efficacy endpoints unless otherwise specified; subjects who had insufficient data for
response determination for the time point under consideration were considered nonresponders for
that time point.
Results
Participant flow
A total of 207 subjects were randomized 1:1 to receive either APR 30 BID (104 subjects) or identically appearing placebo tablets BID (103 subjects) for the 12-week Placebo-controlled Treatment Phase.
A total of 179 subjects (86.5%) completed the Placebo-controlled Treatment Phase. A higher proportion
of subjects in the APR 30 BID treatment group compared with the placebo treatment group completed the
Placebo-controlled Treatment Phase (92.3% versus 80.6%, respectively). The most frequently cited
reasons for study discontinuation in the APR 30 BID treatment group and the placebo treatment group
were subject withdrawal (3.8% and 4.9%, respectively), AEs (2.9% and 3.9%, respectively), and lack of
efficacy (0% and 7.8%, respectively).
The majority (178/179) of subjects who completed the Placebo-controlled Treatment Phase entered the
Active Treatment Phase. Of the 178 subjects who entered the Active Treatment Phase, 143 subjects
(80.3%) completed Week 64 (APR 30 BID: 75/95 subjects [78.9%]; placebo: 68/83 subjects [81.9%]).
The most frequently cited reasons for study discontinuation were subject withdrawal (7.4% and 8.4%,
respectively), AEs (9.5% and 4.8%, respectively), and lack of efficacy (2.1% and 2.4%, respectively).

Extension of indication variation assessment report EMA/135313/2020 Page 24/102
Figure 3. Subject Disposition
APR 30 BID = apremilast 30 mg twice daily aThe Placebo-controlled Treatment Phase encompassed data for Week 0 to Week 12. bThe Active Treatment Phase encompassed data for Week 12 to Week 64. cCompleted study includes subjects who completed both the Active Treatment Phase and the Posttreatment Observational Follow-up Phase dIncludes all subjects who completed the Active Treatment Phase, as well as all subjects who discontinued for any reason during the study.
Recruitment
The study was conducted in Europe (France, Germany, Greece and Italy), Japan, Republic of Korea, USA, Israel, Lebanon and Turkey.
The study period was from 16 December 2014 (first patient enrolled) to 04 September 2018 (last patient completed).
Conduct of the study
Amendments to the protocol
The original Protocol version was amended three times after recruitment of subjects had already started.
The first amendment (02 Feb 2016) mainly concerned precision of pre-defined exclusion criteria (eligibility to subjects previously exposed to biologic therapy was extended, subjects were allowed to receive colchicine until 7 days prior to randomization, tapering of oral and topical corticosteroids and subsequent discontinuation close to the day of randomization was allowed).
Extension of indication variation assessment report EMA/135313/2020 Page 25/102
The second amendment (country-specific, Japan, 02 Feb 2016) was intended to update the requirement for hepatitis testing (to be left now to the investigator’s discretion).
The third amendment (country-specific, Germany, 05 Jul 2017) intended to give subjects the opportunity to enter an optional Open-label Extension Phase after the 52-week Active Treatment Phase.
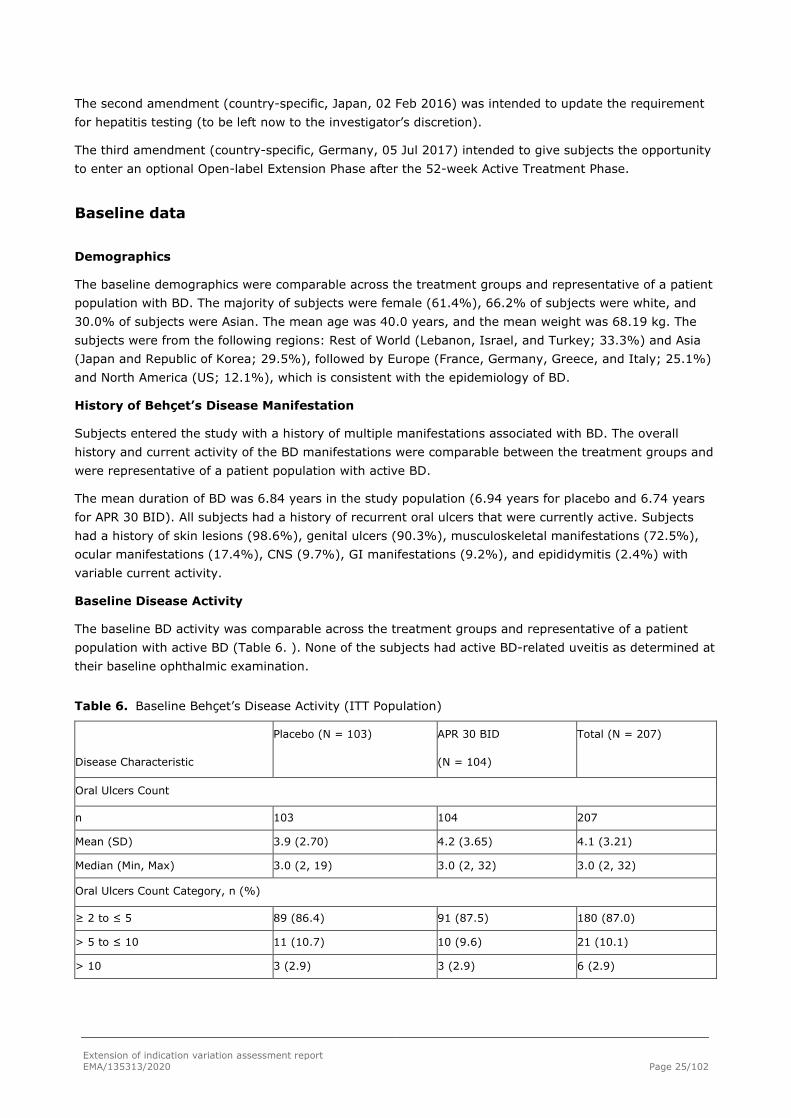
Baseline data
Demographics
The baseline demographics were comparable across the treatment groups and representative of a patient population with BD. The majority of subjects were female (61.4%), 66.2% of subjects were white, and 30.0% of subjects were Asian. The mean age was 40.0 years, and the mean weight was 68.19 kg. The subjects were from the following regions: Rest of World (Lebanon, Israel, and Turkey; 33.3%) and Asia (Japan and Republic of Korea; 29.5%), followed by Europe (France, Germany, Greece, and Italy; 25.1%) and North America (US; 12.1%), which is consistent with the epidemiology of BD.
History of Behçet’s Disease Manifestation
Subjects entered the study with a history of multiple manifestations associated with BD. The overall history and current activity of the BD manifestations were comparable between the treatment groups and were representative of a patient population with active BD.
The mean duration of BD was 6.84 years in the study population (6.94 years for placebo and 6.74 years for APR 30 BID). All subjects had a history of recurrent oral ulcers that were currently active. Subjects had a history of skin lesions (98.6%), genital ulcers (90.3%), musculoskeletal manifestations (72.5%), ocular manifestations (17.4%), CNS (9.7%), GI manifestations (9.2%), and epididymitis (2.4%) with variable current activity.
Baseline Disease Activity
The baseline BD activity was comparable across the treatment groups and representative of a patient population with active BD (Table 6. ). None of the subjects had active BD-related uveitis as determined at their baseline ophthalmic examination.
Table 6. Baseline Behçet’s Disease Activity (ITT Population)
Disease Characteristic
Placebo (N = 103) APR 30 BID
(N = 104)
Total (N = 207)
Oral Ulcers Count
n 103 104 207
Mean (SD) 3.9 (2.70) 4.2 (3.65) 4.1 (3.21)
Median (Min, Max) 3.0 (2, 19) 3.0 (2, 32) 3.0 (2, 32)
Oral Ulcers Count Category, n (%)
≥ 2 to ≤ 5 89 (86.4) 91 (87.5) 180 (87.0)
> 5 to ≤ 10 11 (10.7) 10 (9.6) 21 (10.1)
> 10 3 (2.9) 3 (2.9) 6 (2.9)

Extension of indication variation assessment report EMA/135313/2020 Page 26/102
Pain of Oral Ulcers in VAS
n 102 103 205
Mean (SD) 60.8 (26.92) 61.2 (27.55) 61.0 (27.17)
Median (Min, Max) 64.5 (1, 100) 67.0 (0, 100) 66.0 (0, 100)
Genital Ulcers Count (Non-zero)
n 17 17 34
Mean (SD) 2.6 (2.00) 2.9 (2.91) 2.8 (2.46)
Median (Min, Max) 2.0 (1, 7) 2.0 (1, 13) 2.0 (1, 13)
Pain of Genital Ulcers in VAS (Non-zero)
n 24 22 46
Mean (SD) 64.0 (27.60) 64.4 (27.74) 64.2 (27.36)
Median (Min, Max) 65.5 (2, 100) 72.0 (6, 97) 68.5 (2, 100)
BD Current Activity Index Score
n 102 104 206
Mean (SD) 3.6 (1.67) 3.7 (1.58) 3.7 (1.62)
Median (Min, Max) 4.0 (1, 9) 4.0 (1, 7) 4.0 (1.9)
BD QoL
n 103 104 207
Mean (SD) 11.24 (8.157) 10.22 (8.245) 10.73 (8.197)
Median (Min, Max) 12.00 (0.0, 29.0) 8.00 (0.0, 28.0) 10.00 (0.0, 29.0)
BSAS
n 103 104 207
Mean (SD) 44.30 (16.862) 42.75 (16.224) 43.52 (16.523)
Median (Min, Max) 43.00 (9.0, 90.0) 41.00 (8.0, 81.5) 42.00 (8.0, 90.0)
Total Score of PGA of BD Skin Lesions (Non-zero)
n 59 58 117
Mean (SD) 1.8 (0.95) 2.0 (0.94) 1.9 (0.95)
Median (Min, Max) 2.0 (1, 6) 2.0 (1, 4) 2.0 (1, 6)
Tender Joints Count (Non-zero)
n 50 44 94
Mean (SD) 5.96 (7.952) 6.55 (8.459) 6.24 (8.154)
Median (Min, Max) 3.00 (1.0, 38.1) 4.00 (1.0, 44.0) 3.00 (1.0, 44.0)
Swollen Joints Count (Non-zero)
n 15 17 32
Mean (SD) 5.67 (7.098) 3.35 (3.061) 4.44 (5.382)
Median (Min, Max) 2.00 (1.0, 24.0) 3.00 (1.0, 14.0) 2.00 (1.0, 24.0)

Extension of indication variation assessment report EMA/135313/2020 Page 27/102
Presence of Behçet’s Disease-related Uveitis From Ophthalmologic Examination, n (%)
Yes 0 0 0
No 101 (98.1) 103 (99.0) 204 (98.6)
Missing 2 (1.9) 1 (1.0) 3 (1.4)
APR 30 BID = apremilast 30 mg twice daily; BD = Behçet’s disease; BD QoL = Behçet’s disease quality of life questionnaire; BSAS = Behçet’s Syndrome Activity Score; ITT = intent-to-treat; Max = maximum; Min = minimum; PGA = Physician’s Global Assessment; SD = standard deviation; VAS = visual analog scale.
Prior Use of Behçet’s Disease-related Therapies
Within 30 days prior to screening, a total of 52.7% of subjects had used colchicine, 15.5% had used oral corticosteroids, 14.0% had used topical corticosteroids, and 13.5% had used immunosuppressants (Table 7. ). The prior use of BD-related therapies was comparable between the treatment groups and consistent with the treatment paradigm of BD. A total of 2.4% of subjects had previously been treated with biologic therapy for other indications, including other manifestations of Behçet’s disease.
Table 7. Prior Behçet’s Disease Medications (ITT Population)
Disease Characteristic
Placebo (N = 103)
n (%)
APR 30 BID (N = 104)
n (%)
Total (N = 207)
n (%) Prior Use of Immunosuppressants
Yes 14 (13.6) 14 (13.5) 28 (13.5)
No 89 (86.4) 90 (86.5) 179 (86.5)
Prior Use of Colchicinea
Yes 57 (55.3) 52 (50.0) 109 (52.7)
No 46 (44.7) 52 (50.0) 98 (47.3)
Prior Use of Oral Corticosteroids
Yes 15 (14.6) 17 (16.3) 32 (15.5)
No 88 (85.4) 87 (83.7) 175 (84.5)
Prior Use of Topical Corticosteroids
Yes 16 (15.5) 13 (12.5) 29 (14.0)
No 87 (84.5) 91 (87.5) 178 (86.0)
Prior Use of Biologicsb
Yes 3 (2.9) 2 (1.9) 5 (2.4)
No 100 (97.1) 102 (98.1) 202 (97.6)
Prior Use of NSAIDs
Yes 42 (40.8) 27 (26.0) 69 (33.3)
No 61 (59.2) 77 (74.0) 138 (66.7)
Prior Use of Analgesics/Anesthetics (Different From NSAIDs)
Yes 21 (20.4) 16 (15.4) 37 (17.9)
No 82 (79.6) 88 (84.6) 170 (82.1)
Extension of indication variation assessment report EMA/135313/2020 Page 28/102
aOne subject in the placebo group who took Colchimax was included in the analysis for the prior use of colchicine
bPrevious biologic therapy exposure was allowed for other indications, including other manifestations of behcet’s disease
Concomitant Medication Use in the Placebo-controlled Period
Overall, 82.7% of subjects in the APR 30 BID treatment group and 83.5% of subjects in the placebo treatment group reported concomitant medication use during the Placebo-controlled Period). The most common classes of concomitant medications were related to the nervous system, alimentary tract and metabolism, musculoskeletal system, and anti-infectives for systemic use. The most commonly used concomitant medication was paracetamol in both the APR 30 BID treatment group (20.2% of subjects) and the placebo treatment group (16.5% of subjects); all other concomitant medications were reported for fewer than 10% of subjects.
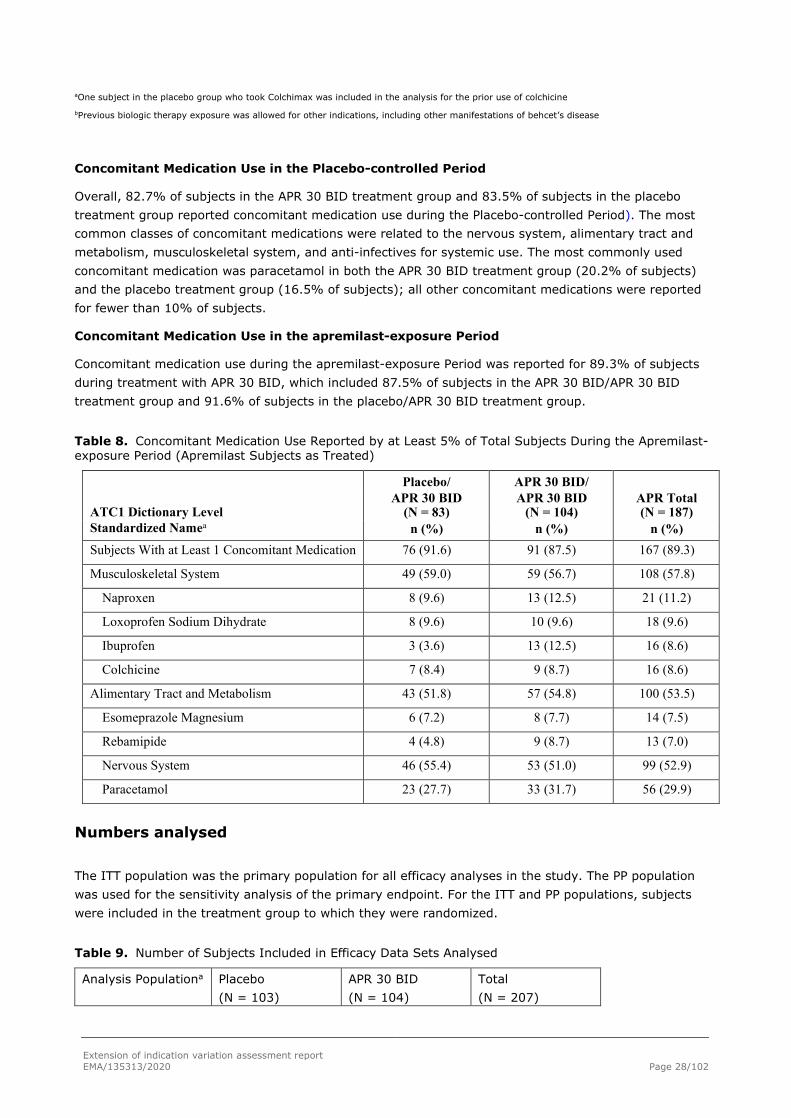
Concomitant Medication Use in the apremilast-exposure Period
Concomitant medication use during the apremilast-exposure Period was reported for 89.3% of subjects during treatment with APR 30 BID, which included 87.5% of subjects in the APR 30 BID/APR 30 BID treatment group and 91.6% of subjects in the placebo/APR 30 BID treatment group.
Table 8. Concomitant Medication Use Reported by at Least 5% of Total Subjects During the Apremilast-exposure Period (Apremilast Subjects as Treated)
Placebo/ APR 30 BID/ ATC1 Dictionary Level
APR 30 BID (N = 83)
APR 30 BID (N = 104)
APR Total (N = 187)
Standardized Namea n (%) n (%) n (%) Subjects With at Least 1 Concomitant Medication 76 (91.6) 91 (87.5) 167 (89.3)
Musculoskeletal System 49 (59.0) 59 (56.7) 108 (57.8)
Naproxen 8 (9.6) 13 (12.5) 21 (11.2)
Loxoprofen Sodium Dihydrate 8 (9.6) 10 (9.6) 18 (9.6)
Ibuprofen 3 (3.6) 13 (12.5) 16 (8.6)
Colchicine 7 (8.4) 9 (8.7) 16 (8.6)
Alimentary Tract and Metabolism 43 (51.8) 57 (54.8) 100 (53.5)
Esomeprazole Magnesium 6 (7.2) 8 (7.7) 14 (7.5)
Rebamipide 4 (4.8) 9 (8.7) 13 (7.0)
Nervous System 46 (55.4) 53 (51.0) 99 (52.9)
Paracetamol 23 (27.7) 33 (31.7) 56 (29.9)
Numbers analysed
The ITT population was the primary population for all efficacy analyses in the study. The PP population was used for the sensitivity analysis of the primary endpoint. For the ITT and PP populations, subjects were included in the treatment group to which they were randomized.
Table 9. Number of Subjects Included in Efficacy Data Sets Analysed
Analysis Populationa Placebo (N = 103)
APR 30 BID (N = 104)
Total (N = 207)

Extension of indication variation assessment report EMA/135313/2020 Page 29/102
n (%) n (%) n (%) ITT populationb 103 (100.0) 104 (100.0) 207 (100.0) PP Populationc 96 (93.2) 99 (95.2) 195 (94.2)
APR 30 BID = apremilast 30 mg twice daily; IP = investigational product; ITT = intent-to-treat; PP = per protocol. a The percentages for analysis population summaries were based on randomized subjects. b The ITT population was defined as all randomized subjects who received at least 1 dose of IP. Subjects were included in the treatment group to which they were originally randomized. c The PP population was defined as all randomized subjects who received at least 1 dose of IP, had a baseline and at least 1 postbaseline oral ulcer evaluation, and had no major protocol violations during the 12-week Placebo-controlled Treatment Phase
Protocol Deviations During the Study
The most frequently reported protocol deviations were related to laboratory tests/assessments, visit scheduling, IP issues/IP compliance, and informed consent issues (eg, subjects did not sign the most current version of the ICF).
Table 10. Protocol Violations and Deviations Through Week 12 (ITT Population)
Category Type
Placebo (N = 103) n (%)
APR 30 BID (N = 104) n (%)
Total (N = 207) n (%)
Subjects With at Least 1 Protocol Violation
8 (7.8) 4 (3.8) 12 (5.8)
Inclusion/Exclusion Criteria 2 (1.9) 3 (2.9) 5 (2.4)
IP Issues/IP Compliance 2 (1.9) 1 (1.0) 3 (1.4)
Concomitant Medication 2 (1.9) 0 2 (1.0)
Safety Reporting 2 (1.9) 0 2 (1.0)
Other 1 (1.0) 0 1 (0.5)
Subjects With at Least 1 Protocol Deviation
88 (85.4) 79 (76.0) 167 (80.7)
Laboratory Tests/Procedures 67 (65.0) 56 (53.8) 123 (59.4)
Visit Schedule 31 (30.1) 33 (31.7) 64 (30.9)
IP Issues/IP Compliance 35 (34.0) 23 (22.1) 58 (28.0)
Informed Consent Issues 12 (11.7) 14 (13.5) 26 (12.6)
Concomitant Medication 8 (7.8) 9 (8.7) 17 (8.2)
Inclusion/Exclusion Criteria 4 (3.9) 4 (3.8) 8 (3.9)
Other 2 (1.9) 3 (2.9) 5 (2.4)
APR 30 BID = apremilast 30 mg twice daily; IP = investigational product; ITT = intent to treat. Note: Each subject was counted once for each applicable specific violation or deviation. A subject with multiple violations or deviations within a type was counted once for that type. Violation or deviation types were sorted in descending order of frequency of the total column (then the APR 30 BID and placebo treatment groups, as applicable).
Active Treatment Phase
During the study from Week 12 through Week 68, at least 1 protocol violation was reported for 3 of 178 subjects (1.7%) who entered the Active Treatment Phase; these were related to safety reporting for 3 subjects in the placebo/APR 30 BID treatment group and were related to delays in serious adverse event reporting (2 subjects) and to pregnancy reporting (1 subject).

Extension of indication variation assessment report EMA/135313/2020 Page 30/102
At least 1 protocol deviation was reported for 125 subjects (70.2%).
The most frequently reported protocol deviations were related to laboratory tests/procedures (42.7%; e.g., missed assessments for safety, sub studies, and efficacy; incorrect timing of sample collections or shipments; and the visit schedule (41.6%; e.g., visits performed out of window). Deviations related to IP issues/IP compliance were reported for a greater proportion of subjects in the APR 30 BID/APR 30 BID treatment group (32 subjects [33.7%]) than in the placebo/APR 30 BID treatment group (16 subjects [19.3%]). These were mostly related to poor compliance with dosing instructions, and any difference between the groups appears to have been due to chance.
Exclusion of Subjects From Per-protocol Population Due to Protocol Violations
During the Placebo-controlled Treatment Phase, 12 subjects were excluded from the PP population, including 5 subjects in the APR 30 BID treatment group and 7 subjects in the placebo treatment group.
The general categories were not meeting inclusion criteria (3 APR 30 mg BID, 2 placebo), concomitant procedure (1 Placebo patient had oral ulcers cauterized), poor compliance (2 placebo patients, 1 APR 30 BID), use of prohibited concomitant medication (2 placebo patients) and missing post-baseline oral ulcer assessment (1 placebo patient, 1 APR 30 BID patient).
Outcomes and estimation
Primary Efficacy Endpoint - AUC(W0-12) for Number of Oral Ulcers
The primary efficacy endpoint in this study was AUCW0-12 for oral ulcer counts (Table 11. ). There was a statistically significantly lower AUCW0-12 for the number of oral ulcers in the APR 30 BID treatment group compared with the placebo treatment group, as evaluated using the primary analysis method (ie, MI to impute missing oral ulcer counts) (p < 0.0001). At Week 12, the LS mean AUCW0-12 for the number of oral ulcers was 129.54 and 222.14 in the APR 30 BID treatment group and the placebo treatment group, respectively, demonstrating a 42% relative reduction in AUC between the 2 treatment groups. A LS mean difference (2-sided 95% CI) of -92.60 (-130.59, -54.60) (p < 0.0001) was observed.
The LS mean of daily average number of ulcers was 1.54 in the APR 30 BID treatment group versus 2.64 in the placebo treatment group, which is a daily difference of 1.10 ulcers.
Table 11. Area Under the Curve for Number of Oral Ulcers From Baseline Through Week 12 (ITT Population; MI)
Placebo (N = 103)
APR 30 BID (N = 104)
Baseline Oral Ulcers Number
n 103 104
Mean (SD) 3.9 (2.70) 4.2 (3.65)
Median (Min, Max) 3.0 (2, 19) 3.0 (2, 32)
AUC From Baseline Through Week 12 (MI)
n 103 104
Mean (SE)a 208.39 (16.974) 122.04 (15.114)
2-sided 95% CIa 174.70, 242.08 92.05, 152.03
LS Mean (SE)b 222.14 (15.886) 129.54 (15.943)

Extension of indication variation assessment report EMA/135313/2020 Page 31/102
2-sided 95% CI for LS Meanb 190.80, 253.47 98.09, 160.99
Treatment Comparison (Apremilast – Placebo)
Difference in LS Means (2-sided 95% CI)b - -92.60 (-130.59, -54.60)
2-sided p-valueb - < 0.0001
Daily Average Number of Oral Ulcers (MI)c
LS Mean (SE)b 2.64 (0.189) 1.54 (0.190)
APR 30 BID = 30 mg apremilast twice daily; AUC = area under the curve; AUCW0-12 = Area under the curve from baseline through Week 12; CI = confidence interval; ITT = intent-to-treat; LS = least squares; Max = maximum; MI = multiple imputation; Min = minimum; SD = standard deviation; SE = standard error. a Estimated by combining results from MI data sets through the SAS procedure PROC MIANALYZE. b Based on an analysis of covariance model for the AUC, with the treatment group, sex, and region as factors and the baseline oral ulcers number as a covariate. The combined inference from MI data sets through the SAS procedure PROC MIANALYZE are presented. P-value in bold is considered statistically significant. c The daily average number of oral ulcers was calculated by taking the average of AUCW0-12 over 84 days.
The results of the primary analysis were supported by multiple sensitivity analyses conducted to assess the impact that protocol violations, methodology of imputation of missing oral ulcer counts, and missing assessments might have had on the primary endpoint of AUCW0-12 for the number of oral ulcers. For all sensitivity analyses, the APR 30 BID treatment group had statistically significantly lower AUCW0-12 for the number of oral ulcers compared with the placebo treatment group.
Table 12. Sensitivity Analyses for Primary Endpoint (AUC[W0-12] for Oral Ulcers)
Analysis Population
Imputation for
Missing Oral
Ulcer Counts
AUCW0-12 LS Mean (SE) Treatment Comparison
Placebo
APR 30 BID
Difference in LS
Means (95% CI)
P-valuea
PP
MIb
214.76
(15.672)
130.30
(15.242)
-84.46
(-121.48, -47.45)
< 0.0001
ITT
LOCFc
240.17
(16.619)
136.05
(16.686)
-104.12
(-143.99, -64.26)
< 0.0001
PP
LOCFc
230.57
(16.254)
131.52
(16.429)
-99.05
(-138.44, -59.66)
< 0.0001
ITT; Subjects Completing
Week 12 Assessments 207.26 123.59 -83.67
DAO (17.345) (16.448) (-123.88, -43.46) < 0.0001
ITT; Subjects With No Missing
Assessments on Scheduled Visits 212.02 123.90 -88.13
DAO (18.586) (17.494) (-132.44, -43.82) 0.0001
ITT; Subjects With at Most
2 Missing Assessments on
Scheduled Visits MIb 208.30
(17.003)
123.01
(16.301)
-85.29
(-124.60, -45.98)
< 0.0001 APR 30 BID = 30 mg apremilast twice daily; AUCW0-12 = area under the curve from baseline through Week 12; CI = confidence interval; DAO = data as observed; ITT = intent-to-treat; LOCF = last observation carried forward; LS = least squares; MI = multiple imputation; PP = per protocol; SE = standard error. a For MI, based on an analysis of covariance model for the AUC, with treatment group, sex, and region as factors

Extension of indication variation assessment report EMA/135313/2020 Page 32/102
and the baseline oral ulcers number as a covariate. The combined inferences from MI datasets through the SAS procedure PROC MIANALYZE are presented. P-values in bold are considered statistically significant. b Multiple imputation method was used to impute missing oral ulcer counts. When the Week 12 Visit was not exactly on Day 85, the AUC from baseline through Week 12 was adjusted for study duration by dividing the total AUC by total study duration (in days) and multiplying this quantity by 84 days. c The last observation (baseline value if no postbaseline assessment) was carried forward for a missing value at Week 12. When the Week 12 Visit was not exactly on Day 85, the AUC from baseline through Week 12 was adjusted for study duration by dividing the total AUC by total study duration (in days) and multiplying this quantity by 84 days.
Secondary efficacy endpoints
Oral Ulcer Count by Time Point
Placebo-controlled Period
The mean number of oral ulcers at baseline was 4.2 in the APR 30 BID treatment group and 3.9 in the placebo treatment group. The LS mean number of oral ulcers was significantly lower in the APR 30 BID treatment group compared with the placebo treatment group at each visit from Week 1 through Week 12 (nominal p ≤ 0.0015 at each time point, Table 13. ).
Table 13. Oral Ulcer Count by Time Point Through Week 12 (ITT Population, MI)
Visit Treatment Group
n
Mean (SE)a
Analysisb
LS Mean (SE)
2-sided 95% CI for LS Mean
Treatment Comparison
Relative Risk (2-sided 95% CI)
P-valuec
Week 1
Placebo 103 2.89 (0.265) 2.78 (0.281) (2.23, 3.34) - -
APR 30 BID 104 1.89 (0.223) 1.79 (0.203) (1.38, 2.19) 0.64 (0.49, 0.83) 0.0010
Week 2
Placebo 103 2.82 (0.263) 2.66 (0.282) (2.10, 3.21) - -
APR 30 BID 104 1.41 (0.190) 1.31 (0.164) (0.98, 1.63) 0.49 (0.37, 0.65) < 0.0001
Week 4
Placebo 103 2.31 (0.263) 2.46 (0.324) (1.82, 3.10) - -
APR 30 BID 104 1.26 (0.193) 1.28 (0.191) (0.90, 1.66) 0.52 (0.37, 0.73) 0.0002
Week 6
Placebo 103 2.58 (0.331) 2.43 (0.332) (1.77, 3.09) - -
APR 30 BID 104 1.55 (0.239) 1.40 (0.210) (0.98, 1.81) 0.57 (0.41, 0.81) 0.0015
Week 8
Placebo 103 2.31 (0.246) 2.49 (0.350) (1.80, 3.18) - -
APR 30 BID 104 1.27 (0.231) 1.28 (0.198) (0.89, 1.67) 0.52 (0.36, 0.74) 0.0003
Week 10
Placebo 103 2.00 (0.212) 2.10 (0.303) (1.50, 2.69) - -
APR 30 BID 104 1.01 (0.197) 1.01 (0.168) (0.68, 1.34) 0.48 (0.33, 0.71) 0.0003
Week 12

Extension of indication variation assessment report EMA/135313/2020 Page 33/102
Placebo 103 2.13 (0.231) 2.04 (0.283) (1.48, 2.60) - -
APR 30 BID 104 1.19 (0.201) 1.06 (0.163) (0.74, 1.39) 0.52 (0.37, 0.74) 0.0003
APR 30 BID = apremilast 30 mg twice daily; CI = confidence interval; ITT = intent-to-treat; LS = least squares; MI = multiple imputation; SE = standard error. Note: Multiple imputation method was used to impute missing oral ulcer counts. a Estimated by combining results from MI datasets through the SAS procedure PROC MIANALYZE. b Based on a negative binomial model for number of oral ulcers, with treatment group, sex, and region as factors and the baseline oral ulcer number as a covariate. The combined inferences from MI datasets through the SAS procedure PROC MIANALYZE are presented. c P-values in italics are ≤ 0.050 and considered nominally significant because no multiplicity adjustment was applied.
Among subjects originally randomized to APR 30 BID, mean improvements (decreases) in the number of oral ulcers were maintained through Week 64 in subjects who remained in the study (Figure 4. ).
Figure 4. Mean (± SE) for Number of Oral Ulcers by Time Point (ITT Population; Data as
Observed)
30 mg BID = APR 30 BID = apremilast 30 mg twice daily; ITT = intent-to-treat; FU = follow-up; SE = standard error.
Change From Baseline in Oral Ulcer Pain Visual Analog Scale
Placebo-controlled Period
At baseline, the oral ulcer pain mean (median) VAS scores were 61.2 mm (67.0 mm) and 60.8 mm (64.5 mm) in the APR 30 BID treatment group and the placebo treatment group, respectively (Table 14. ). At Week 12, a statistically significantly greater decrease from baseline in oral ulcer pain VAS score was observed in the APR 30 BID treatment group compared with the placebo treatment group (LS mean change from baseline of -40.7 mm versus -15.9 mm, respectively; p < 0.0001), which is a more than 2.5-fold greater decrease in pain.

Extension of indication variation assessment report EMA/135313/2020 Page 34/102
Table 14. Oral Ulcers Pain Visual Analog Scale Change From Baseline at Week 12 (ITT Population; LOCF).
Time and Statistic
Placebo (N = 103)
APR 30 BID (N = 104)
na 102 103 Baseline
Mean (SD) 60.8 (26.92) 61.2 (27.55)
Median (Min, Max) 64.5 (1, 100) 67.0 (0, 100)
Week 12 (LOCF)
Mean (SD) 43.9 (31.99) 19.2 (27.04)
Median (Min, Max) 41.5 (0, 100) 4.0 (0, 96)
Change From Baseline at Week 12 (LOCF)
Mean (SD) -16.9 (34.80) -42.0 (36.01)
Median (Min, Max) -14.5 (-90, 78) -45.0 (-100, 47)
LS Mean (SE)b -15.9 (3.31) -40.7 (3.34) 2-sided 95% CI for LS Meanb -22.4, -9.4 -47.3, -34.1 Treatment Comparison (Apremilast – Placebo)
Difference in LS Means (2-sided 95% CI)b - -24.8 (-32.8, -16.8) 2-sided p-valueb - < 0.0001
APR 30 BID = apremilast 30 mg twice daily; CI = confidence interval; ITT = intent-to-treat; LOCF = last observation carried forward; LS = least squares; Max = maximum; Min = minimum; SD = standard deviation; SE = standard error; VAS = visual analog scale. a Subjects with a baseline value were included. b Based on an analysis of covariance model for the change from baseline, with treatment group, sex, and region as factors and the baseline score as a covariate. P-value in bold is considered statistically significant.
Results for the change in oral ulcer pain VAS scores, as analyzed using the mixed-effects model for repeated measures (MMRM) approach, were comparable to those obtained using LOCF analysis, with subjects in the APR 30 BID treatment group experiencing a statistically significantly greater LS mean improvement (decrease from baseline) in the subject’s assessment of pain at Week 12 compared with the subjects in the placebo treatment group (-42.7 mm versus -18.7 mm, respectively; p < 0.0001).
Among subjects originally randomized to APR 30 BID, mean improvements (decreases) in the oral ulcer pain VAS were maintained through Week 64 in subjects who remained in the study.

Extension of indication variation assessment report EMA/135313/2020 Page 35/102
Figure 5. Mean Change From Baseline in Oral Ulcer Pain Visual Analog Scale by Time Point (ITT Population; Data as Observed)
30 mg BID = APR 30 BID = apremilast 30 mg twice daily; FU = follow-up; ITT = intent-to-treat; SE = standard error.
Complete Response Rate for Oral Ulcers
Placebo-controlled Period
A statistically significantly greater proportion of subjects in the APR 30 BID treatment group experienced a complete response for oral ulcers at Week 12 compared with subjects in the placebo treatment group (52.9% versus 22.3%, respectively; p < 0.0001; Table 15. ).
Table 15. Complete Response Rate for Oral Ulcers at Week 12 (ITT Population; NRI)
Topic and Statistic
Placebo (N = 103) APR 30 BID (N = 104)
Number (%) of Complete Responders at Week 12 23 (22.3) 55 (52.9)
Treatment Comparison (Apremilast – Placebo)
Unadjusted Difference in Proportions (%) - 30.6
Adjusted Difference in Proportions (%)a - 30.6
2-sided 95% CI for Adjusted Differencea - 18.1, 43.1
2-sided p-valueb - < 0.0001
APR 30 BID = apremilast 30 mg twice daily; CI = confidence interval; CMH = Cochran-Mantel-Haenszel; ITT = intent-to-treat; NRI = nonresponder imputation. a Adjusted difference in proportions was the weighted average of the treatment differences across the 4 strata of combined sex and region factors with the CMH weights. Two-sided 95% CIs were based on normal approximation to the weighted average. b Two-sided p-value was based on the CMH test adjusting for sex and region. P-value in bold is considered statistically significant.

Extension of indication variation assessment report EMA/135313/2020 Page 36/102
These results were supported by the MI analysis, which showed a significantly higher proportion of subjects in the APR 30 BID treatment group compared with the placebo treatment group achieving a complete oral response (56.00% versus 27.57%, respectively; p < 0.0001).
Apremilast-exposure Period
Among subjects originally randomized to APR 30 BID, the proportion of subjects with oral ulcer complete response was maintained through Week 64 in subjects who remained in the study (Figure 6. ). At the follow-up visit 4 weeks after the cessation of active treatment, oral ulcer complete response rates declined in both treatment groups.
Figure 6. Mean (± SE) for Oral Ulcer Complete Response Rate by Time Point (ITT Population; Data as Observed)
30 mg BID = APR 30 BID = apremilast 30 mg twice daily; FU = follow-up; ITT = intent-to-treat; SE = standard error.
The median times to achieve the first oral ulcer complete response were 2.1 weeks and 8.1 weeks in the APR 30 BID treatment group and the placebo treatment group, respectively, yielding a hazard ratio (95% CI) of 2.400 (1.692, 3.405) (p < 0.0001).

Extension of indication variation assessment report EMA/135313/2020 Page 37/102
Figure 7. Time to Oral Ulcer Resolution (Complete Response) in Placebo-controlled Treatment Phase (ITT Population)
30 mg BID = APR 30 BID = apremilast 30 mg twice daily; CI = confidence interval; ITT = intent-to-treat; NA = not available.
Maintenance of Complete Response
Maintenance of complete response was demonstrated by a statistically significantly greater proportion of subjects achieving complete response by Week 6 and remaining oral ulcer-free for at least 6 additional weeks in the APR 30 BID treatment group compared with the placebo treatment group (29.8% versus 4.9%; p < 0.0001; Table 16. ).
Table 16. Proportion of Subjects Achieving an Oral Ulcer Complete Response by Week 6, and Remaining Oral Ulcer-free for at Least 6 Additional Weeks During the 12-week Placebo-controlled Treatment Phase (ITT Population)
Topic and Statistic
Placebo (N = 103)
APR 30 BID (N = 104)
Number (%) of Subjects Achieving an Oral Ulcer Complete Response by Week 6, and Remaining Oral Ulcer-free for at Least 6 Additional Weeks
5 (4.9)
31 (29.8) Treatment Comparison (Apremilast – Placebo)
Unadjusted Difference in Proportions (%) - 25.0
Adjusted Difference in Proportions (%)a - 25.1 2-sided 95% CI for Adjusted Differencea - 15.5, 34.6 2-sided p-valueb - < 0.0001
APR 30 BID = apremilast 30 mg twice daily; CI = confidence interval; CMH = Cochran-Mantel-Haenszel; ITT = intent-to-treat. a Adjusted difference in proportions was the weighted average of the treatment differences across the 4 strata of combined sex and region factors with the CMH weights. Two-sided 95% CIs were based on normal approximation to the weighted average. b Two-sided p-value is based on the CMH test adjusting for sex and region. P-value in bold is considered statistically significant

Extension of indication variation assessment report EMA/135313/2020 Page 38/102
Time to Recurrence of Oral Ulcers Following Loss of Complete Response
Among subjects who had a complete oral ulcer response, the median time to oral ulcer recurrence was nominally significantly longer in the APR 30 BID treatment group (4.6 weeks) compared with the placebo treatment group (2.3 weeks), yielding a hazard ratio (95% CI) of 0.611 (0.408, 0.915) (p = 0.0112).
Figure 8. Time to Oral Ulcer Recurrence Following Loss of a Complete Response (ITT
Population; Subjects Who Had a Complete Response Prior to Week 12)
30 mg BID = APR 30 BID = apremilast 30 mg twice daily; CI = confidence interval; ITT = intent-to-treat.
Proportion of Subjects with no oral ulcers following Complete Response
A nominally significantly greater proportion of subjects had no oral ulcers following a complete response in the APR 30 BID treatment group compared with the placebo treatment group (31.3% versus 13.2%, respectively; p = 0.0204) through Week 12, demonstrating a maintenance of complete response in the APR 30 BID treatment group.
Number of Oral Ulcers following Loss of Complete Response
Among subjects who had a complete response prior to Week 12, there was a numerically lower number of oral ulcers reported at the time of the first loss of a complete response through Week 12 in the APR 30 BID treatment group compared with the placebo treatment group (LS mean: 1.1 versus 1.5, respectively; p = 0.0683.
Table 17. Number of Oral Ulcers Following Loss of a Complete Response Through Week 12 (ITT Population; Subjects Who Had a Complete Response Prior to Week 12)
Topic and Statistic
Placebo (N = 53) APR 30 BID (N = 83)
Number of Oral Ulcers Reported at the Time of the First Loss of a Complete Response Through Week 12
n 53 83
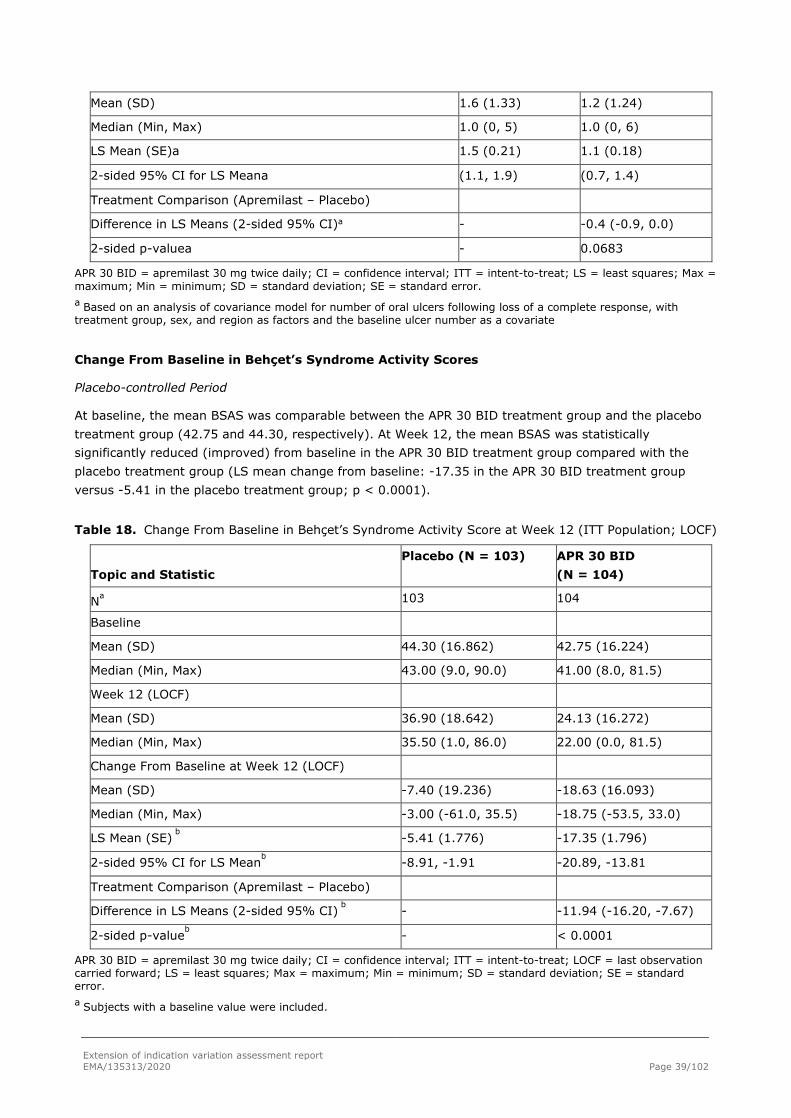
Extension of indication variation assessment report EMA/135313/2020 Page 39/102
Mean (SD) 1.6 (1.33) 1.2 (1.24)
Median (Min, Max) 1.0 (0, 5) 1.0 (0, 6)
LS Mean (SE)a 1.5 (0.21) 1.1 (0.18)
2-sided 95% CI for LS Meana (1.1, 1.9) (0.7, 1.4)
Treatment Comparison (Apremilast – Placebo)
Difference in LS Means (2-sided 95% CI)a - -0.4 (-0.9, 0.0)
2-sided p-valuea - 0.0683
APR 30 BID = apremilast 30 mg twice daily; CI = confidence interval; ITT = intent-to-treat; LS = least squares; Max = maximum; Min = minimum; SD = standard deviation; SE = standard error. a Based on an analysis of covariance model for number of oral ulcers following loss of a complete response, with treatment group, sex, and region as factors and the baseline ulcer number as a covariate
Change From Baseline in Behçet’s Syndrome Activity Scores
Placebo-controlled Period
At baseline, the mean BSAS was comparable between the APR 30 BID treatment group and the placebo treatment group (42.75 and 44.30, respectively). At Week 12, the mean BSAS was statistically significantly reduced (improved) from baseline in the APR 30 BID treatment group compared with the placebo treatment group (LS mean change from baseline: -17.35 in the APR 30 BID treatment group versus -5.41 in the placebo treatment group; p < 0.0001).
Table 18. Change From Baseline in Behçet’s Syndrome Activity Score at Week 12 (ITT Population; LOCF)
Topic and Statistic
Placebo (N = 103) APR 30 BID (N = 104)
Na 103 104
Baseline
Mean (SD) 44.30 (16.862) 42.75 (16.224)
Median (Min, Max) 43.00 (9.0, 90.0) 41.00 (8.0, 81.5)
Week 12 (LOCF)
Mean (SD) 36.90 (18.642) 24.13 (16.272)
Median (Min, Max) 35.50 (1.0, 86.0) 22.00 (0.0, 81.5)
Change From Baseline at Week 12 (LOCF)
Mean (SD) -7.40 (19.236) -18.63 (16.093)
Median (Min, Max) -3.00 (-61.0, 35.5) -18.75 (-53.5, 33.0)
LS Mean (SE) b -5.41 (1.776) -17.35 (1.796)
2-sided 95% CI for LS Meanb -8.91, -1.91 -20.89, -13.81
Treatment Comparison (Apremilast – Placebo)
Difference in LS Means (2-sided 95% CI) b - -11.94 (-16.20, -7.67)
2-sided p-valueb - < 0.0001
APR 30 BID = apremilast 30 mg twice daily; CI = confidence interval; ITT = intent-to-treat; LOCF = last observation carried forward; LS = least squares; Max = maximum; Min = minimum; SD = standard deviation; SE = standard error. a Subjects with a baseline value were included.

Extension of indication variation assessment report EMA/135313/2020 Page 40/102
b Based on an analysis of covariance model for the change from baseline, with treatment group, sex, and region as factors and the baseline score as a covariate. P-value in bold is considered statistically significant.
The proportion of subjects who achieved at least a 20-point improvement (reduction) in BSAS at Week 12 was 47.1% in the APR 30 BID treatment group and 20.4% in the placebo treatment group.
Apremilast-exposure Period
Among subjects originally randomized to APR 30 BID, the mean change from baseline (improvement) in BSAS was maintained at Week 64 in subjects who remained in the study (Table 19. ).
Among subjects originally randomized to placebo who were switched to APR 30 BID at Week 12, the mean change from baseline in BSAS in subjects who remained in the study was similar to the change observed in subjects originally randomized to APR 30 BID (Table 19. ).
Table 19. Change From Baseline in Behçet’s Syndrome Activity Scores by Time Point (ITT Population)
Topic and Statistic
Placebo (N = 103) APR 30 BID (N = 104)
Change From Baseline at Week 12
na 82 96
Mean (SD) -9.59 (19.764) -19.73 (15.283)
Median (Min, Max) -7.00 (-61.0, 33.0) -20.50 (-53.5, 16.0)
2-sided 95% CI for Mean (-13.93, -5.25) (-22.83, -16.63)
Change From Baseline at Week 64
na 68 75
Mean (SD) -16.63 (17.566) -16.91 (21.640)
Median (Min, Max) -16.75 (-50.5, 26.0) -15.50 (-71.5, 36.0)
2-sided 95% CI for Mean (-20.88, -12.38) (-21.89, -11.93)
Change From Baseline at Follow-up
na 82 85
Mean (SD) -7.88 (18.859) -9.15 (21.314)
Median (Min, Max) -3.25 (-48.5, 37.5) -8.00 (-65.0, 32.5)
2-sided 95% CI for Mean (-12.03, -3.74) (-13.74, -4.55)
APR 30 BID = apremilast 30 mg twice daily; CI = confidence interval; ITT = intent-to-treat; Max = maximum; Min = minimum; SD = standard deviation. a The sample sizes at a postbaseline time point were based on subjects with a baseline value and a postbaseline value at the time point.
Change From Baseline in Behçet’s Disease Current Activity Form
The BDCAF consists of 3 components: BDCAI, Patient’s Perception of Disease Activity, and the Clinician’s Overall Perception of Disease Activity.
Placebo-controlled Period
At baseline, the mean scores for the BDCAI, Patient’s Perception of Disease Activity, and Clinician’s Overall Perception of Disease Activity were comparable between the APR 30 BID treatment group and the

Extension of indication variation assessment report EMA/135313/2020 Page 41/102
placebo treatment group (APR 30 BID versus placebo, respectively: 3.7 versus 3.6, 4.7 versus 4.8, and 4.5 versus 4.5) (Table 20. ).
All BDCAF component scores showed improved response with apremilast treatment compared with placebo, with p-values < 0.05. At Week 12, a statistically significantly greater improvement (decrease) in the change from baseline in BDCAI was observed in the APR 30 BID treatment group compared with the placebo treatment group (LS mean change from baseline: APR 30 BID, -0.9; placebo, -0.4; p = 0.0335). Similarly, at Week 12, statistically significantly greater improvements (reductions) in the Patient’s Perception of Disease Activity (LS mean change from baseline: APR 30 BID, -1.7; placebo, -0.7; p<0.0001) and the Clinician’s Overall Perception of Disease Activity (LS mean change from baseline: APR 30 BID, -1.6; placebo, -0.7; p < 0.0001) were observed in the APR 30 BID treatment group compared with the placebo treatment group.
Table 20. Change From Baseline in Behçet’s Disease Current Activity Form Scores at Week 12 (ITT Population; LOCF)
Topic and Statistic
Placebo (N = 103)
APR 30 BID (N = 104)
Behçet’s Disease Current Activity Index Score
n 102 104
Baseline
Mean (SD) 3.6 (1.67) 3.7 (1.58)
Median (Min, Max) 4.0 (1, 9) 4.0 (1, 7)
Week 12 (LOCF)
Mean (SD) 3.1 (1.91) 2.6 (1.86)
Median (Min, Max) 3.0 (0, 9) 2.0 (0, 9)
Change From Baseline at Week 12 (LOCF)
Mean (SD) -0.5 (2.03) -1.1 (1.83)
Median (Min, Max) 0.0 (-9, 4) -1.0 (-5, 3)
LS Mean (SE) -0.4 (0.20) -0.9 (0.20)
2-sided 95% CI for LS Mean -0.8, 0.0 -1.3, -0.5
Treatment Comparison (Apremilast – Placebo)
Difference in LS Means (2-sided 95% CI) - -0.5 (-1.0, 0.0)
2-sided p-value - 0.0335
Patient’s Perception of Disease Activity
na 102 104
Baseline
Mean (SD) 4.8 (1.33) 4.7 (1.39)
Median (Min, Max) 5.0 (1, 7) 5.0 (1, 7)
Week 12 (LOCF)
Mean (SD) 4.0 (1.65) 3.0 (1.55)
Median (Min, Max) 4.0 (1, 7) 3.0 (1, 7)
Change From Baseline at Week 12 (LOCF)

Extension of indication variation assessment report EMA/135313/2020 Page 42/102
Mean (SD) -0.7 (1.74) -1.7 (1.92)
Median (Min, Max) -1.0 (-5, 5) -2.0 (-6, 3)
LS Mean (SE)b -0.7 (0.18) -1.7 (0.18)
2-sided 95% CI for LS Meanb -1.0, -0.3 -2.0, -1.3
Treatment Comparison (Apremilast – Placebo)
Difference in LS Means (2-sided 95% CI) - -1.0 (-1.4, -0.6)
2-sided p-value - < 0.0001
Clinician’s Overall Perception of Disease Activity
n 102 104
Baseline
Mean (SD) 4.5 (1.12) 4.5 (1.21)
Median (Min, Max) 4.0 (2, 7) 4.0 (1, 7)
Week 12 (LOCF)
Mean (SD) 3.7 (1.54) 2.7 (1.49)
Median (Min, Max) 4.0 (0, 7) 2.0 (1, 7)
Change From Baseline at Week 12 (LOCF)
Mean (SD) -0.8 (1.70) -1.8 (1.56)
Median (Min, Max) -1.0 (-4, 3) -2.0 (-6, 2)
LS Mean (SE) -0.7 (0.17) -1.6 (0.17)
2-sided 95% CI for LS Meanb -1.0, -0.4 -2.0, -1.3
Treatment Comparison (Apremilast – Placebo)
Difference in LS Means (2-sided 95% CI) - -0.9 (-1.3, -0.5)
2-sided p-value - < 0.0001
Among subjects originally randomized to placebo who were switched to APR 30 BID at Week 12, mean changes from baseline in subjects who remained in the study were similar to those observed in subjects originally randomized to APR 30 BID.
At the follow-up visit 4 weeks after the cessation of active treatment, these improvements were generally not maintained. A consistent trend was observed from a post hoc analysis based on all subjects who completed Week 64
Change From Baseline in Behçet’s Disease Quality of Life Score:
Placebo-controlled Period
At baseline, the mean BD QoL scores were comparable between the APR 30 BID treatment group and the placebo treatment group (10.22 and 11.24, respectively). At Week 12, a statistically significantly greater improvement (decrease) in mean BD QoL score from baseline was observed in the APR 30 BID treatment group compared with the placebo treatment group (LS mean change of -3.5 versus -0.5, respectively; p = 0.0003), indicating a 7-fold improvement in QoL with apremilast treatment (Table 21. ).

Extension of indication variation assessment report EMA/135313/2020 Page 43/102
Table 21. Change From Baseline in Behçet’s Disease Quality of Life Scores at Week 12 (ITT Population; LOCF)
Topic and Statistic
Placebo (N = 103)
APR 30 BID (N = 104)
na 103 104
Baseline
Mean (SD) 11.24 (8.157) 10.22 (8.245)
Median (Min, Max) 12.00 (0.0, 29.0) 8.00 (0.0, 28.0)
Week 12 (LOCF)
Mean (SD) 10.51 (8.966) 6.84 (7.152)
Median (Min, Max) 9.00 (0.0, 30.0) 4.00 (0.0, 28.0)
Change From Baseline at Week 12 (LOCF)
Mean (SD) -0.73 (5.981) -3.38 (6.377)
Median (Min, Max) -1.00 (-18.0, 29.0) -1.50 (-25.0, 14.0)
LS Mean (SE)b -0.5 (0.66) -3.5 (0.67)
2-sided 95% CI for LS Meanb -1.8, 0.8 -4.8, -2.2
Treatment Comparison (Apremilast – Placebo)
Difference in LS Means (2-sided 95% CI)b - -3.0 (-4.5, -1.4)
2-sided p-valueb - 0.0003
APR 30 BID = apremilast 30 mg twice daily; CI = confidence interval; ITT = intent-to-treat; LOCF = last observation carried forward; LS = least squares; Max = maximum; Min = minimum; SD = standard deviation; SE = standard error. a Subjects with a baseline value were included. b Based on an analysis of covariance model for the change from baseline, with treatment group, sex, and region as factors and the baseline score as a covariate. P-value in bold is considered statistically significant.
Apremilast-exposure Period
Among subjects originally randomized to APR 30 BID, the mean change from baseline in BD QoL scores was maintained at Week 64 in subjects who remained in the study.
Among subjects originally randomized to placebo who were switched to APR 30 BID at Week 12, mean change from baseline in BD QoL scores in subjects who remained in the study was similar to findings observed in subjects originally randomized to APR 30 BID.
Table 22. Change From Baseline in Behçet’s Disease Quality of Life Scores by Time Point (ITT Population)
Topic and Statistic
Placebo (N = 103) APR 30 BID (N = 104)
Change From Baseline at Week 12
na 82 96
Mean (SD) -0.89 (6.450) -3.53 (6.511)
Median (Min, Max) -1.00 (-18.0, 29.0) -2.00 (-25.0, 14.0)
2-sided 95% CI for Mean (-2.31, 0.53) (-4.85, -2.21)
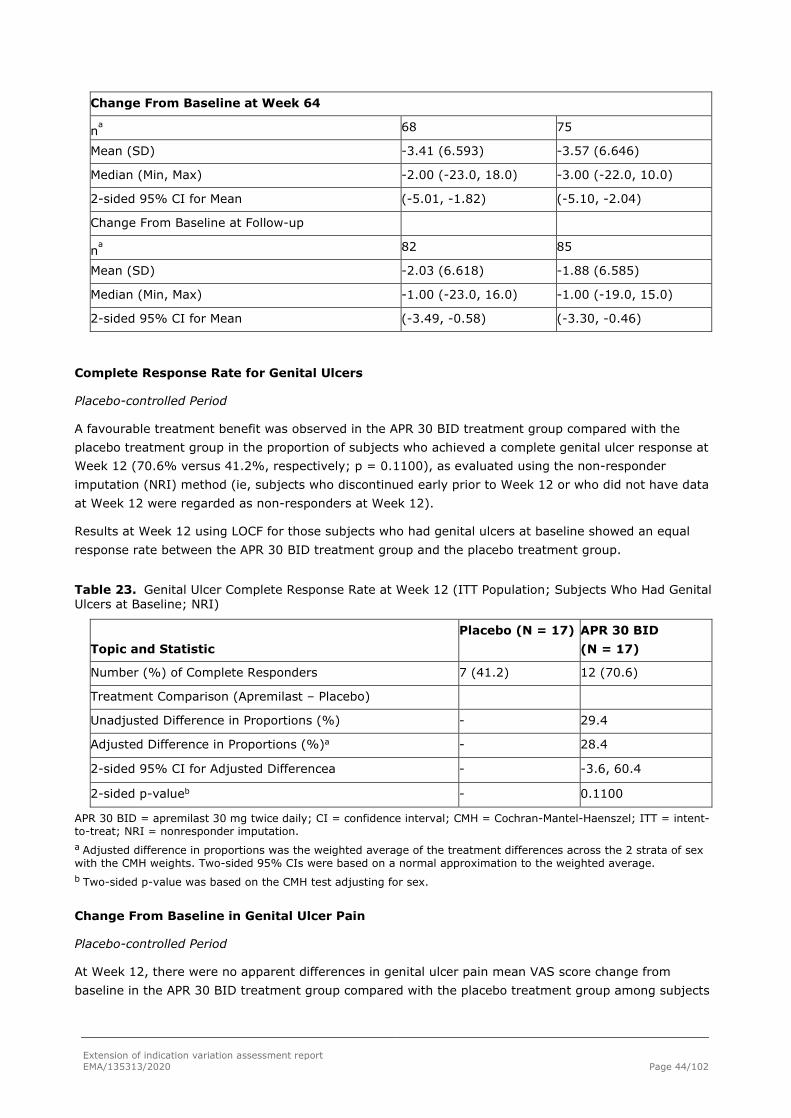
Extension of indication variation assessment report EMA/135313/2020 Page 44/102
Change From Baseline at Week 64
na 68 75
Mean (SD) -3.41 (6.593) -3.57 (6.646)
Median (Min, Max) -2.00 (-23.0, 18.0) -3.00 (-22.0, 10.0)
2-sided 95% CI for Mean (-5.01, -1.82) (-5.10, -2.04)
Change From Baseline at Follow-up
na 82 85
Mean (SD) -2.03 (6.618) -1.88 (6.585)
Median (Min, Max) -1.00 (-23.0, 16.0) -1.00 (-19.0, 15.0)
2-sided 95% CI for Mean (-3.49, -0.58) (-3.30, -0.46)
Complete Response Rate for Genital Ulcers
Placebo-controlled Period
A favourable treatment benefit was observed in the APR 30 BID treatment group compared with the placebo treatment group in the proportion of subjects who achieved a complete genital ulcer response at Week 12 (70.6% versus 41.2%, respectively; p = 0.1100), as evaluated using the non-responder imputation (NRI) method (ie, subjects who discontinued early prior to Week 12 or who did not have data at Week 12 were regarded as non-responders at Week 12).
Results at Week 12 using LOCF for those subjects who had genital ulcers at baseline showed an equal response rate between the APR 30 BID treatment group and the placebo treatment group.
Table 23. Genital Ulcer Complete Response Rate at Week 12 (ITT Population; Subjects Who Had Genital Ulcers at Baseline; NRI)
Topic and Statistic
Placebo (N = 17) APR 30 BID (N = 17)
Number (%) of Complete Responders 7 (41.2) 12 (70.6)
Treatment Comparison (Apremilast – Placebo)
Unadjusted Difference in Proportions (%) - 29.4
Adjusted Difference in Proportions (%)a - 28.4
2-sided 95% CI for Adjusted Differencea - -3.6, 60.4
2-sided p-valueb - 0.1100
APR 30 BID = apremilast 30 mg twice daily; CI = confidence interval; CMH = Cochran-Mantel-Haenszel; ITT = intent-to-treat; NRI = nonresponder imputation. a Adjusted difference in proportions was the weighted average of the treatment differences across the 2 strata of sex with the CMH weights. Two-sided 95% CIs were based on a normal approximation to the weighted average. b Two-sided p-value was based on the CMH test adjusting for sex.
Change From Baseline in Genital Ulcer Pain
Placebo-controlled Period
At Week 12, there were no apparent differences in genital ulcer pain mean VAS score change from baseline in the APR 30 BID treatment group compared with the placebo treatment group among subjects

Extension of indication variation assessment report EMA/135313/2020 Page 45/102
who had genital ulcers at baseline (LS mean change from baseline of -30.0 versus -24.5, respectively; p = 0.6182).
Change From Baseline in the Total Score of Static Physician’s Global- Assessment of Skin Lesions of Behçet’s Disease
The static PGA of BD-related skin lesions showed very minimal disease activity, with a mean score of 1.9 at baseline (scale: 0 to 9). The PGA instrument is not sensitive enough to detect changes in the skin severity score unless the lesions change by a magnitude > 10.
Exploratory Efficacy Endpoints
Cumulative Number of Oral Ulcers
Placebo-Controlled Treatment Phase
Subjects in the APR 30 BID treatment group had a nominally significantly lower LS mean cumulative number of oral ulcers at Week 12 compared with subjects in the placebo treatment group (14.78 versus 23.79; p < 0.0001)
Partial Response Rate of Oral Ulcers
Placebo-Controlled Treatment Phase
At Week 12, there was a nominally significantly greater proportion of subjects with an oral ulcer partial response in the APR 30 BID treatment group compared with the placebo treatment group (76.0% versus 47.6%; p < 0.000).
Apremilast-exposure Period
Among subjects originally randomized to receive APR 30 BID, oral ulcer partial response rates were maintained through Week 64 in subjects who remained in the study. Among subjects originally randomized to receive placebo who were switched to APR 30 BID at Week 12, findings in subjects who remained in the study were similar to those observed for subjects originally randomized to APR 30 BID.
An analysis of oral ulcer partial response rate through Week 64 was performed using the NRI approach which generally corroborated the results of the analyses using DAO.
Change From Baseline in SF-36v2 Physical Functioning Scale
Placebo-Controlled Treatment Phase
At Week 12, subjects in the APR 30 BID treatment group experienced a nominally significantly greater LS mean change from baseline compared with the placebo treatment group (2.90 versus 0.04; p = 0.0060), demonstrating a greater improvement in physical functioning.
A greater proportion of subjects in the APR 30 BID treatment group experienced an improvement of at least 2.5 points (the MCID) on the Physical Functioning Scale compared with subjects in the placebo treatment group at Week 12 (39.4% versus 29.1%, respectively; LOCF).
A greater proportion (> 13%) of subjects in the APR 30 BID treatment group experienced an improvement of at least 2.5 points (the MCID) on all remaining SF-36 scale scores (Bodily Pain Scale, General Health Perceptions Scale, Mental Health Scale, Role Limitations-Emotional Scale, Role Limitations-Physical Scale, Social Function Scale, and Vitality Scale) compared with the proportion of subjects in the placebo treatment group at Week 12 (LOCF).
Tender and Swollen Joints

Extension of indication variation assessment report EMA/135313/2020 Page 46/102
Placebo-controlled Period
In subjects who had tender joints (n = 94; APR 30 BID n = 44; placebo n = 50) at baseline, the tender joint mean counts were comparable between the APR 30 BID treatment group and the placebo treatment group (6.5 and 6.0, respectively). At Week 12 (LOCF), a numerically greater decrease in the tender joint count was observed in the APR 30 BID treatment group compared with the placebo treatment group (LS mean change from baseline: APR 30 BID, -4.4; placebo, -2.7; p = 0.1457).
In subjects who had swollen joints (n = 32; APR 30 BID n = 17; placebo n = 15) at baseline, the swollen joint mean counts were not comparable between the APR 30 BID treatment group and the placebo treatment group, with a lower number of swollen joints in the APR 30 BID treatment group (3.4 and 5.7, respectively). At Week 12 (LOCF), no apparent difference was observed in the reduction in the swollen joint count between the APR 30 BID treatment group and the placebo treatment group (LS mean change from baseline: APR 30 BID, -3.1; placebo, -2.9; p = 0.8955).
Ophthalmologic Examination
There were no subjects with active anterior or posterior uveitis at baseline. One subject who was randomized to placebo had an “other” ocular manifestation that was active at baseline, but it was not considered to be BD-related uveitis.
One subject who was randomized to placebo had a history of posterior uveitis and withdrew due to lack of efficacy. At the ET Visit, when an ophthalmologic examination was performed, panuveitis-diffuse uveitis, endophthalmitis was present at the Subject’s ET Visit on Day 26.
A second subject who had a history of anterior uveitis (iridocyclitis) was randomized to placebo and, at an unscheduled visit, had an ophthalmologic examination and anterior iritis, iridocyclitis, and anterior cyclitis were reported.
Ancillary analyses
Subgroup Analyses
A treatment effect in favour of the APR 30 BID versus the placebo treatment group was observed in each
subgroup based on demographics, baseline disease characteristics (including duration of disease and
baseline oral ulcer count), geographic region, and prior use of colchicine and corticosteroids.
Post-hoc subgroup analysis on history of uveitis suggests that the effect of apremilast is lower in patients
with history of uveitis (difference in LS mean (CI 95%) APR 30mg BID versus placebo -73.19 (-178.39,
30.81)).
Pharmacogenetics A pharamacogenetic analysis was performed in Study BCT-002 to evaluate the association of single nucleotide polymorphisms (SNPs) to response status in apremilast treated Behcet’s subjects compared to Placebo at week 12. SNPs evaluated were within 5kb of transcription start and stop in candidate genes related to PDE4 biology. One hundred and forty study participants (50% of the total number of participants) had consented to genotyping.
Genotyped and imputed variants were evaluated for association with apremilast 30mg BID induced clinical response as defined by oral ulcer counts (measured by area under the curve -AUC) at week 12. Two classes of association analyses were performed to test for statistical significance of 1) all SNPs to the response status; and 2) pre-selected SNPs (near 63 candidate genes) to the response status. No

Extension of indication variation assessment report EMA/135313/2020 Page 47/102
significant associations with response status to apremilast were identified in either the genome-wide analysis nor the analysis of SNPs near candidate genes.
Supportive study
Phase 2 study CC-10004-BCT-001
Methods
Study BCT-001 was a Phase 2, multicenter, randomized, placebo-controlled, double-blind, parallel-group study of apremilast in the treatment of BD. The study consisted of 4 phases: a 3-month Pre randomization Phase; a 12-week, placebo-controlled Treatment Phase; a 12-week, blinded Extension Phase; and a 4-week post treatment Observational Follow-up Phase (Figure 9. ).
Figure 9. Phase 2 Study BCT-001 Design
Note: Dose reduction was permitted after the dose-titration period (ie, starting Day 8).
Study participants
A total of 238 subjects were screened for inclusion in this study, 111 were randomized and 127 were screen failures. All 127 screen failures were excluded from the study because they failed to satisfy entry criteria.

Extension of indication variation assessment report EMA/135313/2020 Page 48/102
Main Inclusion Criteria
Male or female subjects ≥ 18 years of age at the time of signing the informed consent form met the international study group criteria for BD at the time of diagnosis, had active ulcer disease (oral and/or genital) in the 28-day period prior to screening, with or without current treatment, had 2 or more oral ulcers at the time of randomization (Baseline; Day 1), without any active major organ involvement of BD, including ocular, central nervous system, lung, vascular, or gastrointestinal (GI) involvement. Subjects with mild BD-related inflammatory eye disease not requiring immunosuppressive therapy were allowed. Subjects with arthritis were allowed.
Exclusion criteria
• Subjects were not to be enrolled into this study if they had: Systemic fungal infection
• History of active mycobacterial infection with any species
• History of recurrent bacterial infection
• History of human immunodeficiency virus (HIV) infection
• History of congenital or acquired immunodeficiency (e.g., common variable immunodeficiency [CVID])
• Hepatitis B surface antigen positive at screening
• Antibodies to hepatitis C at screening
• Malignancy or history of malignancy (except for treated [i.e., cured] basal cell skin carcinomas > 3 years prior to screening)
• Low dose systemic corticosteroids (≤ 10 mg/day prednisone or equivalent) were allowed during the study, if the dose was stable for at least 4 weeks prior to randomization.
Treatments
Apremilast was supplied for oral administration in tablets containing 10, 20, or 30 mg active ingredient.
Placebo tablets were provided as appearing identical to apremilast 10, 20, or 30 mg tablets.
Immunomodulating therapy and topical corticosteroids were prohibited during the study.Subjects who
had taken the following medications had to adhere to the minimum washout
periods indicated:
• Azathioprine, colchicine, and mycophenolate mofetil: 10 days prior to the day of randomization
• Topical corticosteroids: 2 weeks prior to the day of randomization
• Nonbiologic immunosuppressive agents (ie, systemic corticosteroids given at a dose > 10 mg/day
prednisone or equivalent, systemic corticosteroids given at a lower dose that was not stable for at
least 4 weeks, cyclosporine, methotrexate, cyclophosphamide, thalidomide, dapsone): 4 weeks
prior to the day of randomization
• Hydroxychloroquine, adalimumab, infliximab, and etanercept: 12 weeks prior to the day of
randomization Rituximab: 12 months prior to the day of randomization
Dose selection
Based on nonclinical pharmacology data and the results of CC-10004-PSOR-003 in which subjects with moderate-to-severe, plaque-type psoriasis were treated with 20 mg apremilast BID vs. QD for 3 months,

Extension of indication variation assessment report EMA/135313/2020 Page 49/102
apremilast 30 mg BID was selected for Study BCT-001. A higher dose relative to CC-10004-PSOR-003 was chosen to minimise the number of subjects required to evaluate this rare disorder and to maximise the potential to demonstrate efficacy. Since apremilast is known to be associated with GI adverse events and headaches, the dose was escalated gradually to 30 mg BID over the first week of treatment. Subjects who could not tolerate the full dose of study drug were allowed to reduce their dose to 20 mg BID once during the study.
Objectives
Primary Objective – Treatment Phase
The primary objective of this study was to evaluate the efficacy of apremilast in the treatment of oral ulcers after 84 days of treatment.
Secondary Objectives
The secondary objectives for the Treatment Phase of this study were:
• To evaluate the safety of apremilast
• To evaluate the efficacy of apremilast in the treatment of genital ulcers
• To evaluate apremilast’s efficacy over time in the treatment of oral and genital ulcers
• To evaluate the effect of apremilast on patient-reported outcomes (PROs)
• To evaluate the effect of apremilast on disease activity
The secondary objectives for the Extension and Observational Follow-up Phases of this study were:
• To evaluate the safety of apremilast during the Extension Phase and the Follow-up Phase
• To evaluate the efficacy of apremilast in the treatment of oral and genital ulcers during the Extension Phase
• To evaluate the effect of apremilast on the PROs during the Extension Phase
• To evaluate the effect of apremilast on disease activity during the Extension Phase
• To evaluate the durability of response after the treatment was stopped.
Exploratory Objectives
The exploratory objectives of this study were to evaluate the effect of apremilast on the skin lesions of BD, on the arthritis associated with BD and on uveitis.
Outcomes/endpoints
Primary Efficacy Endpoint – Treatment Phase
The primary efficacy endpoint in this study was the number of oral ulcers at Day 85.
Secondary Efficacy Endpoints
Secondary efficacy endpoints for the Treatment Phase of this study were:
• Ulcer response (proportion of subjects who were oral ulcer-free (complete response), or whose oral ulcers were reduced by ≥ 50% (partial response) from Day 1 to Day 85
• Changes from baseline in the pain of oral ulcers, as measured by VAS at Day 85

Extension of indication variation assessment report EMA/135313/2020 Page 50/102
• Area under the ulcer-time curve from Day 1 to Day 85 (AUC85) for the number of oral ulcers, genital ulcers, or oral + genital ulcers
• Sum of the number of oral ulcers, genital ulcers, or oral + genital ulcers from Day 1 to Day 85
• Number of genital ulcers at Day 85
• Changes from baseline in the pain of genital ulcers, as measured by VAS at Day 85
• Changes from baseline in Behçet’s Disease Current Activity Form scores at Day 85
Secondary efficacy endpoints for the Extension and Observational Follow-up Phases of this study were:
• Number of oral ulcers
• Changes from baseline in the pain of oral ulcers, as measured by VAS
• Number of genital ulcers
• Changes from baseline in the pain of genital ulcers, as measured by VAS
• Changes from baseline in disease activity as measured by Behçet’s Disease Current Activity scores
• Number of ulcers and pain for both oral and genital ulcers and Behçet’s Disease Current Activity score at the end of the 28-day observational follow-up as compared to Day 169.
Patient-Reported Outcomes
The PRO endpoints for the Treatment Phase of this study were:
• Changes from baseline in BD QoL score at Day 85
• Changes from baseline in BD MDHAQ score at Day 85
• Changes from baseline in the 8 domains and the 2 component scores (physical and mental) of the SF-36v2 at Day 85
The PRO endpoints for the Extension and Observational Follow-up Phases of this study were:
• Changes from baseline in BD QoL score
• Changes from baseline in BD MDHAQ score
• Changes from baseline in the 8 domains and the 2 component scores (physical and mental) of the SF-36v2
Exploratory Endpoints
The exploratory endpoints of this study were:
• Response according to the PGA of BD-related skin lesions
• Percent change in the numbers of swollen and tender joints (66/68 joint counts, respectively).
Disease Flare
Disease flare was monitored to determine if there was increased risk for the subject to continue
participation in the study. A flare was defined as development of new manifestations of BD or
worsening of existing disease, fulfilling one or more of the following 5 criteria:
• Organ involvement: any major organ involvement (eg, CNS, GI tract)

Extension of indication variation assessment report EMA/135313/2020 Page 51/102
• Oral/genital ulcers: ≥ 100% increase in the number of oral or genital ulcers from Day 1 or a
minimum increase of 3 in the number of oral or genital ulcers, whichever was greater
• Arthritis: ≥ 50% increase in the number of swollen joints, or a minimum increase of 3 swollen
joints, whichever was greater
• Skin lesions (non-oral/genital ulcers): ≥ 50% increase in the total PGA score or a minimum
increase of 2 in the total PGA score, whichever was greater. Note: A variation in investigators’
method of capturing and reporting skin lesions was observed; hence PGA scoring was not
employed. Instead, all assessments of skin lesion flares were accepted without query unless there
was zero evidence that any worsening of skin lesion took place.
• New onset or worsening of existing BD-related inflammatory eye disease requiring initiation of
immunosuppressive therapy
Subjects who developed major organ involvement (Criterion 1) and/or new onset or worsening of existing
BD-related inflammatory eye disease requiring initiation of immunosuppressive therapy (Criterion 5) were
to be discontinued from the study. Subjects who experienced other types of flare (Criteria 2, 3 or 4) could
remain on the study at the investigator’s discretion.
Sample size
Based on a review of current therapy in BD (Melikoglu, 2005), a sample size of 62 subjects in each group would have 90% power to detect a difference in the mean number of oral ulcers of -0.650, using the difference between an actively treated group mean of 0.80 oral ulcers and a placebo-treated group mean of 1.45 oral ulcers, assuming that the common standard deviation is 1.10 using a 2-sided t-test at 0.05 significance level. To allow for a dropout rate of about 20%, the study was originally planned to randomize approximately 156 subjects. One interim and one final efficacy analysis were planned per protocol. The planned interim efficacy analysis was to be performed when approximately 70% of enrolled subjects had either completed Day 85 or had discontinued prematurely from the study. However, slow enrolment was faced during the study conduct. The sample size of 156 subjects initially planned was revised to 111 subjects, as the randomisation of 111 subjects was sufficient to provide 80% power to detect a difference between treatment groups using the assumptions stated in the protocol. Therefore, only one analysis was performed. Final protocol and final SAP were amended accordingly.
Randomisation
Subjects were randomized 1:1 to 30 mg apremilast BID or placebo, stratified according to sex, at the Baseline Visit (Day 1).
Blinding (masking)
Subjects and investigators were blinded to treatment assignment. To maintain the blind, tablets of apremilast and placebo were identical in size, colour, and blister-card configuration.
Randomization codes were not available to the investigational site until after the completion of the study and final data review. Randomization codes were kept strictly confidential, accessible only to authorized persons, until the time of unblinding. Only when the study was completed, the protocol violations determined, and the data file verified and locked, were the medication codes broken and made available for data analysis.
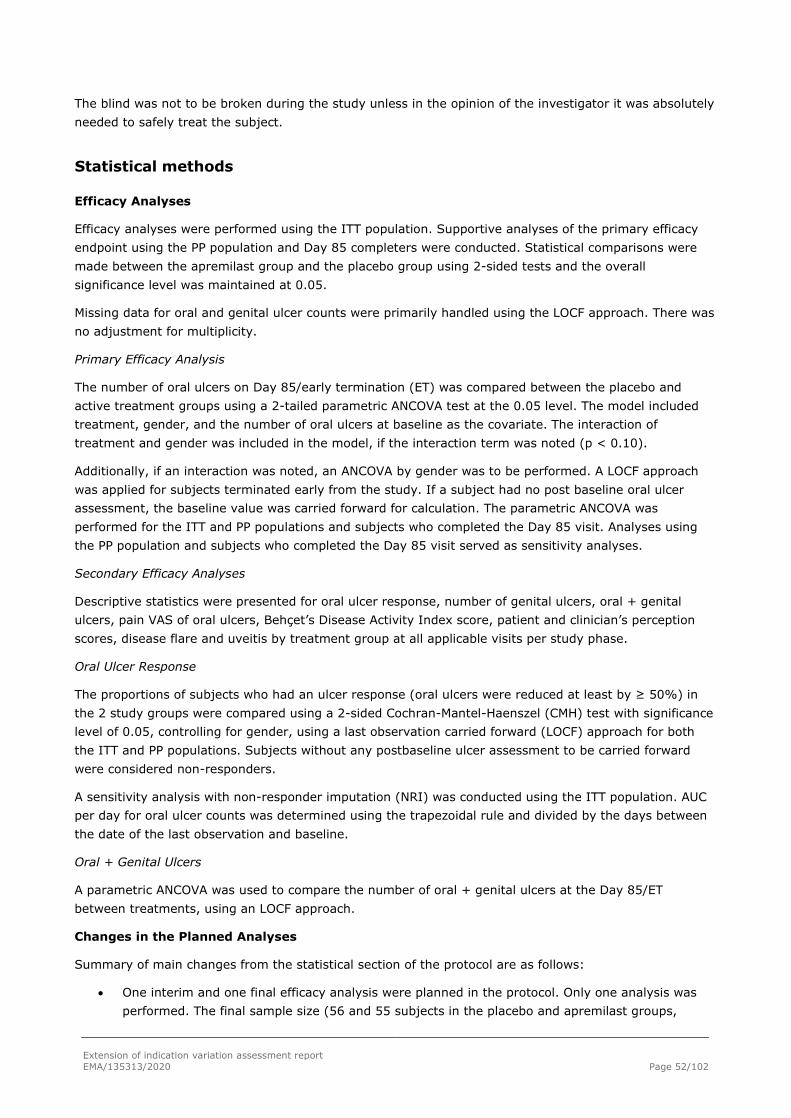
Extension of indication variation assessment report EMA/135313/2020 Page 52/102
The blind was not to be broken during the study unless in the opinion of the investigator it was absolutely needed to safely treat the subject.
Statistical methods
Efficacy Analyses
Efficacy analyses were performed using the ITT population. Supportive analyses of the primary efficacy endpoint using the PP population and Day 85 completers were conducted. Statistical comparisons were made between the apremilast group and the placebo group using 2-sided tests and the overall significance level was maintained at 0.05.
Missing data for oral and genital ulcer counts were primarily handled using the LOCF approach. There was no adjustment for multiplicity.
Primary Efficacy Analysis
The number of oral ulcers on Day 85/early termination (ET) was compared between the placebo and active treatment groups using a 2-tailed parametric ANCOVA test at the 0.05 level. The model included treatment, gender, and the number of oral ulcers at baseline as the covariate. The interaction of treatment and gender was included in the model, if the interaction term was noted (p < 0.10).
Additionally, if an interaction was noted, an ANCOVA by gender was to be performed. A LOCF approach was applied for subjects terminated early from the study. If a subject had no post baseline oral ulcer assessment, the baseline value was carried forward for calculation. The parametric ANCOVA was performed for the ITT and PP populations and subjects who completed the Day 85 visit. Analyses using the PP population and subjects who completed the Day 85 visit served as sensitivity analyses.
Secondary Efficacy Analyses
Descriptive statistics were presented for oral ulcer response, number of genital ulcers, oral + genital ulcers, pain VAS of oral ulcers, Behçet’s Disease Activity Index score, patient and clinician’s perception scores, disease flare and uveitis by treatment group at all applicable visits per study phase.
Oral Ulcer Response
The proportions of subjects who had an ulcer response (oral ulcers were reduced at least by ≥ 50%) in the 2 study groups were compared using a 2-sided Cochran-Mantel-Haenszel (CMH) test with significance level of 0.05, controlling for gender, using a last observation carried forward (LOCF) approach for both the ITT and PP populations. Subjects without any postbaseline ulcer assessment to be carried forward were considered non-responders.
A sensitivity analysis with non-responder imputation (NRI) was conducted using the ITT population. AUC per day for oral ulcer counts was determined using the trapezoidal rule and divided by the days between the date of the last observation and baseline.
Oral + Genital Ulcers
A parametric ANCOVA was used to compare the number of oral + genital ulcers at the Day 85/ET between treatments, using an LOCF approach.
Changes in the Planned Analyses
Summary of main changes from the statistical section of the protocol are as follows:
• One interim and one final efficacy analysis were planned in the protocol. Only one analysis was performed. The final sample size (56 and 55 subjects in the placebo and apremilast groups,

Extension of indication variation assessment report EMA/135313/2020 Page 53/102
respectively) was sufficient to provide 80% power to detect a difference between treatment groups.
• The original planned supportive analysis of the primary endpoint using a nonparametric ANCOVA model was not performed due to the nature of the study data.
• For the Day 169 efficacy analyses, Day 1 assessments were to be used as baseline for subjects who were treated with apremilast continuously throughout the study, while Day 85 assessments were to be used as baseline for placebo subjects who switched to apremilast. As described in the SAP, the Day 1 assessments were used as baseline for all subjects so that time zero was the same for all subjects and reflected the subject’s disease status at study entry. For the oral ulcer response at Day 169, the frequency table using Day 85 assessments as baseline were provided as a supplemental analysis for subjects that switched to apremilast at Day 85.
Additional sensitivity analyses for the primary endpoint and nominal p-values for key secondary endpoints were provided as ad hoc analyses.
Results
Participant flow
Of the 111 subjects who entered the Treatment Phase of the study, 56 were randomized to the Placebo group and 55 were randomized to apremilast 30 mg BID (APR 30 BID group). As shown in Table 24. , 95 (85.6%) subjects completed the Treatment Phase. The proportion of subjects completing the Treatment Phase was higher in the APR 30 BID group (90.9%) than in the Placebo group (80.4%). The most common reason for discontinuing the study during the Treatment Phase was AE, 5 (8.9%) subjects in the Placebo group and 4 (7.3%) subjects in the APR 30 BID group. The proportion of subjects withdrawing for lack of therapeutic effect was higher in the Placebo group (5.4%) than from the APR 30 BID group (0%).
Table 24. Disposition of Subjects in the Phase 2 Study BCT-001 (Randomized Subjects)
Number (%) of Subjects
Subject Disposition
Placebo/ APR 30 BID N = 56
APR 30 BID/ APR 30 BID N = 55
Total N = 111
Placebo-controlled Treatment Phase (Baseline to Week 12) Entered 56 (100.0) 55 (100.0) 111 (100.0) Completed 45 (80.4) 50 (90.9) 95 (85.6) Discontinued study 11 (19.6) 5 (9.1) 16 (14.4) Reason for discontinuation Adverse event 5 (8.9) 4 (7.3) 9 (8.1) Lack of therapeutic effect 3 (5.4) 0 3 (2.7) Withdrew consent 1 (1.8) 0 1 (0.9) Protocol violation 1 (1.8) 1 (1.8) 2 (1.8) Other reason 1 (1.8) 0 1 (0.9) Active-treatment Phase (Week 12 to Week 24) Entered 45 (80.4) 50 (90.9) 95 (85.6) Completed 44 (78.6) 47 (85.5) 91 (82.0) Discontinued study 1 (1.8) 3 (5.5) 4 (3.6) Reason for discontinuation

Extension of indication variation assessment report EMA/135313/2020 Page 54/102
Number (%) of Subjects
Subject Disposition
Placebo/ APR 30 BID N = 56
APR 30 BID/ APR 30 BID N = 55
Total N = 111
Adverse event 1 (1.8) 3 (5.5) 4 (3.6) Observational Follow-up Phase Entered 54 (96.4) 54 (98.2) 108 (97.3) Completed 54 (96.4) 54 (98.2) 108 (97.3) APR 30 BID = apremilast 30 mg twice daily. Note: Subjects randomized to placebo during the Placebo-controlled Treatment Phase switched to APR 30 BID during the Active-treatment Phase (placebo/APR 30 BID). Subjects randomized to APR 30 BID during the Placebo-controlled Treatment Phase continued to receive apremilast during the Active-treatment Phase (APR 30 BID /APR 30 BID). Those who did not reduce dosage continued to receive apremilast 30 mg BID, while subjects who dose reduced to apremilast 20 mg BID continued to receive the reduced dosage during the Active-treatment Phase. Although on a reduced dosage, these subjects are counted in the APR 30 BID /APR 30 BID group.
Recruitment
The study was conducted in the USA (3 centers) and in Turkey (3 centers).
The study period was from 23 October 2009 (first patient enrolled) to 08 May 2012 (last patient completed).
Conduct of the study
Protocol violations were reported for 11 (9.9%) subjects, 8 (14.3%) subjects in the Placebo group and 3 (5.5%) subjects in the APR 30 BID group. The most common protocol violation was prohibited concomitant medication (8 subjects), which occurred more frequently in the Placebo group (7 subjects) than the APR 30 BID group (1 subject).Most subjects (93.7%) had at least one protocol deviation, 89.3% in the Placebo group and 98.2% in the APR 30 BID group. The most common protocol deviation was subject noncompliance with study drug (ie, missed an occasional dose of study drug, but were treatment compliant taking > 75% to ≤ 120% of intended study drug), 71.2% of subjects overall (64.3% in the Placebo group and 78.2% in the APR 30 BID group). Other protocol noncompliance was reported in 49.5% of subjects overall. The most common type of other protocol noncompliance was mishandled laboratory samples, 39.6% of subjects overall (33.9% in the Placebo group and 45.5% in the APR 30 BID group). The type and frequency of protocol deviations was generally similar across treatment group.
Baseline data
Demographics
The majority of subjects were female (69.4%) and white (97.3%). Median age was 34 (18 to 64) years. Body mass index was ≥ 25 for 65 (58.6%) subjects. The majority of subjects were enrolled in Turkish study sites (92.8%). The demographic characteristics of subjects at baseline were generally well balanced across treatment groups.
Clinical disease characteristics at baseline, including duration of BD, were generally similar across the randomized groups. Mean duration of BD in the study population overall was 5.33 years, 5.72 years in the Placebo group and 4.92 years in the APR 30 BID group. All subjects had oral ulcers at baseline.
88.3% of subjects had genital ulcers, 95.5% of subjects had skin lesions excluding oral and genital ulcers, 64.0% of subjects had arthralgia, 31.5% of subjects had arthritis, 3.6% of subjects had nausea/

Extension of indication variation assessment report EMA/135313/2020 Page 55/102
vomiting/ abdominal pain, 2.7% of subjects had diarrhoea/bleeding, 16.2% of subjects had uveitis, 1.8% of subjects had retinal vasculitis, 1.8% of subjects had CNS involvement, 0.9% of subjects had major vessel involvement, and 9.0% of subjects had other manifestations.
History of uveitis was recorded in 12 (21.4%) subjects in the Placebo group and 6 (10.9%) subjects in the APR 30 BID group; however, no subjects in either group had currently active uveitis. Other BD manifestations at baseline were generally well-balanced across treatment groups.
Numbers analysed
The ITT population was the primary population for all efficacy analyses for this study. The PP population was used for the sensitivity analysis of the primary endpoint. For the ITT and PP populations, subjects were included in the treatment group to which they were randomized.
Table 25. Number of Subjects Included in Data Sets Analysed
Analysis Population
Placebo/APR 30 BID (N=56) n (%)
APR 30 BID/ APR 30 BID (N=55) n (%)
Total (N=111) n (%)
Intent-to-treat populationa 56 (100) 55 (100) 111 (100)
Per-protocol populationb 48 (85.7) 52 (94.5) 100 (90.1)
Safety populationc 56 (100) 55 (100) 111 (100)
Apremilast subjects as treatedd 45 (80.4) 55 (100) 100 (90.1)
APR 30 BID = apremilast 30 mg BID; BID = twice daily. a The intent-to-treat (ITT) population was defined as all randomized subjects with at least one oral ulcer evaluation (including the baseline evaluation). b The per-protocol (PP) population was defined as all randomized subjects who received at least one dose of study drug, had a baseline and at least 1 posttreatment oral ulcer evaluation, and had no major protocol violations that could substantially affect the results of the primary efficacy endpoint. c The safety population was defined as all subjects who were randomized and received at least one dose of study drug. d The apremilast subjects as treated (AAT) population included all subjects who were randomized (at the randomization visit) or switched (at the Day 85 visit) to apremilast APR 30 BID, and received at least one dose of apremilast after the initial randomization or switch to APR 30 BID.
Outcomes and estimation
Primary endpoint
In the primary analysis (ITT population; LOCF), statistically significantly fewer oral ulcers were observed at Day 85 in the APR 30 BID group compared with the Placebo group. The mean oral ulcer counts at baseline were 2.7 and 2.9 in the APR 30 BID and Placebo groups, respectively. On Day 85, the LS mean ulcer counts were 0.4 and 2.0 in the APR 30 BID and Placebo groups, respectively, yielding a LS mean difference (95% CI) of -1.6 (-2.4, -0.9) (p < 0.0001).
Similar results were observed in the planned sensitivity analyses: PP population (p < 0.0001) and subjects who were Day 85 completers (p = 0.0004).
In each of 3 additional sensitivity analyses, which were not pre planned, nominal p-values showed
statistically significantly fewer oral ulcers at Day 85 in the APR 30 BID group compared with the Placebo
group.

Extension of indication variation assessment report EMA/135313/2020 Page 56/102
Table 26. Summary of Oral Ulcer Count at Day 85: Primary Analysis and Planned Sensitivity Analyses.
Placebo APR 30 BID
ITT Population; LOCF
na 56 55
Baseline mean (SD) 2.9 (1.12) 2.7 (0.84)
Day 85 mean (SD) 2.1 (2.58) 0.5 (1.03)
Analysisb
LS mean (SE) 2.0 (0.28) 0.4 (0.28)
2-sided 95% CI for LS mean (1.5, 2.6) (0.0, 1.0)
Difference [apremilast – placebo] in LS means (2-sided 95% CI) - -1.6 (-2.4, -0.9)
2-sided p-value - < 0.0001
PP Population; LOCF (sensitivity analysis)
na 48 52
Baseline mean (SD) 3.0 (1.16) 2.7 (0.83)
Day 85 mean (SD) 2.2 (2.67) 0.4 (0.72)
Analysisb
LS mean (SE) 2.1 (0.29) 0.3 (0.29)
2-sided 95% CI for LS mean (1.5, 2.7) (0.0, 0.8)
Difference [apremilast – placebo] in LS means (2-sided 95% CI) - -1.8 (-2.6, -1.0)
2-sided p-value - < 0.0001
Day 85 Completers (sensitivity analysis)c
na 45 49
Baseline mean (SD) 3.0 (1.14) 2.7 (0.86)
Day 85 mean (SD) 2.1 (2.80) 0.5 (1.08)
Analysisb
LS mean (SE) 2.1 (0.33) 0.5 (0.32)
2-sided 95% CI for LS mean (1.4, 2.7) (0.0, 1.1)
Difference [apremilast – placebo] in LS means (2-sided 95% CI) - -1.6 (-2.5, -0.8)
2-sided p-value - 0.0004
APR 30 BID = apremilast 30 mg BID; ANCOVA = analysis of covariance; BID = twice daily; CI = confidence interval; ITT = intent to treat; LOCF = last observation carried forward; LS = least squares; PP = per protocol; SD = standard deviation; SE = standard error of the mean a Subjects with a baseline value and at least one postbaseline value were included. b Based on an ANCOVA model for the number of ulcers at Day 85, with treatment group and gender as factors and the baseline ulcer number as a covariate. The lower limit of 95% CI of LS-mean was displayed as (0.0) if the estimate was negative from the model. c Subjects with a baseline value and Day 85 assessment were included
Secondary endpoints
Oral Ulcer Response
Oral ulcer response from Day 1 to Day 85 was defined as the proportion of subjects who were oral ulcer-free (complete response) or whose oral ulcers were reduced by ≥ 50%, including oral ulcer-free (partial

Extension of indication variation assessment report EMA/135313/2020 Page 57/102
response). In the ITT population using the LOCF approach, a significantly greater proportion of subjects in the APR 30 BID group achieved complete or partial oral ulcer responses at Day 85 compared with the Placebo group (p < 0.0001, Table 27. ).
In the two sensitivity analyses (non-responder analysis and analysis on PP population), a significantly greater proportion of subjects in the APR 30 BID group achieved complete or partial oral ulcer responses at Day 85 compared with the Placebo group (p < 0.0001).
Table 27. Oral Ulcer Response at Day 85 in Phase 2 Study BCT-001 (ITT Population; LOCF)
ITT Population; LOCF
Placebo (N=56) APR 30 BID (N=55)
Subjects with complete response, n (%)a 16 (28.6) 39 (70.9)
Subjects with an ulcer response (partial response), n (%)b 28 (50.0) 49 (89.1)
Treatment comparison (apremilast – placebo)
Unadjusted difference in proportions (%) - 39.1
Adjusted Difference in Proportions (%)c - 39.1
2-sided 95% CI for adjusted difference (%)c - (23.6, 54.5)
2-sided p-valued - < 0.0001
APR 30 BID = apremilast 30 mg twice daily; CI = confidence interval; CMH = Cochran-Mantel-Haenszel; ITT = intent-to-treat; LOCF = last observation carried forward. a Subjects who were oral ulcer-free. b Subjects whose oral ulcers were reduced by ≥ 50% from Baseline to Week 12, including oral ulcer-free. c Adjusted difference in proportions = weighted average of treatment differences across sex with the CMH weights. Two-sided 95% CI was based on a normal approximation to the weighted average.
AUC for Oral Ulcer Count from Day 1 to Day 85
The AUC85 for oral ulcer count was more than 2-fold lower in the APR 30 BID group (59.90) compared with the Placebo group (155.48) (Table 28. ). Similarly, the average daily AUC from Day 1 to Day 85 was more than 2-fold lower in the APR 30 BID group (0.71) compared with the Placebo group (1.85) (Table 28. ).
Table 28. Area Under the Curve for Number of Oral Ulcers from Day 1 to Day 85 in Phase 2 Study BCT-001 (ITT Population; LOCF)
Placebo (N=56) APR 30 BID (N=55)
n 56 55
Baseline mean (SD) 2.9 (1.12) 2.7 (0.84)
Total AUC (#ulcers*days)a
Mean (SD) 155.48 (96.058) 59.90 (93.530)
Analysisb,c
LS mean (SE) 157.82 (12.890) 67.74 (13.267)
2-sided 95% CI for LS mean (132.26, 183.37) (41.44, 94.04)
Difference [apremilast – placebo] in LS means (2-sided 95% CI)
- -90.07 (-125.32, -54.82)

Extension of indication variation assessment report EMA/135313/2020 Page 58/102
2-sided p-value - < 0.0001
Average daily AUC (#ulcers*days)
Mean (SD) 1.85 (1.144) 0.71 (1.113)
APR 30 BID = apremilast 30 mg BID; AUC = area under the ulcer-time curve; ANCOVA = analysis of covariance; BID = twice daily; ITT = intent to treat; LOCF = last observation carried forward; SD = standard deviation a The last postbaseline observation was carried forward to Day 85 for subjects who discontinued the study before Day 85. For subjects who didn't have Day 85 Visit on the targeted date, the total AUC is adjusted by the actual study days. b Analysis was not preplanned. c Based on an ANCOVA model for the total AUC, with treatment group and gender as factors and the baseline ulcers number as a covariate.
Average Number of Oral Ulcers From Day 1 to Day 85
The average number of ulcers from Day 1 to Day 85 was more than 2-fold lower in the APR 30 BID group (0.85) compared with the Placebo group (1.96).
Oral Ulcer Count by Visit
In subjects treated with apremilast (APR 30 BID group), mean oral ulcer counts decreased, reaching maximum reduction at the time of the first postbaseline assessment on Day 15, and remained reduced throughout the placebo-controlled Treatment Phase (Weeks 2 to 12) (Figure 10. ). In apremilast-treated subjects who continued in the Extension Phase (APR 30 BID/APR 30 BID group), mean oral ulcer counts remained reduced throughout the treatment period (Weeks 12 to 24).
Figure 10. Mean Number of Oral Ulcers by Time Point in Phase 2 Study BCT-001 (ITT Population)
30 mg BID = APR 30 BID = apremilast 30 mg twice daily; ITT = intent-to-treat; wk = week. Subjects received placebo or APR 30 BID during the Placebo-controlled Treatment Phase (Weeks 0-12). During the Active-treatment Phase (Weeks 12 to 24), subjects in the APR 30 BID group continued to receive apremilast and
wk0 wk2 wk4 wk6 wk8 wk10 wk12 wk14 wk16 wk18 wk20 wk22 wk24 wk26 wk2856 56 53 51 44 42 45 45 36 45 36 34 45 38 5455 55 50 53 48 47 50 49 41 49 38 37 47 40 54
Placebo 2.9 1.7 1.9 1.9 1.6 1.4 2.1 0.4 0.4 0.6 0.5 0.3 0.4 1.3 1.630 mg BID 2.7 0.3 0.7 0.5 0.5 0.7 0.5 0.6 0.6 0.6 0.7 0.2 0.6 1.9 1.7
0.0
0.5
1.0
1.5
2.0
2.5
3.0
3.5
Mea
n N
umbe
r of O
ral U
lcer
s
All subjects in the Placebo group switched to apremilast at the Week 12/Day 85 visit.
All subjects in the Placebo group switched to apremilast at the Week 12/Day 85 visit.

Extension of indication variation assessment report EMA/135313/2020 Page 59/102
subjects in the placebo group switched to APR 30 BID. Treatment was stopped at the end of the Active-treatment Phase (Week 24), and all subjects (including early dropouts in either the Placebo-controlled Treatment Phase or Active-treatment Phase) were followed in the Observational Follow-up Phase (Weeks 25 to 28).
Oral Ulcer Pain VAS
At Day 85, there was a more than 2-fold greater decrease in VAS score (indicating decreased pain) in the APR 30 BID group (-44.7) compared with the Placebo group (-16.0) (Table 29. ). In subjects treated with apremilast (APR 30 BID group), VAS score decreased sharply, reaching near maximum reduction at the time of the first post baseline assessment on Day 15, and remained reduced throughout the Treatment Phase (Weeks 2 to 12) and into the extension phase (Weeks 12 to 24) (Figure 11. ). Placebo subjects who switched to apremilast in the Extension Phase (Placebo/APR 30 BID group) experienced a mean reduction in oral ulcer pain VAS score that was similar to that observed in the APR 30 BID group (Figure 11. ).
Table 29. Summary of Oral Ulcer Pain VAS at Day 85 in Phase 2 Study BCT-001 (ITT Population; LOCF)
VAS Score Placebo N = 56
APR 30 BID N = 55
na 56 55 Baseline mean (SD) 51.7 (22.64) 54.3 (26.17) Day 85 mean (SD) 35.7 (30.15) 9.6 (16.27) Mean change (SD) from baseline at Week 12 -16.0 (32.54) -44.7 (24.30) Analysisb,c LS mean (SE) at Week 12 36.7 (3.23) 9.9 (3.30) 2-sided 95% CI for LS mean (30.0, 43.1) (3.4, 16.5) Difference [apremilast – placebo] in LS means (2-sided 95% CI)
-26.8 (-35.5, -18.0)
2-sided p-value < 0.0001d
ANCOVA = analysis of covariance; APR 30 BID = apremilast 30 mg twice daily; CI = confidence interval; ITT = intent-to-treat; LOCF = last observation carried forward; SD = standard deviation; SE = standard error; VAS = visual analog scale. a Subjects with a baseline value and at least one postbaseline value were included. b Analysis was post hoc. c Based on an ANCOVA model for the oral ulcer pan VAS at Day 85, with treatment group and sex as factors and the baseline oral ulcer pan VAS as a covariate. d P-values in italics are ≤ 0.050 and considered nominally significant, because no multiplicity adjustment was applied. Note: Higher VAS scores = greater pain

Extension of indication variation assessment report EMA/135313/2020 Page 60/102
Figure 11. Mean Oral Ulcer Pain Score by Time Point in Phase 2 Study BCT-001 (ITT Population)
30 mg BID = APR 30 BID = apremilast 30 mg twice daily; ITT = intent-to-treat; VAS = visual analog scale; wk = week. Subjects received placebo or APR 30 BID during the Placebo-controlled Treatment Phase (Weeks 0-12). During the Active-treatment Phase (Weeks 12 to 24), subjects in the APR 30 BID group continued to receive apremilast and subjects in the placebo group switched to apremilast APR 30 BID. Treatment was stopped at the end of the Active-treatment Phase (Week 24), and all subjects (including early dropouts in either the Placebo-controlled Treatment Phase or Active-treatment Phase) were followed in the Observational Follow-up Phase (Weeks 25 to 28).
Genital Ulcers
Due to the small number of enrolled subjects with genital ulcers at baseline (6 in the Placebo group and 10 in the APR 30 BID group), a treatment-group comparison of the number of genital ulcers at Day 85 was not considered meaningful. However, a complete genital ulcer response, defined as being genital ulcer-free, at Day 85 was achieved by all 10 (100%) subjects with baseline lesions in the APR 30 BID group versus 3 (50.0%) subjects with baseline lesions in the Placebo group.
Behçet’s Disease Current Activity Index
The Behçet’s Disease Current Activity Index consists of three component scores, a patient’s perception of disease activity, a clinician’s overall perception of disease activity, and a Behçet’s Disease Current Activity Index score. The Behçet’s Disease Current Activity index score ranges from 0 to 12. A higher score indicates higher level of disease activity (worsening), and a negative change from baseline indicates improvement.
At the end of the placebo-controlled Treatment Phase (Day 85), there was a greater reduction (improvement) from baseline in mean scores in the APR 30 BID group compared with the Placebo group. At the end of the Extension Phase (Day 169), mean scores remained reduced in apremilast-treated subjects (APR 30 BID/APR 30 BID group).
wk0 wk2 wk4 wk6 wk8 wk10 wk12 wk14 wk16 wk18 wk20 wk22 wk24 wk26 wk2856 56 53 51 44 42 45 45 36 45 36 34 45 38 5455 55 50 53 48 47 51 49 41 49 38 37 47 40 54
Placebo 51.7 29.8 37.4 36.7 30.7 23.5 35.0 7.9 7.9 7.3 7.2 6.6 9.6 17.2 21.030 mg BID 54.3 12.0 10.2 10.5 13.0 8.8 9.4 9.9 5.8 7.1 8.1 3.4 9.7 23.2 27.2
0.0
10.0
20.0
30.0
40.0
50.0
60.0
Mea
n O
ral U
lcer
Pai
n VA
S
All subjects in the Placebo group switched to apremilast at the Week 12/Day 85 visit.

Extension of indication variation assessment report EMA/135313/2020 Page 61/102
Table 30. Summary of Behçet’s Current Disease Activity Index Scores by Visit (ITT Population; LOCF)
Placebo/APR 30 BID (N=56)
APR 30 BID/APR 30 BID (N=55)
Behçet’s Disease Current Activity Index Score
na 55 54
Baseline mean (SD) 2.5 (1.12) 3.4 (1.63)
Day 85 mean (SD) 2.5 (1.44) 2.0 (1.72)
Mean change (SD) from baseline -0.1 (1.51) -1.5 (1.84)
Analysisb,c
LS mean (SE) -0.1 ( 0.22) -1.2 ( 0.22)
2-sided 95% CI for LS mean (-0.6, 0.3) (-1.7, -0.8)
Difference [apremilast – placebo] in LS - -1.1 (-1.7, -0.5)
2-sided p-value - 0.0007
Day 169
n 45 49
Mean (SD) 1.4 (1.18) 1.6 (1.62)
Mean change (SD) from baseline -1.2 (1.41) -2.0 (2.04)
Day 197
n 54 54
Mean (SD) 2.0 (0.97) 2.3 (1.77)
Patient’s perception of disease activity
Baseline
n 55 55
Mean (SD) 3.8 (1.42) 4.2 (1.33)
Day 85
n 56 55
Mean (SD) 3.7 (1.71) 2.3 (1.22)
Change (SD) from baseline
n 55 55
Mean (SD) -0.1 (1.78) -2.0 (1.68)
Day 169
n 45 49
Mean (SD) 2.1 (1.32) 2.2 (1.24)
Change (SD) from baseline
n 44 48
Mean (SD) -1.2 (1.41) -2.0 (2.04)
Day 197
n 54 54
Mean (SD) 2.9 (1.16) 3.2 (1.70)
Clinician’s overall perception of disease activity

Extension of indication variation assessment report EMA/135313/2020 Page 62/102
Baseline
n 56 54
Mean (SD) 3.3 (1.19) 3.5 (1.28)
Day 85
n 56 55
Mean (SD) 3.1 (1.63) 1.8 (0.90)
Change (SD) from baseline
n 56 54
Mean (SD) -0.2 (1.66) -1.7 (1.49)
Day 169
n 45 49
Mean (SD) 1.6 (1.06) 1.7 (0.88)
Change (SD) from baseline
n 45 48
Mean (SD) -1.6 (1.45) -1.8 (1.38)
Day 197
n 54 54
Mean (SD) 2.5 (0.82) 2.7 (1.53)
APR 30 BID = apremilast 30 mg BID; ANCOVA = analysis of covariance; BID = twice daily; CI = confidence interval; ITT = intent to treat; LOCF = last observation carried forward; LS = least squares; SD = standard deviation; SE = standard error of the mean. a Subjects with a baseline value and at least one postbaseline value were included. b Analysis was not preplanned. b Based on an ANCOVA model for the change from baseline with treatment group, gender, and interaction of treatment group and gender as factors and the baseline value as a covariate. Notes: The Behçet’s Disease Current Activity index score ranges from 0 to 12. A higher score indicates higher level of disease activity (worsening), and a negative change from baseline indicates improvement. Subjects 0031004 in Placebo group and 0041001 in APR 30 BID group were missing activity index scores at baseline. They are not included in this table. For Day 169 LOCF, values on or before Day 85 are not carried forward. Day 197 includes subjects who entered the Observational Follow-up Phase from either the Treatment Phase or the Extension Phase.
Behçet’s Disease Quality of Life Questionnaire
The BD QoL total score ranges from 0 to 30, with 0 representing no influence of BD on a subject’s QoL and 30 representing the greatest influence. A negative change from baseline indicates improvement. At the end of the placebo-controlled Treatment Phase (Day 85), BD QoL mean scores were significantly reduced (improved) from baseline in the APR 30 BID group compared with the Placebo group (p = 0.0397), despite a perceived greater influence of BD on QoL at baseline in the APR 30 BID group than the Placebo group.
At the end of the Extension Phase (Day 169), the BD QoL mean score was further reduced in apremilast-treated subjects (APR 30 BID/APR 30 BID group) who continued in the Extension Phase. In subjects who received placebo during the treatment Phase and switched to apremilast (Placebo/APR 30 BID group), the BD QoL mean score was reduced at the end of the Extension phase relative to baseline, similar to that observed in the APR 30 BID group.

Extension of indication variation assessment report EMA/135313/2020 Page 63/102
Table 31. Summary of Behçet’s Disease Quality of Life Questionnaire in Phase 2 Study BCT-001 (ITT Population; LOCF)
Visit
Placebo / APR 30 BID N = 56
APR 30 BID / APR 30 BID N = 55
Baseline Mean (SD) 10.5 (8.47) 12.6 (8.28) Week 12 na 56 55 Mean (SD) 8.9 (9.00) 8.1 (9.61) Mean (SD) change from baseline -1.6 (5.30) -4.5 (7.61) Analysisb LS mean (SE) change from baseline -1.8 (0.86) -4.3 (0.86) 2-sided 95% CI for LS mean (-3.5, -0.1) (-6.0, -2.6) Difference [apremilast – placebo] in LS means (2-sided 95% CI)
-2.5 (-5.0, -0.1)
2-sided p-value 0.0397c Week 24 na 45 49 Mean (SD) 7.8 (8.17) 7.1 (8.74) Mean change (SD) from baseline -3.9 (7.24) -5.5 (7.36) ANCOVA = analysis of covariance; APR 30 BID = apremilast 30 mg twice daily; BD = Behçet’s disease; BD QoL = Behçet’s Disease Quality of Life Questionnaire; CI = confidence interval; ITT = intent-to-treat; LOCF = last observation carried forward; LS = least squares; SD = standard deviation; SE = standard error. a Subjects with a baseline value and at least one postbaseline value were included. b Based on an ANCOVA model for the change from baseline with treatment group as a factor and the baseline value as a covariate. c P-values in italics are ≤ 0.050 and considered nominally significant, because no multiplicity adjustment was applied. Note: The BD QoL total score ranges from 0-30, with 0 representing no influence of BD on a subject’s quality of life and 30 representing the greatest influence. A negative change from baseline indicates improvement. For Day 169 LOCF, values on or before Day 85 are not carried forward.
Behçet’s Disease Multidimensional Health Assessment Questionnaire (MDHAQ)
The BD MDHAQ total score ranges from 0 to 100, with a higher score indicating a higher level of disease activity. A negative change from baseline indicates improvement.
At baseline, BD MDHAQ mean scores were similar in the 2 treatment groups. At the end of the placebo-controlled Treatment Phase (Day 85), BD MDHAQ mean scores were significantly reduced (improved) from baseline in the APR 30 BID group compared with the Placebo group (p < 0.0001). At the end of the Extension Phase (Day 169), mean change from baseline in BD MDHAQ score in the apremilast-treated subjects who continued in the Extension Phase (APR 30 BID/APR 30 BID group) was further reduced from the level observed at Day 85.
Table 32. Summary of Behçet’s Disease Multidimensional Health Assessment Questionnaire (ITT Population; LOCF)
Placebo/APR 30 BID (N=56)
APR 30 BID/APR 30 BID (N=55)
Day 85

Extension of indication variation assessment report EMA/135313/2020 Page 64/102
na 56 55
Baseline mean (SD) 35.60 (12.211) 37.80 (16.558)
Day 85 mean (SD) 29.62 (16.695) 16.61 (14.239)
Mean change (SD) from baseline -5.98 (18.178) -21.19 (17.892)
Analysisb
LS mean (SE) -6.75 (2.003) -20.41 (2.021)
2-sided 95% CI for LS mean (-10.72, -2.77) (-24.42, -16.41)
Difference [apremilast – placebo] in LS means (2-sided 95% CI)
- -13.67 (-19.32, -8.02)
2-sided p-value - < 0.0001
Day 169
na 45 49
Day 169 mean (SD) 13.81 (14.774) 15.97 (14.683)
Mean change (SD) from baseline -22.01 (19.146) -22.26 (18.909)
APR 30 BID = apremilast 30 mg BID; ANCOVA = analysis of covariance; BID = twice daily; CI = confidence interval; ITT = intent to treat; LOCF = last observation carried forward; LS = least squares; SD = standard deviation; SE = standard error of the mean. a Subjects with a baseline value and at least one postbaseline value were included. b Based on an ANCOVA model for the change from baseline with treatment group as a factor and the baseline value as a covariate. Note: The BD MDHAQ total score ranges from 0-100, with a higher score indicating a higher level of disease activity. A negative change from baseline indicates improvement.
Medical Outcome Study Short Form 36-Item health Survey
At the end of the placebo-controlled Treatment Phase (Day 85), the Physical Component Summary mean scores were significantly higher relative to baseline (improved functioning) in the APR 30 BID group compared with the Placebo group (p = 0.0011).
At the end of the Extension Phase (Day 169), mean change from baseline in the Physical Component Summary score in the apremilast-treated subjects who continued in the Extension Phase (APR 30 BID/APR 30 BID group) remained improved.
Summary of main studies
The following tables summarise the efficacy results from the main studies supporting the present application. These summaries should be read in conjunction with the discussion on clinical efficacy as well as the benefit risk assessment (see later sections).

Extension of indication variation assessment report EMA/135313/2020 Page 65/102
Table 33. Summary of efficacy for trial CC-10004-BCT-002 (Pivotal Phase 3)
Title: A Phase 3, Multicenter, Randomized, Double-blind, Placebo-controlled Parallel Group Study,
followed by an Active-Treatment Phase to Evaluate the Efficacy and Safety of Apremilast (CC-
10004) in the Treatment of Subjects with Active Behçet’s Disease.
Study identifier CC-10004-BCT-002
Design The study consists of a Screening Phase of up to 6 weeks; a 12-week
Double-blind Placebo-controlled Treatment Phase; a 52-week Active
Treatment Phase; an optional Open-label Extension Phase; and a 4-
week Posttreatment Observational Follow-up Phase.
Duration of main phase: 12 weeks (placebo-controlled phase)
Duration of Run-in phase: 6 weeks
Duration of Extension phase: The 12-week placebo-controlled phase
was followed by an active treatment
period in which all subjects were to be
treated up to 52 weeks.
An optional Open-label extension Phase
was available in Germany only until
apremilast is commercially available for
BD or until the benefit/risk of
apremilast is found not to be acceptable
for BD, according to either the sponsor
or health authority.
Hypothesis Superiority
Treatments groups
Apremilast 30mg BID
N=104
Placebo N=103
Endpoints and
definitions
Primary
endpoint Area under the curve (AUC) for the number of oral ulcers
from baseline through Week 12
Secondary
endpoint • Change from baseline in the pain of oral ulcers as
measured by VAS at Week 12
• Change from Baseline in Behçet’s Syndrome
Activity Score (BSAS) at Week 12
• Change from baseline in disease activity as
measured by Behçet’s Disease Current Activity
scores (BD Current Activity Form) at Week 12

Extension of indication variation assessment report EMA/135313/2020 Page 66/102
• Proportion of subjects achieving an oral ulcer
complete response (oral ulcer-free) by Week 6 and
remaining oral ulcer free at every visit for at least 6
additional weeks during the Placebo-controlled
Treatment Phase
• Time to oral ulcer resolution (complete response),
ie, the first instance when a subject had a complete
response during the Placebo-controlled Phase
• Oral ulcer complete response rate at Week 12
• Change from baseline in the BD QoL score at Week
12
• Complete response rate for genital ulcers at Week
12 for subjects who had genital ulcers at baseline
• Proportion of subjects with no oral ulcers following
a complete response (ie, the first time when a
subject has a complete response) during the
Placebo-controlled Treatment Phase
• Time to recurrence of oral ulcers following loss of
complete response (ie, the first instance when a
subject has a reappearance of oral ulcers following
a complete response) during the Placebo-controlled
Treatment Phase
• Number of oral ulcers following loss of complete
response (ie, the first instance when a subject has
a reappearance of oral ulcers following a complete
response) during the Placebo-controlled Treatment
Phase
• Change from baseline in the total score of the
Static PGA of skin lesions (acne-like lesions,
folliculitis, and erythema nodosum) of BD at Week
12 in subjects who had BD skin lesions at baseline

Extension of indication variation assessment report EMA/135313/2020 Page 67/102
• Change from baseline in the pain of genital ulcers
as measured by VAS at Week 12 in subjects who
had genital ulcers at baseline
Database lock 23 October 2018
Results and Analysis
Analysis description The analysis of the primary endpoint was based on an analysis of
covariance (ANCOVA) model for the AUC of the number of oral ulcers
through week 12 (Day 85), with treatment group, gender and region
as factors and the baseline oral ulcers number as a covariate. Multiple
imputation (MI) method was used to impute missing oral ulcer counts.
Analysis population
and time point
description
Intent to treat
Week-12 (Day 85)
Primary endpoint
Descriptive statistics
and estimate
variability
Treatment group Placebo
APR 30 mg
BID
Number of subjects N=103 N=104
AUC for the number of oral
ulcers from baseline through
Week 12
Least squares mean (LS
mean)
222.14 129.54
Standard error 15.886 15.943
Secondary endpoints
Change from baseline in the
pain of oral ulcers as
measured by VAS at Week
12
(LS mean)
-15.9 -40.7
Standard error 3.31 3.34
Change from baseline in
BSAS at Week 12 (LS mean) 5.41 -17.35
Standard error 1.776 1.796

Extension of indication variation assessment report EMA/135313/2020 Page 68/102
Change from baseline
BDCAF score at Week 12
Behçet’s Disease Activity
Index Score (LS mean, SE)
Patient’s Perception of
Disease Activity (LS mean,
SE)
Clinician’s Overall Perception
of Disease Activity (LS
mean, SE)
-0.4 (0.20)
-0.7 (0.18)
-0.7 (0.17)
-0.9 (0.20)
-1.7 (0.18)
-1.6 (0.17)
Proportion of subjects
achieving an oral ulcer
complete response (oral
ulcer-free) by Week 6 and
remaining oral ulcer free at
every visit for at least 6
additional weeks during the
Placebo-controlled
Treatment Phase
4.9% 29.8%
Standard error 2.13% 4.48%
Time to oral ulcer resolution
(complete response), ie, the
first instance when a subject
had a complete response
during the Placebo controlled
Phase
(median time in weeks)
8.1
2.1
Median in Weeks (2-sided
95% CI) 4.7, NA 2.0, 4.0
Oral ulcer complete
response rate at Week 12 22.3% 52.9%
Standard error 4.10% 4.89%
Effect estimate per
comparison
AUC for the number of oral
ulcers from baseline through
Week 12
Comparison groups APR 30 mg
BID vs
Placebo

Extension of indication variation assessment report EMA/135313/2020 Page 69/102
Adjusted treatment
difference of mean
Difference in LS Means -92.60
2-sided 95% CI -130.59, -
54.60
P-value <0.0001
Change from baseline in the
pain of oral ulcers as
measured by VAS at Week
12
Adjusted treatment
difference of mean
Difference in LS Means -24.80
2-sided 95% CI -32.8, -16.8
P-value <0.0001
Change from baseline in
BSAS at Week 12
Difference in LS Means -11.94
2-sided 95% CI -16.20, -
7.67
P-value < 0.0001
Change from baseline
BDCAF score at Week 12
Behçet’s Disease Current
Activity Index Score
Difference in LS Means -0.5
2-sided 95% CI -1.0, 0.0
P-value 0.0335
Patient’s Perception of
Disease Activity
Difference in LS Means -1.0
2-sided 95% CI -1.4, -0.6
P-value < 0.0001
Clinician’s Overall Perception
of Disease Activity
Difference in LS Means -0.9
2-sided 95% CI -1.3, -0.5
P-value < 0.0001
Proportion of subjects
achieving an oral ulcer
complete response (oral
ulcer-free) by Week 6 and
remaining oral ulcer free at
every visit for at least 6
additional weeks during the
Placebo-controlled
Treatment Phase
Adjusted Difference in
Proportions (%)
25.1
2-sided 95% CI 15.5, 34.6
P-value < 0.0001
Time to oral ulcer resolution
(complete response), ie, the
first instance when a subject
had a complete response
during the Placebo controlled
Phase
(median time in weeks)
hazard ratio 2.4
2-sided 95% CI 1.692,
3.405
P-value < 0.0001

Extension of indication variation assessment report EMA/135313/2020 Page 70/102
Oral ulcer complete
response rate at Week 12
Adjusted Difference in
Proportions (%)
30.6
2-sided 95% CI 18.1, 43.1
P-value < 0.0001
Notes Additional analyses evaluating oral ulcer and quality of life support the
results of primary and other secondary endpoints. The greater
reduction in the number of oral ulcers paralleled the reduction in the
pain of oral ulcers in the APR 30 BID treatment group, compared with
the placebo treatment group, was observed at every visit, as early as
Week 1 and sustained through Week 12. The greater improvements in
SF-36 PCS and MCS scores and Physical Functioning scale was
observed in the APR 30 BID treatment group compared with the
placebo treatment group BDQoL.
Table 34. Summary of efficacy for trial CC-10004-BCT-001 (Supportive Phase 2)
Title: A Phase 2, Multi-Center, Randomized, Double-Blind, Placebo-Controlled, Parallel-Group Study
Followed By An Active-Treatment Extension To Evaluate The Efficacy And Safety Of Apremilast (Cc-
10004) In The Treatment Of Behçet Disease
Study identifier CC-10004-BCT-001
Design The study consists of a Screening Phase of up to 6 weeks; a 12-week
Double-blind Placebo-controlled Treatment Phase; a 52-week Active
Treatment Phase; an optional Open-label Extension Phase; and a 4-week
Posttreatment Observational Follow-up Phase.
Duration of main phase: Days 1 to Week 12(Day 85) (Treatment
Phase)
Duration of Extension phase: Week 12 (Days 85) to Week 24 (Day 169)
Hypothesis Superiority
Treatments groups
Apremilast 30mg BID N=55
Placebo N=56
Endpoints and
definitions
Primary
endpoint Number of oral ulcers at week 12 (Day 85)
Secondary
endpoints • Ulcer response (proportion of subjects who were oral
ulcer-free (complete response), or whose oral ulcers
were reduced by ≥ 50% (partial response) from Day 1
to Week 12 (Day 85)
• Changes from baseline in the pain of oral ulcers, as
measured by VAS at Week 12 (Day 85)
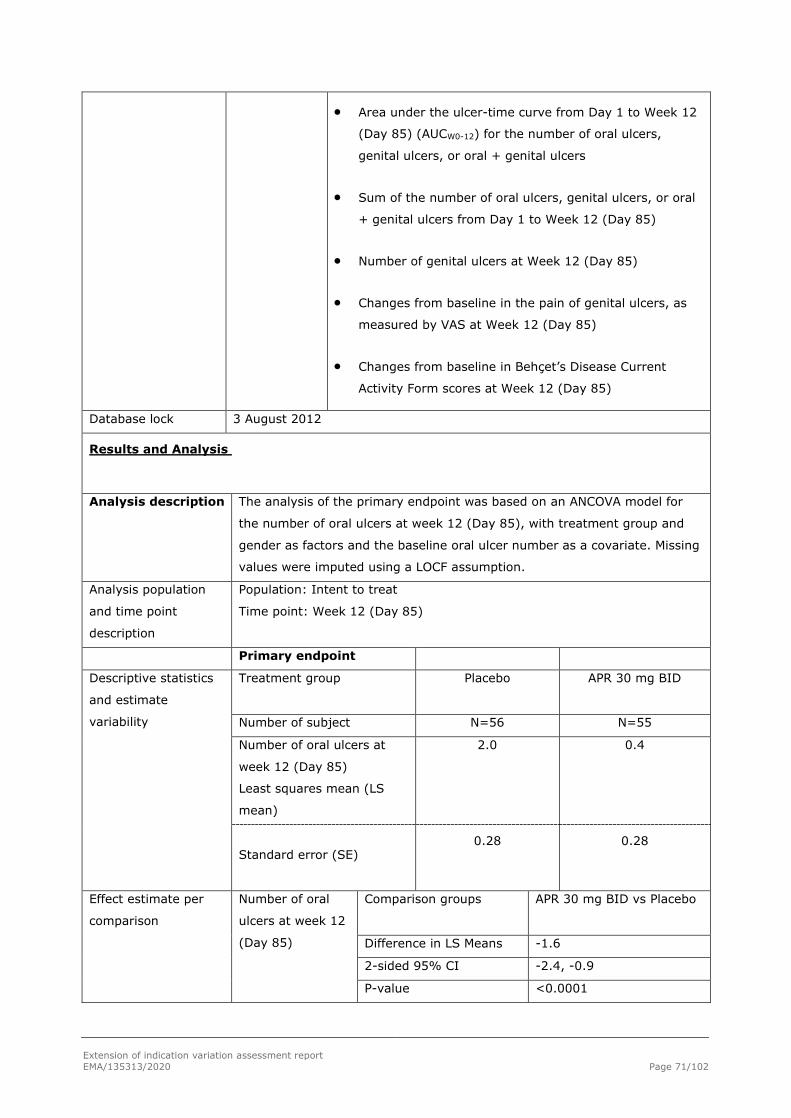
Extension of indication variation assessment report EMA/135313/2020 Page 71/102
• Area under the ulcer-time curve from Day 1 to Week 12
(Day 85) (AUCW0-12) for the number of oral ulcers,
genital ulcers, or oral + genital ulcers
• Sum of the number of oral ulcers, genital ulcers, or oral
+ genital ulcers from Day 1 to Week 12 (Day 85)
• Number of genital ulcers at Week 12 (Day 85)
• Changes from baseline in the pain of genital ulcers, as
measured by VAS at Week 12 (Day 85)
• Changes from baseline in Behçet’s Disease Current
Activity Form scores at Week 12 (Day 85)
Database lock 3 August 2012
Results and Analysis
Analysis description The analysis of the primary endpoint was based on an ANCOVA model for
the number of oral ulcers at week 12 (Day 85), with treatment group and
gender as factors and the baseline oral ulcer number as a covariate. Missing
values were imputed using a LOCF assumption.
Analysis population
and time point
description
Population: Intent to treat
Time point: Week 12 (Day 85)
Primary endpoint
Descriptive statistics
and estimate
variability
Treatment group Placebo
APR 30 mg BID
Number of subject N=56 N=55
Number of oral ulcers at
week 12 (Day 85)
Least squares mean (LS
mean)
2.0 0.4
Standard error (SE)
0.28 0.28
Effect estimate per
comparison
Number of oral
ulcers at week 12
(Day 85)
Comparison groups APR 30 mg BID vs Placebo
Difference in LS Means -1.6
2-sided 95% CI -2.4, -0.9
P-value <0.0001

Extension of indication variation assessment report EMA/135313/2020 Page 72/102
Notes Additional analyses evaluating oral ulcer (oral ulcer pain, complete
and partial response rate, and AUCW0-12), disease activity (BSAS and
BDCAI) and quality of life (BDQoL and SF36 PCS and Physical
Functioning Scale) support the results of primary endpoint.
Analysis performed across trials (pooled analyses and meta-analysis)
Both the pivotal Phase 3 study BCT-002 and the supportive Phase 2 study BCT-001 met their respective primary endpoint, as well as multiple secondary endpoints relating to the improvement in oral ulcers, BD disease activity, and QOL, as demonstrated by statistically or significant results favouring apremilast over placebo in both studies.
Table 35. Efficacy Comparison Between Pivotal Phase 3 Study BCT-002 and Supportive Phase 2 Study BCT-001
Placebo APR 30 BID Endpoint Study (Analysis Method)
LS Mean or n/N (%)
LS Mean or n/N (%)
Treatment Differencea
2-sided P-valueb
AUCW0-12 for the Number of Oral Ulcers BCT-002 (MI) (Primary Endpoint)
222.14 129.54 -92.60 < 0.0001
BCT-002 (LOCF) 240.17 136.05 -104.12 < 0.0001 BCT-001 (LOCF) 157.82 67.74 -90.07 < 0.0001 Number of Oral Ulcers at Week 12 BCT-002 (MI) 2.04 1.06 RR = 0.52 0.0003 BCT-002 (LOCF) 2.4c 1.3c -1.1c NA BCT-001 (LOCF) (Primary Endpoint)
2.0 0.4 -1.6 < 0.0001
Change From Baseline in the Oral Ulcer Pain Score at Week 12 BCT-002 (LOCF) -15.9 -40.7 -24.8 < 0.0001 BCT-001 (LOCF) -16.0c -44.7c -28.7c < 0.0001 Oral Ulcer Pain Score at Week 12 BCT-002 (LOCF) 43.9c 19.2c -24.7c NA BCT-001 (LOCF) 36.7 9.9 -26.8 < 0.0001 Oral Ulcer Complete Response Rate at Week 12 BCT-002 (NRI) 23/103 (22.3) 55/104 (52.9) 30.6% < 0.0001 BCT-001 (NRI) 13/56 (23.2) 35/55 (63.6) 36.9% < 0.0001 Oral Ulcer Partial Response Rate at Week 12 BCT-002 (NRI) 49/103 (47.6) 79/104 (76.0) 28.2% < 0.0001 BCT-001 (NRI) 24/56 (42.9) 44/55 (80.0) 36.9% < 0.0001 Change From Baseline in BSAS at Week 12 BCT-002 (LOCF) -5.41 -17.35 -11.94 < 0.0001 BCT-001 (LOCF) -6.75 -20.41 -13.67 < 0.0001 Change From Baseline in BDCAF Scores at Week 12 BDCAI BCT-002 (LOCF) -0.4 -0.9 -0.5 0.0335

Extension of indication variation assessment report EMA/135313/2020 Page 73/102
BCT-001 (LOCF) -0.1 -1.2 -1.1 0.0007 Patient’s Perception of Disease Activity BCT-002 (LOCF) -0.7 -1.7 -1.0 < 0.0001 BCT-001 (LOCF) -0.1c -2.0c -1.9c NAc Clinician’s Overall Perception of Disease Activity BCT-002 (LOCF) -0.7 -1.6 -0.9 < 0.0001 BCT-001 (LOCF) -0.2c -1.7c -1.5c NAc Change From Baseline in the BD QoL Score at Week 12 BCT-002 (LOCF) -0.5 -3.5 -3.0 0.0003 BCT-001 (LOCF) -1.8 -4.3 -2.5 0.0397 Change From Baseline in SF-36 Physical Functioning Scale Score at Week 12 BCT-002 (LOCF) 0.04 2.90 2.86 0.0060 BCT-001 (LOCF) -1.92 1.57 3.5 0.0412 Change From Baseline in SF-36 PCS Score at Week 12 BCT-002 (LOCF) 0.88 3.07 2.19 0.0204 BCT-001 (LOCF) -1.10 4.12 5.2 0.0011
Adj. Trt. Diff. = adjusted treatment difference; APR 30 BID = apremilast 30 mg twice daily; AUC = area under the curve; BD = Behçet’s disease; BDCAF = Behçet’s Disease Current Activity Form; BDCAI = Behçet’s Disease Current Activity Index; BD QoL = Behçet’s disease quality of life questionnaire; BSAS = Behçet’s Syndrome Activity Score; HR = hazard ratio; LOCF = last observation carried forward; LS = least squares; MI = multiple imputation; NA = not applicable; NRI = nonresponder imputation; PCS = Physical Component Summary; RR = relative risk; SF-36 = Short Form 36-item Health Survey (version 2). a For continuous endpoints (MI and LOCF), treatment difference is based on an analysis of covariance (ANCOVA) model for the AUC, with treatment group, sex, and (for BCT-002) region as factors and baseline number of oral ulcers as a covariate. For categorical endpoints (NRI), adjusted difference in proportions was the weighted average of the treatment differences across the 4 strata of combined sex and region factors (for BCT-002) or across sex strata (for BCT-001) with the Cochran-Mantel-Haenszel (CMH) weights. b P-values in bold are considered statistically significant. P-values in italics are ≤ 0.050 and considered nominally significant, because no multiplicity adjustment was applied. c Mean values are reported; no treatment comparison was performed.
2.4.3. Discussion on clinical efficacy
In support of this extension of indication to include the treatment of patients with BD, the MAH conducted 2 clinical studies:
• Study BCT-001, a supportive, Phase 2, multicenter, randomized, double-blind, placebo-controlled, parallel-group study followed by an active-treatment extension to evaluate the efficacy and safety of apremilast in the treatment of BD.
• Study BCT-002, a pivotal, Phase 3, multicenter, randomized, parallel-group study to evaluate the efficacy and safety of apremilast in the treatment of subjects with active BD
Design and conduct of clinical studies
Dose selection
Dose selection in Study BCT-001 was guided by the results from a Phase 2 study in psoriasis (CC-10004-PSOR-003). Study CC-10004-PSOR-003 evaluated 2 dose levels of apremilast (20 mg QD and 20 mg BID) and results indicated that overall, the safety profile of both dose levels were comparable and acceptable, while the efficacy of 20mg BID was consistently better than 20mg QD while the maximum effect did not appear to be reached since the response curves did not reach a plateau. Therefore, a dose

Extension of indication variation assessment report EMA/135313/2020 Page 74/102
of 30 mg BID was chosen for the clinical studies in patients with BD, to minimise the number of subjects required to evaluate this rare disease and to maximise the potential to demonstrate efficacy. The CHMP considers that a specific dose response study would have been preferred as it cannot be ruled out that higher doses may have achieved higher efficacy responses in patients with BD and that efficacy may have also shown in skin ulcers. However, it is also acknowledged by the CHMP that designing further studies in the rare setting of BD would be challenging. The selected dose of apremilast 30mg BID is thus agreed by the CHMP as it did demonstrate clinically significant effects in BD patients as shown by reduction in the number of oral ulcers and associated pain, improved patient and physician disease activity measures.
Conduct and design
The phase 2 study BCT-001 randomised 111 patients. The phase 3 study BCT-002 randomised 207 patients.
In both studies, eligible subjects were randomized 1:1 to receive apremilast 30 mg BID (APR 30 BID treatment group) or identically appearing placebo. Since the incidence and severity of BD differ between males and females, randomisation was stratified by sex to minimise the imbalance between the 2 treatment groups.
In both studies, starting at the Week 12 Visit, subjects who had received placebo during the Placebo-
controlled treatment Phase were transitioned to receive APR 30 BID during the active treatment phase
(placebo/APR 30 BID treatment group). Subjects who had been randomised to apremilast continued to
receive apremilast at the same dose at which they completed the Placebo-controlled Treatment Phase
(APR 30 BID/APR 30 BID treatment group).
Endpoints
The primary endpoint in the phase 2 study BCT-001 was the number of oral ulcers at Day 85 (Week12). Secondary efficacy endpoints included ulcer response, pain of oral ulcer, AUC85 for number of oral ulcers.
For the pivotal phase 3 study BCT-002, the primary endpoint was the AUC for number of oral ulcers from baseline through Week 12. The choice of the primary endpoint in Study BCT-002 is endorsed by the CHMP as an appropriate measure for evaluating the efficacy of a treatment against oral ulcers, because it assesses the time-weighted change in the number of oral ulcers over time (ie, early and late responses). Several secondary endpoints (eg, oral ulcer pain, Behçet’s Syndrome Activity Score [BSAS] and Behçet's Disease Current Activity Form [BDCAF] score, etc.) were incorporated to evaluate the clinical benefit of apremilast in this patient population. Overall, the primary as well as the other secondary endpoints are acceptable by the CHMP.
Stratification
In Study BCT-002, the 2-sided p-value for the treatment comparison was based on the stratified log-rank test, with sex, history of uveitis, and region as the stratification factors. Disease severity should also have been considered as a stratification factor. However, the stratification is agreed by CHMP as baseline disease activity was similar between the treatment arms.
Statistical methods:
In Study BCT-002, the efficacy analyses were performed on the intent-to-treat (ITT) population. In addition, analysis using the per-protocol population was provided for the primary efficacy endpoint.
The analyses of secondary endpoints were tested following a prespecified hierarchical testing sequence to control the Type I error rate
The statistical analysis as well as the hierarchical testing and methods for handling missing data used LOCF and other sensitivity analyses. The statistical methods are acceptable by the CHMP.

Extension of indication variation assessment report EMA/135313/2020 Page 75/102
Efficacy data and additional analyses
Study BCT-002
Patients enrolled in Study BCT-002 met the International Study Group (ISG) criteria for BD, presented oral ulcers that occurred at least 3 times in the previous 12-month period, including oral ulcers at the Screening Visit. In addition, subjects were to be included if they had at least 2 oral ulcers at the Screening Visit, had prior treatment with at least 1 non biologic BD therapy, such as, but not limited to, topical corticosteroids or systemic treatment and were candidates for systemic therapy, for the treatment of oral ulcers.
The study excluded more serious Behçet's disease-related patients with active major organ involvement that required immunosuppressive therapy. Patients who received biologic therapies for the treatment of BD oral ulcers were also excluded. The enrolled patient population consisted in a relatively milder BD population who had not been previously treated with biological agents. This is agreed by the CHMP as biological agents are required in more severe population especially with organ involvement and is appropriately reflected in the proposed indication and product information.
At baseline, patients in study BCT-002 presented a mean oral ulcer count of 4 and baseline oral ulcer score of 61.0mm which is considered a severe oral ulcer disease according to the opinion of an independent expert and agreed by the CHMP. Severe oral ulcer disease causes severe pain that can interfere with normal diet and have a substantial impact on day-to-day functioning. The population included in the study is representative of the indicated population.
Demographics, disease characteristics, and prior BD medication use were comparable between the treatment groups. In the APR 30 BID treatment group, 96 subjects (92.3%) completed 12 weeks of treatment, and in the placebo treatment group, 83 subjects (80.6%) completed 12 weeks of treatment. A total of 178 subjects entered the Active Treatment Phase, 143 subjects completed treatment through Week 64 (80.3% of the 178 subjects who entered the Active Treatment Phase), and 138 subjects completed the study (66.7% of the 207 subjects who were randomized at the start of the study).
The study met its primary endpoint, with a statistically significantly lower AUCW0-12 for the number of oral ulcers in the APR 30 BID treatment group compared with the placebo treatment group. The LS mean AUCW0-12 for the number of oral ulcers was 129.54 and 222.14 in the APR 30 BID treatment group and the placebo treatment group, respectively, demonstrating a 42% relative reduction in AUC between the 2 treatment groups. The LS mean difference in the AUCW0-12 in the APR 30 BID treatment group compared with the placebo treatment group was -92.60 (p < 0.0001). The results of the primary analysis were supported by multiple sensitivity analyses conducted to assess the impact that protocol violations, methodology of imputation of missing numbers of oral ulcers, and missing assessments might have had on the primary endpoint of AUCW0-12 for the number of oral ulcers.
The analyses of the secondary endpoints evaluating oral ulcers supported also the results of the primary endpoint. The LS mean of daily average number of ulcers was 1.54 in the APR 30 BID treatment group versus 2.64 in the placebo treatment group, which is a daily difference of 1.10 ulcers. Apremilast treatment resulted in statistically significant improvements in oral ulcer pain at Week 12 assessed by statistically significantly lower oral ulcer pain VAS scores in the APR 30 BID treatment group compared with the placebo treatment group (LS mean change from baseline of -40.7 mm versus -15.9 mm, respectively; p < 0.0001). The decrease of 2.5-fold in pain is considered clinically relevant by the CHMP as the magnitude of improvement observed in the APR 30 BID treatment arm was 4-fold greater than the MCID of a 10-mm decrease from baseline (Dworkin, 2008).
A greater proportion of subjects achieved complete response for oral ulcers in the APR 30 BID treatment group compared with the placebo treatment group at Week 12 (52.9% versus 22.3%, respectively; p <

Extension of indication variation assessment report EMA/135313/2020 Page 76/102
0.0001). In addition, statistical differences in favour of apremilast over placebo were observed at Week 12 on the time to oral ulcer resolution, and the proportion of subjects achieving an oral ulcer complete response by Week 6 who remained oral ulcer-free for at least 6 additional weeks.
Improvements were also observed in BD disease activity measures. Statistically significantly greater improvements (reductions) in the BDCAI from baseline were observed at Week 12 in the APR 30 BID treatment group compared with the placebo treatment group (LS mean change from baseline of -0.9 versus -0.4, respectively (p = 0.0335)). Statistically significantly greater improvements (reductions) in the Patient’s Perception of Disease Activity (LS mean change from baseline: APR 30 BID, -1.7; placebo, -0.7; p < 0.0001) and the Clinician’s Overall Perception of Disease Activity (LS mean change from baseline: APR 30 BID, -1.6; placebo, -0.7; p < 0.0001) were also observed at Week 12 in the APR 30 BID treatment group compared with the placebo treatment group. Similarly, BSAS mean scores were statistically significantly reduced (improved) from baseline at Week 12 in the APR 30 BID treatment group compared with the placebo treatment group (LS mean change of -17.35 versus -5.41, respectively; p < 0.0001). The results showed a more than 3-fold decrease in BD activity in the APR 30 BID treatment group compared with the placebo treatment group which is considered clinically significant by the CHMP in the absence of a MCID established for BSAS. In addition to patient-reported outcomes of disease activity, subjects demonstrated improvement in QoL. The mean baseline BD QoL score was 10.73, indicative of moderate disease activity. At Week 12, the BD QoL mean score was statistically significantly improved (reduced) from baseline in the APR 30 BID treatment group compared with the placebo treatment group (LS mean change of -3.5 versus -0.5, respectively; p = 0.0003).
The clinical benefit of apremilast 30 mg twice daily was supported by multiple subgroup analyses. Subgroup analysis on history of uveitis suggests that the effect of apremilast is lower in patients with history of uveitis (difference in LS mean (CI 95%) APR 30mg BID versus placebo -73.19 (-178.39, 30.81)).
Results from the 52-week Active Treatment Phase indicate that the improvements in multiple measures of oral ulcers (number of oral ulcers, oral ulcer pain, oral ulcer complete response, and oral ulcer partial response) as well as BD activity and QoL assessments observed at Week 12 were maintained through Week 64 among subjects originally randomized to APR 30 BID who remained in the study. Similar effects were observed among subjects originally randomized to placebo who were switched to APR 30 BID at Week 12 and remained in the study. In the APR 30 BID group, slightly lower mean scores were noted at week 64 (-16.91 (21.640) in APR 30 BID/APR30 BID and -16.63 (17.556) in placebo/APR 30 BID compared to week 12 (-19.73 (15.283) in APR 30 BID). However, as the BSAS scale ranges from 0 to 100, the reported difference in the mean change of 3.1 is considered by the CHMP unlikely to be clinically relevant. Long term maintenance of the effect will be monitored post marketing in routine pharmacovigilance through the reporting of lack of efficacy.
Study BCT-001
Data from the Phase 2 Study BCT-001 conducted in 111 subjects who met ISG criteria for BD, without any active major organ involvement of BD, and had ≥ 2 oral ulcers at randomization, provide supportive evidence of the efficacy of apremilast for the treatment of oral ulcers associated with BD. This study met its primary endpoint to demonstrate a treatment effect of apremilast versus placebo in reduction of the number of oral ulcers at Day 85 relative to baseline (LS mean (95% CI) difference from baseline in apremilast arm versus placebo arm of -1.6 (-2.4, -0.9) (p < 0.0001)). All pre-planned secondary analyses of oral ulcers also showed a statistically significant treatment effect of apremilast relative to placebo. At Week 12, the LS mean AUCW0-12 for the number of oral ulcers was 67.74 and 157.82 in the APR 30 BID treatment arm and the placebo treatment arm (nominal p<0.0001). At Week 12, there was a more than 2-fold greater decrease from baseline in VAS scores in the apremilast arm compared with the placebo arm (-44.7 versus -16.0, nominal p < 0.0001). Disease activity and QoL measures improved

Extension of indication variation assessment report EMA/135313/2020 Page 77/102
significantly at Week 12 in the apremilast group compared to the placebo group (nominal p ≤ 0.0412 for BSAS, BDCAF, BD QoL, and SF-36v2 Physical Functioning domain and PCS scores).
2.4.4. Conclusions on the clinical efficacy
Efficacy data obtained from the pivotal study conducted in patients with oral ulcers associated with BD (Study BCT-002) demonstrated significant and robust superiority over placebo as the study met its primary endpoint, with a statistically significantly lower AUCW0-12 for the number of oral ulcers in the APR 30 BID treatment group compared with the placebo treatment group. Results were supported by multiple secondary endpoints. Maintenance of effect was demonstrated in the 52-week Active Treatment Phase. Efficacy from Study BCT-001 further supported the treatment effect of apremilast in patients with BD.
From the efficacy perspective, the clinical development is considered by the CHMP to adequately support the proposed indication of apremilast in BD.
2.5. Clinical safety
Introduction
Apremilast has been authorised in the EU since 2015 for the treatment of psoriatic arthritis and psoriasis.
According to the SmPC for apremilast the most commonly reported adverse reactions in Phase 3 trials
were gastrointestinal disorders including diarrhoea (15.7%) and nausea (13.9%), which were mostly mild
to moderate in severity and usually occurred in the first two weeks and generally resolved within 4
weeks. Diarrhoea and nausea were the most common ADRs leading to discontinuation during the first 16
weeks of treatment. From post-marketing data, it appears that patients aged 65 or over may be at higher
risk of severe diarrhoea, nausea or vomiting.
Patients treated in studies for up to 52 weeks experienced a mean body weight loss of 1.99kg. A total of
14.3% of patients receiving apremilast had an observed body weight loss of between 5 and 10% whilst
5.7% had observed weight loss greater than 10%. A total of 0.1% of patients treated with apremilast
discontinued treatment due to weight loss.
Suicidal ideation was also reported during studies with a frequency of uncommon, completed suicide was
reported post marketing.
The safety of apremilast has not been evaluated in patients with psoriasis or psoriatic arthritis with hepatic impairment or moderate or severe renal impairment. The safety profile observed in patients with mild renal impairment was similar to that of patients with normal renal function.
Patient exposure
Patients with Bechet’s have been exposed to apremilast in a phase 2 (BCT-001) and a phase 3 (BCT-002)
clinical study. In addition to the safety data from the individual clinical studies, summary data from the
combined studies was also provided.
In Study BCT-001, participants were exposed to apremilast (n = 55) or placebo (n = 56) for 12 weeks
followed by a 12-week extension phase where all participants were treated with apremilast (n = 100).

Extension of indication variation assessment report EMA/135313/2020 Page 78/102
Study BCT-002 consisted of a 12-week randomised treatment phase with apremilast (n = 104) or placebo
(n = 103). In the open label extension phase, all patients were treated with apremilast continued for a
further 52 weeks (n = 187). A total of 124 participants had an exposure to apremilast of 52 weeks or
greater.
In Study BCT-001, all participants were aged under 65, 70% were female and 97% were White. In Study
BCT-002, 96.6% of participants were aged under 65, 61.4% were female and 66% were White.
Two populations were defined for the assessment of safety:
• Placebo-controlled period safety population comprising all randomized subjects who received
at least 1 dose of investigational product and were included in the treatment group for the
treatment actually received. Data from Weeks 0 to 12 were included.
• Apremilast-treated safety population comprising patients in the placebo/APR30 BID arm
(randomised to placebo initially and switched to apremilast after week 12), and patients in the
APR30 BID/APR30 BID (patients treated with apremilast throughout the studies). For the
placebo/APR 30 BID, data from Week 12 to the end of the study were included. For subjects
randomized to apremilast at Week 0, data from Week 0 to the end of the study were included.
Treatment exposure in the placebo-controlled period is shown in Table 36. .
Table 36. Treatment exposure in the placebo-controlled period of Study BCT-001 and Study BCT-002
Treatment exposure placebo-controlled period CC-10004-BCT-001 Placebo (n = 56) APR 30 BID (n = 55) Mean duration weeks (SD) 10.65 (2.942) 11.43 (2.226) Median duration weeks (min, max)
12 (2.3, 13) 12 (1, 13)
Duration weeks, n (%) < 2 0 2 (3.6) ≥2 to < 6 8 (14.3) 0 ≥ 6 to < 10 3 (5.4) 2 (3.6) ≥ 10 to < 14 45 (80.4) 51 (92.7) Treatment exposure placebo-controlled period CC-10004-BCT-002 Placebo (n = 103) APR 30 BID (n = 104) Mean duration weeks (SD) 10.69 (3.4) 11.55 (2.351) Median duration weeks (min, max)
12 (0.1, 14.3) 12 (0.4, 14.9)
Duration weeks, n (%)* < 2 5 (4.9) 3 (2.9) ≥2 to < 6 10 (9.7) 3 (2.9) ≥ 6 to < 10 4 (3.9) 1 (1.0) ≥ 10 to < 12 13 (12.6) 16 (15.4) ≥ 12 71 (68.9) 81 (77.9)
Treatment exposure to apremilast including the extension phase following switch from placebo to
apremilast is shown in Table 37.

Extension of indication variation assessment report EMA/135313/2020 Page 79/102
Table 37. Treatment exposure to apremilast including the extension phase following switch from placebo to apremilast in Study BCT-001 and Study BCT-002
Treatment exposure apremilast CC-10004-BCT-001
Placebo/APR 30 BID (n = 45)
APR 30 BID/APR30 BID (n = 55)
Total (n = 100)
Mean duration weeks (SD)
12.1 (0.239) 22 (5.794) 17.55 (6.542)
Median duration weeks (min, max)
12.14 (11.1, 12.6) 24.14 (1, 25.1) 12.43 (1, 25.1)
Duration weeks, n (%) < 2 0 2 (3.6) 2 (2) ≥2 to < 10 0 2 (3.6) 2 (2) ≥10 < 14 45 (100) 2 (3.6) 47 (47) ≥ 14 < 22 0 2 (3.6) 2 (2) ≥ 22 < 26 0 47 (85.5) 47 (47)
Treatment exposure apremilast CC-10004-BCT-002
Placebo/APR 30 BID (n = 83)
APR 30 BID/APR30 BID (n = 104)
Total (n = 187)
Mean duration weeks (SD)
45.65 (14.916) 53.73 (19.663) 50.14 (18.122)
Median duration weeks (min, max)
52 (0.1, 55.9) 63.86 (0.4, 69.3) 52.43 (0.1, 69.3)
Duration weeks, n (%) < 2 2 (2.4) 3 (2.9) 5 (2.7) ≥2 < 6 3 (3.6) 3 (2.9) 6 (3.2) ≥ 6 < 10 1 (1.2) 1 (1) 2 (1.1) ≥ 10 < 12 1 (1.2) 1 (1) 2 (1.1) ≥12 < 16 2 (2.4) 2 (1.9) 4 (2.1) ≥ 16 < 24 1 (1.2) 3 (2.9) 4 (2.1) ≥24 < 28 2 (2.4) 2 (1.9) 4 (2.1) ≥ 28 < 40 3 (3.6) 8 (7.7) 11 (5.9) ≥ 40 < 48 0 3 (2.9) 3 (1.6) ≥48 < 52 22 (26.5) 0 22 (11.8) ≥ 52 < 64 46 (55.4) 27 (26) 73 (39) ≥ 64 0 51 (49) 51 (27.3)
Adverse events
Exposure adjusted incidence rates (EAIRs) were calculated to adjust for the differing exposures to
apremilast for the apremilast-treated safety population. The EAIR per 100 subject-years was defined as
100 times the number of subjects with the specific event divided by the total exposure time (in years)
among subjects included in the analysis. Subjects with multiple occurrences of the specific event in the
specific analysis period were counted only once in the numerator. The exposure time for a subject without
the specific event was the treatment duration, whereas the exposure time for a subject with the specific
event was the treatment duration up to the start date (inclusive) of the first occurrence of the specific
event. The total exposure time in years was calculated by dividing the sum of exposure time in days over

Extension of indication variation assessment report EMA/135313/2020 Page 80/102
all subjects included in the analysis by 365.25. The EAIR per 100 subject-years is interpreted as the
expected number of subjects.
In the placebo-controlled phase, TEAES were more frequently reported in the Phase 2 than the phase 3
study, both in the placebo and active treatment arms. There was a similar frequency of TEAEs in the
placebo (89.3%) and treatment arms (89.1%) of BCT-001 and a slightly greater frequency of TEAEs in
the treatment arm of BCT-002 (78.8%) versus 71.8% in the placebo arm. In both studies, there was a
higher frequency of drug related TEAEs in the APR30 BID arm (Table 38. ).
Table 38. Overview of TEAEs during the placebo-controlled phase of Studies BCT-001 and BCT-002
CC-10004-BCT-001 CC-10004-BCT-002 Placebo
N = 56 APR 30 BID N = 55
Placebo N = 103
APR 30 BID N = 104
Any TEAE 50 (89.3) 49 (89.1) 74 (71.8) 82 (78.8) Any Drug related TEAE
24 (42.9) 30 (54.5) 37 (35.9) 60 (57.7)
Any severe TEAE 5 (8.9) 5 (9.1) 6 (5.8) 6 (5.8) ANY SAE 3 (5.4) 2 (3.6) 4 (3.9) 3 (2.9) TEAE leading to drug interruption
0 1 (1.8) 6 (5.8) 9 (8.7)
TEAE leading to drug withdrawal
5 (8.9) 4 (7.3) 5 (4.9) 3 (2.9)
TEAE leading to death
0 0 0 0
An overview of TEAEs for Studies BCT-002 and BCT-001 in the apremilast-exposure period and placebo
period is shown in Table 39. .
EAIRs are highest for all types of AE in the APR 30 BID group from the placebo-controlled phase. EAIRs
are also higher for the APR30/APR30 arm than the Placebo/APR arm.
Table 39. Overview of the TEAEs reported during the placebo controlled and apremilast exposure period Studies BCT-002 and BCT-001
Placebo-controlled
Period
(Safety
Population)a
Apremilast-exposure Period
(Apremilast Subjects as Treated Population)
APR 30 BID
(n = 159; SY =
35.1)
Placebo/
APR 30 BID
(n = 128; SY =
83.0)
APR 30 BID/
APR 30 BID
(n = 159; SY =
130.3)
APR 30 BID
Totalb
(n = 287; SY =
213.3)
n (%)
EAIR per
100 SY
n (%)
EAIR
per 100
SY n (%)
EAIR
per 100
SY n (%)
EAIR
per 100
SY
Any TEAE 131
(82.4)
1217.8 109
(85.2)
422.3 140
(88.1)
577.9 249
(86.8)
497.6

Extension of indication variation assessment report EMA/135313/2020 Page 81/102
Any severe TEAEs 11 (6.9) 32.5 5 (3.9) 6.1 28
(17.6)
23.3 33
(11.5)
16.3
Any serious TEAEs 5 (3.1) 14.4 8 (6.3) 9.9 15 (9.4) 11.8 23 (8.0) 11.1
Any TEAE leading
to drug
interruption
10 (6.3) 29.7 10 (7.8) 13.1 18
(11.3)
15.2 28 (9.8) 14.4
Any TEAE leading
to drug
withdrawal
7 (4.4) 20.1 4 (3.1) 4.8 19
(11.9)
14.7 23 (8.0) 10.8
Any TEAE leading
to death
0 0 0 0 0 0 0 0
APR = apremilast; BID = twice daily; EAIR = exposure-adjusted incidence rate; IP = investigational product; SY = subject-years; TEAE = treatment-emergent adverse event. aApremilast subjects as initially treated at Week 0. bIncludes subjects who were treated with APR 30 BID from randomization (APR 30 BID/APR 30 BID) and subjects who were treated with placebo at randomization and switched to APR 30 BID at Week 12 (placebo/APR 30 BID). The TEAEs that occurred during the APR 30 BID treatment were counted
Frequency of TEAEs by preferred term
During the Placebo-controlled Period of Studies BCT-001 and BCT-002, the SOCs with the highest proportion of subjects reporting TEAEs were Gastrointestinal Disorders, Nervous System Disorders, Infections and Infestations, and Musculoskeletal and Connective Tissue Disorders.
The SOCs in the APR 30 BID treatment group with a subject incidence ≥ 5% and a higher subject incidence compared with the placebo treatment group included gastrointestinal Disorders (56.6% v 37.7%), nervous system disorders (33.3% v 28.9%), infections and infestations (32.1% v 26.4%), musculoskeletal disorders 23.9% v 18.9%), and respiratory, thoracic and mediastinal disorders (8.2% v 5.0%), metabolism and nutrition disorders (6.9% vs 1.3%), investigations (6.3% vs 1.3%) and reproductive system and breast disorders (5.7% vs 2.5%).
The most frequently reported TEAEs in any treatment group (in ≥ 5% of subjects in any treatment group) during the placebo-controlled period in decreasing order of frequency in the APR 30 BID treatment group and occurring more frequently in the APR 30 BID treatment group compared to placebo across studies BCT-001 and BCT-002 were diarrhoea (34.6 vs 14.5), nausea (26.4 vs 13.2), headache (25.8 vs 22.6), vomiting (11.3 vs 1.9), upper respiratory tract infection (8.8 vs 5.7), abdominal pain (7.5 vs 6.3), abdominal pain upper (7.5 vs 3.1), back pain (6.9% v 3.8%), viral upper respiratory tract infection (5.0% v 3.8%), and arthralgia (5.0% v 3.8).
The most frequently reported TEAEs (in ≥ 5% of subjects in any treatment group) during the placebo-controlled period of the individual phase 3 Study BCT-002 in decreasing order of frequency in the APR 30 BID treatment group and occurring more frequently in the APR 30 BID treatment group compared to placebo were diarrhoea (41.3% v 20.4%), nausea (19.2% v 10.7%), headache (14.4% v 10.7%), upper respiratory tract infection (11.5% v 4.9%), abdominal pain upper (8.7% v 1.9%), vomiting (8.7% v 1.9%), back pain (7.7% v 5.8%), viral upper respiratory tract infection (6.7% v 4.9%), and arthralgia (5.8% v 2.9%). Two had loss of appetite (1.9% v 0%). One each in the placebo and apremilast arm experienced weight loss during the placebo-controlled phase.

Extension of indication variation assessment report EMA/135313/2020 Page 82/102
Table 40. TEAEs reported in at least 5% of subjects in any treatment group by PT during the placebo-controlled – Studies BCT-001 and BCT-002
Number (%) of Subjects
Preferred Terma Placebo (n = 159)
APR 30 BID (n = 159)
Any TEAE 124 (78.0) 131 (82.4)
Diarrhoea 23 (14.5) 55 (34.6)
Nausea 21 (13.2) 42 (26.4)
Headache 36 (22.6) 41 (25.8)
Vomiting 3 (1.9) 18 (11.3)
Upper respiratory tract infection 9 (5.7) 14 (8.8)
Behçet's syndromeb 27 (17.0) 13 (8.2)
Abdominal pain 10 (6.3) 12 (7.5)
Abdominal pain upper 3 (3.1) 12 (7.5)
Back pain 6 (3.8) 11 (6.9)
Arthralgia 6 (3.8) 8 (5.0)
Viral upper respiratory tract infection 6 (3.8) 8 (5.0) APR = apremilast; BID = twice daily; IP = investigational product; MedDRA = Medical Dictionary for Regulatory Activities; TEAE = treatment-emergent adverse event. aPreferred terms were coded using MedDRA version 20.0 and are sorted in descending order of subject incidence of the APR 30 BID column. bThe investigator’s verbatim term for all TEAEs coded to the MedDRA preferred term “Behçet’s syndrome” was Behçet’s flare. Note: A TEAE is an adverse event with a start date on or after the date of the first dose of IP and no later than 28 days after the last dose of IP for subjects who discontinued early. Each subject is counted once for each applicable specific TEAE.
In the apremilast-treatment period, the most frequently reported TEAEs by SOC were similar to those in the placebo-controlled period of Studies BCT-002 and BCT-001. Based on a comparison of the EAIRs per 100 subject-years for apremilast treatment between the Placebo-controlled Period (APR 30 BID treatment group) and the apremilast-exposure Period (APR Total group), there was no evidence of an increased incidence of TEAEs from the SOCs reporting at least 5% in any treatment group with longer apremilast exposure (Table 41. ). The same was observed when the studies were considered individually.
Table 41. TEAEs reported in at least 5% of subjects in any treatment group by PT during the placebo-controlled and apremilast exposure periods (Safety Population) - Studies BCT-001 and BCT-002
Placebo-controlled Period (Safety Population)a
Apremilast-exposure Period (Apremilast Subjects as Treated Population)
APR 30 BID (n = 159; SY = 35.1)
Placebo/ APR 30 BID (n = 128; SY = 83.0)
APR 30 BID/ APR 30 BID (n = 159; SY = 130.3)
APR 30 BID Totalb (N = 287; SY = 213.3)
Preferred Termc n (%) EAIR per 100 SY n (%)
EAIR per 100 SY n (%)
EAIR per 100 SY n (%)
EAIR per 100 SY
Any TEAE 131 (82.4) 1217.8 109 (85.2) 422.3 140 (88.1) 577.9 249 (86.8) 497.6 Diarrhoea 55 (34.6) 222.8 27 (21.1) 42.4 67 (42.1) 84.2 94 (32.8) 65.6
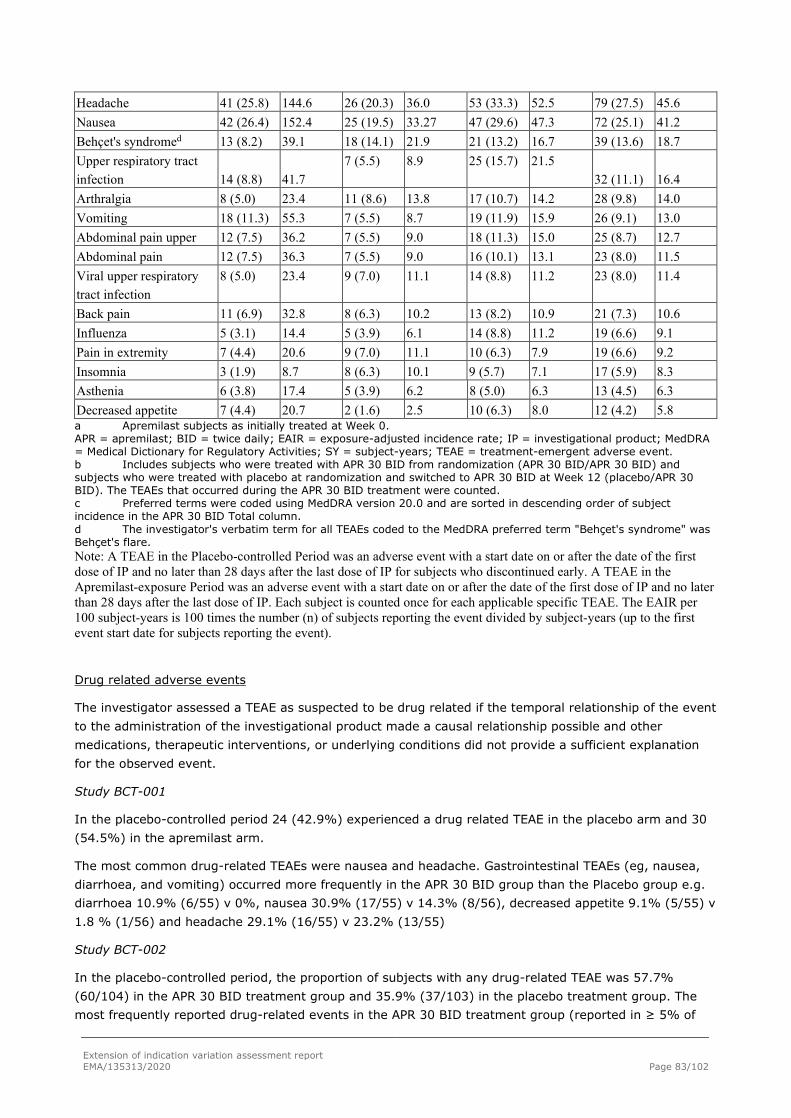
Extension of indication variation assessment report EMA/135313/2020 Page 83/102
Headache 41 (25.8) 144.6 26 (20.3) 36.0 53 (33.3) 52.5 79 (27.5) 45.6 Nausea 42 (26.4) 152.4 25 (19.5) 33.27 47 (29.6) 47.3 72 (25.1) 41.2 Behçet's syndromed 13 (8.2) 39.1 18 (14.1) 21.9 21 (13.2) 16.7 39 (13.6) 18.7 Upper respiratory tract infection 14 (8.8) 41.7
7 (5.5) 8.9 25 (15.7) 21.5 32 (11.1) 16.4
Arthralgia 8 (5.0) 23.4 11 (8.6) 13.8 17 (10.7) 14.2 28 (9.8) 14.0 Vomiting 18 (11.3) 55.3 7 (5.5) 8.7 19 (11.9) 15.9 26 (9.1) 13.0 Abdominal pain upper 12 (7.5) 36.2 7 (5.5) 9.0 18 (11.3) 15.0 25 (8.7) 12.7 Abdominal pain 12 (7.5) 36.3 7 (5.5) 9.0 16 (10.1) 13.1 23 (8.0) 11.5 Viral upper respiratory tract infection
8 (5.0) 23.4 9 (7.0) 11.1 14 (8.8) 11.2 23 (8.0) 11.4
Back pain 11 (6.9) 32.8 8 (6.3) 10.2 13 (8.2) 10.9 21 (7.3) 10.6 Influenza 5 (3.1) 14.4 5 (3.9) 6.1 14 (8.8) 11.2 19 (6.6) 9.1 Pain in extremity 7 (4.4) 20.6 9 (7.0) 11.1 10 (6.3) 7.9 19 (6.6) 9.2 Insomnia 3 (1.9) 8.7 8 (6.3) 10.1 9 (5.7) 7.1 17 (5.9) 8.3 Asthenia 6 (3.8) 17.4 5 (3.9) 6.2 8 (5.0) 6.3 13 (4.5) 6.3 Decreased appetite 7 (4.4) 20.7 2 (1.6) 2.5 10 (6.3) 8.0 12 (4.2) 5.8 a Apremilast subjects as initially treated at Week 0. APR = apremilast; BID = twice daily; EAIR = exposure-adjusted incidence rate; IP = investigational product; MedDRA = Medical Dictionary for Regulatory Activities; SY = subject-years; TEAE = treatment-emergent adverse event. b Includes subjects who were treated with APR 30 BID from randomization (APR 30 BID/APR 30 BID) and subjects who were treated with placebo at randomization and switched to APR 30 BID at Week 12 (placebo/APR 30 BID). The TEAEs that occurred during the APR 30 BID treatment were counted. c Preferred terms were coded using MedDRA version 20.0 and are sorted in descending order of subject incidence in the APR 30 BID Total column. d The investigator's verbatim term for all TEAEs coded to the MedDRA preferred term "Behçet's syndrome" was Behçet's flare. Note: A TEAE in the Placebo-controlled Period was an adverse event with a start date on or after the date of the first dose of IP and no later than 28 days after the last dose of IP for subjects who discontinued early. A TEAE in the Apremilast-exposure Period was an adverse event with a start date on or after the date of the first dose of IP and no later than 28 days after the last dose of IP. Each subject is counted once for each applicable specific TEAE. The EAIR per 100 subject-years is 100 times the number (n) of subjects reporting the event divided by subject-years (up to the first event start date for subjects reporting the event).
Drug related adverse events
The investigator assessed a TEAE as suspected to be drug related if the temporal relationship of the event to the administration of the investigational product made a causal relationship possible and other medications, therapeutic interventions, or underlying conditions did not provide a sufficient explanation for the observed event.
Study BCT-001
In the placebo-controlled period 24 (42.9%) experienced a drug related TEAE in the placebo arm and 30 (54.5%) in the apremilast arm.
The most common drug-related TEAEs were nausea and headache. Gastrointestinal TEAEs (eg, nausea, diarrhoea, and vomiting) occurred more frequently in the APR 30 BID group than the Placebo group e.g. diarrhoea 10.9% (6/55) v 0%, nausea 30.9% (17/55) v 14.3% (8/56), decreased appetite 9.1% (5/55) v 1.8 % (1/56) and headache 29.1% (16/55) v 23.2% (13/55)
Study BCT-002
In the placebo-controlled period, the proportion of subjects with any drug-related TEAE was 57.7% (60/104) in the APR 30 BID treatment group and 35.9% (37/103) in the placebo treatment group. The most frequently reported drug-related events in the APR 30 BID treatment group (reported in ≥ 5% of

Extension of indication variation assessment report EMA/135313/2020 Page 84/102
subjects) all of which were more common in the apremilast arm compared to placebo. The events were: diarrhoea (38.5% v 13.6%), nausea (15.4% v 7.8%), headache (8.7% v 6.8%), and vomiting (7.7% v 1%).
In the apremilast treatment period, 61.5% (64/104 subjects) in the APR 30 BID/APR 30 BID treatment group and 34.9% (29/83 subjects) in the placebo/APR 30 BID treatment group had a drug related TEAE. Based on a comparison of the EAIRs per 100 subject-years for apremilast treatment between the placebo-controlled period (APR 30 BID treatment group; 515.9) and the apremilast-exposure period (APR Total group; 96.7), there was no evidence of an increased incidence of drug-related TEAEs with longer apremilast exposure.
The events most frequently (≥ 5% of subjects) reported as drug-related in the APR 30 BID/APR 30 BID treatment group were diarrhoea (39.4%), nausea (16.3%), headache (12.5%), vomiting (7.7%), and abdominal pain upper (6.7%). The events most frequently (≥ 5% of subjects) reported as drug-related in the placebo/APR 30 BID treatment group were diarrhoea (20.5%), headache (8.4%), and nausea (7.2%). Based on a comparison of the EAIRs per 100 subject-years for apremilast treatment between the placebo-controlled period (APR 30 BID treatment group) and the apremilast-exposure period (APR Total group), there was no evidence of an increased incidence of diarrhoea, nausea, headache, vomiting, and abdominal pain upper with longer apremilast exposure
Severity of adverse events
Two distinct scales were used for categorising the severity of adverse events (Study CC-10004-BCT-001
used the National Cancer Institute Common Terminology Criteria for Adverse Events Version 3.0 5 item
grading scale) and Study CC-10004-BCT-002 used a mild, moderate severe scale. Severity assessed on
the NCICTCAE was mapped to the mild, moderate scale used in Study BCT-002 for the purpose of
aggregation.
A majority of the TEAEs during the Placebo-controlled Period in both trials were mild to moderate in
severity (Table 42. ). One patient in Study BCT-001 in the apremilast arm had a life threatening TEAE of
diplegia, which was not suspected to be related to apremilast.
Table 42. Overview of Subject Incidence of Treatment-emergent Adverse Events by Maximum Severity During the Placebo-controlled Period (Safety Population)
CC-10004-BCT-001 CC-10004-BCT-002 Severity Placebo APR 30 BID Placebo APR 30 BID Mild 25 (44.6%) 26 (47.3%) 45 (43.7) 42 (40.4) Moderate 20 (35.7%) 18 (32.7%) 23 (22.3) 34 (32.7) Severe 5 (8.9%) 4 (7.3%) 6 (5.8) 6 (5.8) Life threatening 0 (0.0) 1 (1.8%) 0 (0.0) 0 (0.0)
In Study BCT-002, the severe events reported in the APR 30 BID treatment group were nausea (3 subjects), headache (2 subjects), and laryngitis, oral herpes, vocal cord inflammation, and vomiting (1 subject each); the severe events reported in the placebo treatment group were diarrhoea, diarrhoea infectious, genital infection, genital infection fungal, hypertension, stomatitis, acute febrile neutrophilic dermatosis, pemphigus, and dysmenorrhea (1 subject each).
As observed in the Placebo-controlled Period, the majority of the TEAEs were mild to moderate in severity during the apremilast-exposure period. Based on a comparison of the EAIRs per 100 subject-years for

Extension of indication variation assessment report EMA/135313/2020 Page 85/102
apremilast treatment between the Placebo-controlled Period (APR 30 BID treatment group; 27.0) and the Apremilast-exposure Period (APR Total group; 12.4), there was no evidence of an increased incidence of severe TEAEs with longer apremilast exposure.
Serious adverse event/deaths/other significant events
There were no deaths in either study. During the placebo-controlled phase of both studies, SAEs were broadly similar in both treatment arms.
Serious Adverse Events
Study BCT-001
In the placebo-controlled phase, 3 patients in the placebo arm and 2 patients in the apremilast arm experienced SAE. In the placebo arm, two patients presented an exacerbation of Bechet’s syndrome and one patient experienced pyrexia. In the APR30 BID arm, one patient experienced diplegia (categorised as Grade 4) and one patient, with a prior history of haemorrhoids, experienced two SAEs, anal fissure and haemorrhoids. None of the SAEs in the APR30 BID group was judged to be related to apremilast. The patient who experienced diplegia did not have recurrence of this AE following re-exposure to apremilast.
In the apremilast-exposure period, 5 subjects reported SAEs in the APR30BID/APR30BID arm and 1 patient in the placebo/APR30 arm. Bechet’s exacerbation was reported in 2 patients in the APR30/APR30 arm and 1 patient in the placebo/APR30BID arm. Influenza reported in 1 patient in the APR30/APR30 arm was suspected as being related to apremilast. None of the other SAEs in patients exposed to apremilast were considered related to the study drug.
Study BCT-002
In the placebo-controlled phase of Study BCT-002, SAEs were reported in 4 (3.9%) patients in the placebo arm and 3 (2.9%) patients in the apremilast arm. The reported SAEs in the APR 30 BID arm were exacerbation of Bechet’s syndrome (1), migraine (1) and soft tissue injury (1).
In the apremilast exposure period, at least 1 SAE was reported for 7 additional patients in the APR30 BID/APR30 arm and 7 in the placebo/APR30 BID arm. During the apremilast-exposure period, the SAEs, Bechet’s syndrome (2) and appendicitis (2), were reported more than once.
The following SAEs occurred once in patients exposed to apremilast either in the placebo or open label extension part of the study: arterial thrombosis and ischaemic myositis (occurred 6 days after last dose of apremilast thought to be due to underlying Bechet’s) ; lymph node tuberculosis; herpes zoster; breast cancer; endometrial cancer; bronchitis; joint dislocation; migraine; soft tissue injury; pancreatitis acute; infectious colitis; vaginal stricture; vestibular neuronitis; and road traffic accident with tibia fracture. The SAEs of lymph node tuberculosis reported in the APR 30 BID/APR 30 BID arm, and herpes zoster and endometrial cancer reported in the placebo/APR 30 BID arm were suspected to be related to apremilast.
Adverse events of special interest
Adverse events of special interest included: diarrhoea; suicidal ideation and behaviour; malignancies; major adverse cardiac events; and opportunistic infections.
Diarrhoea
In the placebo controlled-period, frequency of diarrhoea in Study BCT-001 was lower for both placebo and apremilast arms (3.6% of patients in placebo arms and 21.8% of patients in apremilast arm) than in Study BCT-002 (20.4% of patients in placebo arms and 41.3% of patients in apremilast arm) .
Extension of indication variation assessment report EMA/135313/2020 Page 86/102
Protocol defined diarrhoea in Study BCT-002 was diarrhoea characterised by 2 or more watery or liquid stools per day. During the placebo-controlled period of Study BCT-002, 33/104 (31.7%) of the patients in the apremilast arm experienced protocol-defined diarrhoea compared to 18/103 (17.5%) of the patients in the placebo arm. Diarrhoeal episodes also tended to have a longer duration in the apremilast arm: 52% of episodes in the placebo arm had a duration of 1 to 3 days compared to 16.7% in the apremilast arm; 41.7% had a duration of 8 to 23 days in the apremilast arm compared to 8% in the placebo arm. No events in the apremilast arm led to drug withdrawal and no events were categorised as severe. The onset of diarrhoea for both treatment groups more commonly occurred in the 1st 15 days of treatment (48% of events for apremilast and 50% for placebo). During the apremilast exposure period, at least 1 TEAE of protocol-defined diarrhoea was reported for 20/83 (24.1%) of the patients in the placebo/APR30 arm and 39/104 (37.5%) of the patients in the APPR30 BID/APR30 arm (this also includes the cases reported in the placebo controlled phase in the apremilast arm). Based on a comparison of the EAIRs per 100 subject-years for protocol-defined diarrohea for apremilast treatment between the placebo-controlled period (APR 30 BID treatment group; 194.0; and the Apremilast-exposure Period (APR Total group; 45.2), there was no evidence of an increased incidence of protocol-defined diarrhoea with longer apremilast exposure.
Suicidal ideation and behaviour
No TEAEs of suicidal ideation or behaviour were reported during the course of either Study BCT-001 or BCT-002. In Study BCT-002, depression was reported for 1 patient in the placebo treatment group and depressed mood was reported for one patient in the APR 30 treatment arm during the placebo-controlled period.
Malignancies
For Study BCT-002, no malignancies were reported during the placebo-controlled period. Malignancies reported during the apremilast-exposure period were breast cancer and endometrial cancer. The case of breast cancer was not suspected to be related to treatment. The case of endometrial cancer was suspected to be related to treatment by the investigator. However, the patient duration of exposure to apremilast was 82 days and the patient presented 17 days after the last exposure to apremilast with abdominal pain and metrorrhagia. Given the patient’s age (69 years) and the short duration of exposure to apremilast, the likelihood of a relationship between apremilast exposure and development of endometrial carcinoma in this patient is low.
No malignancies were reported in Study BCT-001.
Major adverse cardiac events
Major adverse cardiac events (MACEs) were defined as TEAEs of sudden unwitnessed death, cardiovascular death (sudden cardiac death, death due to myocardial infarction, death due to heart failure, death due to stroke, and death due to other cardiovascular causes), myocardial infarction, and nonfatal stroke. No MACEs were reported in either study.
Vasculitis
No cases of vasculitis were reported in either study.
Opportunistic infections
In Study BCT-002, no opportunistic infections were reported during the placebo-controlled period.
Four subjects experienced opportunistic infections that were serious and/or resulted in discontinuation of treatment during the apremilast-exposure period (tubercular lymphadenititis, atypical mycobacterial infection and 2 cases of herpes zoster).
Extension of indication variation assessment report EMA/135313/2020 Page 87/102
- A subject in the APR 30/APR 30 treatment arm with a medical history of possible tuberculosis (TB) in childhood and a family history of TB experienced a serious TEAE of tubercular lymphadenitis of the neck on Day 226 of apremilast treatment. Apremilast was permanently discontinued on Study Day 231 due to the event, and the subject recovered after treatment for tuberculosis and the episode was suspected as being related to apremilast.
- A subject in the APR 30/APR 30 treatment arm experienced an atypical mycobacterial infection on Day 162 of apremilast treatment. This event was not serious and infection was not confirmed: a 6-week sputum culture for nontuberculous mycobacterial diagnosis was negative. The subject took the last dose of apremilast on Day 167 and was permanently discontinued from the study. The event was ongoing at that time. The relationship with apremilast was judged to be suspected.
- A subject in the placebo/APR 30 treatment arm experienced a serious TEAE of herpes zoster (serious TEAE criteria of medical importance) on Study Day 146 while receiving apremilast. The herpes zoster was moderate in severity, limited to 1 dermatome and resulted in interruption of apremilast. Treatment for this event included paracetamol, levocetirizine, tramadol, and valacyclovir hydrochloride. The herpes zoster resolved on Study Day 174. The relationship with apremilast was considered to be suspected. The subject restarted apremilast on Study Day 169.
- A subject in the APR 30 /APR 30 treatment arm with a history of herpes simplex experienced a nonserious TEAE of herpes zoster on Study Day 163. The herpes zoster was mild in severity, limited to 1 dermatome and did not require treatment. Apremilast was permanently discontinued due to the herpes zoster and a concurrent TEAE of mild noncardiac chest pain. The herpes zoster resolved on Study Day 190. The relationship with apremilast was considered to be not suspected.
There was an additional case of infectious colitis that was not reported as an opportunistic infection by the investigator. In the placebo/APR30 BID arm, a serious case of infectious colitis was reported in a 31-year-old Asian female. The event occurred on Study Day 252 (Day 166 on apremilast). Elevated WBCs and C-reactive protein and CT confirmed acute colitis. Antibiotic treatment was given for 5 days and WBCs returned to normal within 10 days of the initiation of the event. The event resolved without interruption of treatment with apremilast. The patient continued treatment and completed treatment on with apremilast on day 364. The event was considered not related to the study drug by the MAH.
Weight change and decreased appetite
Weight change and decreased appetite have been noted in previous studies with apremilast.
In the placebo-controlled phase of Study BCT-001, 1/56 (1%) of the patients had a TEAE of decreased appetite in the placebo arm and 5/55 (9.1%) of the patients in the apremilast arm.
In the placebo-period of Study BCT-002, no subjects experienced decreased appetite in the placebo arm and 2 /104 (1.9%) experienced it in the apremilast arm. In the apremilast exposure period for Study BCT-002, a total of 15/187 (8%) patients experienced decreased appetite.
In both studies, a slightly greater proportion of patients in the apremilast arm experienced weight loss during the placebo-controlled period (35.8% placebo versus 46% apremilast in Study BCT-001 and 33.3% (placebo) v 41.8% (apremilast arm) in the phase 3 trial.
Laboratory findings
Few laboratory abnormalities (clinical chemistry or haematology) were reported in either study in the placebo phase (with no imbalance between the placebo and apremilast arms) or total apremilast treatment phase.

Extension of indication variation assessment report EMA/135313/2020 Page 88/102
Safety in special populations
There was a greater frequency of TEAEs in the placebo phase of Study BCT-002 for females than males in
both the placebo (77.8% v 62.5%) and apremilast (84.4% v 70%) arms. Diarrhoea (placebo 22.2% v
17.5%, apremilast 46.9% v 32.5%)) and nausea (placebo 14.3% v 5%, apremilast 21.9% v 15%) were
also more common for females in both placebo and apremilast arms. Similar trends were seen in the
apremilast exposure period. No effect of sex was seen in Study BCT-001.
No participant in Study BCT-001 was older than 65 and only 7 patients in Study BCT-002 were older than 65 years of age.
Safety related to drug-drug interactions and other interactions
There were no reports of TEAEs due to drug-drug interactions for either study.
Discontinuation due to adverse events
In Sudies BCT-001 and BCT-002, TEAEs leading to drug withdrawal occurred in 10 (6.3%) subjects in the placebo treatment group and 7 (4.4%) subjects in the APR 30 BID treatment group during the Placebo-controlled period (Table 43. ). Behçet’s syndrome/flare led to drug withdrawal in 5 (3.1%) subjects in the placebo treatment group and 1 (0.6%) subject in the APR 30 BID treatment group. Nausea led to drug withdrawal in 3 (1.9%) subjects in the APR 30 BID treatment group (none in the placebo treatment group). All other TEAEs leading to drug withdrawal were each reported in a single subject for each PT.
Table 43. Subject Incidence of Treatment-emergent Adverse Events Leading to Drug Withdrawal During the Placebo-controlled Period (Safety Population, Sudies BCT-001 and BCT-002)
Number (%) of Subjects
Preferred Term Placebo (n = 159)
APR 30 BID (n = 159)
Any TEAE leading to withdrawal 10 (6.3) 7 (4.4) Nausea 0 3 (1.9) Behçet's syndrome 5 (3.1) 1 (0.6) Diarrhea 1 (0.6) 1 (0.6) Headache 1 (0.6) 1 (0.6) Abdominal pain upper 0 1 (0.6) Anal fissure 0 1 (0.6) Haemorrhoids 0 1 (0.6) Vaginal haemorrhage 0 1 (0.6) Vomiting 0 1 (0.6) Acute febrile neutrophilic dermatosis 1 (0.6) 0 Cough 1 (0.6) 0 Lethargy 1 (0.6) 0 Mouth ulceration 1 (0.6) 0 Musculoskeletal chest pain 1 (0.6) 0 Pemphigus 1 (0.6) 0 Skin lesion 1 (0.6) 0
APR = apremilast; BID = twice daily; IP = investigational product; MedDRA = Medical Dictionary for Regulatory Activities; TEAE = treatment-emergent adverse event.

Extension of indication variation assessment report EMA/135313/2020 Page 89/102
During the Apremilast Exposure Period, TEAEs leading to drug withdrawal occurred in 23 (8.0%) subjects overall in the BCT Data Pool (Table 44. ). Most TEAEs that led to drug withdrawal were reported in 1 subject each. The only TEAEs leading to drug withdrawal that occurred in more than 1 subject were Behçet’s syndrome/flare, nausea, and diarrhoea.
Table 44. Subject Incidence of Treatment-emergent Adverse Events Leading to Drug Withdrawal During the Apremilast-exposure Period (Sudies BCT-001 and BCT-002)
Number (%) of Subjects Preferred Terma Placebo/
APR 30 BID (n = 128)
APR 30 BID/ APR 30 BID (n = 159)
APR 30 BID Totalb (N = 287)
Any TEAE leading to drug withdrawal 4 (3.1) 19 (11.9) 23 (8.0) Nausea 0 4 (2.5) 4 (1.4) Behçet’s syndromec 2 (1.6) 2 (1.3) 4 (1.4) Diarrhoea 0 2 (1.3) 2 (0.7) Abdominal pain upper 0 1 (0.6) 1 (0.3) Anal fissure 0 1 (0.6) 1 (0.3) Arterial thrombosis 0 1 (0.6) 1 (0.3) Atypical mycobacterial infection 0 1 (0.6) 1 (0.3) Breast cancer 0 1 (0.6) 1 (0.3) Haemorrhoids 0 1 (0.6) 1 (0.3) Headache 0 1 (0.6) 1 (0.3) Herpes zoster 0 1 (0.6) 1 (0.3) Influenza 0 1 (0.6) 1 (0.3) Leukopenia 0 1 (0.6) 1 (0.3) Lymph node tuberculosis 0 1 (0.6) 1 (0.3) Myositis 0 1 (0.6) 1 (0.3) Non-cardiac chest pain 0 1 (0.6) 1 (0.3) Pancreatitis acute 0 1 (0.6) 1 (0.3) Scleritis 0 1 (0.6) 1 (0.3) Tension headache 0 1 (0.6) 1 (0.3) Vaginal haemorrhage 0 1 (0.6) 1 (0.3)
Vomiting 0 1 (0.6) 1 (0.3) Abdominal pain 1 (0.8) 0 1 (0.3) Vestibular neuronitis 1 (0.8) 0 1 (0.3)
APR = apremilast; BID = twice daily; IP = investigational product; MedDRA = Medical Dictionary for Regulatory Activities; TEAE = treatment-emergent adverse event. aPreferred terms were coded using MedDRA version 20.0 and are sorted in descending order of subject incidence in the APR 30 BID total column. bIncludes subjects who were treated with APR 30 BID from randomization (APR 30 BID/APR 30 BID) and subjects who were treated with placebo at randomization and switched to APR 30 BID at Week 12 (placebo/APR 30 BID). The TEAEs that occurred during the APR 30 BID treatment were counted. cThe investigator’s verbatim term for all TEAEs coded to the MedDRA preferred term “Behçet’s syndrome” was Behçet’s flare. Note: A TEAE is an adverse event with a start date on or after the date of the first dose of IP and no later than 28 days after the last dose of IP for subjects who discontinued early. Each subject is counted once for each applicable specific TEAE.

Extension of indication variation assessment report EMA/135313/2020 Page 90/102
Post marketing experience
Otezla (apremilast) was first authorised in the EU on 15 January 2015. Otezla is currently authorised in the treatment of psoriatic arthritis and psoriasis. The safety profile of apremilast in the postmarketing setting remains similar to that observed in the psoriasis and PsA clinical programme. The adverse events most frequently reported post-approval are GI (diarrhea, nausea, vomiting, abdominal discomfort) and nervous system disorders (headache). The reporting rates for events of interest in the postmarketing settings have not changed since apremilast was launched. No new relevant safety concern with respect to reporting rates or event information have been identified.
2.5.1. Discussion on clinical safety
Two clinical trials were conducted in the Behçet’s population (Study BCT-001 and Study BCT-002). In
total 287 patients were exposed to apremilast with 124 having exposure for at least one year. The safety
evaluation of the two studies did not identify any new adverse reactions.
The most frequent TEAEs reported (combined BCT-001 and BCT-002) in the apremilast arm compared to
the placebo arm were diarrhoea (34.6% and 14.5%, respectively); nausea (26.4% and 13.2%,
respectively); headache (25.8 and 22.6, respectively); vomiting (11.3% and 1.9%, respectively); upper
respiratory tract infection (8.8% and 5.7%, respectively); abdominal pain (7.5 and 6.3, respectively);
abdominal pain upper (7.5% and 3.1%, respectively); back pain (6.9% and 3.8%, respectively); viral
upper respiratory tract infection (5.0% and 3.8%, respectively) and arthralgia (5% and 3.8%,
respectively). The frequency of diarrhoea, and nausea in Behcets patients treated with Otezla appears to
be higher than that reported in the SmPC for patients with PsA or PSOR (15.7% and 13.9% respectively).
Diarrhoea led to discontinuation of apremilast in one patient in Study BCT-001 and none in Study BCT-
002.
The majority of AEs in both studies were mild or moderate.
A higher incidence of drug related TEAEs and TEAEs leading to withdrawal was reported in the APR 30
BID/APR 30 BID group than the placebo/APR 30 BID group. It is hypothesized by the MAH that the
placebo/APR 30 BID group is a select group of only subjects who remained in the study long enough to
receive apremilast. However, no evidence has been provided to support the hypothesis that those who
did not continue in the apremilast only phase would be more likely to experience TEAEs than those who
remained. Furthermore, EAIRs in the placebo/APR 30 BID and APR 30 BID/APR 30 BID group in the
apremilast only phase were lower than those in the placebo and apremilast arms of the placebo controlled
phase of the study. It is therefore considered by the CHMP that the incidence of TEAE does not increase
with an increased duration of exposure.
There were no reports of suicidal ideation, or MACEs across the studies.
Two malignancies were reported across the studies (endometrial cancer and breast cancer), but both
were unlikely related to apremilast due to the short exposure to apremilast (approximately 3 and 5
months).
Weight change and decreased appetite occurred at a lower frequency than that noted in the PsA and
PSOR population.

Extension of indication variation assessment report EMA/135313/2020 Page 91/102
No opportunistic infections were reported during the placebo-controlled period of Study BCT-002. In the
apremilast exposure phase, opportunistic infections that were serious and/or resulted in discontinuation
of treatment were reported by 4 subjects (tubercular lymphadenititis, atypical mycobacterial infection and
2 cases of herpes zoster). A female Asian subject in the APR 30 BID/APR 30 BID treatment arm with a
medical history of possible tuberculosis during childhood and a family history of tuberculosis experienced
tubercular lymphadenitis and apremilast was permanently discontinued due to the event. A second Asian
female subject in the APR 30 BID/APR 30 BID treatment arm experienced an atypical mycobacterial
infection and apremilast was permanently discontinued due to the event. Additionally, 2 subjects
experienced TEAEs of herpes zoster (placebo/APR 30 BID) and herpes simplex (APR 30 BID/APR 30 BID)
that were serious and led to withdrawal of apremilast, respectively. Both events were limited to one
dermatome. There was a serious case of infectious colitis (placebo/APR 30BID) considered neither by the
investigator nor by the MAH as an opportunistic infection. The event resolved quickly with antibiotic
treatment and without interruption of apremilast dosing, and no recurrence was reported while the
patient pursued apremilast treatment. Opportunistic infections are classified as an important potential risk
in the RMP which is considered adequate by the CHMP.
The extension of indication concerns BD which is a chronic multisystem variable vessel vasculitis with
disease manifestations spanning from mild cutaneous lesions to severe inner organ involvement such as
pulmonary arterial aneurysm, thromboembolic disease and CNS involvement. However, vasculitis is also
described as an important potential risk for apremilast. Clarification was sought by CHMP that no more
severe organ manifestations would appear under treatment with apremilast of the non-life-threatening
manifestation of BD (oral ulcers). Data on exacerbation/relapse of BD were not collected as a safety issue
in Study BCT-002 unless it met the definition of a SAE. Data on exacerbation/relapse was collected as an
efficacy outcome. For the standardised MedDRA queries of vasculitis and vasculopathy, the only preferred
term reported in Study BCT-002 was Behcet’s syndrome. Two patients treated with apremilast in Study
BCT-002 experienced serious TEAEs of Behcet’s syndrome. Both were discontinued from treatment. These
episodes were not considered to be related to apremilast. Efficacy results indicate that the proportion of
patients with at least one new, recurrent or worsening BD manifestation was higher in the placebo group
than the apremilast group at every visit through to week 12 (placebo-controlled phase). Manifestations
related to skin, arthritis and uveitis also occurred with a higher frequency in the placebo arm. Except at
the Week 4 visit, CNS manifestations were more frequent in the placebo arm. No patients in either group
presented vascular manifestations. Three non-serious AEs of vasculitis were reported during the
apremilast exposure group. Gastrointestinal manifestations occurred at a higher frequency at all time
points (weeks 1, 2, 4, 6, 8, 10 and 12) in patients treated with apremilast, which is not unexpected as
these are the most commonly reported adverse events. The incidence of serious adverse events was
comparable between treatment groups and there was no gastrointestinal haemorrhages (PT) during
Study BCT-002. Gastrointestinal manifestations will be followed up through routine pharmacovigilance. It
is overall concluded by CHMP that there is no evidence of an increased risk of vasculitis related adverse
events in patients treated with apremilast.
There were no deaths in either study.
The summary of adverse reactions in Section 4.8 of the SmPC is updated to change the frequency of the adverse reactions ‘upper respiratory tract infection’ and ‘headache’ reported by 11.5% and 14.4% of the

Extension of indication variation assessment report EMA/135313/2020 Page 92/102
patients in the phase 3 Study BCT-002 from ‘common’ to ‘very common’. Whilst there is a difference in the frequency of diarrhoea between the Behcet and PSA and PSOR populations, both fall under the frequency of ‘very common’.
2.5.2. Conclusions on clinical safety
The adverse events and risks related to apremilast have been already characterised in a large safety
database. The analysis of all available safety data from subjects both from the approved indications of
PsA and psoriasis, and from approximately 300 BD patients including 124 patients with at least 52 weeks
of exposure (i.e. 1 year) provide evidence of an acceptable safety profile for use of apremilast in adult
patients with oral ulcers associated with BD who are candidates for systemic therapy.
From the safety perspective, the clinical development is considered by the CHMP to adequately support the proposed indication of apremilast in BD.
2.5.3. PSUR cycle
The requirements for submission of periodic safety update reports for this medicinal product are set out in the list of Union reference dates (EURD list) provided for under Article 107c(7) of Directive 2001/83/EC and any subsequent updates published on the European medicines web-portal.
2.6. Risk management plan
The MAH submitted an updated RMP version with this application.
The CHMP received the following PRAC Advice on the submitted Risk Management Plan:
Safety Concern Risk Minimisation Measures Pharmacovigilance Activities
Important Identified Risks
Serious Events of Hypersensitivity
Routine risk minimisation activities:
SmPC
Contraindicated in those with hypersensitivity to apremilast (Section 4.3) and the risk of hypersensitivity is presented in Section 4.8.
PIL
Includes advice not to take if allergic to apremilast in Section 2, and included in Section 4.
Additional risk minimisation activities:
None.
Routine pharmacovigilance activities beyond adverse reactions reporting and signal detection:
Event specific questionnaire for the collection of the AE and follow-up.
Additional pharmacovigilance activities:
• Apremilast Psoriasis Registry in the EU (PsoBest).
• Apremilast PsA Registry in the UK – BSRBR-PsA.
• UK CPRD.
Suicidality Routine risk minimisation activities:
SmPC
The risk of triggering suicide is discussed in Sections 4.4 and 4.8.
PIL
Routine pharmacovigilance activities beyond adverse reactions reporting and signal detection:
Event specific questionnaire for the collection of the AE and follow-up.
Additional pharmacovigilance activities:

Extension of indication variation assessment report EMA/135313/2020 Page 93/102
Safety Concern Risk Minimisation Measures Pharmacovigilance Activities
Included in Sections 2 and 4 of the patient information.
Additional risk minimisation activities:
None.
• Apremilast Psoriasis Registry in the EU (PsoBest).
• Apremilast PsA Registry in the UK – BSRBR-PsA.
• UK CPRD.
Serious Events of Depression
Routine risk minimisation activities:
SmPC
The risk of depression is discussed in Sections 4.4 and 4.8.
PIL
Included in Sections 2 and 4 of the patient information.
Additional risk minimisation activities:
None.
Routine pharmacovigilance activities beyond adverse reactions reporting and signal detection:
Event specific questionnaire for the collection of the AE and follow-up.
Additional pharmacovigilance activities:
• Apremilast Psoriasis Registry in the EU (PsoBest).
• Apremilast PsA Registry in the UK – BSRBR-PsA.
• UK CPRD.
Important Potential Risks
Vasculitis Routine risk minimisation activities:
None.
Additional risk minimisation activities:
None.
Routine pharmacovigilance activities beyond adverse reactions reporting and signal detection:
Event specific questionnaire for the collection of the AE and follow-up.
Additional pharmacovigilance activities:
• Apremilast Psoriasis Registry in the EU (PsoBest).
• Apremilast PsA Registry in the UK – BSRBR-PsA.
• UK CPRD.
Malignancies Routine risk minimisation activities:
None.
Additional risk minimisation activities:
None.
Routine pharmacovigilance activities beyond adverse reactions reporting and signal detection:
Event specific questionnaire for the collection of the AE and follow-up.
Additional pharmacovigilance activities:
• Apremilast Psoriasis Registry in the EU (PsoBest).
• Apremilast PsA Registry in the UK – BSRBR-PsA.
• UK CPRD.
Serious Events of Anxiety and Nervousness
Routine risk minimisation activities:
None.
Additional risk minimisation activities:
Routine pharmacovigilance activities beyond adverse reactions reporting and signal detection:

Extension of indication variation assessment report EMA/135313/2020 Page 94/102
Safety Concern Risk Minimisation Measures Pharmacovigilance Activities
None. None.
Additional pharmacovigilance activities:
• Apremilast Psoriasis Registry in the EU (PsoBest).
• Apremilast PsA Registry in the UK – BSRBR-PsA.
• UK CPRD.
Serious Infections Including Opportunistic Infections and Transmission of Infections Through Live Vaccines
Routine risk minimisation activities:
None.
Additional risk minimisation activities:
None.
Routine pharmacovigilance activities beyond adverse reactions reporting and signal detection:
Event specific questionnaire for the collection of the AE and follow-up.
Additional pharmacovigilance activities:
• Apremilast Psoriasis Registry in the EU (PsoBest).
• Apremilast PsA Registry in the UK – BSRBR-PsA.
• UK CPRD.
MACE and Tachyarrhythmia
Routine risk minimisation activities:
None.
Additional risk minimisation activities:
None.
Routine pharmacovigilance activities beyond adverse reactions reporting and signal detection:
Event specific questionnaire for the collection of the AE and follow-up.
Additional pharmacovigilance activities:
• Apremilast Psoriasis Registry in the EU (PsoBest).
• Apremilast PsA Registry in the UK – BSRBR-PsA.
• UK CPRD.
Prenatal Embryo-foetal Loss and Delayed Foetal Development (Reduced Ossification and Foetal Weight) in Pregnant Women Exposed to Apremilast
Routine risk minimisation activities:
SmPC
Contraindicated in pregnancy (Section 4.3). Includes information regarding use in pregnancy (Section 4.6) and preclinical information on embryo-foetal development (Section 5.3).
PIL
Includes information regarding use in pregnancy (including do not take if pregnant) in Section 2.
Additional risk minimisation activities:
None.
Routine pharmacovigilance activities beyond adverse reactions reporting and signal detection:
Event specific questionnaire for the collection of the AE and follow-up.
Additional pharmacovigilance activities:
None.
Missing Information

Extension of indication variation assessment report EMA/135313/2020 Page 95/102
Safety Concern Risk Minimisation Measures Pharmacovigilance Activities
Long-term Safety None. Additional pharmacovigilance activities:
• Apremilast Psoriasis Registry in the EU (PsoBest).
• Apremilast PsA Registry in the UK – BSRBR-PsA.
• UK CPRD.
The PRAC considered that the risk management plan version 13.0 is acceptable. The CHMP endorsed this advice without changes.
2.7. Update of the Product information
As a consequence of this new indication, sections 4.1, 4.2, 4.8 and 5.1 of the SmPC have been updated. The Package Leaflet has been updated accordingly.
Changes were also made to the PI to bring it in line with the QRD template v10.1, which are accepted by the CHMP.
2.7.1. User consultation
The results of the user consultation with target patient groups on the package leaflet submitted by the MAH show that the package leaflet meets the criteria for readability as set out in the Guideline on the readability of the label and package leaflet of medicinal products for human use.
3. Benefit-Risk Balance
3.1. Therapeutic Context
3.1.1. Disease or condition
Behçet’s disease is a chronic multisystem variable vessel vasculitis including manifestations of oral and genital ulcers, skin lesions, uveitis, arthritis, vascular, CNS, and GI involvement. Oral ulcers are usually the first and most frequent manifestation of BD. Oral ulcers are characterized by a relapsing and remitting course.
Behçet’s disease may result in irreversible deficits, disability, and considerable morbidity leading to impaired QoL and mortality. Due to the severity and frequency of reoccurrence of oral ulcers, observed in nearly every patient, they are an important aspect of the chronically debilitating nature of BD.
Oral ulcers cause severe pain and interfere with activities of daily life, such as normal chewing and tooth brushing, leading to poor diet and nutrition, weight loss, and periodontal disease. Interference with routine oral hygiene caused by recurrent and painful oral ulcers leads to an increase in bacterial plaque accumulation. Altered bacterial plaque ecology and immune response to usual oral microorganisms can lead to worsening periodontal disease. Additionally, the increased oral microbial stimuli in BD may trigger further oral ulcer formation in these patients. Increased periodontal disease has been associated with

Extension of indication variation assessment report EMA/135313/2020 Page 96/102
worsening and recurrence of systemic symptoms of BD and it has been suggested in the literature that advanced periodontal disease may represent a risk factor for severe organ involvement.
Recurrent oral ulcers not only have an impact on activities of daily living but also have a substantial impact on health related QoL. Impaired physical function and pain due to oral ulcers contribute to impaired QoL. The impact of oral ulcers on oral health also contributes to reduced QoL through effects on self-esteem, self-expression, communication, and facial aesthetic value.
3.1.2. Available therapies and unmet medical need
There are no medications approved for the treatment of BD or any BD manifestations throughout the EU via the centralised procedure. The treatment of BD is generally empiric and the drug of choice is based on specific clinical manifestations in each patient. The treatment of mucocutaneous involvement depends on the severity of the disease. Topical treatment with steroid preparations is often used for the treatment of oral ulcers. In addition to topical corticosteroids, supportive care, including lidocaine gel and/or chlorhexidine, are also used for oral ulcers.
The EULAR guidelines recommend colchicine to be considered first only based on the well-established safety and tolerability profile.
Drugs such as azathioprine, thalidomide, IFN-α, or TNF-α inhibitors are recommended for consideration for patients whose lesions continue to recur despite colchicine use.
3.1.3. Main clinical studies
The extension of indication for apremilast in the treatment of patients with BD is supported by a pivotal study (BCT-002) and a supportive study (BCT-001).
Study BCT-002 is a pivotal, Phase 3, multicenter, randomized, parallel-group study to evaluate the efficacy and safety of apremilast in the treatment of subjects with active BD. Efficacy data on apremilast up to 64 weeks were provided including 12-week placebo-controlled treatment phase and the 52-week active treatment phase.
The study population consisted of male and female subjects at least 18 years of age with a BD diagnosis meeting the ISG criteria for BD, without currently active major organ involvement, who had at least 2 oral ulcers at the Screening Visit and at least 2 oral or 3 ulcers on the day of randomiation. A total of 179 patients completed the placebo-controlled treatment phase. Of the 178 subjects who entered the active treatment phase, 143 subjects (80.3%) completed Week 64 (apremilast 75/95 subjects [78.9%]; placebo 68/83 subjects [81.9%]). The baseline demographics were comparable across treatment groups and were representative of a patient population with active BD.
Study BCT-001 is a supportive phase 2, multicenter, randomized, double blind, placebo-controlled study to evaluate the efficacy and safety of apremilast in the treatment of subjects with active BD. Efficacy data on apremilast up to 24 weeks were provided including a 12-week placebo-controlled treatment phase and a 12-week active treatment phase. Subjects had active BD with ulcers (oral and/or genital) within 28 days prior to screening and at least 2 oral ulcers at the time of randomization. Subjects with currently active major organ involvement were not allowed in the study. A total of 111 subjects were randomized 1:1 to either APR 30 BID (n = 55) or placebo (n = 56) in this study.
In Studies BCT-001 and BCT-002, patients treated with apremilast received apremilast 30 mg twice daily.
Extension of indication variation assessment report EMA/135313/2020 Page 97/102
3.2. Favourable effects
In the pivotal phase 3 study (BCT-002), the primary endpoint AUC 0-12 week for the number of ulcers showed a treatment difference of 92.60 ulcers in favour of apremilast over placebo which was statistically significant (p<0.0001). This was also demonstrated in the phase 2 study (BCT-001) with a treatment difference at Week 12 between apremilast and placebo of 104.12 (p<0.0001).
The clinical benefit was demonstrated in the apremilast treatment arm compared to the placebo treatment arm on the several secondary endpoints at Week 12. In Study BCT-002, the number of oral ulcers was lower in apremilast arm versus placebo -0.98 (RR =0.52; p-value=0.003). Similarly, in the phase 2 study BCT-001, a LS mean difference on the number of oral ulcers of –1.6 was observed between apremilast and placebo groups (p< 0.0001).
Improvements in oral ulcer pain from baseline was observed at Week 12 with a difference in LS mean in apremilast versus placebo of -24.8 for BCT-002 and of -28.7 in BCT-001(p < 0.0001 in both studies). The reduction in oral ulcer pain from baseline in patients treated with APR 30 BID (LS mean change from baseline of -40.7) is clinically relevant as the magnitude of improvement observed is 4-fold greater than the MCID of a 10-mm decreased from baseline.
Complete oral ulcer responses at Week 12 were also higher for apremilast over placebo, by 30.6% in Study BCT-002 and 36.9% in Study BCT-001(p < 0.0001 in both studies).
Improvements in disease activity scores were also demonstrated at Week 12. BSAS showed an improvement of -11.94 in Study BCT-002 and -13.67 in Study BCT-001 (p < 0.0001 in both studies). BDCAI improved by a reduction of -0.5 in Study BCT-002 (p< 0.0335) and -1.1 in Study BCT-001 (p<0.0007). BSAS mean scores were statistically significantly reduced from baseline at Week 12 in the APR 30 BID treatment group compared with the placebo treatment group (LS mean change of -17.35 versus -5.41, respectively; p < 0.0001). The difference between the groups of more than 3-fold decrease in BD activity in the APR 30 BID treatment group compared with the placebo treatment group is considered clinically significant by the CHMP in the absence of a MCID established for BSAS.
In Study BCT-002, both patient perception and clinician overall perception of disease activity improved, with a difference in LS means in treatment comparison apremilast versus placebo of -1.0 and -0.9, respectively (p< 0.0001).
Improvements in BD QoL and SF-36 physical function scale score were also observed in patients treated with apremilast in Study BCT-002.
Maintenance of effect was seen over 64 weeks in Study BCT-002, which is considered suitable by the CHMP to support the chronic use of apremilast in the treatment of BD. A slight decrease in BSAS score of 3.1 was observed at Week 64 compared to Week 12, which is considered by the CHMP unlikely to be clinically relevant. Maintenance of the effects will be followed in the post marketing setting through routine pharmacovigilance.
3.3. Uncertainties and limitations about favourable effects
The dose of 30 mg BID chosen for BD was based on a previous study in psoriasis patients, it is uncertain whether higher doses would have resulted in better efficacy results for patients with BD. However, the selected dose of 30mg BID is agreed by CHMP considering the rare setting of BD in which conducting additional studies for dose finding may not be feasible and based on the clinically significant effects in BD patients demonstrated at this dose.
Some patients enrolled had also genital ulcers which can be a common manifestation. However, the number of patients enrolled was too low, so the efficacy cannot be extrapolated to this population.

Extension of indication variation assessment report EMA/135313/2020 Page 98/102
The populations investigated were relatively mild Behcet’s Disease patients as patients enrolled were without any active major organ involvement of BD and had ≥ 2 oral ulcers at randomisation. It is not known how effective Otezla would be in patients with more severe disease or for patients on other systemic therapies. The severity of the studied BD patients is appropriately reflected in Section 5.1 of SmPC.
3.4. Unfavourable effects
The adverse events and risks related to apremilast have been already characterised in a large safety database. The adverse event profile appears similar to other phosphodiesterase 4 inhibitors. No new safety issues were identified during the course of the Behcet’s studies.
There were no deaths and serious adverse event rates were broadly similar in the treatment and placebo arms of both studies.
During the Placebo-controlled Period, (CC-10004-BCT-002), the SOCs in the apremilast treatment arm with a subject incidence ≥ 5% and a higher incidence compared with the placebo treatment group were Gastrointestinal Disorders (55.8% v 39.8%), infections and Infestations (31.7% v 25.2%), nervous system disorders (23.1% v 18.4%), musculoskeletal disorders (16.3% v 14.6%), and respiratory, thoracic and mediastinal disorders (6.7% v 3.9%).
The most frequently reported TEAEs (in ≥ 5% of subjects in any treatment group) during the placebo-controlled period in decreasing order of frequency in the APR 30 BID treatment arm and occurring more frequently in the APR 30 BID treatment arm compared to placebo were diarrhoea (41.3% v 20.4%), nausea (19.2% v 10.7%), headache (14.4% v 10.7%), upper respiratory tract infection (11.5% v 4.9%), abdominal pain upper (8.7% v 1.9%), vomiting (8.7% v 1.9%), back pain (7.7% v 5.8%), viral upper respiratory tract infection (6.7% v 4.9%), and arthralgia (5.8% v 2.9%). Two had loss of appetite (1.9% v 0%). One each in the placebo and apremilast arm experienced weight loss during the placebo-controlled phase. The frequency of upper respiratory tract infection, headache, diarrhoea and nausea recorded in the apremilast population during the placebo-controlled phase was higher than reported in PsA and PSOR clinical studies, this is adequately reflected in section 4.8 of the SmPC.
3.5. Uncertainties and limitations about unfavourable effects
In total, 124 Behcet’s patients have been exposed to treatment with apremilast for at least 1 year. This population sample would be too small to identify rarer but important adverse events specific to the Behcet’s disease population. Longer term safety will be followed in the post marketing setting through routine pharmacovigilance.
Older patients were not included in the Behcet’s disease studies. It is therefore difficult to predict whether this patient group would have similar safety issues to the younger patients. This is acceptable by the CHMP as the SmPC includes pharmacokinetics and safety information on elderlies.
The rates of diarrhoea were higher in the pivotal study BCT-002 than in studies for PsA and PSOR. The MAH described this as artefactual and related to the small population size for the Behcet’s studies compared to exposure in studies for PSA and PSOR. The CHMP considers that it is unclear whether this is the case or not. The higher frequency is appropriately reflected in Section 4.8 of the SmPC.
It is also noted that there were lower rates of weight loss and decreased appetite in the pivotal study compared to rates in the PSA/PSOR population.

Extension of indication variation assessment report EMA/135313/2020 Page 99/102
3.6. Effects Table
Table 1. Effects Table for Otezla for the treatment of adult patients with oral ulcers associated with Behçet’s disease (BD) who are candidates for systemic therapy.
Effect Short description Unit Treatment Control Uncertainties / Strength of evidence
References
Favourable Effects AUC 0-12 oral ulcers VAS at Week 12 (LS mean)
Area under the curve (AUC) for the number of oral ulcers from baseline through Week 12. Change from baseline in the pain of oral ulcers as measured by VAS at Week 12
Number LS mean Number LS mean
129.54 -40.7
222.14 -15.9
2-sided 95% CI -130.59, -54.60 P-value <0.0001 2-sided 95% CI -32.8, -16.8 P-value < 0.0001
Study BCT-002 (Pivotal Phase 3)
BSAS at Week 12 BDCAF score at Week 12 Behçet’s Disease Current Activity Index Score
Change from Baseline in Behçet’s Syndrome Activity Score (BSAS) at Week 12 Change from baseline in disease activity as measured by Behçet’s Disease Current Activity scores (BD Current Activity Form) at Week 12
Number LS mean Number LS mean
-17.35 -0.9
-5.41 -0.4
2-sided 95% CI -16.20, -7.67 P < 0.0001 Difference in LS Means -0.5 2-sided 95% CI -1.0, 0.0 P=0.0335
Oral ulcer Complete response rate at Week 12
Proportion of subjects achieving an oral ulcer complete response (oral ulcer-free) by Week 6 and remaining oral ulcer free at every visit for at least 6 additional weeks during the Placebo-controlled Treatment Phase
% 29.8% 4.9% 2-sided 95% CI 15.5, 34.6 P < 0.0001
Unfavourable Effects Diarrhoea Subjects with AEs at
Week 12
% 41.3% 20.4% Study BCT-002
(Pivotal phase 3) Nausea Subjects with AEs at
Week 12
% 19.2% 10.7%
Headache Subjects with AEs at Week 12
% 14.4% 10.7%

Extension of indication variation assessment report EMA/135313/2020 Page 100/102
Effect Short description Unit Treatment Control Uncertainties / Strength of evidence
References
URTI Subjects with AEs at Week 12
% 11.5% 4.9%
Abdominal
pain upper
Subjects with AEs at Week 12
% 8.7% 1.9%
Vomiting Subjects with AEs at Week 12
% 8.7% 1.9%
Back pain Subjects with AEs at Week 12
% 7.7% 5.8%
Viral URTI Subjects with AEs at Week 12
% 6.7% 4.9%
Arthralgia Subjects with AEs at Week 12
% 5.8% 2.9%
URTI=upper respiratory tract infection; VAS=visual analogue scale
3.7. Benefit-risk assessment and discussion
3.7.1. Importance of favourable and unfavourable effects
Due to the recurrent nature of oral ulcers, BD patients require treatment over decades, ideally with effective agents that offer a favourable benefit/risk profile and convenient long-term dosing. Given the paucity and limitations of current BD treatments, the need for an effective oral agent with an acceptable safety profile is acknowledged by the CHMP.
A favourable beneficial effect was seen in the reduction in number and symptoms of ulcer ulcers associated with Behcet’s disease. The primary endpoint in Study BCT-002 was achieved; there was a statistically significantly lower AUCW0-12 of the number of oral ulcers in the apremilast treatment group compared to the placebo treatment group. A significant reduction in the number of oral ulcers at every visit through Week 12 was also observed and corroborated by a significant reduction in pain and a higher complete response rate at every visit. The benefits in measures of oral ulcers were accompanied by improvements in disease activity measures that evaluated other manifestations of BD, and overall perception of disease activity and level of discomfort reported by physicians and patients. The improvements in measures of oral ulcers and disease activity measures resulted in clinically meaningful improvements in patient-reported BD QoL, which included an evaluation of disease related restrictions on the subject’s activities and the subject’s emotional response to these restrictions. The favourable treatment benefit was also supported by significantly greater improvements in health-related quality of life. Treatment with apremilast resulted in clinically meaningful improvements in multiple physician and patient reported measures of oral ulcers.
Oral ulcers are a common symptom associated with Behcet’s Disease which can be resistant to commonly used topical and systemic treatments. Apremilast will provide additional treatment options for patients with BD.
There was a higher number of adverse events with apremilast compared to placebo especially for GIT, headache, upper respiratory tract infection, back pain and arthralgia. These adverse events are already listed in the SmPC. The events ‘upper respiratory tract infection’ and ‘headache’ were reported at a higher

Extension of indication variation assessment report EMA/135313/2020 Page 101/102
frequency category in BD Phase 3 study (‘very common’) than in the Ps and PsA Phase 3 studies (‘common’), the SmPC is updated accordingly. No new safety issues were identified.
3.7.2. Balance of benefits and risks
Apremilast provides a novel oral therapeutic agent for the treatment of adult patients with oral ulcers associated with Behçet’s disease (BD) who are candidates for systemic therapy. The pivotal study BCT-002 achieved the primary objective as a statistically significant improvement in the AUCW0-12 for the number of oral ulcers was seen following treatment with apremilast. The reduction in number of oral ulcers was associated with an improvement in the degree of oral ulcer pain and improvement observed in the BD disease activity measures (BSAS and BDCAF).
Adverse events for patients exposed up to 12 months have been identified, however, the majority of adverse events were mild to moderate intensity. All events were previously identified and already addressed in the SmPC.
As no curative solution is currently available, treatment of BD attempts to relieve symptoms, resolve inflammation, limit tissue damage, reduce recurrence frequency and severity, and prevent life-threatening complications. Choice of treatment depends on the combinations of clinical symptoms and the severity of organ involvement, with priority given to treatment of ocular, gastrointestinal, central nervous system and cardiovascular manifestations. However, as oral ulcers are a common symptom associated with the disease that can cause severe pain and may interfere with daily activities, Otezla provides an additional treatment option for patients with BD.
3.7.3. Additional considerations on the benefit-risk balance
None
3.8. Conclusions
The overall B/R of Otezla is positive.
4. Recommendations
Outcome
Based on the review of the submitted data, the CHMP considers the following variation acceptable and therefore recommends the variation to the terms of the Marketing Authorisation, concerning the following change:
Variation accepted Type Annexes affected
C.I.6.a C.I.6.a - Change(s) to therapeutic indication(s) - Addition of a new therapeutic indication or modification of an approved one
Type II I and IIIB
Extension of Indication to include treatment of adult patients with oral ulcers associated with Behçet’s disease (BD) who are candidates for systemic therapy. As a consequence, sections 4.1; 4.2; 4.8 and 5.1 of the SmPC are updated. The Package Leaflet is updated in accordance. In addition, the applicant took
Extension of indication variation assessment report EMA/135313/2020 Page 102/102
the opportunity to update the list of local representatives in the PL. Furthermore, the PI is brought in line with the latest QRD template v10.1. The updated RMP version 13.0 has also been submitted.
The variation leads to amendments to the Summary of Product Characteristics and Package Leaflet and to the Risk Management Plan (RMP).
Amendments to the marketing authorisation
In view of the data submitted with the variation, amendments to Annex(es) I and IIIB and to the Risk Management Plan are recommended.
Additional market protection
Furthermore, the CHMP reviewed the data submitted by the MAH, taking into account the provisions of Article 14(11) of Regulation (EC) No 726/2004, and considers that the new therapeutic indication brings significant clinical benefit in comparison with existing therapies (see appendix 1).
5. EPAR changes
The EPAR will be updated following Commission Decision for this variation. In particular the EPAR module 8 "steps after the authorisation" will be updated as follows:
Scope
Please refer to the Recommendations section above.
Summary
Please refer to Scientific Discussion ‘Otezla- EMEA/H/C/003746 -II-0029’


![imageserv11.team-logic.com...ONETOUCH TEST STRIPS; ULTRA, VERIO ONEXTON OPSUMIT ORACEA ORFADIN ORTHOVISC [INJ] oseltamivir OTEZLA OTOVEL OTREXUP [INJ] OVIDREL [INJ] oxcarbazepine oxybutynin](https://img.dokumen.tips/doc/110x75/604de3e06a6bae6edd6eaa2d/-onetouch-test-strips-ultra-verio-onexton-opsumit-oracea-orfadin-orthovisc.jpg)