Embed Size (px)
Citation preview

Invariant-mass distribution of jet pairs produced in association
with a W boson in pp collisions at√
s = 1.96 TeV using the full
CDF Run II data set
T. Aaltonen,21 S. Ameriojj,39 D. Amidei,31 A. Anastassovv,15 A. Annovi,17 J. Antos,12
G. Apollinari,15 J.A. Appel,15 T. Arisawa,52 A. Artikov,13 J. Asaadi,47 W. Ashmanskas,15
B. Auerbach,2 A. Aurisano,47 F. Azfar,38 W. Badgett,15 T. Bae,25 A. Barbaro-Galtieri,26
V.E. Barnes,43 B.A. Barnett,23 P. Barriall,41 P. Bartos,12 M. Baucejj,39 F. Bedeschi,41
S. Behari,15 G. Bellettinikk,41 J. Bellinger,54 D. Benjamin,14 A. Beretvas,15 A. Bhatti,45
K.R. Bland,5 B. Blumenfeld,23 A. Bocci,14 A. Bodek,44 D. Bortoletto,43 J. Boudreau,42
A. Boveia,11 L. Brigliadoriii,6 C. Bromberg,32 E. Brucken,21 J. Budagov,13 H.S. Budd,44
K. Burkett,15 G. Busettojj,39 P. Bussey,19 P. Buttikk,41 A. Buzatu,19 A. Calamba,10
S. Camarda,4 M. Campanelli,28 F. Canellicc,11 B. Carls,22 D. Carlsmith,54 R. Carosi,41
S. Carrillol,16 B. Casalj,9 M. Casarsa,48 A. Castroii,6 P. Catastini,20 D. Cauzqqrr,48
V. Cavaliere,22 M. Cavalli-Sforza,4 A. Cerrie,26 L. Cerritoq,28 Y.C. Chen,1 M. Chertok,7
G. Chiarelli,41 G. Chlachidze,15 K. Cho,25 D. Chokheli,13 A. Clark,18 C. Clarke,53
M.E. Convery,15 J. Conway,7 M. Corboy,15 M. Cordelli,17 C.A. Cox,7 D.J. Cox,7
M. Cremonesi,41 D. Cruz,47 J. Cuevasx,9 R. Culbertson,15 N. d’Ascenzou,15 M. Dattaff ,15
P. de Barbaro,44 L. Demortier,45 M. Deninno,6 M. D’Erricojj,39 F. Devoto,21
A. Di Cantokk,41 B. Di Ruzzap,15 J.R. Dittmann,5 S. Donatikk,41 M. D’Onofrio,27
M. Dorigoss,48 A. Driuttiqqrr,48 K. Ebina,52 R. Edgar,31 A. Elagin,47 R. Erbacher,7
S. Errede,22 B. Esham,22 S. Farrington,38 J.P. Fernandez Ramos,29 R. Field,16
G. Flanagans,15 R. Forrest,7 M. Franklin,20 J.C. Freeman,15 H. Frisch,11 Y. Funakoshi,52
C. Gallonikk,41 A.F. Garfinkel,43 P. Garosill,41 H. Gerberich,22 E. Gerchtein,15 S. Giagu,46
V. Giakoumopoulou,3 K. Gibson,42 C.M. Ginsburg,15 N. Giokaris,3 P. Giromini,17
G. Giurgiu,23 V. Glagolev,13 D. Glenzinski,15 M. Gold,34 D. Goldin,47 A. Golossanov,15
G. Gomez,9 G. Gomez-Ceballos,30 M. Goncharov,30 O. Gonzalez Lopez,29 I. Gorelov,34
A.T. Goshaw,14 K. Goulianos,45 E. Gramellini,6 S. Grinstein,4 C. Grosso-Pilcher,11
R.C. Group,51, 15 J. Guimaraes da Costa,20 S.R. Hahn,15 J.Y. Han,44 F. Happacher,17
K. Hara,49 M. Hare,50 R.F. Harr,53 T. Harrington-Taberm,15 K. Hatakeyama,5 C. Hays,38
1
FERMILAB-PUB-14-037-E
Operated by Fermi Research Alliance, LLC under Contract No. De-AC02-07CH11359 with the United States Department of Energy.

J. Heinrich,40 M. Herndon,54 A. Hocker,15 Z. Hong,47 W. Hopkinsf ,15 S. Hou,1
R.E. Hughes,35 U. Husemann,55 M. Husseinaa,32 J. Huston,32 G. Introzzinnoo,41 M. Ioripp,46
A. Ivanovo,7 E. James,15 D. Jang,10 B. Jayatilaka,15 E.J. Jeon,25 S. Jindariani,15 M. Jones,43
K.K. Joo,25 S.Y. Jun,10 T.R. Junk,15 M. Kambeitz,24 T. Kamon,25, 47 P.E. Karchin,53
A. Kasmi,5 Y. Katon,37 W. Ketchumgg,11 J. Keung,40 B. Kilminstercc,15 D.H. Kim,25
H.S. Kim,25 J.E. Kim,25 M.J. Kim,17 S.H. Kim,49 S.B. Kim,25 Y.J. Kim,25 Y.K. Kim,11
N. Kimura,52 M. Kirby,15 K. Knoepfel,15 K. Kondo,52, ∗ D.J. Kong,25 J. Konigsberg,16
A.V. Kotwal,14 M. Kreps,24 J. Kroll,40 M. Kruse,14 T. Kuhr,24 M. Kurata,49
A.T. Laasanen,43 S. Lammel,15 M. Lancaster,28 K. Lannonw,35 G. Latinoll,41 H.S. Lee,25
J.S. Lee,25 S. Leo,41 S. Leone,41 J.D. Lewis,15 A. Limosanir,14 E. Lipeles,40 A. Listera,18
H. Liu,51 Q. Liu,43 T. Liu,15 S. Lockwitz,55 A. Loginov,55 D. Lucchesijj,39 A. Luca,17
J. Lueck,24 P. Lujan,26 P. Lukens,15 G. Lungu,45 J. Lys,26 R. Lysakd,12 R. Madrak,15
P. Maestroll,41 S. Malik,45 G. Mancab,27 A. Manousakis-Katsikakis,3 L. Marchesehh,6
F. Margaroli,46 P. Marinomm,41 M. Martınez,4 K. Matera,22 M.E. Mattson,53
A. Mazzacane,15 P. Mazzanti,6 R. McNultyi,27 A. Mehta,27 P. Mehtala,21 C. Mesropian,45
T. Miao,15 D. Mietlicki,31 A. Mitra,1 H. Miyake,49 S. Moed,15 N. Moggi,6 C.S. Moony,15
R. Mooreddee,15 M.J. Morellomm,41 A. Mukherjee,15 Th. Muller,24 P. Murat,15 M. Mussiniii,6
J. Nachtmanm,15 Y. Nagai,49 J. Naganoma,52 I. Nakano,36 A. Napier,50 J. Nett,47 C. Neu,51
T. Nigmanov,42 L. Nodulman,2 S.Y. Noh,25 O. Norniella,22 L. Oakes,38 S.H. Oh,14
Y.D. Oh,25 I. Oksuzian,51 T. Okusawa,37 R. Orava,21 L. Ortolan,4 C. Pagliarone,48
E. Palenciae,9 P. Palni,34 V. Papadimitriou,15 W. Parker,54 G. Paulettaqqrr,48
M. Paulini,10 C. Paus,30 T.J. Phillips,14 G. Piacentino,41 E. Pianori,40 J. Pilot,7
K. Pitts,22 C. Plager,8 L. Pondrom,54 S. Poprockif ,15 K. Potamianos,26 A. Pranko,26
F. Prokoshinz,13 F. Ptohosg,17 G. Punzikk,41 N. Ranjan,43 I. Redondo Fernandez,29
P. Renton,38 M. Rescigno,46 F. Rimondi,6, ∗ L. Ristori,41, 15 A. Robson,19 T. Rodriguez,40
S. Rollih,50 M. Ronzanikk,41 R. Roser,15 J.L. Rosner,11 F. Ruffinill,41 A. Ruiz,9 J. Russ,10
V. Rusu,15 W.K. Sakumoto,44 Y. Sakurai,52 L. Santiqqrr,48 K. Sato,49 V. Savelievu,15
A. Savoy-Navarroy,15 P. Schlabach,15 E.E. Schmidt,15 T. Schwarz,31 L. Scodellaro,9
F. Scuri,41 S. Seidel,34 Y. Seiya,37 A. Semenov,13 F. Sforzakk,41 S.Z. Shalhout,7 T. Shears,27
P.F. Shepard,42 M. Shimojimat,49 M. Shochet,11 I. Shreyber-Tecker,33 A. Simonenko,13
2

K. Sliwa,50 J.R. Smith,7 F.D. Snider,15 H. Song,42 V. Sorin,4 R. St. Denis,19, ∗
M. Stancari,15 D. Stentzv,15 J. Strologas,34 Y. Sudo,49 A. Sukhanov,15 I. Suslov,13
K. Takemasa,49 Y. Takeuchi,49 J. Tang,11 M. Tecchio,31 P.K. Teng,1 J. Thomf ,15
E. Thomson,40 V. Thukral,47 D. Toback,47 S. Tokar,12 K. Tollefson,32 T. Tomura,49
D. Tonellie,15 S. Torre,17 D. Torretta,15 P. Totaro,39 M. Trovatomm,41 F. Ukegawa,49
S. Uozumi,25 F. Vazquezl,16 G. Velev,15 C. Vellidis,15 C. Vernierimm,41 M. Vidal,43
R. Vilar,9 J. Vizanbb,9 M. Vogel,34 G. Volpi,17 P. Wagner,40 R. Wallnyj,15 S.M. Wang,1
D. Waters,28 W.C. Wester III,15 D. Whitesonc,40 A.B. Wicklund,2 S. Wilbur,7
H.H. Williams,40 J.S. Wilson,31 P. Wilson,15 B.L. Winer,35 P. Wittichf ,15 S. Wolbers,15
H. Wolfe,35 T. Wright,31 X. Wu,18 Z. Wu,5 K. Yamamoto,37 D. Yamato,37 T. Yang,15
U.K. Yang,25 Y.C. Yang,25 W.-M. Yao,26 G.P. Yeh,15 K. Yim,15 J. Yoh,15 K. Yorita,52
T. Yoshidak,37 G.B. Yu,14 I. Yu,25 A.M. Zanetti,48 Y. Zeng,14 C. Zhou,14 and S. Zucchelliii6
(CDF Collaboration), †
1Institute of Physics, Academia Sinica,
Taipei, Taiwan 11529, Republic of China
2Argonne National Laboratory, Argonne, Illinois 60439, USA
3University of Athens, 157 71 Athens, Greece
4Institut de Fisica d’Altes Energies, ICREA,
Universitat Autonoma de Barcelona,
E-08193, Bellaterra (Barcelona), Spain
5Baylor University, Waco, Texas 76798, USA
6Istituto Nazionale di Fisica Nucleare Bologna,
iiUniversity of Bologna, I-40127 Bologna, Italy
7University of California, Davis, Davis, California 95616, USA
8University of California, Los Angeles,
Los Angeles, California 90024, USA
9Instituto de Fisica de Cantabria, CSIC-University of Cantabria, 39005 Santander, Spain
10Carnegie Mellon University, Pittsburgh, Pennsylvania 15213, USA
11Enrico Fermi Institute, University of Chicago, Chicago, Illinois 60637, USA
12Comenius University, 842 48 Bratislava,
3
Slovakia; Institute of Experimental Physics, 040 01 Kosice, Slovakia
13Joint Institute for Nuclear Research, RU-141980 Dubna, Russia
14Duke University, Durham, North Carolina 27708, USA
15Fermi National Accelerator Laboratory, Batavia, Illinois 60510, USA
16University of Florida, Gainesville, Florida 32611, USA
17Laboratori Nazionali di Frascati, Istituto Nazionale
di Fisica Nucleare, I-00044 Frascati, Italy
18University of Geneva, CH-1211 Geneva 4, Switzerland
19Glasgow University, Glasgow G12 8QQ, United Kingdom
20Harvard University, Cambridge, Massachusetts 02138, USA
21Division of High Energy Physics, Department of Physics,
University of Helsinki, FIN-00014, Helsinki,
Finland; Helsinki Institute of Physics, FIN-00014, Helsinki, Finland
22University of Illinois, Urbana, Illinois 61801, USA
23The Johns Hopkins University, Baltimore, Maryland 21218, USA
24Institut fur Experimentelle Kernphysik,
Karlsruhe Institute of Technology, D-76131 Karlsruhe, Germany
25Center for High Energy Physics: Kyungpook National University,
Daegu 702-701, Korea; Seoul National University, Seoul 151-742,
Korea; Sungkyunkwan University, Suwon 440-746,
Korea; Korea Institute of Science and Technology Information,
Daejeon 305-806, Korea; Chonnam National University,
Gwangju 500-757, Korea; Chonbuk National University, Jeonju 561-756,
Korea; Ewha Womans University, Seoul, 120-750, Korea
26Ernest Orlando Lawrence Berkeley National Laboratory, Berkeley, California 94720, USA
27University of Liverpool, Liverpool L69 7ZE, United Kingdom
28University College London, London WC1E 6BT, United Kingdom
29Centro de Investigaciones Energeticas
Medioambientales y Tecnologicas, E-28040 Madrid, Spain
30Massachusetts Institute of Technology,
Cambridge, Massachusetts 02139, USA
31University of Michigan, Ann Arbor, Michigan 48109, USA
4

32Michigan State University, East Lansing, Michigan 48824, USA
33Institution for Theoretical and Experimental Physics, ITEP, Moscow 117259, Russia
34University of New Mexico, Albuquerque, New Mexico 87131, USA
35The Ohio State University, Columbus, Ohio 43210, USA
36Okayama University, Okayama 700-8530, Japan
37Osaka City University, Osaka 558-8585, Japan
38University of Oxford, Oxford OX1 3RH, United Kingdom
39Istituto Nazionale di Fisica Nucleare, Sezione di Padova,
jjUniversity of Padova, I-35131 Padova, Italy
40University of Pennsylvania, Philadelphia, Pennsylvania 19104, USA
41Istituto Nazionale di Fisica Nucleare Pisa,
kkUniversity of Pisa, llUniversity of Siena,
mmScuola Normale Superiore, I-56127 Pisa,
Italy, nnINFN Pavia, I-27100 Pavia, Italy,
ooUniversity of Pavia, I-27100 Pavia, Italy
42University of Pittsburgh, Pittsburgh, Pennsylvania 15260, USA
43Purdue University, West Lafayette, Indiana 47907, USA
44University of Rochester, Rochester, New York 14627, USA
45The Rockefeller University, New York, New York 10065, USA
46Istituto Nazionale di Fisica Nucleare, Sezione di Roma 1,
ppSapienza Universita di Roma, I-00185 Roma, Italy
47Mitchell Institute for Fundamental Physics and Astronomy,
Texas A&M University, College Station, Texas 77843, USA
48Istituto Nazionale di Fisica Nucleare Trieste,
qqGruppo Collegato di Udine, rrUniversity of Udine,
I-33100 Udine, Italy, ssUniversity of Trieste, I-34127 Trieste, Italy
49University of Tsukuba, Tsukuba, Ibaraki 305, Japan
50Tufts University, Medford, Massachusetts 02155, USA
51University of Virginia, Charlottesville, Virginia 22906, USA
52Waseda University, Tokyo 169, Japan
53Wayne State University, Detroit, Michigan 48201, USA
54University of Wisconsin, Madison, Wisconsin 53706, USA
5

55Yale University, New Haven, Connecticut 06520, USA
Abstract
We report on a study of the dijet invariant-mass distribution in events with one identified lepton,
a significant imbalance in the total event transverse momentum, and two jets. This distribution is
sensitive to the possible production of a new particle in association with a W boson, where the boson
decays leptonically. We use the full data set of proton-antiproton collisions at 1.96 TeV center-
of-mass energy collected by the Collider Detector at the Fermilab Tevatron and corresponding to
an integrated luminosity of 8.9 fb−1. The data are found to be consistent with standard-model
expectations, and a 95% confidence level upper limit is set on the cross section for a W boson
produced in association with a new particle decaying into two jets.
PACS numbers: 12.15.Ji, 12.38.Qk, 14.80.-j
∗Deceased†With visitors from aUniversity of British Columbia, Vancouver, BC V6T 1Z1, Canada, bIstituto Nazionale
di Fisica Nucleare, Sezione di Cagliari, 09042 Monserrato (Cagliari), Italy, cUniversity of California Irvine,
Irvine, CA 92697, USA, dInstitute of Physics, Academy of Sciences of the Czech Republic, 182 21, Czech
Republic, eCERN, CH-1211 Geneva, Switzerland, fCornell University, Ithaca, NY 14853, USA, gUniversity
of Cyprus, Nicosia CY-1678, Cyprus, hOffice of Science, U.S. Department of Energy, Washington, DC 20585,
USA, iUniversity College Dublin, Dublin 4, Ireland, jETH, 8092 Zurich, Switzerland, kUniversity of Fukui,
Fukui City, Fukui Prefecture, Japan 910-0017, lUniversidad Iberoamericana, Lomas de Santa Fe, Mexico,
C.P. 01219, Distrito Federal, mUniversity of Iowa, Iowa City, IA 52242, USA, nKinki University, Higashi-
Osaka City, Japan 577-8502, oKansas State University, Manhattan, KS 66506, USA, pBrookhaven National
Laboratory, Upton, NY 11973, USA, qQueen Mary, University of London, London, E1 4NS, United King-
dom, rUniversity of Melbourne, Victoria 3010, Australia, sMuons, Inc., Batavia, IL 60510, USA, tNagasaki
Institute of Applied Science, Nagasaki 851-0193, Japan, uNational Research Nuclear University, Moscow
115409, Russia, vNorthwestern University, Evanston, IL 60208, USA, wUniversity of Notre Dame, Notre
Dame, IN 46556, USA, xUniversidad de Oviedo, E-33007 Oviedo, Spain, yCNRS-IN2P3, Paris, F-75205
France, zUniversidad Tecnica Federico Santa Maria, 110v Valparaiso, Chile, aaThe University of Jordan,
Amman 11942, Jordan, bbUniversite catholique de Louvain, 1348 Louvain-La-Neuve, Belgium, ccUniversity
of Zurich, 8006 Zurich, Switzerland, ddMassachusetts General Hospital, Boston, MA 02114 USA, eeHarvard
6

Medical School, Boston, MA 02114 USA, ffHampton University, Hampton, VA 23668, USA, ggLos Alamos
National Laboratory, Los Alamos, NM 87544, USA, hhUniversita degli Studi di Napoli Federico I, I-80138
Napoli, Italy
7

I. INTRODUCTION
At hadron colliders the production of jets in association with vector bosons allows for
precision tests of combined electroweak and quantum-chromodynamic (QCD) theoretical
predictions. Many extensions of the standard model (SM) predict significant deviations from
the SM predictions of the observable phenomena associated with these processes [1, 2, 3].
In a previous publication, we reported a disagreement between data and SM expectations
in a data sample corresponding to 4.3 fb−1 [4]. This disagreement appeared as an excess of
events in the 120-160 GeV/c2 invariant-mass range of the jet pairs (Mjj) for events selected
by requiring one identified lepton, an imbalance in the total event transverse momentum, and
two jets. Assuming that the excess of events over the SM prediction was due to an unknown
contribution, modeled as a Gaussian resonance with width compatible with the expected
dijet-mass resolution, the statistical significance of the excess was 3.2 standard deviations.
Similar searches carried out by the DØ [5], CMS [6], and ATLAS [7] collaborations did
not confirm the CDF result in events with the same topology. Another search for a dijet
resonance carried out by the CDF collaboration in events with large missing transverse
energy and two or three jets observed good agreement between data and SM expectations [8].
In this paper, we report on an update of the previous analysis [4] using the full CDF Run II
data set, which corresponds to more than doubling the candidate event sample. In addition
to the larger data set, we investigate in more detail a number of additional systematic
effects. As a result of these studies, improved calibrations of detector response and modeling
of instrumental backgrounds are used, yielding better agreement between data and SM
expectations as obtained from Monte Carlo (MC) event generators. By incorporating these
improved models, we perform a search for an excess of events over SM expectations in the
dijet mass spectrum equivalent to the search described in Ref. [4].
The paper is structured as follows. In Sec. II we describe the CDF II detector and the
reconstruction of the final-state particles. In Sec. III we describe the independent energy
corrections for simulated quark and gluon jets. In Sec. IV we describe the candidate event
selection and the expected composition of the sample. The background modeling is described
in Sec. V. The fitting method used in the analysis is described in Sec. VI A, and the results
are given in Sec. VI B. We discuss the conclusions in Sec. VII.
More information about the studies reported in this paper can be found in Ref. [9].
8
II. EVENT DETECTION AND RECONSTRUCTION
Details on the CDF II detector and the event reconstruction are described elsewhere [10].
The detector is cylindrically symmetric around the z direction, which is oriented along the
proton beam axis. The polar angle, θ, is measured from the origin of the coordinate system
at the center of the detector with respect to the z axis. Pseudorapidity, transverse energy,
and transverse momentum are defined as η=− ln tan(θ/2), ET =E sin θ, and pT =p sin θ re-
spectively, where E is the energy measured in a calorimeter tower (or related to an energy
cluster) with centroid at angle θ with respect to the nominal collision point, and p is a
charged-particle momentum. The azimuthal angle is labeled φ. Trajectories of charged par-
ticles (tracks) are determined using a tracking system immersed in a 1.4 T magnetic field,
aligned coaxially with the pp beams. A silicon microstrip detector provides tracking over the
radial range 1.5 to 28 cm. A 3.1 m long open-cell drift chamber, the Central Outer Tracker
(COT), covers the radial range from 40 to 137 cm and provides up to 96 measurements.
Sense wires are arranged in eight alternating axial and ±2◦ stereo “superlayers” with 12
wires each. The fiducial region of the silicon detector extends to |η| ≈ 2, while the COT
provides full coverage for |η| <∼ 1. The momentum resolution for charged particles in the
COT is δpT /p2T ≈ 0.0015, where pT is in units of GeV/c. The central and plug calorimeters,
which cover the pseudorapidity regions of |η| < 1.1 and 1.1 < |η| < 3.6 respectively, are
divided into a front electromagnetic and a rear hadronic compartment, which surround the
tracking system in a projective-tower geometry. Muons with |η| < 1 are detected by drift
chambers and scintillation counters located outside the hadronic calorimeters.
Contiguous groups of calorimeter towers with signals exceeding a preset minimum are
identified and summed together into energy clusters. An electron candidate, referred to as a
“tight central electron”, is identified in the central electromagnetic calorimeter as an isolated,
mostly electromagnetic cluster matched to a reconstructed track in the pseudorapidity range
|η| < 1.1. The electron transverse energy is reconstructed from the electromagnetic cluster
with an uncertainty σ(ET )/ET ≈ 13.5%/√
ET (GeV) ⊕ 1.5%.
A hadron jet is identified as a cluster of calorimeter energies contained within a cone of
radius ∆R ≡√
(∆φ)2 + (∆η)2 = 0.4, where ∆η and ∆φ are the distances in pseudorapidity
and azimuthal angle between a tower center and the cluster axis. Jet energies are corrected
for a number of effects that bias the measurement [11]. These corrections include imposing
9
uniformity of calorimeter response as a function of |η|, removing expected contributions from
multiple pp interactions per bunch crossing, and accounting for nonlinear response of the
calorimeters. These corrections are applied generically to all reconstructed jets independent
of the flavor of the associated parton, which is responsible for initiating the particle shower.
Recent studies demonstrate the need for additional corrections to the reconstructed energies
of jets in simulated events dependent on the flavor of the initiating parton in order to
correctly model the observed energy scale of reconstructed jets in data [12]. These additional
corrections, applied in the analysis described here, are discussed in greater detail in Sec. III.
Muons are identified in three independent subdetectors. Muons with |η| ≤ 0.6 and
pT > 1.4 GeV/c are detected in four layers of planar drift chambers (CMU) located outside
the central calorimeter at five interaction lengths. Muons with |η| ≤ 0.6 and pT > 2.8 GeV/c
are detected in four additional layers of drift chambers (CMP) located at eight interaction
lengths of calorimeter and steel absorber. Muons with 0.6 ≤ |η| ≤ 1.0 and pT > 2.2 GeV/c
are detected by a system of eight layers of drift chambers and scintillation counters (CMX)
located outsied the calorimeter at six to ten absorption lengths. Muon candidates are
identified by extrapolating isolated tracks to track segments in the muon detector systems.
Missing transverse energy (E/T ) is defined as the magnitude of the vector sum of all
calorimeter-tower energy depositions projected on the transverse plane. It is used as a
measure of the sum of the transverse momenta of the particles that escape detection, most
notably neutrinos. The vector sum includes corrected jet energies and also the momenta
of high-pT muon candidates, which deposit only a small fraction of their energy in the
calorimeter.
III. QUARK AND GLUON ENERGY SCALE MODELING
The modeling of calorimeter response to particle showers originating from quarks and
gluons is dependent on the different fragmentation and hadronization models used in the
simulation for each. Hence, the level of agreement between the simulated and observed
energy scales of jets originating from quarks and gluons can differ significantly. We derive
specific corrections for the calorimeter response to quark and gluon jets in simulated events
using two independent samples of jets with different quark fraction. We use one sample
where a jet is emitted in an opposite direction with respect to an energetic photon in the
10
transervse plane, and another sample of Z → ℓ+ℓ−+ jet events (ℓ being an electron or
muon). The former sample is richer in quark jets, the latter in gluon jets. Photon and Z-
boson energies are measured more accurately than jet energies and can be used to calibrate
the jet energy as described below. The criteria for selecting events with a photon or Z boson
associated with only one jet are described in Ref. [12].
We derive independent corrections for the quark and gluon jet-energy scales in data and
simulation through Z+jet and γ+jet samples. We define the jet-balance in Z+jet or γ+jet
events as follows:
KZ,γ = (ETjet/pZ,γ
T ) − 1. (1)
The measured average balance is corrected with a jet-energy correction factor of 1/(KZ,γ+1).
The jet balance in Eq. (1) can be rewritten as the weighted average of the balance variables
for quark and gluon jets, Kq and Kg respectively. If F q,gX is the quark, or gluon fraction in
sample X, then we write
KZ = F qZKq + F g
ZKg = F qZKq + (1 − F q
Z)Kg (2)
Kγ = F qγ Kq + F g
γ Kg = F qγ Kq + (1 − F q
γ )Kg, (3)
or, solving for Kq and Kg,
Kq =1
F qγ − F q
Z
[(1 − F qZ)Kγ − (1 − F q
γ )KZ ] (4)
Kg =1
F qγ − F q
Z
[F qγ KZ − F q
ZKγ]. (5)
These equations apply separately to data and MC simulation with distinct balance factors
KXd and KX
MC and can include a dependence on the energy of the jet, F qX → F q
X(ETjet)
and KX → KX(ETjet).
In order to solve for Kq and Kg, we need to input the values of KZ,γ and F qZ,γ. We extract
the former in data and simulation by constructing the balancing distribution, as defined in
Eq. (1), in bins of ETjet, and fitting the core of the distribution around its maximum with
a Gaussian function. We determine F qZ,γ in simulation by matching jets to their originating
partons, by requiring ∆R < 0.4 between the parton and the jet. In the γ+jet balancing
sample the quark fraction is about 85% at ETjet ≈ 30 GeV, and reduces to about 71% at
11

ETjet ≈ 70 GeV. In the Z+jet balancing sample this fraction is about 38% and 49% in the
same ETjet ranges. In data, it is not possible to match jets to their originating parton, and
we rely on the values of F qZ,γ(ET
jet) extracted from the simulated samples.
Using Eqs. (4)-(5), we derive Kq and Kg in data and simulation as functions of jet
ET . Rather than correcting both data and simulation, the factors Kq and Kg are used
to determine the corrections to simulated jets, in order to best match the energy scale
observed in data. These corrections are defined as (Kqd + 1)/(Kq
MC + 1) for quark jets and
(Kgd + 1)/(Kg
MC + 1) for gluon jets, the extracted values for which are shown in Fig. 1.
The transverse energy threshold of the photon online event-selection (trigger) is 25 GeV
[13], so reliable balancing information is not available for jets with energies less than 27.5
GeV in the photon-triggered sample. Since we are interested in jets with energies extending
down to 20 GeV, we extrapolate the quark-jet-energy corrections to lower jet energies, and
use the Z+jet balancing sample to extract a gluon correction assuming this extrapolated
quark correction.
As both the quark and gluon corrections do not depend on jet energy for jets with
ET ≥ 15 GeV, we fit them to a constant. To better match the data, quark-jet energies in the
simulation should be increased by (1.4±2.7)%, while gluon-jet energies should be decreased
by (7.9± 4.4)%. The reported uncertainties are the sum in quadrature of the statistical and
systematic contributions. The systematic sources are dominated by a 10% uncertainty on
the quark fractions in the Z+jet or γ+jet balancing samples. The uncertainty is estimated
by fitting the data distribution of a quark-gluon discriminant parameter [12] with quark
and gluon templates from simulation. The average deviation of the extracted quark fraction
from the prediction is taken as the systematic uncertainty on the quark fraction. Other
sources of systematic uncertainties include the extrapolation to low quark-jet energy and
the differences between the allowed number of interaction vertices in the Z+jet and γ+jet
samples. The sizes of statistical and systematic uncertainties are comparable. Because of
the default corrections applied to reconstructed jet energies, which are designed to equate
the energy scales for simulated and observed jets on average, uncertainties on the additional,
independent corrections derived for quark and gluon jets are necessarily anticorrelated with
one another. Combination of these two anticorrelated uncertainties encompasses the un-
certainty on the absolute energy scale for generic jets, which is the dominant uncertainty
assigned to the default CDF jet-energy corrections. In order to avoid double-counting, only
12

the anticorrelated uncertainties associated with the additional quark and gluon corrections
are applied within this analysis. The observation that the additional energy-scale correction
for quark jets is consisten with unity within measurement uncertainties is consistent with the
in situ calibration of light-quark jet energies performed in conjunction with the top-quark
mass measurement [14].
Similar studies in the Z+jet balancing sample show that the calorimeter responses to
heavy-flavor quark jets in simulation and data agree. Since the uncertainty on the energy
scale of heavy-quark jets relative to that of light-quark jets is roughly 1% [15], possible
discrepancies of the calorimeter responses to heavy-flavor quark jets in simulation and data
are expected to be covered by the light-quark jet-energy-scale uncertainty.
[GeV]TJet E
20 40 60 80
Cor
rect
ions
for
sim
ulat
ed je
ts
0.7
0.8
0.9
1
1.1
[GeV]TJet E
20 40 60 800.7
0.8
0.9
1
1.1
Quark correctionsGluon corrections
0.027±Quark-jet corrections = 1.014 0.044±Gluon-jet corrections = 0.921
FIG. 1. Derived energy scale corrections for simulated quark jets and gluon jets as a
function of jet ET . The open triangles represent corrections derived jointly from the γ+jet
and Z+jet balancing samples, while the filled triangles in the low-jet ET region are
obtained from the Z+jet sample only, assuming a constant correction for the quark
jet-energy scale. Error bars are from statistical sources only. The short dashed lines show
the fits to constant energy corrections, and the long dashed lines represent the total
systematic uncertainty bands on the correction determined by the fit.
13
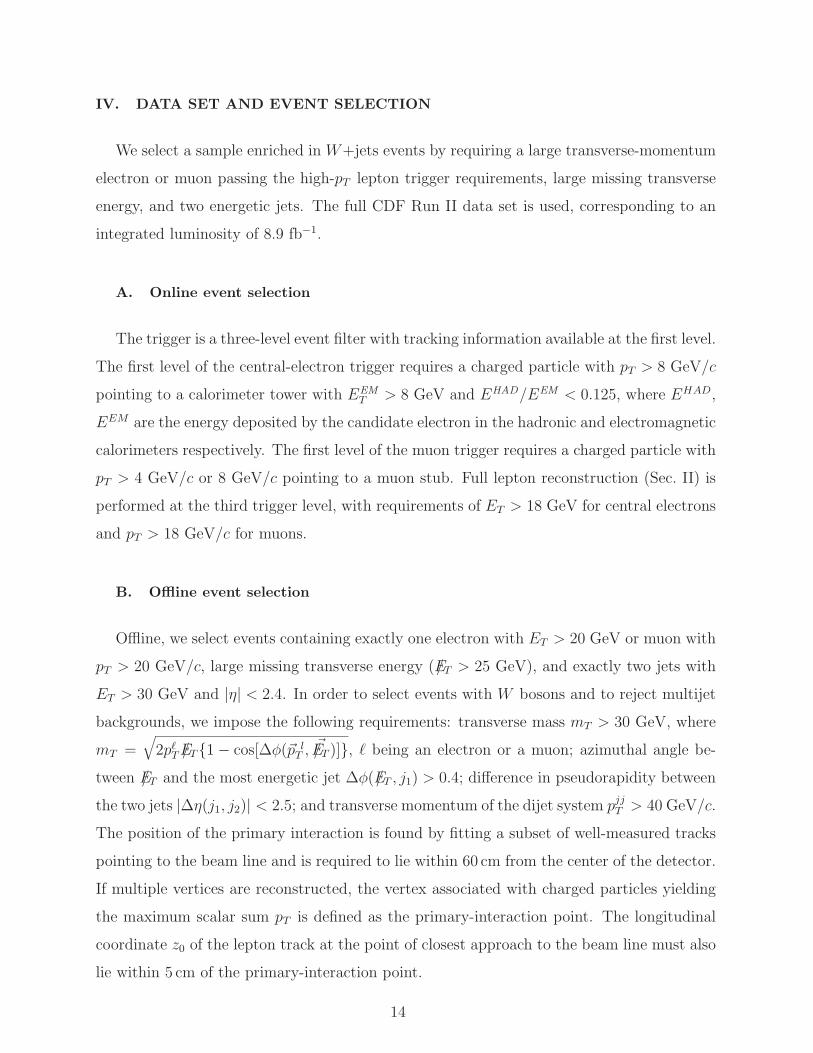
IV. DATA SET AND EVENT SELECTION
We select a sample enriched in W+jets events by requiring a large transverse-momentum
electron or muon passing the high-pT lepton trigger requirements, large missing transverse
energy, and two energetic jets. The full CDF Run II data set is used, corresponding to an
integrated luminosity of 8.9 fb−1.
A. Online event selection
The trigger is a three-level event filter with tracking information available at the first level.
The first level of the central-electron trigger requires a charged particle with pT > 8 GeV/c
pointing to a calorimeter tower with EEMT > 8 GeV and EHAD/EEM < 0.125, where EHAD,
EEM are the energy deposited by the candidate electron in the hadronic and electromagnetic
calorimeters respectively. The first level of the muon trigger requires a charged particle with
pT > 4 GeV/c or 8 GeV/c pointing to a muon stub. Full lepton reconstruction (Sec. II) is
performed at the third trigger level, with requirements of ET > 18 GeV for central electrons
and pT > 18 GeV/c for muons.
B. Offline event selection
Offline, we select events containing exactly one electron with ET > 20 GeV or muon with
pT > 20 GeV/c, large missing transverse energy (E/T > 25 GeV), and exactly two jets with
ET > 30 GeV and |η| < 2.4. In order to select events with W bosons and to reject multijet
backgrounds, we impose the following requirements: transverse mass mT > 30 GeV, where
mT =√
2pℓT E/T{1 − cos[∆φ(~p l
T , ~E/T )]}, ℓ being an electron or a muon; azimuthal angle be-
tween E/T and the most energetic jet ∆φ(E/T , j1) > 0.4; difference in pseudorapidity between
the two jets |∆η(j1, j2)| < 2.5; and transverse momentum of the dijet system pjjT > 40 GeV/c.
The position of the primary interaction is found by fitting a subset of well-measured tracks
pointing to the beam line and is required to lie within 60 cm from the center of the detector.
If multiple vertices are reconstructed, the vertex associated with charged particles yielding
the maximum scalar sum pT is defined as the primary-interaction point. The longitudinal
coordinate z0 of the lepton track at the point of closest approach to the beam line must also
lie within 5 cm of the primary-interaction point.
14
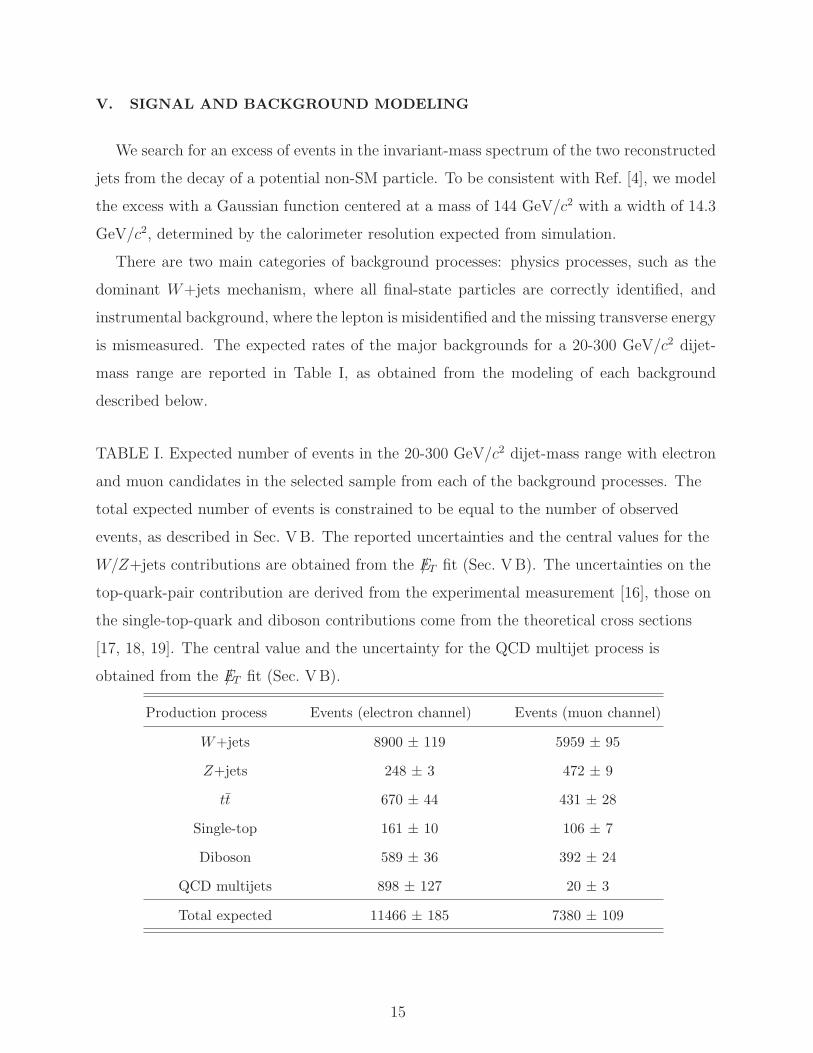
V. SIGNAL AND BACKGROUND MODELING
We search for an excess of events in the invariant-mass spectrum of the two reconstructed
jets from the decay of a potential non-SM particle. To be consistent with Ref. [4], we model
the excess with a Gaussian function centered at a mass of 144 GeV/c2 with a width of 14.3
GeV/c2, determined by the calorimeter resolution expected from simulation.
There are two main categories of background processes: physics processes, such as the
dominant W+jets mechanism, where all final-state particles are correctly identified, and
instrumental background, where the lepton is misidentified and the missing transverse energy
is mismeasured. The expected rates of the major backgrounds for a 20-300 GeV/c2 dijet-
mass range are reported in Table I, as obtained from the modeling of each background
described below.
TABLE I. Expected number of events in the 20-300 GeV/c2 dijet-mass range with electron
and muon candidates in the selected sample from each of the background processes. The
total expected number of events is constrained to be equal to the number of observed
events, as described in Sec. V B. The reported uncertainties and the central values for the
W/Z+jets contributions are obtained from the E/T fit (Sec. V B). The uncertainties on the
top-quark-pair contribution are derived from the experimental measurement [16], those on
the single-top-quark and diboson contributions come from the theoretical cross sections
[17, 18, 19]. The central value and the uncertainty for the QCD multijet process is
obtained from the E/T fit (Sec. V B).
Production process Events (electron channel) Events (muon channel)
W+jets 8900 ± 119 5959 ± 95
Z+jets 248 ± 3 472 ± 9
tt 670 ± 44 431 ± 28
Single-top 161 ± 10 106 ± 7
Diboson 589 ± 36 392 ± 24
QCD multijets 898 ± 127 20 ± 3
Total expected 11466 ± 185 7380 ± 109
15

A. Physics backgrounds: W/Z+jets, top-quark, and diboson production
The dominant contributing process to the selected sample is the associated production
of W bosons and jets. Another process with a non-zero contribution to the selected sample
is Z+jets, where a lepton from the Z-boson decay is not detected. The predicted ratio
between number of events with heavy-flavor and light-flavor jets in W/Z+jets processes is
about 10%. To study the effects of W+jets and Z+jets processes, events are generated
using alpgen [20] interfaced with pythia [21] for parton showering and hadronization.
Because of large uncertainties associated with the NLO calculations [22], the magnitude of
W+jets and Z+jets contributions is obtained from a fit to the data, where the ratio of the
W+jets cross section to Z+jets cross sections is constrained to 3.5 as predicted by theory.
Top-quark pair production is modeled with events simulated using pythia and assuming
a top-quark mass of 172.5 GeV/c2. The magnitude of the simulated top-pair contribution
is normalized based on the latest CDF measurement on an independent sample with one
identified lepton, significant transverse momentum imbalance, and at least three jets [16].
The uncertainty of the top-quark pair cross section is 7%. Processes producing a single
top quark are modeled by the madevent event generator [23] interfaced to pythia for
showering and hadronization. The cross sections are normalized to the next-to-next-leading
order (NNLO) plus next-to-next leading log (NNLL) for the s-channel [17] and next-to-
next-to-next-leading order (NNNLO) plus next-to-leading log (NLL) for the t-channel [18]
theoretical calculations, with uncertainties of 11%.
Diboson (WW, WZ, ZZ) production is modeled with pythia. Expected diboson con-
tributions are normalized based on the theoretical NLO cross sections [19]. The resulting
uncertainty on the diboson contribution is roughly 6%.
The remaining background process is multijet production, where one jet mimics the
experimental signature of a lepton and a mismeasurement in the calorimeter leads to spurious
E/T in the event. We use data to model this contribution, as described in Sec. V B.
Other sources of systematic uncertainties that affect the background normalizations are
those associated with the luminosity measurement (6%) [26], effects of initial-state and final-
state radiation (2.5%), modeling of the parton distribution functions (2.2%), modeling of the
jet-energy scale (2.7% for quark jets and 4.4% for gluon jets with a 100% anticorrelation),
modeling of the jet-energy resolution (0.7%), and modeling of the trigger efficiency (2.2%).
16

In addition to uncertainties on the expected contributions from each background process, we
also consider systematic uncertainties that affect the shape of the invariant-mass distribution
for each process. The most important are the uncertainties on the jet-energy scale and on
the renormalization and factorization scales in the W + jets process, which are taken to be
equal. For modeling the former, two alternative invariant-mass distributions are obtained
by varying the jet-energy scale within its expected ±1σ uncertainty. For the latter, the
factorization scale used in the event generation [27] is doubled and halved in order to obtain
two alternative shapes. As an example, the relative difference between the varied and
nominal shapes for the dominant background process (W+jets) due to the jet-energy-scale
variation is shown in Fig. 2.
]2Dijet-Mass [GeV/c50 100 150 200 250 300
2F
ract
ion
of e
vent
s/ 5
GeV
/c
-0.3
-0.2
-0.1
0
0.1
0.2
0.3 σ+ 1
σ- 1
FIG. 2. Relative difference in the combined electron and muon samples between the
nominal dijet mass distribution and the one obtained by varying the jet-energy scale by
±1σ in W+jets events.
B. Multijet production
Multijet events can be identified as signal candidates when one of the jets is misidentified
as a lepton. This mismeasurement can also result in significant missing transverse energy.
17

Because it is unlikely for a jet to deposit energy in the muon detectors, the misidentification
probability of a muon is lower than that of an electron. The multijet-background contribu-
tion is thus negligible in the muon channel (< 0.5%), while it is close to 10% in the electron
channel (Table I). Therefore, we concentrate on discussing the multijet-background model-
ing for events with electron candidates. Similar methods are used to model this background
for muon events.
To model the multijet-background distribution, we use an event sample obtained from
the same selection as described in Sec. II except that two identification criteria for the
electron candidates that do not depend on the kinematic of the event (e.g., the fraction of
energy in the hadronic calorimeter) are inverted [24]. The particles identified with those
inverted requirements are referred to as “nonelectrons”. This ensures that the sample used
for modeling the multijet background is statistically independent of the signal sample, while
as similar as possible kinematically. Nevertheless, several tunings are needed to this sample
in order to adequately model the multijet component in the signal sample. First, there is
a small contribution of events with prompt leptons from boson decays. We subtract this
contribution bin-by-bin for any variable of interest using the theoretical prediction for that
bin. A second tuning of the nonelectron sample accounts for the trigger bias. The trigger
selects events based on the ET of the reconstructed electron or nonelectron candidate, but
the event kinematic properties are determined by the ET of the corresponding jet. We define
this jet as the jet with ∆R < 0.4 with respect to the (non)electron. To properly model the
event kinematics properties, the energy distribution of this jet should be the same in events
with misidentified electron and nonelectron candidates. We define a control region enriched
in multijet events, selected with the same criteria as for the signal region, except for the
requirement of E/T < 20 GeV or mT < 30 GeV. The estimated fraction of multijet events in
this region is 84%. When comparing the energy distribution of jets matched to misidentified
electrons with jets matched to nonelectrons in this control region, we find discrepancies
due to the trigger on electron ET (Fig. 3). The jets matched to misidentified electrons
have a higher fraction of their measured energy in the electromagnetic calorimeter than
jets matched to nonelectrons; therefore, in order to have a nonelectron of the same energy
as a corresponding misidentified electron, the energy of the jet producing the nonelectron
must be higher. The trigger threshold thus leads to a higher average ET of jets producing
nonelectrons than of jets producing misidentified electrons. To remove this trigger bias,
18

we reweight events in the nonelectron sample such that the energy spectrum of the jets
matched to misidentified electrons is equivalent to the energy spectrum of jets matched to
nonelectrons. The reweighting is obtained from the control region and the same weights are
used in the signal region.
[GeV]TE0 20 40 60 80 100 120 140 160 180 200
Eve
nts/
4 G
eV
0
2
4
6
8
10
12
14
310×
Data
W/Z+jets
Uncorrected multijet model
FIG. 3. Transverse-energy distribution of jets matched to identified electrons in the
multijet-enriched control region in data (circles), uncorrected multijets model (dark shaded
histogram), and W/Z+jets simulation (light shaded histogram). The magnitude of
W/Z+jets contributions is normalized to the NLO calculations [22], while the magnitude
of the multijet model is obtained from the data. In subsequent analysis, the multijet model
is reweighted such that the predicted and observed energy spectra agree.
A final tuning of the nonelectron sample addresses the difference in jet-energy scale
between the jet producing the nonelectron and the jet producing a misidentified electron.
We investigate this difference using pythia QCD dijet events. For the same primary parton
energy, the energy of jets matched to nonelectrons is systematically lower than the energy of
jets matched to identified electrons. Based on the observed differences, we derive an energy
correction factor as a function of the initial jet-energy, which is applied to events in the
nonelectron sample.
In order to test the tunings, we use the multijet-enriched control region. An important
19

kinematic distribution related to the dijet-invariant mass is the pT of the two-jet system.
Figure 4 shows the improvement in the modeling of this variable after all tunings are applied
and is indicative of the improvement seen in other relevant kinematic variables.
[GeV/c]T
Dijet p0 20 40 60 80 100 120 140 160 180 200
Eve
nts/
4 G
eV/c
0
1
2
3
4
5
6
7
310×
Data
W/Z+jets
Uncorrected multijet model
(a)
[GeV/c]T
Dijet p0 20 40 60 80 100 120 140 160 180 200
Eve
nts/
4 G
eV/c
0
1
2
3
4
5
6
7
310×
Data
W/Z+jets
Corrected multijet model
(b)
FIG. 4. Transverse-momentum distribution of the two-jet system in the multijet-enriched
control sample as observed in the data (circles) and as predicted by the W/Z+jets
simulation (light shaded histogram) and the nonelectron-based model (dark shaded
histogram) before (a) and after (b) application of tunings to the nonelectron-based
multijet model. The magnitude of W/Z+jets contributions is normalized to the NLO
calculations [22], while the magnitude of the multijet model is obtained from the data.
We also investigate the impact of the tunings applied to the nonelectron-based multijet
model on the signal sample, defined in Sec. IV. To increase the statistical accuracy of the
sample, we loosen the selection by removing the two-jet system pT requirement and lowering
the ET requirements to 25 GeV. The resulting improvement in the modeling of the two-jet
system pT distribution in this sample is shown in Fig. 5.
The contribution of the multijet background to the selected sample is determined using
a three-component fit to the E/T distribution in the data. The three components are the
multijet background, the W/Z+jets production, and the other electroweak processes (top-
quark and diboson production). The last component is constrained to theoretical predictions,
whereas the magnitudes of the W/Z+jets and the multijet contributions are allowed to float
in the fit. The results are shown in Fig. 6. We estimate the amount of multijet background in
the electron and muon sample to be (7.8± 0.2)% and (0.27± 0.01)% respectively, where the
20

[GeV/c]T
Dijet p0 50 100 150 200 250
Eve
nts/
5 G
eV/c
0
0.2
0.4
0.6
0.8
1
1.2
1.4
1.6
310×
Data
Diboson
W/Z+jets
Top
Uncorrected multijet model
(a)
[GeV/c]T
Dijet p0 50 100 150 200 250
Eve
nts/
5 G
eV/c
0
0.2
0.4
0.6
0.8
1
1.2
1.4
1.6
310×
Data
Diboson
W/Z+jets
Top
Corrected multijet model
(b)
FIG. 5. Transverse-momentum distribution of the two-jet system in the selected event
sample with looser selection criteria as observed in the data and as predicted by the models
before (a) and after (b) application of tunings to the nonelectron-based multijet model.
uncertainties are statistical only. We consider several systematic uncertainties: jet-energy-
scale modeling (0.9%), choice of the fit variable (13.1%), disagreement between the observed
and predicted multijet E/T distribution (4.4%), and theoretical uncertainties on the cross
sections (0.9%). The total systematic uncertainty on the multijet background estimate is
14.0%.
VI. FIT AND RESULTS
We first describe the procedure used to fit the observed dijet-mass distribution in data,
including contributions from background and an hypothetical signal. We then present two
sets of results. For the first set, we do not incorporate the specific jet-energy-scale correc-
tions for quark and gluon jets nor the tuning of the multijet-background model, essentially
performing the analysis of Ref. [4] on the full CDF Run II data set. The final results are
then given, which include those obtained when the improvements are incorporated.
21

Missing Transverse Energy [GeV]0 20 40 60 80 100 120 140
Eve
nts/
3 G
eV
0
0.5
1
1.5
2
2.5310×
Data
Corrected multijets model
W/Z+jets
Diboson and top
(a)
Missing Transverse Energy [GeV]0 20 40 60 80 100 120 140
Eve
nts/
3 G
eV
0
100
200
300
400
500 Data
Multijets model
W/Z+jets
Diboson and top
(b)
FIG. 6. Missing transverse-energy distribution for events containing electrons (a) and
muons (b) from the selected sample. The distributions of observed data are shown with fit
background overlaid.
A. Fit technique
Uncertainties on the predictions are parametrized with nuisance parameters, and the data
are used to constrain both the signal size and the values of these parameters.
We use the following approach to set an upper limit on the production rate of a hypo-
thetical new particle. We maximize a binned likelihood function L(data|~θ, ~ν)π(~ν), which
expresses the probability of observing the data given the model parameters ~θ and the nui-
sance parameters ~ν. The likelihood is a product of Poisson probabilities for the observed
data in each bin. The function π(~ν) is a product of Gaussian constraints, one for each
systematic uncertainty (treated as nuisance parameters in the fit), which incorporates ex-
ternal information about the parameter, as measured in control samples or obtained from
other sources. The nuisance parameters describe three classes of systematic uncertainties:
bin-by-bin uncertainties, which are considered uncorrelated between individual bins of each
predicted distribution; shape uncertainties, which correspond to coherent distortions across
the bins of a distribution, parametrized by a single nuisance parameter; and rate uncertain-
ties, which coherently affect the normalization of all bins within one distribution. Rate and
shape uncertainties may be correlated. For example, modifications of the jet-energy-scale
shift the mass of a resonance to higher or lower values (Fig. 2); in addition, they affect the
22

magnitude of the predicted contribution of the process due to the selection criterion that jets
pass a minimum ET threshold. These correlations are taken into account by allowing each
source of systematic uncertainty to affect both rates and shapes of multiple distributions. A
detailed description of the likelihood function is given in Ref. [24]. Restrictions are placed
on the allowed ranges of the nuisance parameters to ensure that all event-yield predictions
are non-negative.
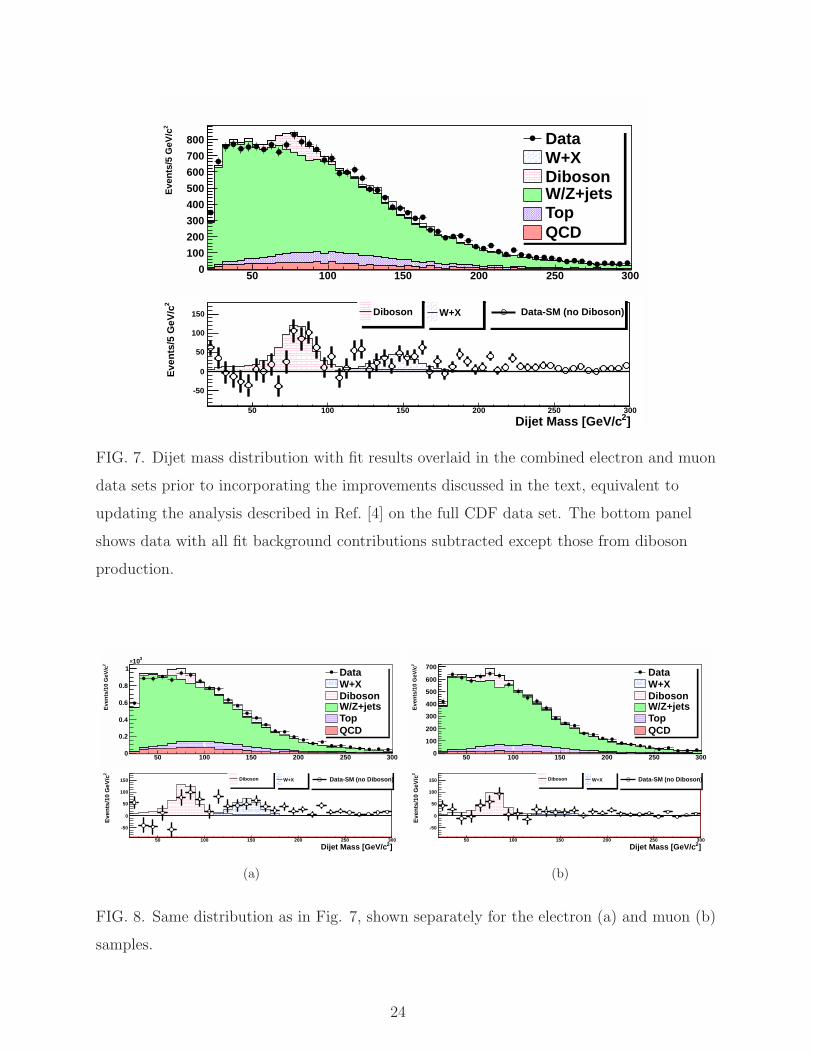
B. Results
To reproduce the previous analysis [4], a first fit to the dijet invariant-mass spectrum is
performed without incorporating the improvements described in the previous sections. In
addition to the SM contributions, an additional Gaussian component centered at 144 GeV/c2
with a width of 14.3 GeV/c2 is incorporated in the fit to model a potential non-SM contri-
bution. The result of the fit in the full electron and muon data sample is shown in Fig. 7: an
excess of events over the background prediction is observed in the signal region, similar to
what observed in Ref. [4]. Assuming that this new contribution has the same acceptance as
that for a 140 GeV/c2 Higgs boson produced in association with a W boson, the extracted
cross section is 2.4 ± 0.6 pb. Assuming only SM processes, the probability to measure a
value as large or larger than the observed cross section is 2.6 × 10⁻⁵, which corresponds
to 4.2σ in terms of standard deviations. The excess is similar in the electron and muon
channels, as shown in Fig. 8.
Figure 9 shows that the SM predictions do not model properly the region at low ∆R
between the two jets (∆R(j1, j2)) in the muon sample. A similar discrepancy is observed in
the electron sample. However, jet pairs from heavy particles are expected to be produced
more often at large ∆R(j1, j2). Therefore, applying a ∆R(j1, j2) > 0.7 requirement is
not expected to bias heavy-particle searches. Nonetheless, we investigate the effect of this
requirement on the final result. Figures 10-11 show that, although the agreement between
data and SM expectations in the region at low masses is improved, similar discrepancies as
in Figs. 7-8 are present for dijet-invariant masses larger than 50 GeV/c2. We extract a cross
section σWX = (2.3±0.5) pb, which is compatible with the one extracted with no ∆R(j1, j2)
restriction.
Additional fits incorporate the corrections described in Secs. III and V B. First, jet-
23
50 100 150 200 250 300
2E
vent
s/5
GeV
/c
0
100
200
300
400
500
600
700
800 DataW+XDibosonW/Z+jetsTopQCD
]2Dijet Mass [GeV/c50 100 150 200 250 300
2E
vent
s/5
GeV
/c
-50
0
50
100
150 Data-SM (no Diboson)W+XDiboson
FIG. 7. Dijet mass distribution with fit results overlaid in the combined electron and muon
data sets prior to incorporating the improvements discussed in the text, equivalent to
updating the analysis described in Ref. [4] on the full CDF data set. The bottom panel
shows data with all fit background contributions subtracted except those from diboson
production.
50 100 150 200 250 300
2E
vent
s/10
GeV
/c
0
0.2
0.4
0.6
0.8
1
310×
DataW+XDibosonW/Z+jetsTopQCD
]2Dijet Mass [GeV/c50 100 150 200 250 300
2E
vent
s/10
GeV
/c
-50
0
50
100
150 Data-SM (no Diboson)W+XDiboson
(a)
50 100 150 200 250 300
2E
vent
s/10
GeV
/c
0
100
200
300
400
500
600
700DataW+XDibosonW/Z+jetsTopQCD
]2Dijet Mass [GeV/c50 100 150 200 250 300
2E
vent
s/10
GeV
/c
-50
0
50
100
150 Data-SM (no Diboson)W+XDiboson
(b)
FIG. 8. Same distribution as in Fig. 7, shown separately for the electron (a) and muon (b)
samples.
24

)2
,j1
R(j∆0 0.5 1 1.5 2 2.5 3 3.5 4
Eve
nts/
0.1
radi
ans
0
50
100
150
200
250
300
350
400 DataDibosonW/Z+jetsTopQCDDiboson (x 8)
FIG. 9. Distribution ∆R(j1, j2) distributions in the muon sample as observed in the data
and as predicted by the models incorporating improved jet-energy-scale corrections for
simulated quark and gluon jets. The diboson distribution (red line) magnified by a factor
of 8 is also shown as a example of the ∆R(j1, j2) distribution for a heavy-particle decay.
energy-scale corrections for simulated quark and gluon jets described in Sec. III are incor-
porated. The resulting fits to the selected-event distributions with electrons and muons are
shown separately in Fig. 12. Good agreement between the observed data and the fit contri-
butions is seen for events with muons, while the agreement is still rather poor for events with
electrons. Final fits performed after incorporating also tunings to the multijet-background
model lead to excellent agreement between the observed electron data and the fit-SM-process
contributions, as shown in Fig. 13. The fit to the muon data, where the multijet background
is very small, is unchanged.
The final fit result for the combined electron and muon data is shown in Fig. 14. The
magnitude of SM contributions is normalized to the expected rates given in Table I. Since
the data are consistent with the SM predictions and no significant excess is observed, we
set an upper limit of 0.9 pb at the 95% C.L. on the cross section of a new particle with a
mass of 144 GeV/c2 produced in association with a W boson. The limit assumes that the
new resonance has an acceptance equal to that of a Higgs boson produced in association
25

50 100 150 200 250 300
2E
vent
s/5
GeV
/c
0
100
200
300
400
500
600
700
800 DataW+XDibosonW/Z+jetsTopQCD
]2Dijet Mass [GeV/c50 100 150 200 250 300
2E
vent
s/5
GeV
/c
-50
0
50
100
150 Data-SM (no Diboson)W+XDiboson
FIG. 10. Dijet mass distribution with fit results overlaid in the combined electron and
muon data sets selected by applying an additional ∆R(j1, j2) > 0.7 requirement and prior
to incorporating the improvements discussed in the text. The bottom panel shows data
with all fit background contributions subtracted except those from diboson production.
50 100 150 200 250 300
2E
vent
s/10
GeV
/c
0
0.2
0.4
0.6
0.8
1310×
DataW+XDibosonW/Z+jetsTopQCD
]2Dijet Mass [GeV/c50 100 150 200 250 300
2E
vent
s/10
GeV
/c
-50
0
50
100
150 Data-SM (no Diboson)W+XDiboson
(a)
50 100 150 200 250 300
2E
vent
s/10
GeV
/c
0
100
200
300
400
500
600
700DataW+XDibosonW/Z+jetsTopQCD
]2Dijet Mass [GeV/c50 100 150 200 250 300
2E
vent
s/10
GeV
/c
-50
0
50
100
150Data-SM (no Diboson)W+XDiboson
(b)
FIG. 11. Same distribution as in Fig. 10, shown separately for the electron (a) and muon
(b) samples.
26

50 100 150 200 250 300
2E
vent
s/10
GeV
/c
0
0.2
0.4
0.6
0.8
1310×
DataW+XDibosonW/Z+jetsTopQCD
]2Dijet Mass [GeV/c50 100 150 200 250 300
2E
vent
s/10
GeV
/c
-50
0
50
100
150 Data-SM (no Diboson)W+XDiboson
(a)
50 100 150 200 250 300
2E
vent
s/10
GeV
/c
0
100
200
300
400
500
600 DataW+XDibosonW/Z+jetsTopQCD
]2Dijet Mass [GeV/c50 100 150 200 250 300
2E
vent
s/10
GeV
/c
-50
0
50
100
150 Data-SM (no Diboson)W+XDiboson
(b)
FIG. 12. Dijet mass distribution with fit results overlaid in the electron (a) and muon data
sets (b) incorporating improved jet-energy-scale corrections for simulated quark and gluon
jets but no tuning on the multijet-background modeling. The bottom panel shows data
with all fit background contributions subtracted except those from diboson production.
50 100 150 200 250 300
2E
vent
s/10
GeV
/c
0
0.2
0.4
0.6
0.8
1310×
DataW+XDibosonW/Z+jetsTopQCD
]2Dijet Mass [GeV/c50 100 150 200 250 300
2E
vent
s/10
GeV
/c
-50
0
50
100
150 Data-SM (no Diboson)W+XDiboson
FIG. 13. Dijet mass distribution with fit results overlaid in the electron data set
incorporating improved jet-energy-scale corrections for simulated quark and gluon jets and
tunings on the multijet-background modeling. The bottom panel shows data with all fit
background contributions subtracted except those from diboson production.
with a W boson, and the limit is set using likelihood-ratio ordering [25]. When generating
pseudoexperiments we start from the rates in Table I and we allow for variations within
systematic uncertainties mentioned in Sec. V. Shape variations due to the jet-energy-scale,
factorization and normalization scale uncertainties are also considered.
27

50 100 150 200 250 300
2E
vent
s/5
GeV
/c
0
100
200
300
400
500
600
700
800 DataW+XDibosonW/Z+jetsTopQCD
]2Dijet Mass [GeV/c50 100 150 200 250 300
2E
vent
s/5
GeV
/c
-50
0
50
100
150 Data-SM (no Diboson)W+XDiboson
FIG. 14. Dijet mass distribution with fit results overlaid in the combined electron and
muon data sets incorporating improved jet-energy-scale corrections for simulated quark and
gluon jets and tunings on the multijet-background modeling. The bottom panel shows data
with all fit background contributions subtracted except those from diboson production.
VII. CONCLUSION
We present a study of the dijet invariant-mass spectrum in events containing a single
lepton, large missing transverse energy, and exactly two jets. Since the previous publication
[4], additional studies of potential systematic effects have led to the incorporation of specific
jet-energy-scale corrections for simulated quark and gluon jets and tunings of the data-driven
modeling for the multijet-background contributions. The distribution observed in the full
CDF Run II data set is in good agreement with the SM expectations, whose dominant
contributing process is W+jets, which is modeled using alpgen event generator combined
with pythia simulation of parton showering and hadronization. A 95% C.L. upper limit of
0.9 pb is set on the cross section times branching ratio for production and decay into dijets
of a new particle with mass of 144 GeV/c2 in association with a W boson.
28

Acknowledgments
We thank the Fermilab staff and the technical staffs of the participating institutions for
their vital contributions. This work was supported by the U.S. Department of Energy and
National Science Foundation; the Italian Istituto Nazionale di Fisica Nucleare; the Ministry
of Education, Culture, Sports, Science and Technology of Japan; the Natural Sciences and
Engineering Research Council of Canada; the National Science Council of the Republic of
China; the Swiss National Science Foundation; the A.P. Sloan Foundation; the Bundesmin-
isterium fur Bildung und Forschung, Germany; the Korean World Class University Program,
the National Research Foundation of Korea; the Science and Technology Facilities Coun-
cil and the Royal Society, UK; the Russian Foundation for Basic Research; the Ministerio
de Ciencia e Innovacion, and Programa Consolider-Ingenio 2010, Spain; the Slovak R&D
Agency; the Academy of Finland; the Australian Research Council (ARC); and the EU
community Marie Curie Fellowship contract 302103.
29

[1] K. Hagiwara et al., Nucl. Phys. B282, 253 (1987).
[2] M. Kober, B. Koch, and M. Bleicher, Phys. Rev. D 76, 125001 (2007).
[3] E. J. Eichten, K. Lane, and A. Martin, Phys. Rev. Lett 106, 251803 (2011).
[4] T. Aaltonen et al. (CDF Collaboration), Phys. Rev. Lett. 106, 171801 (2011).
[5] V.M. Abazov et al. (D0 Collaboration), Phys. Rev. Lett. 107, 011804 (2011).
[6] S. Chatrchyan et al. (CMS Collaboration), Phys. Rev. Lett. 109, 251801 (2012).
[7] ATLAS Collaboration, ATLAS-CONF-2011-097 (2011).
[8] T. Aaltonen et al. (CDF Collaboration), Phys. Rev. D 88, 092004 (2013).
[9] M. Trovato, Ph.D. thesis, Scuola Normale Superiore. FERMILAB-THESIS-2014-02 (2014).
[10] A. Abulencia et al. (CDF Collaboration), J. Phys. G 34, 2457 (2007).
[11] A. Bhatti et al., Nucl. Instrum. Methods A 566, 375 (2006).
[12] T. Aaltonen et al. (CDF Collaboration), Phys. Rev. D 88, 092002 (2013).
[13] F. Abe et al. (CDF Collaboration), Phys. Rev. D 48, 2998 (1993).
[14] T. Aaltonen et al. (CDF Collaboration), Phys. Rev. Lett. 109, 152003 (2012).
[15] T. Aaltonen et al. (CDF Collaboration), Phys. Rev. D 86, 092003 (2012).
[16] T. Aaltonen et al. (CDF Collaboration), Phys. Rev. Lett. 105, 012001 (2010).
[17] N. Kidonakis, Phys. Rev. D 81, 054028 (2010).
[18] N. Kidonakis, Phys. Rev. D 74, 114012 (2006).
[19] J. M. Campbell and R. K. Ellis, Phys. Rev. D 60, 113006 (1999).
[20] M. L. Mangano, M. Moretti, F. Piccinini, R. Pittau, and A. D. Polosa, J. High Energy Phys.
07 (2003) 001.
[21] T. Sjostrand, S. Mrenna, and P. Z. Skands, J. High Energy Phys. 05 (2006) 026.
[22] T. Aaltonen et al. (CDF Collaboration), Phys. Rev. D 77, 011108 (2008).
[23] F. Maltoni and T. Stelzer, J. High Energy Phys. 02 (2003) 027.
[24] T. Aaltonen et al. (CDF Collaboration), Phys. Rev. D 82, 112005 (2010).
[25] G. J. Feldman and R. D. Cousins, Phys. Rev. D 57, 3873 (1998).
[26] Since the magnitude of top-quark-pair contribution is effectively insensitive to the uncertainty
on luminosity [16], the luminosity uncertainty has not been applied to this contribution.
[27] Q2 = M2W + p2
T , where MW = 80.4 GeV/c2 and p2T is the squared sum of transverse energies
30

of all final-state partons.
31


![IntroductionWolfgang.Bertram/DiffSimpV3.pdfis well-known in the classical setting (see, e.g., [Re83]), both concepts are essentially equivalent, but the jet-concept is of an \invariant"](https://img.dokumen.tips/doc/110x75/5ad2c1137f8b9aff738d1408/wolfgangbertramdiffsimpv3pdfis-well-known-in-the-classical-setting-see-eg.jpg)


![Search for long-lived particles decaying to jet pairs · displaced b and c vertices in the πv → bb¯ decay chain to be accepted. The jet clustering uses the anti-kT algorithm [33]](https://img.dokumen.tips/doc/110x75/5fe0e3bb686a1b633b40bec5/search-for-long-lived-particles-decaying-to-jet-pairs-displaced-b-and-c-vertices.jpg)