Embed Size (px)
Citation preview
Financial Report 2016
Inuvialuit Regional Corporation

AUDITORS
DESIGN/PRODUCTION
PricewaterhouseCoopers LLPEdmonton, AB
Peggy Jay, IRC

April 19, 2017
Independent Auditor’s Report
To the Beneficiaries ofInuvialuit Regional Corporation
We have audited the accompanying consolidated financial statements of Inuvialuit Regional Corporation andits subsidiaries, which comprise the consolidated statement of financial position as at December 31, 2016 andthe consolidated statements of comprehensive income, changes in equity and cash flows for the year thenended, and the related notes, which comprise a summary of significant accounting policies and otherexplanatory information.
Management’s responsibility for the consolidated financial statementsManagement is responsible for the preparation and fair presentation of these consolidated financial statementsin accordance with International Financial Reporting Standards, and for such internal control as managementdetermines is necessary to enable the preparation of consolidated financial statements that are free frommaterial misstatement, whether due to fraud or error.
Auditor’s responsibilityOur responsibility is to express an opinion on the consolidated financial statements based on our audit. Weconducted our audit in accordance with Canadian generally accepted auditing standards. Those standardsrequire that we comply with ethical requirements and plan and perform the audit to obtain reasonable assuranceabout whether the consolidated financial statements are free from material misstatement.
An audit involves performing procedures to obtain audit evidence about the amounts and disclosures in theconsolidated financial statements. The procedures selected depend on the auditor’s judgment, including theassessment of the risks of material misstatement of the consolidated financial statements, whether due to fraudor error. In making those risk assessments, the auditor considers internal control relevant to the entity’spreparation and fair presentation of the consolidated financial statements in order to design audit proceduresthat are appropriate in the circumstances, but not for the purpose of expressing an opinion on the effectivenessof the entity’s internal control. An audit also includes evaluating the appropriateness of accounting policiesused and the reasonableness of accounting estimates made by management, as well as evaluating the overallpresentation of the consolidated financial statements.
We believe that the audit evidence we have obtained is sufficient and appropriate to provide a basis for ouraudit opinion.
OpinionIn our opinion, the consolidated financial statements present fairly, in all material respects, the financialposition of Inuvialuit Regional Corporation and its subsidiaries as at December 31, 2016 and their financialperformance and their cash flows for the year then ended in accordance with International Financial ReportingStandards.
Chartered Professional Accountants
PricewaterhouseCoopers LLPTD Tower, 10088 102 Avenue NW, Suite 1501, Edmonton, Alberta, Canada T5J 3N5T: +1 780 441 6700, F: + 1 780 441 6776
“PwC” refers to PricewaterhouseCoopers LLP, an Ontario limited liability partnership.
○ ○ ○ ○ ○ ○ ○ ○ ○ ○ ○ ○ ○ ○ ○ ○ ○ ○ ○ ○ ○ ○ ○ ○ ○ ○ ○ ○ ○ ○ ○ ○ ○ ○ ○ ○ ○ ○ ○ ○ ○ ○ ○ ○ ○ ○ ○ ○ ○ ○ ○ ○ ○○
○
Ch t d A t t

4 INUVIALINUVIALINUVIALINUVIALINUVIAL UIT REGIONUIT REGIONUIT REGIONUIT REGIONUIT REGION AL CAL CAL CAL CAL CORPORAORPORAORPORAORPORAORPORATIONTIONTIONTIONTION
Inuvialuit Regional Corporation
Consolidated Statement of Financial Position
As at December 31, 2016
(in thousands of Canadian dollars)
2016 2015
$ $ASSETS
Current assetsCash and cash equivalents 100,214 83,651Accounts receivable 51,033 57,880Income taxes recoverable - 23,582Due from related parties (note 23) 1,909 530Inventories (note 5) 22,697 40,443Prepaid expenses 6,048 11,006Assets held-for-sale (note 6) 5,502 -
187,403 217,092Non-current assetsInvestments, loans and advances (note 7) 1,575 2,413Marketable securities (note 8) 426,950 412,845Property, plant and equipment (note 10) 110,641 179,749Income producing real estate (note 11) 6,212 5,159Goodwill and intangible assets (note 12) 14,401 16,321
747,182 833,579LIABILITIES
Current liabilitiesBank indebtedness (note 15) 121,938 140,949Accounts payable and accrued liabilities 37,423 56,967Income taxes payable 305 -Deferred revenue (note 13) 14,725 9,737Long-term debt (note 15) 75,921 13,201Finance lease obligations (note 15) 319 2,086Note payable (note 15) 2,000 2,000Financial liabilities to Fixed Income Fund participants (note 9) 32,027 30,101
284,658 255,041Non-current liabilitiesFinancial liabilities to Balanced Fund participants (note 8) 583 1,387Provisions (note 14) 4,287 4,939Long-term debt (note 15) - 80,007Finance lease obligations (note 15) 14,007 23,670Note payable (note 15) 3,827 5,615Pension obligations (note 16) 2,661 13,852Deferred income taxes (note 17) 4,636 16,780
314,659 401,291EQUITY
Capital transfers (note 19) 117,082 119,505Retained earnings 315,441 312,783
432,523 432,288
747,182 833,579
The accompanying notes are an integral part of these consolidated financial statements.
Commitments and contingencies (note 18)
Approved by the Board of Directors
Duane Smith Gerald InglangasukDirector Director

FINFINFINFINFIN A NA NA NA NA NCIAL REPORCIAL REPORCIAL REPORCIAL REPORCIAL REPOR T 20T 20T 20T 20T 201111166666 5
Inuvialuit Regional Corporation
Consolidated Statement of Comprehensive Income
For the year ended December 31, 2016
(in thousands of Canadian dollars)
2016 2015
$ $
RevenueDevelopment (note 20) 296,452 331,769Realized investment (note 8) 21,712 22,517Unrealized investment (note 8) 12,810 5,435Land access and administration fees 3,242 12,792Petroleum and natural gas 1,085 667Other 2,583 2,181
337,884 375,361ExpensesDevelopment (note 21) 253,187 294,937General and administrative – net of recoveries (note 21) 32,279 28,140Depreciation, amortization and depletion 20,865 21,660Finance (note 22) 8,498 11,421Maintenance and decommissioning provisions (note 14) 1,681 2,158Investment management, custody and other related fees 1,266 1,208Community corporation funding 1,277 1,254Petroleum and natural gas 704 587
319,757 361,365
Other income (expense)Impairment of long-lived assets (notes 6 and 10) (12,361) (2,000)Insurance recovery - 1,504Loss on sale of property, plant and equipment – net (790) (1,817)Impairment of investment - (1,050)(Loss) equity in earnings of associates (note 7) (370) 476Other 996 57
(12,525) (2,830)
Income before income taxes from continuing operations 5,602 11,166
Income taxes (recovery) (note 17)Current 104 (20,415)Deferred (14,722) (5,292)
(14,618) (25,707)
Net income for the year from continuing operations 20,220 36,873
Net loss for the year from discontinued operations (note 25) (17,562) (23,082)
Net income for the year 2,658 13,791
Actuarial gain on pension obligations (note 16) - 1,500
Comprehensive income for the year 2,658 15,291
Comprehensive income for the year relates toContinuing operations 20,220 36,873Discontinued operations (17,562) (21,582)
2,658 15,291
The accompanying notes are an integral part of these consolidated financial statements.
6 INUVIALINUVIALINUVIALINUVIALINUVIAL UIT REGIONUIT REGIONUIT REGIONUIT REGIONUIT REGION AL CAL CAL CAL CAL CORPORAORPORAORPORAORPORAORPORATIONTIONTIONTIONTION
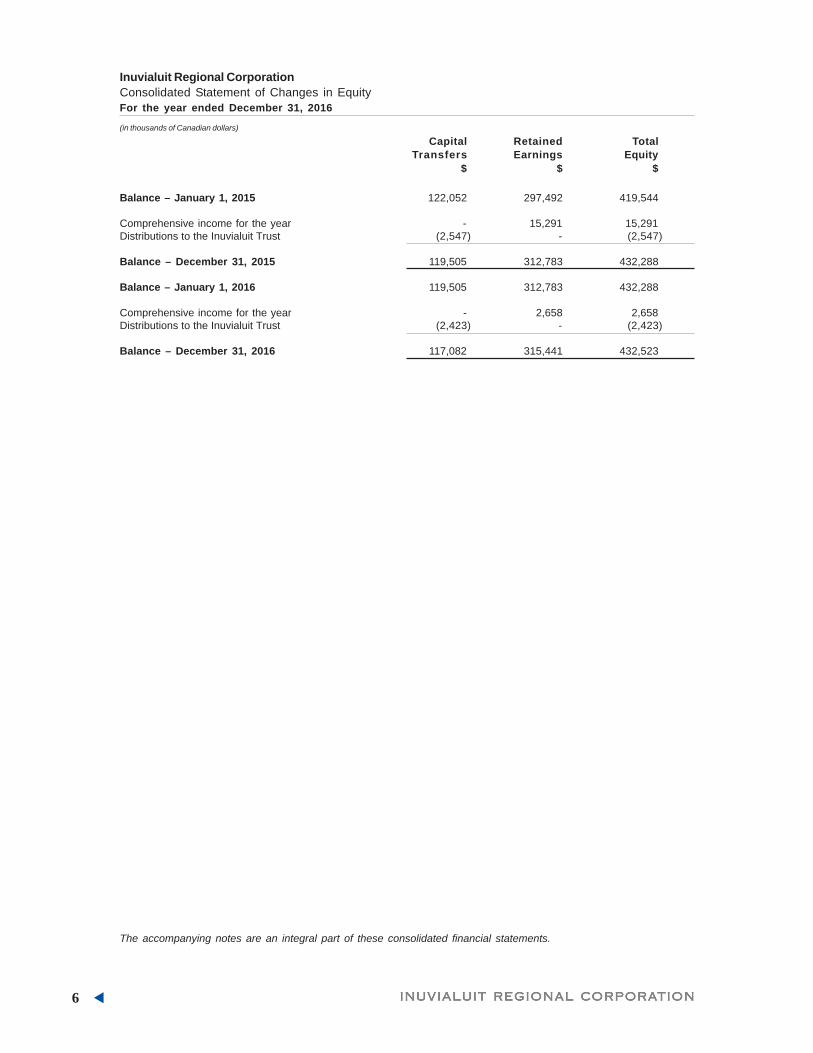
Inuvialuit Regional Corporation
Consolidated Statement of Changes in Equity
For the year ended December 31, 2016
(in thousands of Canadian dollars)
Capital Retained Total
Transfers Earnings Equity
$ $ $
Balance – January 1, 2015 122,052 297,492 419,544
Comprehensive income for the year - 15,291 15,291Distributions to the Inuvialuit Trust (2,547) - (2,547)
Balance – December 31, 2015 119,505 312,783 432,288
Balance – January 1, 2016 119,505 312,783 432,288
Comprehensive income for the year - 2,658 2,658Distributions to the Inuvialuit Trust (2,423) - (2,423)
Balance – December 31, 2016 117,082 315,441 432,523
The accompanying notes are an integral part of these consolidated financial statements.

FINFINFINFINFIN A NA NA NA NA NCIAL REPORCIAL REPORCIAL REPORCIAL REPORCIAL REPOR T 20T 20T 20T 20T 201111166666 7
Inuvialuit Regional CorporationConsolidated Statement of Cash FlowsFor the year ended December 31, 2016
(in thousands of Canadian dollars)
2016 2015$ $
Cash provided by (used in)
Operating activitiesNet income for the year from continuing operations 20,220 36,873Adjustments for
Unrealized investment revenue (12,810) (5,435)Net realized gain on sale of investments (6,579) (9,307)Depreciation, amortization and depletion 20,865 21,660Amortization of discount on note payable 212 456Finance expenses 9,077 12,003Impairment of long-lived assets 12,361 2,000Loss on sale of property, plant and equipment 790 1,817Impairment of investment - 1,050Loss (equity) related to associates 370 (476)Income tax recovery (14,618) (25,707)Gain on disposal of businesses (note 25) (118) -
Changes in items of working capitalAccounts receivable 4,132 28,292Due from related parties (1,379) (725)Inventories 908 3,019Prepaid expenses 3,768 (256)Accounts payable and accrued liabilities (5,274) (22,959)Deferred revenue 4,988 (1,339)Provisions (652) 395
Interest paid (8,498) (11,416)Investments from (repayment to) Fixed Income Fund participants 1,347 (1,447)Income taxes recovered (paid) 23,783 (7,591)Excess of pension contributions over expenses (172) (69)Discontinued operations (note 25) 336 (8,963)
53,057 11,875Investing activitiesNet increase in investments, loans and advances 468 347Net sales of marketable securities 4,480 4,663Purchases of property, plant and equipment (19,797) (14,951)Proceeds from the sale of property, plant and equipment 5,635 6,672Purchases of income-producing real estate (1,519) (176)Purchases of intangible assets (18) (26)Disposal of businesses (note 25) 875 -Discontinued operations (note 25) 11,387 (4,805)
1,511 (8,276)Financing activities(Decrease) increase in bank indebtedness (10,823) 23,291Repayment of long-term debt (10,345) (24,514)Repayment of finance lease obligations (288) (208)Repayment of note payable (2,000) (2,000)Distribution to beneficiaries – capital (2,423) (2,547)Discontinued operations (note 25) (12,126) 15,702
(38,005) 9,724
Increase in cash and cash equivalents during the year 16,563 13,323
Cash and cash equivalents – Beginning of year 83,651 70,328
Cash and cash equivalents – End of year 100,214 83,651
The accompanying notes are an integral part of these consolidated financial statements.
8 INUVIALINUVIALINUVIALINUVIALINUVIAL UIT REGIONUIT REGIONUIT REGIONUIT REGIONUIT REGION AL CAL CAL CAL CAL CORPORAORPORAORPORAORPORAORPORATIONTIONTIONTIONTION
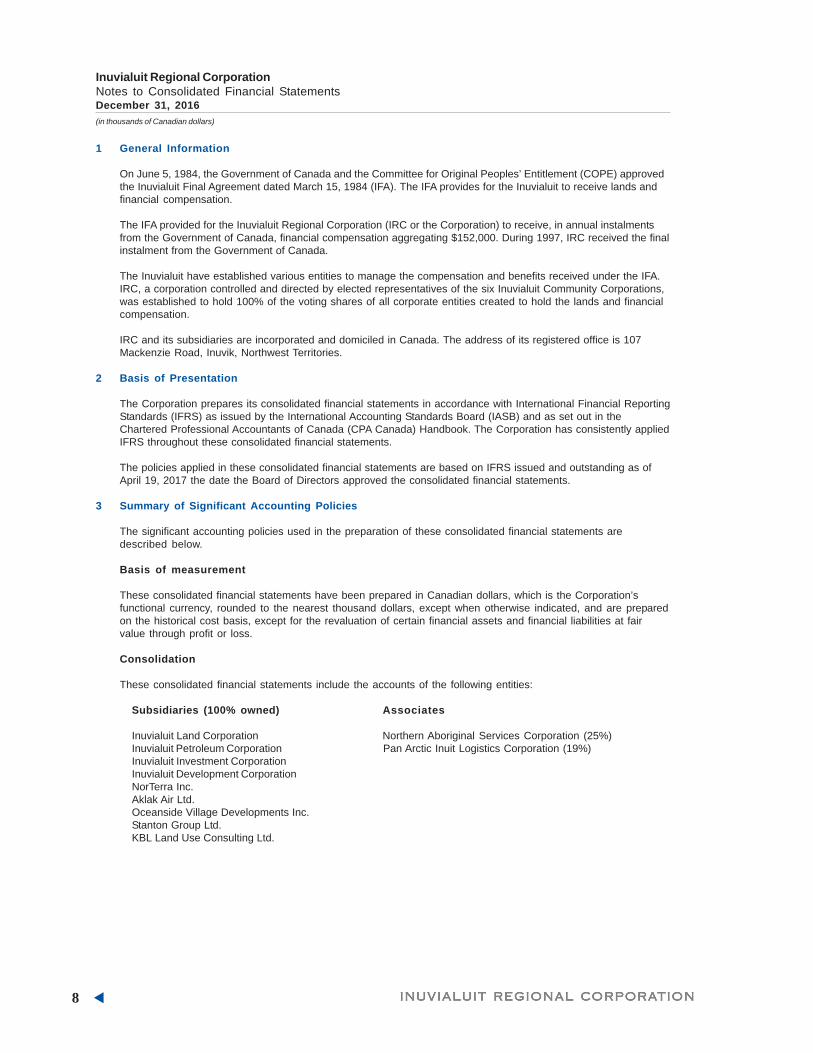
1 General Information
On June 5, 1984, the Government of Canada and the Committee for Original Peoples’ Entitlement (COPE) approvedthe Inuvialuit Final Agreement dated March 15, 1984 (IFA). The IFA provides for the Inuvialuit to receive lands andfinancial compensation.
The IFA provided for the Inuvialuit Regional Corporation (IRC or the Corporation) to receive, in annual instalmentsfrom the Government of Canada, financial compensation aggregating $152,000. During 1997, IRC received the finalinstalment from the Government of Canada.
The Inuvialuit have established various entities to manage the compensation and benefits received under the IFA.IRC, a corporation controlled and directed by elected representatives of the six Inuvialuit Community Corporations,was established to hold 100% of the voting shares of all corporate entities created to hold the lands and financialcompensation.
IRC and its subsidiaries are incorporated and domiciled in Canada. The address of its registered office is 107Mackenzie Road, Inuvik, Northwest Territories.
2 Basis of Presentation
The Corporation prepares its consolidated financial statements in accordance with International Financial ReportingStandards (IFRS) as issued by the International Accounting Standards Board (IASB) and as set out in theChartered Professional Accountants of Canada (CPA Canada) Handbook. The Corporation has consistently appliedIFRS throughout these consolidated financial statements.
The policies applied in these consolidated financial statements are based on IFRS issued and outstanding as ofApril 19, 2017 the date the Board of Directors approved the consolidated financial statements.
3 Summary of Significant Accounting Policies
The significant accounting policies used in the preparation of these consolidated financial statements aredescribed below.
Basis of measurement
These consolidated financial statements have been prepared in Canadian dollars, which is the Corporation’sfunctional currency, rounded to the nearest thousand dollars, except when otherwise indicated, and are preparedon the historical cost basis, except for the revaluation of certain financial assets and financial liabilities at fairvalue through profit or loss.
Consolidation
These consolidated financial statements include the accounts of the following entities:
Subsidiaries (100% owned) Associates
Inuvialuit Land Corporation Northern Aboriginal Services Corporation (25%)Inuvialuit Petroleum Corporation Pan Arctic Inuit Logistics Corporation (19%)Inuvialuit Investment CorporationInuvialuit Development CorporationNorTerra Inc.Aklak Air Ltd.Oceanside Village Developments Inc.Stanton Group Ltd.KBL Land Use Consulting Ltd.
Inuvialuit Regional CorporationNotes to Consolidated Financial StatementsDecember 31, 2016
(in thousands of Canadian dollars)

FINFINFINFINFIN A NA NA NA NA NCIAL REPORCIAL REPORCIAL REPORCIAL REPORCIAL REPOR T 20T 20T 20T 20T 201111166666 9
Joint ventures Joint operations
Inuvik Gas Ltd. (33%) Akita Equtak Drilling Ltd. (50%)Ikhil Joint Venture (33%)Arctic Oil & Gas Services Inc. (50%)Aklak Inc. (51%)Inukshuk Geomatics Inc. (51%)Inuvialuit Oilfield Services Ltd. (51%)IEG Consultants Ltd. (51%)Tundra Communications Inc. (51%)Nappaq Construction Ltd. (51%)Mackenzie Integrated Tubular Solutions Inc. (50%)Inuvialuit BBE Expediting Ltd. (51%)
• Subsidiaries
Subsidiaries are entities over which the Corporation has control. The Corporation controls an entity when thegroup is exposed to, or has rights to, variable returns from its involvement with the entity and has the ability toaffect those returns through its power over the entity. This includes the power to govern the financial andoperating policies generally accompanying a shareholding of more than one-half of the voting rights.Subsidiaries are fully consolidated from the date on which control is obtained by the Corporation.
Subsidiaries are deconsolidated form the date control ceases. Intercompany transactions, balances andunrealized gains or losses on transactions between the Corporation and the subsidiary companies areeliminated.
• Associates
Associates are all entities over which the Corporation has significant influence but not control, generallyaccompanying a shareholding of between 20% and 50% of the voting rights. Investments in associates areaccounted for using the equity method of accounting and are initially recognized at cost. The Corporation’sinvestment in associates includes goodwill identified on acquisition, net of any accumulated impairment loss.
The Corporation’s share of its associates’ post-acquisition comprehensive profits or losses is recognized in theconsolidated statement of comprehensive income and increases or decreases the carrying amount of theinvestment. When the Corporation’s share of losses in an associate equals or exceeds its interest in theassociate the Corporation does not recognize further losses, unless it has legal or constructive obligations onbehalf of the associate. In these circumstances, the Corporation also evaluates any other long-term receivableswhere repayment is neither planned nor expected in the foreseeable future.
• Joint arrangements
A joint arrangement is an arrangement whereby two or more parties have joint control and is either a jointoperation or a joint venture. Joint control is the contractually agreed sharing of control of an arrangement, whichexists only when decisions about the relevant activities require the unanimous consent of the parties sharingcontrol.
The Corporation’s interests in jointly controlled operations are accounted for by proportionate consolidation. TheCorporation combines its share of the joint operations’ individual income and expenses, assets and liabilities andcash flows on a line-by-line basis with similar items in the Corporation’s consolidated financial statements. TheCorporation recognizes the portion of gains or losses on the sale of assets to the joint operation that isattributable to the other venturers. The Corporation does not recognize its share of profits or losses from thejoint venture that result from the Corporation’s purchase of assets from the joint venture until it resells theassets to an independent party. However, a loss on the transaction is recognized immediately if the lossprovides evidence of a reduction in the net realizable value of current assets, or an impairment loss.
The Corporation’s interests in jointly controlled ventures are accounted for using the equity method.
Cash and cash equivalents
Cash and cash equivalents consist of cash on deposit and term deposits held at call with banks with a maturitydate of less than three months.
Inuvialuit Regional CorporationNotes to Consolidated Financial StatementsDecember 31, 2016
(in thousands of Canadian dollars)

10 INUVIALINUVIALINUVIALINUVIALINUVIAL UIT REGIONUIT REGIONUIT REGIONUIT REGIONUIT REGION AL CAL CAL CAL CAL CORPORAORPORAORPORAORPORAORPORATIONTIONTIONTIONTION
Financial instruments
• Recognition
The Corporation initially recognizes financial assets and financial liabilities measured at amortized cost on thedate at which they are originated. All other financial assets and liabilities are initially recognized on thesettlement date at which the Corporation becomes a party to the contractual provisions of the instrument. Afinancial asset or financial liability is measured initially at fair value plus, for an item not at fair value throughprofit or loss, transaction costs that are directly attributable to its acquisition or issue.
• Classification and measurement
Cash and cash equivalents, accounts receivable, due from related parties and loans and advances to affiliatesare categorized as loans and receivables. Loans and receivables are non-derivative financial assets with fixedor determinable payments that are not quoted in an active market. Loans and receivables are initially recognizedat the amount expected to be received, less, when material, a discount to reduce the loans and receivables tofair value. Subsequently, loans and receivables are measured at amortized cost using the effective interestmethod less a provision for impairment.
The Corporation classifies its marketable securities and its financial liabilities to Balanced Fund participants asfinancial assets or financial liabilities at fair value through profit or loss. This category has two sub-categories:financial assets and financial liabilities held-for-trading; and those designated at fair value through profit or lossat inception.
i) Financial assets and liabilities held-for-trading - A financial asset or financial liability is classified as held-for-trading if it is acquired or incurred principally for the purpose of selling or repurchasing in the near term or ifon initial recognition, it is part of a portfolio of identifiable financial investments that are managed together andfor which there is evidence of a recent actual pattern of short-term profit taking. Derivatives are alsocategorized as held-for-trading. The Corporation does not classify any derivatives as hedges in a hedgingrelationship.
ii) Financial assets and liabilities designated at fair value through profit or loss at inception - Financial assets andfinancial liabilities designated at fair value through profit or loss at inception are financial instruments that arenot classified as held-for-trading, but are managed, and their performance is evaluated, on a fair value basisin accordance with the Corporation’s documented investment strategy. The Corporation’s policy requires theBoard of Directors to evaluate the information about these financial assets and liabilities on a fair value basistogether with other related financial information.
Gains or losses arising from changes in the fair value of marketable securities and financial liabilities toBalanced Fund participants are presented in the consolidated statement of comprehensive income withinunrealized investment revenue in the period in which they arise.
The Corporation maintains cash accounts with its custodians for various investment managers due to the timingof security purchases and sales; these accounts are classified as loans and receivables.
Bank indebtedness, accounts payable and accrued liabilities, long-term debt, finance lease obligations, notespayable and financial liabilities to Fixed Income Fund participants are classified as financial liabilities at amortizedcost. These liabilities are initially recognized at fair value, net of any transaction costs incurred and aresubsequently measured at amortized cost using the effective interest method.
• Derecognition
The Corporation derecognizes a financial asset when the contractual rights to the cash flows from the financialasset expire, or when it transfers the financial asset in a transaction in which substantially all the risks andrewards of ownership of the financial asset are transferred or in which the Corporation neither transfers norretains substantially all the risks and rewards of ownership and does not retain control of the financial asset.On derecognition of a financial asset, the difference between the carrying amount of the asset (or the carryingamount allocated to the portion of the asset derecognized), and the consideration received (including any newasset obtained less any new liability assumed) is recognized in the consolidated statement of comprehensiveincome.
The Corporation derecognizes a financial liability when its contractual obligations are discharged or cancelled orexpire.
Inuvialuit Regional CorporationNotes to Consolidated Financial StatementsDecember 31, 2016
(in thousands of Canadian dollars)
FINFINFINFINFIN A NA NA NA NA NCIAL REPORCIAL REPORCIAL REPORCIAL REPORCIAL REPOR T 20T 20T 20T 20T 201111166666 11
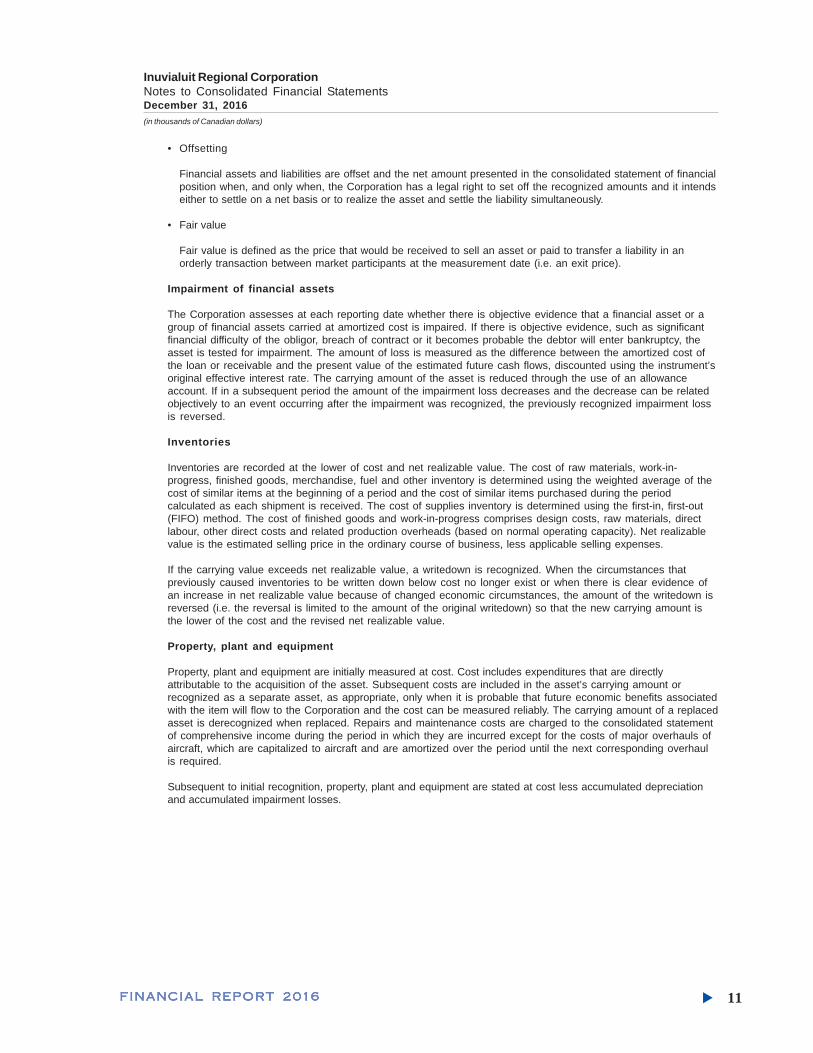
• Offsetting
Financial assets and liabilities are offset and the net amount presented in the consolidated statement of financialposition when, and only when, the Corporation has a legal right to set off the recognized amounts and it intendseither to settle on a net basis or to realize the asset and settle the liability simultaneously.
• Fair value
Fair value is defined as the price that would be received to sell an asset or paid to transfer a liability in anorderly transaction between market participants at the measurement date (i.e. an exit price).
Impairment of financial assets
The Corporation assesses at each reporting date whether there is objective evidence that a financial asset or agroup of financial assets carried at amortized cost is impaired. If there is objective evidence, such as significantfinancial difficulty of the obligor, breach of contract or it becomes probable the debtor will enter bankruptcy, theasset is tested for impairment. The amount of loss is measured as the difference between the amortized cost ofthe loan or receivable and the present value of the estimated future cash flows, discounted using the instrument’soriginal effective interest rate. The carrying amount of the asset is reduced through the use of an allowanceaccount. If in a subsequent period the amount of the impairment loss decreases and the decrease can be relatedobjectively to an event occurring after the impairment was recognized, the previously recognized impairment lossis reversed.
Inventories
Inventories are recorded at the lower of cost and net realizable value. The cost of raw materials, work-in-progress, finished goods, merchandise, fuel and other inventory is determined using the weighted average of thecost of similar items at the beginning of a period and the cost of similar items purchased during the periodcalculated as each shipment is received. The cost of supplies inventory is determined using the first-in, first-out(FIFO) method. The cost of finished goods and work-in-progress comprises design costs, raw materials, directlabour, other direct costs and related production overheads (based on normal operating capacity). Net realizablevalue is the estimated selling price in the ordinary course of business, less applicable selling expenses.
If the carrying value exceeds net realizable value, a writedown is recognized. When the circumstances thatpreviously caused inventories to be written down below cost no longer exist or when there is clear evidence ofan increase in net realizable value because of changed economic circumstances, the amount of the writedown isreversed (i.e. the reversal is limited to the amount of the original writedown) so that the new carrying amount isthe lower of the cost and the revised net realizable value.
Property, plant and equipment
Property, plant and equipment are initially measured at cost. Cost includes expenditures that are directlyattributable to the acquisition of the asset. Subsequent costs are included in the asset’s carrying amount orrecognized as a separate asset, as appropriate, only when it is probable that future economic benefits associatedwith the item will flow to the Corporation and the cost can be measured reliably. The carrying amount of a replacedasset is derecognized when replaced. Repairs and maintenance costs are charged to the consolidated statementof comprehensive income during the period in which they are incurred except for the costs of major overhauls ofaircraft, which are capitalized to aircraft and are amortized over the period until the next corresponding overhaulis required.
Subsequent to initial recognition, property, plant and equipment are stated at cost less accumulated depreciationand accumulated impairment losses.
Inuvialuit Regional CorporationNotes to Consolidated Financial StatementsDecember 31, 2016
(in thousands of Canadian dollars)
12 INUVIALINUVIALINUVIALINUVIALINUVIAL UIT REGIONUIT REGIONUIT REGIONUIT REGIONUIT REGION AL CAL CAL CAL CAL CORPORAORPORAORPORAORPORAORPORATIONTIONTIONTIONTION
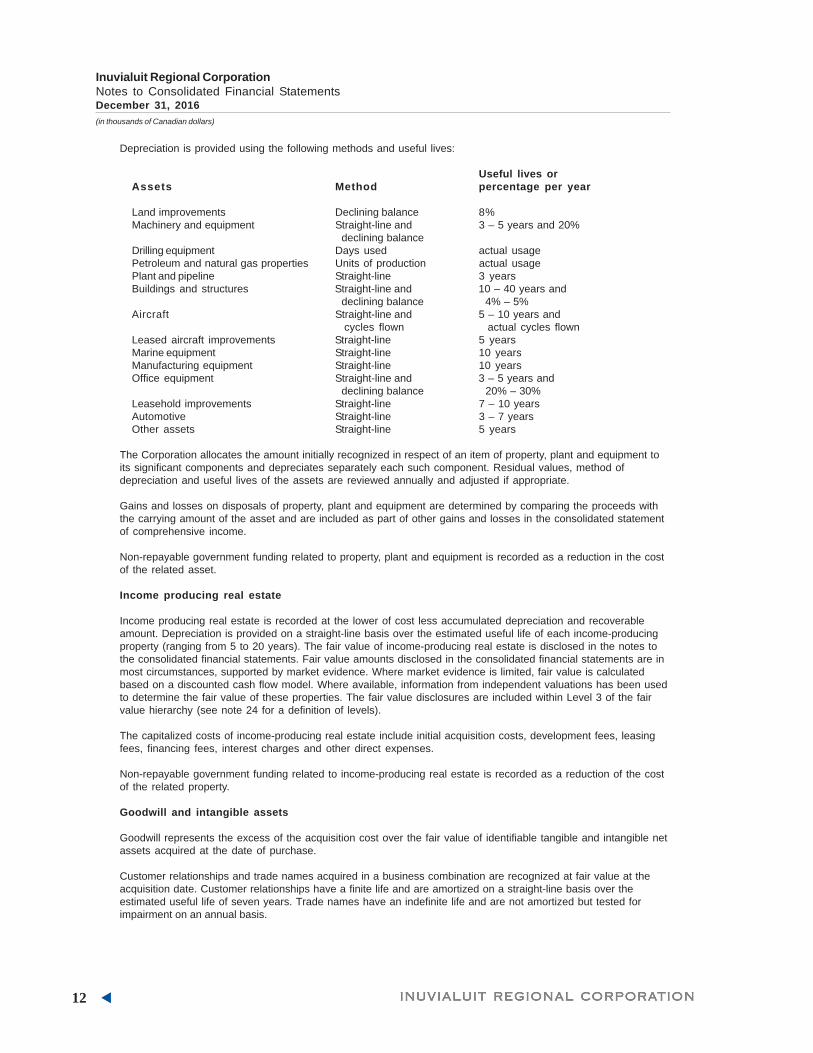
Depreciation is provided using the following methods and useful lives:
Useful lives orAssets Method percentage per year
Land improvements Declining balance 8%Machinery and equipment Straight-line and 3 – 5 years and 20%
declining balanceDrilling equipment Days used actual usagePetroleum and natural gas properties Units of production actual usagePlant and pipeline Straight-line 3 yearsBuildings and structures Straight-line and 10 – 40 years and
declining balance 4% – 5%Aircraft Straight-line and 5 – 10 years and
cycles flown actual cycles flownLeased aircraft improvements Straight-line 5 yearsMarine equipment Straight-line 10 yearsManufacturing equipment Straight-line 10 yearsOffice equipment Straight-line and 3 – 5 years and
declining balance 20% – 30%Leasehold improvements Straight-line 7 – 10 yearsAutomotive Straight-line 3 – 7 yearsOther assets Straight-line 5 years
The Corporation allocates the amount initially recognized in respect of an item of property, plant and equipment toits significant components and depreciates separately each such component. Residual values, method ofdepreciation and useful lives of the assets are reviewed annually and adjusted if appropriate.
Gains and losses on disposals of property, plant and equipment are determined by comparing the proceeds withthe carrying amount of the asset and are included as part of other gains and losses in the consolidated statementof comprehensive income.
Non-repayable government funding related to property, plant and equipment is recorded as a reduction in the costof the related asset.
Income producing real estate
Income producing real estate is recorded at the lower of cost less accumulated depreciation and recoverableamount. Depreciation is provided on a straight-line basis over the estimated useful life of each income-producingproperty (ranging from 5 to 20 years). The fair value of income-producing real estate is disclosed in the notes tothe consolidated financial statements. Fair value amounts disclosed in the consolidated financial statements are inmost circumstances, supported by market evidence. Where market evidence is limited, fair value is calculatedbased on a discounted cash flow model. Where available, information from independent valuations has been usedto determine the fair value of these properties. The fair value disclosures are included within Level 3 of the fairvalue hierarchy (see note 24 for a definition of levels).
The capitalized costs of income-producing real estate include initial acquisition costs, development fees, leasingfees, financing fees, interest charges and other direct expenses.
Non-repayable government funding related to income-producing real estate is recorded as a reduction of the costof the related property.
Goodwill and intangible assets
Goodwill represents the excess of the acquisition cost over the fair value of identifiable tangible and intangible netassets acquired at the date of purchase.
Customer relationships and trade names acquired in a business combination are recognized at fair value at theacquisition date. Customer relationships have a finite life and are amortized on a straight-line basis over theestimated useful life of seven years. Trade names have an indefinite life and are not amortized but tested forimpairment on an annual basis.
Inuvialuit Regional CorporationNotes to Consolidated Financial StatementsDecember 31, 2016
(in thousands of Canadian dollars)

FINFINFINFINFIN A NA NA NA NA NCIAL REPORCIAL REPORCIAL REPORCIAL REPORCIAL REPOR T 20T 20T 20T 20T 201111166666 13
Purchased intangible assets are recorded at cost and are composed of costs incurred to secure the transfer ofInuvialuit lands from the federal government (Settlement Rights) and computer software. Settlement Rights have anindefinite life and are not amortized but are tested for impairment on an annual basis. Computer software has afinite life and is amortized on a straight-line basis of 20% to 100% per year.
Impairment of non-financial assets
Assets that have an indefinite useful life, which includes goodwill, trade names and Settlement Rights, are notsubject to amortization and are tested annually for impairment. Property, plant and equipment, income-producingreal estate and intangible assets with a finite life are tested for impairment when events or changes incircumstances indicate the carrying amount may not be recoverable. An impairment loss is recognized for theamount by which the asset’s carrying amount exceeds its recoverable amount. The recoverable amount is thehigher of an asset’s fair value less costs of disposal and value in use. For the purpose of measuring recoverableamounts, assets are grouped at the lowest levels for which there are separately identifiable cash flows (cashgenerating units or CGUs).
The Corporation evaluates impairment losses for potential reversals, other than goodwill impairment losses, whenevents or circumstances warrant such consideration.
Assets held-for-sale
Non-current assets, or assets of a disposal group, are classified as held-for-sale if their carrying amount will berecovered principally through a sale transaction rather than through continuing use. This condition is met whenassets are available for immediate sale in their present condition, subject only to terms that are usual andcustomary for sales of such assets, and their sale is highly probable. The Corporation must be committed to thesale, which should be expected to qualify as a completed sale within one year from the date of classification.
Assets classified as held-for-sale are measured at the lower of their carrying amounts and their fair value lesscosts to sell.
Provisions
Provisions for maintenance and asset retirement obligations are recognized when: the Corporation has a presentlegal or constructive obligation as a result of past events; it is probable that an outflow of resources will berequired to settle the obligation; and the amount has been reliably estimated.
The Corporation’s aircraft operating lease agreements require leased aircraft to be returned to the lessor in aspecified operating condition. This obligation requires the Corporation to record a maintenance provision for certainreturn conditions specified in the operating lease agreements. The maintenance provision is recorded over theterm of the lease and uses a discount rate taking into account the specific risks of the provision over the remainingterm of the lease. Interest accretion on the provision is recorded in finance expense. Any changes in themaintenance cost estimate, discount rates, timing of settlement or difference in the actual maintenance costincurred and the amount of the provisions are recorded in aircraft maintenance in the period.
A provision for decommissioning costs relating to the Ikhil natural gas well is measured at the present value of theexpenditures expected to be required to settle the obligation using a pre-tax rate that reflects current marketassessments of the time value of money and the risks specific to the obligation. The increase in the provision dueto passage of time is recognized as finance expense.
Leases
Leases in which a significant portion of the risks and rewards of ownership are retained by the lessor areclassified as operating leases. Payments made under operating leases (net of any incentives received from thelessor) are charged to the consolidated statement of comprehensive income on a straight-line basis over theperiod of the lease.
Leases in which substantially all the risks and rewards of ownership have transferred to the Corporation areclassified as finance leases. The leased assets are recognized at the lease’s commencement at the lower of thefair value of the leased property and the present value of the minimum lease payments.
Each lease payment is allocated between the liability and finance charges so as to achieve a constant rate on thefinance lease balance outstanding. The corresponding rental obligations, net of finance charges, are included infinance lease obligations. The interest element of the finance cost is charged to the consolidated statement of
Inuvialuit Regional CorporationNotes to Consolidated Financial StatementsDecember 31, 2016
(in thousands of Canadian dollars)

14 INUVIALINUVIALINUVIALINUVIALINUVIAL UIT REGIONUIT REGIONUIT REGIONUIT REGIONUIT REGION AL CAL CAL CAL CAL CORPORAORPORAORPORAORPORAORPORATIONTIONTIONTIONTION
comprehensive income over the lease period so as to produce a constant periodic rate of interest on the remainingbalance of the liability for each period. The assets acquired under finance leases are depreciated over the shorterof the useful lives of the assets and the lease term.
Employee benefits
• Other employee future benefits
The Corporation has a supplemental pension plan for certain employees. The cost is actuarially determinedusing the projected unit credit method pro-rated on service (where applicable), market interest rates, andmanagement’s best estimate of retirement ages of employees, health-care cost inflation, salary escalation andgeneral inflation. The supplemental pension plan is unfunded.
The discount rate on the pension obligations is equal to the yield at the measurement date on high qualitycorporate bonds that have maturity dates approximating the terms of the Corporation’s obligation.
Past-service costs are recognized immediately in income.
Actuarial gains and losses arising from experience adjustments and changes in actuarial assumptionsattributable to the supplemental pension and adjustments resulting from minimum funding requirements, arerecognized immediately in other comprehensive income and retained earnings without recycling to net income insubsequent periods.
• Defined contribution pension plan
The Corporation also has a defined contribution pension plan for certain employees, which provides pensionbenefits based on the accumulated contributions and fund earnings. A defined contribution plan is a post-employment benefit plan under which an entity pays fixed contributions into a separate entity and will have nolegal or constructive obligation to pay further amounts. Obligations for contributions to defined contributionpension plans are recognized as an employee benefit expense in income in the periods during which servicesare rendered by employees.
Revenue recognition
Development revenue is recognized on the accrual basis and includes an estimate of services provided but notyet billed. Contract revenues are recognized in the accounting period when the services are rendered. Revenuefrom income-producing real estate is recorded as income as facility rental accommodations are provided. Otherrevenue is recognized at the time the service is performed or when title passes to the customer.
Land access and administration fees revenue is recognized at the time the service is performed.
Petroleum and natural gas revenue from sales of products is recognized on shipment to the customer.
Cash received in advance of a service being provided or goods being delivered is recorded as deferred revenue.
Realized portfolio income
Realized portfolio income is comprised of all portfolio investment income, with the exception of any unrealizedgains or losses on the adjustment of marketable securities to fair value. It includes:
• Realized gains and losses
Income from realized gains and losses includes all realized fair value changes for financial assets and liabilities,which are classified as fair value through profit or loss.
• Interest
Interest income includes amounts calculated using the effective interest method. The effective interest rate isthe rate that exactly discounts the estimated future cash payments and receipts through the expected life of thefinancial asset or liability (or, where appropriate, a shorter period) to the carrying amount of the financial assetor liability. When calculating the effective interest rate, the Corporation estimates future cash flows consideringall contractual terms of the financial instrument, but not future credit losses.
Inuvialuit Regional CorporationNotes to Consolidated Financial StatementsDecember 31, 2016
(in thousands of Canadian dollars)

FINFINFINFINFIN A NA NA NA NA NCIAL REPORCIAL REPORCIAL REPORCIAL REPORCIAL REPOR T 20T 20T 20T 20T 201111166666 15
The calculation of the effective interest rate includes all fees paid or received that are an integral part of theeffective interest rate. Transaction costs include incremental costs that are directly attributable to the acquisitionor issue of a financial asset or liability.
• Dividends
Dividend income is recognized when the right to receive income is established. Usually this is the ex-dividenddate for equity securities.
• Partnership income
Partnership income includes all amounts received and receivable from partnerships. Distributions are madequarterly based on the income available in the partnership.
• Dividend withholding taxes
The Corporation is subject to dividend withholding tax on distributions made from certain foreign investmentvehicles. These taxes are based on tax treaties signed with the country in which the foreign investment vehicleresides and are deducted from any realized portfolio income. The Corporation is eligible to claim a tax benefiteither in the form of a reduction in taxes payable or a deduction against income for tax purposes.
Government grants
Grants from the government are recognized at their fair value when there is a reasonable assurance that thegrant will be received and the group will comply with all attached conditions.
Government grants relating to costs are deferred and recognized in the consolidated statement of comprehensiveincome over the period necessary to match them with the costs they are intended to compensate.
Income taxes
Income tax on the profit or loss for the periods presented comprises current and deferred tax. Income tax isrecognized in the consolidated statement of comprehensive income.
Current income tax expense is the expected tax payable on the taxable income for the year, using tax ratesenacted or substantively enacted at year-end, adjusted for amendments to tax payable with regard to previousyears.
Deferred income tax is provided using the balance sheet liability method, providing for temporary differencesbetween the carrying amounts of assets and liabilities for financial reporting purposes and the amounts used fortaxation purposes. The amount of deferred tax provided is based on the expected manner of realization orsettlement of the carrying amount of assets and liabilities, using tax rates enacted or substantively enacted at theconsolidated statement of financial position reporting date applicable to the period of expected realization orsettlement. A deferred tax asset is recognized only to the extent that it is probable that future taxable profits will beavailable against which the asset can be utilized. Deferred tax assets and liabilities are offset when there is alegally enforceable right to set off current tax assets against current tax liabilities and when they relate to incometaxes levied by the same taxation authority and the Corporation intends to settle its current tax assets and liabilitieson a net basis.
Income taxes recoverable represents the current estimated refund of taxes from taxation authorities.
Foreign currency translation
Foreign currency transactions are translated into the functional currency using the exchange rates prevailing atthe dates of the transactions. Foreign exchange gains and losses resulting from the settlement of foreignexchange transactions and from the translation at exchange rates of monetary assets and liabilities denominatedin currencies other than an entity’s functional currency are recognized in the consolidated statement ofcomprehensive income in general and administrative expenses.
Inuvialuit Regional CorporationNotes to Consolidated Financial StatementsDecember 31, 2016
(in thousands of Canadian dollars)

16 INUVIALINUVIALINUVIALINUVIALINUVIAL UIT REGIONUIT REGIONUIT REGIONUIT REGIONUIT REGION AL CAL CAL CAL CAL CORPORAORPORAORPORAORPORAORPORATIONTIONTIONTIONTION
Changes in accounting policy
The IFRS Interpretations Committee (IC) issued an agenda decision in April 2016 on when and whether entitieswith cash pooling arrangements are able to offset balances in accordance with IAS 32, Financial Instruments –Presentation. The IC noted that, to the extent to which a group does not expect to settle its subsidiaries’ year-endaccount balances on a net basis, it would not be appropriate for the group to assert that it had the intention tosettle the entire year-end balances on a net basis at the reporting date.
The Corporation was previously offsetting balances under cash pooling arrangements and has retroactivelyrestated the consolidated statement of financial position to present cash and bank indebtedness gross. This hasresulted in an increase to cash and bank indebtedness as at December 31, 2015 of $83,651.
Accounting standards and amendments issued but not adopted
• IFRS 9, Financial Instruments
IFRS 9, Financial Instruments, will replace IAS 39, Financial Instruments: Recognition and Measurement. IFRS 9introduces a model for classification and measurement, a single, forward-looking expected loss impairmentmodel and a substantially reformed approach to hedge accounting. The new single, principle based approachfor determining the classification of financial assets is driven by cash flow characteristics and the businessmodel in which an asset is held. The new model also results in a single impairment model being applied to allfinancial instruments, which will require more timely recognition of expected credit losses. IFRS 9 is effectivefor years beginning on or after January 1, 2018, with earlier adoption permitted. The Corporation is in theprocess of evaluating the impact IFRS 9 may have on the consolidated financial statements.
• IFRS 15, Revenue From Contracts With Customers
IFRS 15, Revenue from Contracts With Customers, supersedes IAS 18, Revenue, IAS 11, ConstructionContracts, and other interpretive guidance associated with revenue recognition. IFRS 15 provides a singlemodel to determine how and when an entity should recognize revenue, as well as requiring entities to providemore informative, relevant disclosures in respect of their revenue recognition criteria. IFRS 15 is effective foryears beginning on or after January 1, 2018, with earlier adoption permitted. The Corporation is in the processof evaluating the impact IFRS 15 may have on the consolidated financial statements.
• IFRS 16, Leases
IFRS 16, Leases, replaces IAS 17, Leases, and its associated interpretative guidance. IFRS 16 applies a controlmodel to the identification of leases, distinguishing between a lease and a service contract on the basis ofwhether the customer controls the asset being leased. For those assets determined to meet the definition of alease, IFRS 16 introduces significant changes to the accounting by lessees, introducing a single, on-balancesheet accounting model similar to current finance lease accounting, with limited exceptions for short-termleases or leases of low value assets. Lessor accounting remains similar to current accounting practice. Thestandard is effective for annual periods beginning on or after January 1, 2019, with early adoption permitted forentities that apply IFRS 15. The Corporation is in the process of evaluating the impact IFRS 16 may have on theconsolidated financial statements.
4 Critical Accounting Estimates and Judgments
The preparation of consolidated financial statements in conformity with IFRS requires management to makeestimates and assumptions concerning the future and requires management to make judgments in applyingaccounting policies. Estimates and assumptions are based on historical experience, expectations, current trendsand other factors that management believed to be relevant at the time at which the Corporation’s consolidatedfinancial statements are prepared. Management reviews, on a regular basis, the Corporation’s estimates,assumptions and judgments and reflects revisions in future periods. The estimates, assumptions and managementjudgments that have a significant risk of causing a material adjustment to the carrying amount of assets andliabilities within the next financial year are outlined below.
Investments in joint ventures and associates
The consolidated financial statements include the Corporation’s accounts and all other entities in which theCorporation has a controlling financial interest, except where the control over the operations is limited bysignificant participating interests held by another investor in such operations.
Where the Corporation does not have control, either because of significant participating interests by other parties
Inuvialuit Regional CorporationNotes to Consolidated Financial StatementsDecember 31, 2016
(in thousands of Canadian dollars)

FINFINFINFINFIN A NA NA NA NA NCIAL REPORCIAL REPORCIAL REPORCIAL REPORCIAL REPOR T 20T 20T 20T 20T 201111166666 17
or the presence of only significant influence, the entity is accounted for using the equity method.
There are a number of areas where significant judgment is exercised to establish whether an entity is required tobe consolidated. In order to establish whether an entity is a consolidated subsidiary, a joint venture or anassociate, key areas of judgment include:
• qualitative analysis of an entity including review of, among other factors, its capital structure, contractual terms,which interests create or absorb variability, related party relationships and assessment of the purpose anddesign of the entity;
• rights of partners regarding significant business decisions, including disposals and acquisitions of assets;
• board and management representation;
• ability to make financing decisions; and
• operating and capital budget approvals and contractual rights of other parties.
The exercise of judgment in these areas determines whether a particular entity is consolidated, accounted forunder the equity method or as a financial asset.
The following Inuvialuit entities are not included in these consolidated financial statements:
• The Inuvialuit Trust• The Inuvialuit Harvesters Assistance Trust• The Inuvialuit Community Economic Development Organization• The Inuvialuit Charitable Foundation• The Inuvialuit Educational Foundation• The Inuvialuit Social Development Fund
This conclusion was based on a thorough review of the facts and circumstances related to the areas of judgmentdiscussed above.
As well, in situations where an associate’s losses exceed the Corporation’s interest in the associate, managementneeds to assess what other long-term interests form part of the Corporation’s net investment and to what extent,if any, a provision needs to be recorded for losses in excess of the net investment.
If the judgment applied in determining the accounting treatment of an entity is incorrect or the fact pattern on whichit is based changes, such entities may need to be consolidated or may result in unexpected losses being reflectedin the consolidated financial statements.
There are cases where an investment is accounted for as a joint venture or an associate using the equity method,despite having an ownership interest exceeding 50%, as the Corporation does not exercise direct or indirectcontrol over the investee. To the extent the Corporation is deemed to control these entities, the entities would haveto be consolidated. This would affect the consolidated statement of financial position, consolidated statement ofcomprehensive income and consolidated statement of cash flows.
Fair value of financial instruments
The Corporation holds investments in certain funds and partnership units that do not have a quoted value in anactive market. Management has reviewed the valuation methodology (including the nature of factors incorporatedinto the models) used by third party pricing sources that are relied on and has considered the quality processesand controls related to third party pricing sources.
The fair value of investments in fund and partnership units is determined based on the net asset value (NAV) ofthe underlying investments. Use of the NAV is considered an appropriate reflection of fair value because the fundand partnership units are a conduit to the underlying portfolio of investments. Management considers the mannerin which the fair value of the underlying assets and liabilities was determined and whether adjustments arerequired to the NAV based on the terms of its investments, including liquidity factors. The majority of theseinvestments are open ended and do not have any significant restrictions imposed on them related to theredemption of units. Six of the investments, Birch Hill Equity Partners III, LP, Birch Hill Equity Partners V, LP, ImperialCapital Acquisition Fund IV, Imperial Capital Acquisition Fund V, Imperial Capital Acquisition Fund VI and KingSettCanadian Real Estate Income Fund LP, are closed ended and there is no active market for subscribing andredeeming units. Management has not applied a discount factor related to the inability to redeem units.
Inuvialuit Regional CorporationNotes to Consolidated Financial StatementsDecember 31, 2016
(in thousands of Canadian dollars)

18 INUVIALINUVIALINUVIALINUVIALINUVIAL UIT REGIONUIT REGIONUIT REGIONUIT REGIONUIT REGION AL CAL CAL CAL CAL CORPORAORPORAORPORAORPORAORPORATIONTIONTIONTIONTION
Inventories
The Corporation records inventories at the lower of cost and net realizable value. Writedowns for inventory arerecorded each period as required and updated based on management’s judgment.
Maintenance provision
The Corporation has a legal obligation to adhere to certain maintenance conditions set out in its aircraft operatinglease agreements relating to the condition of the aircraft when it is returned to the lessor. To fulfill theseobligations, a provision is made during the lease term. Judgments related to the maintenance provision include thelikely utilization of the aircraft, the expected future cost of the maintenance, the point in time at which maintenanceis expected to occur and the discount rate used to present value the future cash flows.
Impairment considerations for long-lived assets
An impairment test is performed by comparing the carrying amount of the asset or CGU to its recoverable amount,which is calculated as the higher of an asset’s or CGU’s fair value less costs of disposal and its value-in-use.Value-in-use is calculated based on a discounted cash flow analysis, which requires management to make anumber of significant estimates including assumptions relating to future operating plans, discount rates and futuregrowth rates. Refer to note 12 for additional information.
5 Inventories2016 2015
$ $
Raw materials 2,321 2,316Work-in-progress 1,122 1,417Finished goods 7,433 6,740Merchandise 1,663 9,960Supplies 7,242 8,749Fuel - 7,942Other 2,916 3,319
22,697 40,443
Inventory expensed during the year of $43,766 (2015 – $48,047) has been included in development expenses.
6 Assets Held-for-Sale2016 2015
$ $
Aircraft 1,574 -Marine equipment 3,928 -
5,502 -
During the year, management committed to a plan to sell two airplanes with a carrying value of $4,848. Theairplanes were replaced by newer models and were not fully utilized when management made the decision to sell.The airplanes are being actively marketed and management expects to complete the sale within a year. Onreclassification from property, plant and equipment to assets held-for-sale, the airplanes were written down to fairvalue less costs to sell of $1,574. The loss of $3,274 is included in impairment of long-lived assets in theconsolidated statement of comprehensive income.
The fair value measurement is categorized in Level 3 of the fair value hierarchy (see note 24 for a definition oflevels). There is a limited market for the two airplanes so the fair value was determined based on the offersreceived to purchase the airplanes.
Management has also committed to a plan to sell marine equipment with a carrying value of $3,928. The marineequipment was used by Northern Transportation Company Limited until it declared bankruptcy on December 30,2016 (note 25). The marine equipment is being actively marketed and management expects to complete the salewithin a year. The fair value less costs to sell was higher than the carrying value so there was no writedownwhen the marine equipment was reclassified to assets held-for-sale.
Inuvialuit Regional CorporationNotes to Consolidated Financial StatementsDecember 31, 2016
(in thousands of Canadian dollars)

FINFINFINFINFIN A NA NA NA NA NCIAL REPORCIAL REPORCIAL REPORCIAL REPORCIAL REPOR T 20T 20T 20T 20T 201111166666 19
7 Investments, Loans and Advances2016 2015
$ $Investments in associates and joint ventures
Inuvik Gas Ltd. 180 180Ikhil Joint Venture - -Aklak Inc. 472 493Arctic Oil & Gas Services Inc. - -Pan Arctic Inuit Logistics Corporation - -Northern Aboriginal Services Corporation 92 92Inuvialuit Oilfield Services Ltd. 82 82Tundra Communications Inc. 4 4IEG Consultants Ltd. - -Akita Equtak Drilling Ltd. 25 25Mackenzie Integrated Tubular Solutions Inc. 3 3Inukshuk Geomatics Inc. - -Nappaq Construction Ltd. - 353Inuvialuit BBE Expediting Ltd. 4 -
862 1,232Loans and advances to affiliates
Aklak Inc. 407 814Mackenzie Valley Aboriginal Pipeline Corporation 296 297Inuvialuit Craft Shop Ltd. 10 70
713 1,181
1,575 2,413
Differences in accounting standards
Due to the choice for non-publicly accountable enterprises to adopt either IFRS or Canadian accounting standardsfor private enterprises (ASPE), there are adjustments required to account for the differences in methodology inapplying certain ASPE standards. The standards adopted by each of IRC’s associates and joint ventures aredetailed below:
Aklak Inc., Pan Arctic Inuit Logistics Corporation, Northern Aboriginal Services Corporation, Inuvialuit OilfieldServices Ltd., Tundra Communications Inc., IEG Consultants Ltd., Mackenzie Integrated Tubular Solutions Inc.,Nappaq Construction Ltd. and Inuvialuit BBE Expediting Ltd. use ASPE.
Inuvik Gas Ltd., Ikhil Joint Venture, Arctic Oil & Gas Services Inc., Akita Equtak Drilling Ltd. and Inukshuk GeomaticsInc. use IFRS.
Joint ventures
The aggregate (loss) income recorded from the Corporation’s interests in joint ventures is as follows:
2016 2015$ $
Aklak Inc. (21) 120Inuvialuit Oilfield Services Ltd. - 3Nappaq Construction Ltd. (353) 353Inuvialuit BBE Expedting Ltd. 4 -
(370) 476
The Corporation accounts for its share of the joint ventures’ and associates’ net assets at the end of the fiscalyear. Arctic Oil & Gas Services Inc. is in a net deficit position at the end of 2016. The unrecognized share ofincome for this joint venture is $76 for the year ended December 31, 2016 (2015 – $347) and the cumulativeunrecognized loss is $430 (2015 – $506).
Inuvialuit Regional CorporationNotes to Consolidated Financial StatementsDecember 31, 2016
(in thousands of Canadian dollars)

20 INUVIALINUVIALINUVIALINUVIALINUVIAL UIT REGIONUIT REGIONUIT REGIONUIT REGIONUIT REGION AL CAL CAL CAL CAL CORPORAORPORAORPORAORPORAORPORATIONTIONTIONTIONTION
Loans and advances to affiliates
Loans and advances to affiliates are non-interest bearing, unsecured and have no fixed terms for repayment.
8 Marketable Securities and Financial Liabilities to Balanced Fund Participants
Portfolio investments are composed of a pooled investment fund (the Balanced Fund), which is managed by theInuvialuit Investment Corporation (IIC). Under the Balanced Fund, participants hold units of an investment pool andearn a return on a diversified portfolio of investments.
On contribution of funds for investment in the Balanced Fund, the participants receive a number of unitsdetermined by dividing the amount of such contributions by the NAV per unit as of the immediately precedingvaluation day. Units are not transferable, except with the prior written approval of IIC.
All securities in which the assets of the Balanced Fund are invested are registered in the name of IIC. IIC holds theassets of the Balanced Fund in trust for the participants. The redemption price is the NAV on the valuation day (thelast trading day of each month).
The Balanced Fund is consolidated into the consolidated financial statements of the Corporation, and as such theentire assets of the Balanced Fund are reported in the consolidated statement of financial position. Liabilities toother participants in the Balanced Fund have also been reported in the consolidated statement of financial positionand are classified as a financial liability designated at fair value through profit or loss at inception.
Classification
Investments are categorized as either held-for-trading or designated at fair value through profit or loss. See note 3for a description of each category.
2016 2015$ $
Financial assets held-for-tradingEquity securities 255,929 233,498Debt securities 106,125 107,058
Total financial assets held-for-trading 362,054 340,556Designated at fair value through profit or loss
Alternative investments 64,896 72,289
Total financial assets at fair value through profit or loss 426,950 412,845
Included in investments are all amounts held in the investment pool. The amounts are categorized as follows:
2016 2015$ $
Cash 468 381Receivable from brokers for sales 1,201 1,244Payable to brokers for purchases (97) (30)Investments at fair value through profit or loss 425,378 411,250
426,950 412,845
Note that cash excludes short-term cash equivalents such as treasury bills.
Inuvialuit Regional CorporationNotes to Consolidated Financial StatementsDecember 31, 2016
(in thousands of Canadian dollars)

FINFINFINFINFIN A NA NA NA NA NCIAL REPORCIAL REPORCIAL REPORCIAL REPORCIAL REPOR T 20T 20T 20T 20T 201111166666 21
Investment income
Investment income includes the gross income of all investments held by the Corporation.
2016
Share ofincome of
Pooled other fundincome participants Total
$ $ $
Interest – net 1,658 7 1,651Dividends 6,366 16 6,350Partnership income 7,249 14 7,235Other investment gains and losses (101) - (101)Changes in fair value of financial assets and liabilities carried at fair value through profit or loss
Realized 6,592 15 6,577Unrealized 12,848 38 12,810
34,612 90 34,522
2015
Share ofincome of
Pooled other fundincome participants Total
$ $ $
Interest – net 1,528 7 1,521Dividends 6,512 21 6,491Partnership income 5,462 15 5,447Other investment gains and losses (250) (1) (249)Changes in fair value of financial assets and liabilities carried at fair value through profit or loss
Realized 9,338 31 9,307Unrealized 5,453 18 5,435
28,043 91 27,952
Interest income is earned on debt securities. Interest and dividend income are reported net of withholding taxes of$208 (2015 – $127).
Income from investments designated at fair value through profit or loss is comprised of partnership income. Othernet changes on unrealized income on financial assets and liabilities at fair value through profit or loss are shownbelow:
2016 2015$ $
Designated at fair value through profit or loss 76 2,165Held-for-trading 12,734 3,270
12,810 5,435
Inuvialuit Regional CorporationNotes to Consolidated Financial StatementsDecember 31, 2016
(in thousands of Canadian dollars)

22 INUVIALINUVIALINUVIALINUVIALINUVIAL UIT REGIONUIT REGIONUIT REGIONUIT REGIONUIT REGION AL CAL CAL CAL CAL CORPORAORPORAORPORAORPORAORPORATIONTIONTIONTIONTION
Inuvialuit Regional CorporationNotes to Consolidated Financial StatementsDecember 31, 2016
(in thousands of Canadian dollars)
Alternative investments
Included in financial assets designated at fair value through profit or loss at inception, the Corporation hasinterests in Birch Hill Equity Partners III, LP (BHEP III), Birch Hill Equity Partners V, LP (BHEP V), Imperial CapitalAcquisition Fund IV (Institutional) (ICAF IV), Imperial Capital Acquisition Fund V (Institutional) (ICAF V), ImperialCapital Fund VI (Institutional) (ICAF VI), KingSett Canadian Real Estate Income Fund LP (KingSett) and the BlairFranklin Global Credit Fund LP (Blair Franklin). Details of these funds are included below:
Fund Ownership Capital Investment 2016 Remaining Fair
type interest committed period distributions commitment value% $ $ $ $
BHEP III limitedpartnership 1.2 5,000 Dec 31, 2016 973 113 1,947
BHEP V limitedpartnership 1.0 5,000 Dec 31, 2019 297 4,675 325
ICAF IV limitedpartnership 25 5,000 Dec 31, 2016 250 230 1,061
ICAF V limitedpartnership 15 5,000 Dec 31, 2019 - 1,007 6,398
ICAF VI limitedpartnership 4.2 5,000 Dec 31, 2022 - 4,910 91
KingSett REIT 2.3 30,000 open 15,944 - 34,562Blair Franklin hedge fund 2.3 8,000 open - - 19,612Other - - - 900
Total 63,000 17,464 10,935 64,896
Financial liabilities to Balanced Fund participants
The change in financial liabilities to Balanced Fund participants is shown below:2016 2015
$ $
Balance – Beginning of year 1,387 1,226Realized income 52 73Unrealized income 38 18Net (sales) purchases (894) 70
Balance – End of year 583 1,387
9 Financial Liabilities to Fixed Income Fund Participants
Fixed Income Fund participants receive a return based on DEX overall domestic bond return rates. The Corporationmust pay to each Fixed Income Fund participant, at least semi-annually, interest on the funds invested for theaccount of such Fixed Income Fund participant.
The following is a summary of the participants in the Fixed Income Fund:
• Inuvialuit Social Development Program• Inuvialuit Education Foundation• Inuvialuit Charitable Foundation• Inuvialuit Harvesters Assistance Trust• Various community corporations
The Corporation’s obligation to the participants in the Fixed Income Fund is recognized in the Corporation’sconsolidated financial statements as a financial liability at amortized cost. During the year, interest expense onfinancial liabilities to Fixed Income Fund participants was $580 (2015 – $582). The interest expense is reported netof realized investment revenue in the consolidated statement of comprehensive income. Financial liabilities to FixedIncome Fund participants are classified as current liabilities due to their demand nature.

FINFINFINFINFIN A NA NA NA NA NCIAL REPORCIAL REPORCIAL REPORCIAL REPORCIAL REPOR T 20T 20T 20T 20T 201111166666 23
Inuvialuit Regional CorporationNotes to Consolidated Financial StatementsDecember 31, 2016
(in thousands of Canadian dollars)
A
s a
t D
ecem
ber
31, 2
015
A
s a
t D
ecem
ber
31, 2016
Tra
nsfe
rsA
ccu
mu
late
dN
et
bo
ok
Op
en
ing
net
to a
ssets
Dis
co
nti
nu
ed
Clo
sin
g n
et
Co
st
dep
recia
tio
nvalu
eb
oo
k v
alu
eA
dd
itio
ns
Dis
po
sals
Tra
nsfe
rsh
eld
-fo
r-sale
Imp
air
men
tD
ep
’no
pera
tio
ns
bo
ok v
alu
e
$$
$$
$$
$$
$$
$$
Land a
nd la
nd im
pro
vem
ents
3,13
1(6
8)
3,06
33,
063
6-
--
-(9
)(1
,696)
1,36
4M
ach
inery
and e
quip
ment
1,66
4(1
,448)
216
216
89-
--
-(5
2)
-25
3D
rilli
ng e
quip
ment
18,4
00(6
,835)
11,5
6511
1,56
587
--
-(9
,087)
(655)
-1,
910
Petr
ole
um
and n
atu
ral g
as
pro
pert
ies
3,58
6(3
,586)
--
--
--
--
--
Pla
nt a
nd p
ipelin
e5,
881
(5,8
81)
--
--
--
--
--
Ass
et r
etir
em
ent o
blig
atio
n14
1(1
41)
--
--
--
--
--
Build
ings
and s
truct
ure
s89
,253
(18,1
75)
71,0
7871
,078
648
-(9
)-
-(3
,683)
(7,8
69)
60,1
65A
ircr
aft
64,1
00(1
8,5
65)
45,5
3545
,535
16,9
48(6
,389)
-(4
,848)
-(1
1,3
58)
-39
,888
Marine e
quip
ment
50,7
04(1
5,0
17)
35,6
8735
,687
--
-(3
,928)
-(4
28)
(31,3
31)
-M
anufa
cturing e
quip
ment
9,86
9(4
,917)
4,95
24,
952
1,67
2-
--
-(1
,535)
-5,
089
Offic
e e
quip
ment
9,08
1(5
,516)
3,56
53,
565
140
(31)
9-
-(5
74)
(2,0
19)
1,09
0A
utom
otiv
e6,
097
(2,0
09)
4,08
84,
088
207
(5)
--
-(4
33)
(2,9
75)
882
261,
907
(82,1
58)
179,
749
179,
749
19,7
97(6
,425)
-(8
,776)
(9,0
87)
(18,7
27)
(45,8
90)
110,
641
10 Property, Plant and Equipment
A
s a
t D
ecem
ber
31, 2
014
A
s a
t D
ecem
ber
31, 2015
Accu
mu
late
dN
et
bo
ok
Op
en
ing
net
Dis
co
nti
nu
ed
Clo
sin
g n
et
Co
st
dep
recia
tio
n v
alu
eb
oo
k V
alu
eA
dd
itio
ns
Dis
po
sals
Tra
nsfe
rsIm
pair
men
tD
ep
’no
pera
tio
ns
bo
ok v
alu
e
$$
$$
$$
$$
$$
$
Land a
nd la
nd im
pro
vem
ents
3,05
7(6
2)
2,99
52,
995
74-
--
(6)
-3,
063
Mach
inery
and e
quip
ment
1,64
7(1
,400)
247
247
29(9
)-
-(5
1)
-21
6D
rilli
ng e
quip
ment
18,2
72(6
,047)
12,2
2512
,225
128
--
-(7
88)
-11
,565
Petr
ole
um
and n
atu
ral g
as
pro
pert
ies
3,58
6(3
,586)
--
--
--
--
-P
lant a
nd p
ipelin
e5,
881
(5,8
81)
--
--
--
--
-A
sset r
etir
em
ent o
blig
atio
n14
1(1
41)
--
--
--
--
-B
uild
ings
and s
truct
ure
s87
,715
(13,7
18)
73,9
9773
,997
1,96
1(1
61)
-(1
,610)
(3,5
04)
395
71,0
78A
ircr
aft
60,8
40(8
,337)
52,5
0352
,503
11,8
04(8
,229)
1,59
8-
(12,1
41)
-45
,535
Marine e
quip
ment
48,9
91(4
,577)
44,4
1444
,414
--
--
(570)
(8,1
57)
35,6
87M
anufa
cturing e
quip
ment
9,84
9(3
,251)
6,59
86,
598
146
(77)
-(2
22)
(1,4
93)
-4,
952
Offic
e e
quip
ment
8,44
5(4
,217)
4,22
84,
228
390
(3)
-(2
4)
(702)
(324)
3,56
5A
utom
otiv
e5,
927
(1,0
85)
4,84
24,
842
419
(10)
(1,5
98)
(3)
(523)
961
4,08
8
254,
351
(52,3
02)
202,
049
202,
049
14,9
51(8
,489)
-(1
,859)
(19,7
78)
(7,1
25)
179,
749

24 INUVIALINUVIALINUVIALINUVIALINUVIAL UIT REGIONUIT REGIONUIT REGIONUIT REGIONUIT REGION AL CAL CAL CAL CAL CORPORAORPORAORPORAORPORAORPORATIONTIONTIONTIONTION
Ending cost and accumulated depreciation for 2016 were as follows:
AccumulatedCost depreciation
$ $
Land and land improvements 1,441 (77)Machinery and equipment 1,754 (1,501)Drilling equipment 18,487 (16,577)Petroleum and natural gas properties 3,586 (3,586)Plant and pipeline 5,881 (5,881)Asset retirement obligation 141 (141)Buildings and structures 80,978 (20,813)Aircraft 61,169 (21,281)Marine equipment - -Manufacturing equipment 11,539 (6,450)Office equipment 6,120 (5,030)Automotive 2,393 (1,511)
193,489 (82,848)
Property, plant and equipment include the following net book values where the Corporation is a lessee under afinance lease:
2016 2015$ $
Buildings 13,270 11,475Marine equipment - 14,179Other equipment - 209
13,270 25,863
Due to the continued decline in oil prices and reduced future drilling activity, an impairment loss of $9,087 has beenrecognized on the drilling equipment. The loss is included in impairment of long-lived assets in the consolidatedstatement of comprehensive income. The recoverable amount of $2,477 was determined based on fair value lesscosts of disposal. The fair value measurement is included in Level 3 of the fair value hierarchy (see note 24 for adefinition of levels) and is based on independent valuations of the drilling equipment.
Inuvialuit Regional CorporationNotes to Consolidated Financial StatementsDecember 31, 2016
(in thousands of Canadian dollars)

FINFINFINFINFIN A NA NA NA NA NCIAL REPORCIAL REPORCIAL REPORCIAL REPORCIAL REPOR T 20T 20T 20T 20T 201111166666 25
11 Income Producing Real Estate
As at December 31, 2015 Year ended December 31, 2016
Opening ClosingAccumulated Net net book net book
Cost depreciation book value value Additions Disposals Depreciation value Fair value$ $ $ $ $ $ $ $ $
CommercialAklavik Office Complex 1,707 (1,538) 169 169 - - (79) 90 4,749Fisheries & Oceans Building 1,098 (1,022) 76 76 - - (1) 75 3,443GNWT Building 819 (806) 13 13 543 - (14) 542 2,399Ed Smith Building 558 (501) 57 57 - - (2) 55 2,409Billy Moore Home 345 (53) 292 292 - - (12) 280 1,231Dowland Building 822 (53) 769 769 - - (39) 730 1,262Coast Guard Building 2,067 (397) 1,670 1,670 - - (88) 1,582 4,520
7,416 (4,370) 3,046 3,046 543 - (235) 3,354 20,013
ResidentialLauron Apartments 1,233 (981) 252 252 - - (53) 199 3,48114 Stringer 345 (302) 43 43 11 - - 54 65016 Stringer 408 (323) 85 85 11 - (19) 77 47120 Stringer 324 (282) 42 42 11 - - 53 40322 Stringer 313 (272) 41 41 10 - (2) 49 554199-205 Loucheux 417 (217) 200 200 11 - (17) 194 621266-272 Mackenzie 386 (204) 182 182 21 - (16) 187 949Smith Apartments - - - - 685 - (20) 665 6853-9 Natala 249 (167) 82 82 - - (8) 74 79311-17 Natala 335 (257) 78 78 - - (13) 65 85119-25 Natala 342 (149) 193 193 - - (14) 179 66127-33 Natala 245 (147) 98 98 - - (9) 89 40135-41 Natala - - - - 216 - (5) 211 49643-49 Natala 411 (191) 220 220 - - (17) 203 717Tuk Residential 179 (63) 116 116 - - (8) 108 39439 Dolphin 403 (132) 271 271 - - (18) 253 45390 Bompas 289 (79) 210 210 - - (12) 198 263
5,879 (3,766) 2,113 2,113 976 - (231) 2,858 12,843
13,295 (8,136) 5,159 5,159 1,519 - (466) 6,212 32,856
Ending cost and accumulated depreciation for commercial income producing real estate (IPRE) for 2016 was$7,959 and $4,605, respectively.
Ending cost and accumulated depreciation for residential IPRE for 2016 was $6,855 and $3,997, respectively.
Inuvialuit Regional CorporationNotes to Consolidated Financial StatementsDecember 31, 2016
(in thousands of Canadian dollars)

26 INUVIALINUVIALINUVIALINUVIALINUVIAL UIT REGIONUIT REGIONUIT REGIONUIT REGIONUIT REGION AL CAL CAL CAL CAL CORPORAORPORAORPORAORPORAORPORATIONTIONTIONTIONTION
As at December 31, 2014 Year ended December 31, 2015
Opening ClosingAccumulated Net net book net book
Cost depreciation book value value Additions Disposals Depreciation value Fair value$ $ $ $ $ $ $ $ $
CommercialAklavik Office Complex 1,707 (1,459) 248 248 - - (79) 169 3,960Fisheries & Oceans Building 1,098 (1,016) 82 82 - - (6) 76 3,019GNWT Building 819 (805) 14 14 - - (1) 13 759Ed Smith Building 558 (499) 59 59 - - (2) 57 2,649Billy Moore Home 345 (41) 304 304 - - (12) 292 1,037Dowland Building 698 (17) 681 681 124 - (36) 769 1,055Coast Guard Building 2,067 (309) 1,758 1,758 - - (88) 1,670 4,953
7,292 (4,146) 3,146 3,146 124 - (224) 3,046 17,432Residential
Lauron Apartments 1,233 (927) 306 306 - - (54) 252 3,16314 Stringer 345 (301) 44 44 - - (1) 43 48516 Stringer 408 (305) 103 103 - - (18) 85 46020 Stringer 324 (282) 42 42 - - - 42 44022 Stringer 313 (271) 42 42 - - (1) 41 432199-205 Loucheux 417 (200) 217 217 - - (17) 200 707266-272 Mackenzie 386 (188) 198 198 - - (16) 182 8053-9 Natala 237 (158) 79 79 12 - (9) 82 50411-17 Natala 323 (243) 80 80 12 - (14) 78 69719-25 Natala 326 (136) 190 190 16 - (13) 193 81627-33 Natala 233 (138) 95 95 12 - (9) 98 63943-49 Natala 411 (175) 236 236 - - (16) 220 726Tuk Residential 179 (55) 124 124 - - (8) 116 37239 Dolphin 403 (114) 289 289 - - (18) 271 62790 Bompas 289 (67) 222 222 - - (12) 210 123
5,827 (3,560) 2,267 2,267 52 - (206) 2,113 10,996
13,119 (7,706) 5,413 5,413 176 - (430) 5,159 28,428
The Corporation recognized $2,881 (2015 – $2,732) in revenue from operating leases during the year.
The future minimum lease payments receivable are as follows:$
No later than 1 year 2,678Later than 1 year and no later than 5 years 1,882Later than 5 years 434
4,994
Inuvialuit Regional CorporationNotes to Consolidated Financial StatementsDecember 31, 2016
(in thousands of Canadian dollars)

FINFINFINFINFIN A NA NA NA NA NCIAL REPORCIAL REPORCIAL REPORCIAL REPORCIAL REPOR T 20T 20T 20T 20T 201111166666 27
Inuvialuit Regional CorporationNotes to Consolidated Financial StatementsDecember 31, 2016
(in thousands of Canadian dollars)
12 Goodwill and Intangible Assets
CustomerStanton Settlement Trade relation- Computer
Group rights names ships software Total$ $ $ $ $ $
Year ended December 31, 2015Opening net book value 792 4,124 3,923 8,667 243 17,749Additions - - - - 26 26Amortization for the year - - - (1,379) (73) (1,452)Impairment - - (23) (118) - (141)Discontinued operations - - - 97 42 139
792 4,124 3,900 7,267 238 16,321
As at December 31, 2015Cost 792 4,124 8,991 24,800 1,421 40,128Accumulated amortization - - - (3,989) (1,183) (5,172)Accumulated impairment - - (5,091) (13,544) - (18,635)
792 4,124 3,900 7,267 238 16,321
Year ended December 31, 2016Opening net book value 792 4,124 3,900 7,267 238 16,321Additions - - - - 18 18Amortization for the year - - - (1,619) (53) (1,672)Discontinued operations - - - (145) (121) (266)
792 4,124 3,900 5,503 82 14,401
As at December 31, 2016Cost 792 4,124 8,991 24,690 1,158 39,755Accumulated amortization - - - (5,643) (1,076) (6,719)Accumulated impairment - - (5,091) (13,544) - (18,635)
792 4,124 3,900 5,503 82 14,401
Trade names acquired in a business combination comprise the brands of Canadian North Inc. (Canadian North)and Weldco-Beales Manufacturing Inc. (Weldco-Beales) and have indefinite lives. Indefinite lives were determinedbased on the long-standing brands of Canadian North and Weldco-Beales and their ability to generate cash flowsinto the foreseeable future.
The recoverable amounts for CGUs that include indefinite life intangible assets are determined based on value-in-use calculations. These calculations use pre-tax cash flow projections, based on financial budgets approved bymanagement, covering a four-year period. Cash flows beyond the four-year period are extrapolated using theestimated growth rates stated below. The growth rate does not exceed the long-term average growth rate for thebusiness in which the CGU operates.

28 INUVIALINUVIALINUVIALINUVIALINUVIAL UIT REGIONUIT REGIONUIT REGIONUIT REGIONUIT REGION AL CAL CAL CAL CAL CORPORAORPORAORPORAORPORAORPORATIONTIONTIONTIONTION
Inuvialuit Regional CorporationNotes to Consolidated Financial StatementsDecember 31, 2016
(in thousands of Canadian dollars)
Key assumptions used in calculating the recoverable amount, which reflect past experience and current marketexpectations are:
Canadian North Weldco-Beales 2016 2015 2016 2015 % % % %
Growth rate (2017) (14.1) (14.7) 2.5 (1.8)Weighted average growth rate (2018 – 2020) 3.3 1.8 3.6 4.2Terminal growth rate 2.0 2.0 2.0 2.5Pre-tax discount rate 12.3 12.2 11.2 15.7
There were no impairment losses recognized in 2016 (2015 – $2,000 impairment loss in the Weldco-Beales CGU).
13 Deferred Revenue2016 2015
$ $
Advance ticket sales 5,386 6,160Funding 8,021 2,255Corporate leases 1,300 1,322Other 18 -
14,725 9,737
The above deferred revenue represents the Corporation’s future obligation relating to amounts received orreceivable as at December 31, 2016. The amounts related to the advance ticket sales and corporate leases will berecognized at the time the service is performed. The funding revenue will be recognized at the time the relatedexpenditures are incurred.
14 Provisions2016 2015
Decom-Maintenance missioning Total Total
$ $ $ $
Balance – Beginning of year 3,949 990 4,939 4,544Provisions arising during the year 671 1,010 1,681 2,158Amounts disbursed (2,422) - (2,422) (1,634)Accretion expense 89 - 89 (129)
2,287 2,000 4,287 4,939
Maintenance provisions relate to the provision for the costs to meet the contractual return conditions on aircraftunder operating leases. The provision relates to leases with expiry dates ranging from 2019 to 2023 with theaverage remaining lease term of approximately five years.
The decommissioning provision relates to the Ikhil natural gas well.
15 Borrowings
Bank indebtedness
The Corporation’s subsidiary, NorTerra Inc. (NorTerra), has a consolidated banking arrangement, provided by asyndicate of banks, under which a $55,000 revolving operating credit facility is available that is advanced bybankers’ acceptances and prime rate based loans, with interest paid monthly. As at December 31, 2016, therewas cash of $32,383 (2015 – $54,402) and bank indebtedness of $70,750 (2015 – $97,415) outstanding underthis facility. The weighted average interest rate on bank indebtedness under this arrangement to December 31,2016 was 4.87% (2015 – 6.38%) and the interest rate as at December 31, 2016 was 3.61% (2015 – 5.95%). Ageneral security agreement and a first fixed and floating charge debenture against all assets of NorTerra with anet book value of $183,884 (2015 – $261,942) are pledged as collateral. Subsequent to year-end, the net amountof cash and bank indebtedness was settled.

FINFINFINFINFIN A NA NA NA NA NCIAL REPORCIAL REPORCIAL REPORCIAL REPORCIAL REPOR T 20T 20T 20T 20T 201111166666 29
Inuvialuit Regional CorporationNotes to Consolidated Financial StatementsDecember 31, 2016
(in thousands of Canadian dollars)
The Corporation also has a line of credit available in the amount of $75,000 with cash of $67,783 (2015 – $27,889)and bank indebtedness of $51,188 (2015 – $43,534) outstanding as at December 31, 2016. The line bears interestat prime rate of 2.70% and is collateralized with marketable securities in the amount of $123,702 (2015 –$118,494).
Subsequent to year-end, two new lines of credit were obtained in the amounts of $20,000 for NorTerra’ssubsidiary, Weldco-Beales Manufacturing Inc., and $20,000 for NorTerra’s subsidiary, Canadian North Inc. Thelines of credit can be advanced by either prime rate loans or bankers’ acceptances and bear interest at prime plus0.50% or the bankers’ acceptance rate plus 2.25%. A general security agreement and a demand debentureagainst all assets of Weldco-Beales Manufacturing Inc. and Canadian North Inc. have been pledged as collateral.The lines of credit expire in March 2020.
Long-term debt2016 2015
$ $Non-revolving term loan, repayable at $1,604 per quarter,
due August 31, 2018 75,921 86,266
Term loan, repayable at $16 monthly including interest at 5.85%,due August 15, 2020 - 1,847
Revolving credit facility - 5,095
75,921 93,208Less: Current portion 75,921 13,201
- 80,007
The non-revolving term loan is advanced by bankers’ acceptances and prime rate based loans with interest paidmonthly. Additional repayments will be required if financial results exceed certain parameters during the periodoutstanding. Net proceeds from the sale of assets (other than inventory) must also be directed toward principalrepayment. The weighted average interest rate on the non-revolving term loan was 5.57% (2015 – 6.37%) and theinterest rate as at December 31, 2016 was 4.11% (2015 – 5.26%). A general security agreement and a first fixedand floating charge debenture against all assets of NorTerra with a net book value of $183,884 (2015 – $261,942)are pledged as collateral.
As at December 31, 2016, NorTerra was in violation of certain non-financial covenants and the debt has beenclassified as current. Subsequent to year-end, the debt was settled.
The term loan and revolving credit facility were disposed of when the Corporation lost control of NorthernTransportation Company Limited (note 25).
Finance lease obligations2016 2015
$ $Minimum lease payments
No later than 1 year 1,161 4,027Later than 1 year and no later than 5 years 5,284 14,613Later than 5 years 16,129 17,449
22,574 36,089Future finance charges on finance lease obligations 8,248 10,333
Present value of finance lease obligations 14,326 25,756Less: Current portion 319 2,086
14,007 23,670

30 INUVIALINUVIALINUVIALINUVIALINUVIAL UIT REGIONUIT REGIONUIT REGIONUIT REGIONUIT REGION AL CAL CAL CAL CAL CORPORAORPORAORPORAORPORAORPORATIONTIONTIONTIONTION
Inuvialuit Regional CorporationNotes to Consolidated Financial StatementsDecember 31, 2016
(in thousands of Canadian dollars)
The present value of finance lease liabilities is as follows:2016 2015
$ $
No later than 1 year 319 2,086Later than 1 year and no later than 5 years 2,151 11,225Later than 5 years 11,856 12,445
14,326 25,756
The Corporation leases various buildings under non-cancellable finance lease agreements. The lease terms are 16years at an interest rate of 6.00%. The finance lease obligations are secured by assets with a net book value of$13,270 (note 10).
Note payable2016 2015
$ $
Note payable 6,000 8,000Less: Discount 173 385
5,827 7,615Less: Current portion 2,000 2,000
3,827 5,615
The note payable is secured by 50% of the Corporation’s shares in NorTerra and bears no interest. The notepayable is due in annual instalments of $2,000 on February 1 of each year from 2017 – 2019.
16 Pension Obligations
The Corporation’s subsidiary, NorTerra, operated a defined benefit pension plan and other employee futurebenefits, including retiree life insurance and contractual severance, for certain employees until NorthernTransportation Company Limited filed for bankruptcy on December 30, 2016 (note 25). Movements in the pensionplan related to Northern Transportation Company Limited are included in discontinued operations.
As at December 31, 2016, other employee future benefits consist of supplemental pension obligations provided tocertain former employees. This plan is unfunded and is closed to new members.
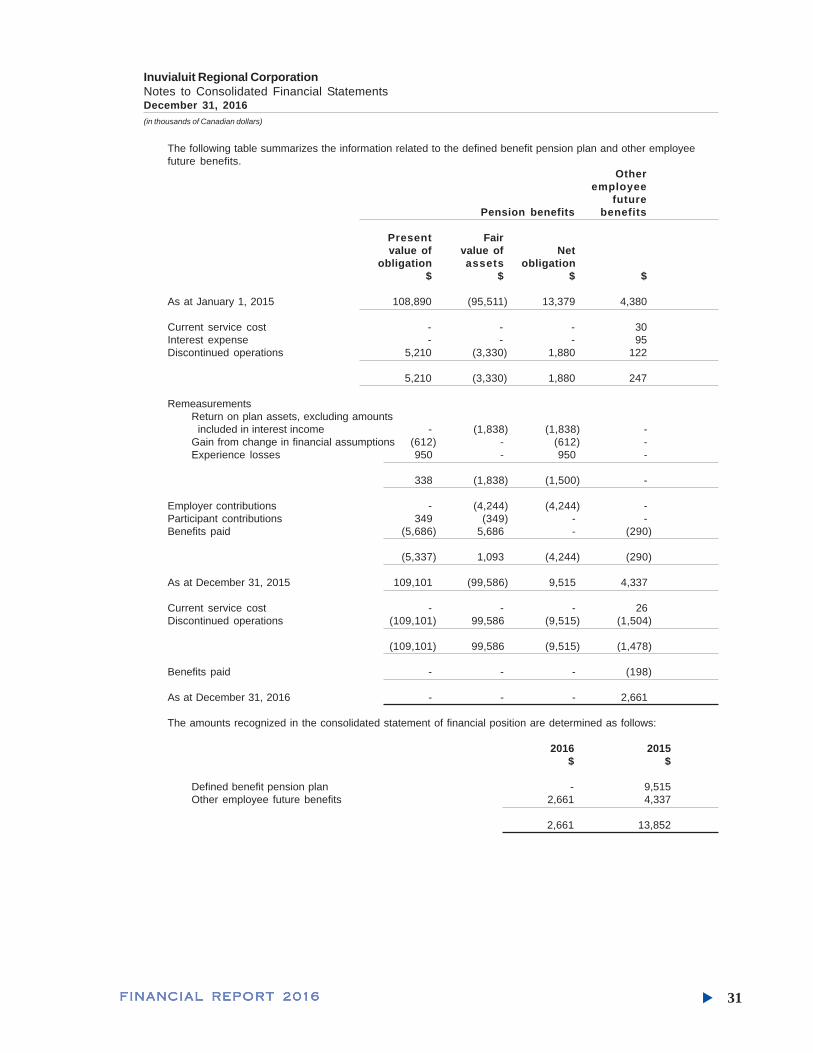
FINFINFINFINFIN A NA NA NA NA NCIAL REPORCIAL REPORCIAL REPORCIAL REPORCIAL REPOR T 20T 20T 20T 20T 201111166666 31
Inuvialuit Regional CorporationNotes to Consolidated Financial StatementsDecember 31, 2016
(in thousands of Canadian dollars)
The following table summarizes the information related to the defined benefit pension plan and other employeefuture benefits.
Otheremployee
futurePension benefits benefits
Present Fairvalue of value of Net
obligation assets obligation$ $ $ $
As at January 1, 2015 108,890 (95,511) 13,379 4,380
Current service cost - - - 30Interest expense - - - 95Discontinued operations 5,210 (3,330) 1,880 122
5,210 (3,330) 1,880 247
RemeasurementsReturn on plan assets, excluding amounts included in interest income - (1,838) (1,838) -Gain from change in financial assumptions (612) - (612) -Experience losses 950 - 950 -
338 (1,838) (1,500) -
Employer contributions - (4,244) (4,244) -Participant contributions 349 (349) - -Benefits paid (5,686) 5,686 - (290)
(5,337) 1,093 (4,244) (290)
As at December 31, 2015 109,101 (99,586) 9,515 4,337
Current service cost - - - 26Discontinued operations (109,101) 99,586 (9,515) (1,504)
(109,101) 99,586 (9,515) (1,478)
Benefits paid - - - (198)
As at December 31, 2016 - - - 2,661
The amounts recognized in the consolidated statement of financial position are determined as follows:
2016 2015$ $
Defined benefit pension plan - 9,515Other employee future benefits 2,661 4,337
2,661 13,852

32 INUVIALINUVIALINUVIALINUVIALINUVIAL UIT REGIONUIT REGIONUIT REGIONUIT REGIONUIT REGION AL CAL CAL CAL CAL CORPORAORPORAORPORAORPORAORPORATIONTIONTIONTIONTION
Inuvialuit Regional CorporationNotes to Consolidated Financial StatementsDecember 31, 2016
(in thousands of Canadian dollars)
17 Income Taxes
The Corporation is exempt from income taxes; however, its subsidiaries are subject to income taxes. Thecomponents of the income tax recovery are as follows:
2016 2015$ $
Income tax expense at statutory rate 1,485 2,959Adjusted for the tax effect of the following items
Dividend income not subject to Part I tax (904) (870)Non-deductible (non-taxable) portion of capital losses (gains) 12,712 (1,444)Recognition of deferred tax asset on net capital losses (27,866) -Non-taxable portion of change in fair value of financial assets (1,672) (1,038)Foreign tax credits (208) (129)Refundable Part I and Part IV taxes 931 (24,437)Loss from a tax-exempt entity 166 -Reversal of deferred tax on a tax-exempt entity - (565)Non-deductible items and other (86) (284)Adjustment in respect of prior years (1,838) 110Remeasurement of deferred tax – impact of substantively enacted rates 2,662 (9)
(14,618) (25,707)
The applicable statutory rate was 26.5% (2015 – 26.5%).
The analysis of the deferred tax assets and deferred tax liabilities is as follows:
2016 2015$ $
Deferred tax assetsDeferred tax assets to be recovered after more than 12 months (27,615) (11,556)Deferred tax assets to be recovered within 12 months (894) (982)
(28,509) (12,538)Deferred tax liabilities
Deferred tax liabilities to be realized after more than 12 months 33,145 29,168Deferred tax liabilities to be realized within 12 months - 150
33,145 29,318
Deferred tax liabilities – net 4,636 16,780
The movement of deferred income tax assets and liabilities during the year is as follows:
Net capitalInvestments, losses and Finance
loans and non-capital leaseDeferred tax assets advances losses obligations Financing Other Total
$ $ $ $ $ $
As at January 1, 2015 (1,886) (11,023) (4,302) - (1,334) (18,495)Charged (credited) to the income statement 669 (1,374) (147) (191) (439) (1,482)Discontinued operations - 6,954 142 (25) 368 7,439
As at December 31, 2015 (1,167) (5,443) (4,307) (216) (1,405) (12,538)Charged (credited) to the income statement (225) (18,635) 45 (293) 545 (18,563)Discontinued operations - 2,648 392 25 (473) 2,592
As at December 31, 2016 (1,392) (21,430) (3,870) (484) (1,333) (28,509)

FINFINFINFINFIN A NA NA NA NA NCIAL REPORCIAL REPORCIAL REPORCIAL REPORCIAL REPOR T 20T 20T 20T 20T 201111166666 33
Inuvialuit Regional CorporationNotes to Consolidated Financial StatementsDecember 31, 2016
(in thousands of Canadian dollars)
Property,plant and
equipmentand income- Goodwill and
producing Marketable intangibleDeferred tax liabilities real estate securities assets Financing Other Total
$ $ $ $ $ $
As at January 1, 2015 9,962 18,351 3,276 1,195 296 33,080Charged (credited) to the income statement (2,414) 886 (941) (1,195) (146) (3,810)Discontinued operations 39 - 9 - - 48
As at December 31, 2015 7,587 19,237 2,344 - 150 29,318Charged (credited) to the income statement (273) 4,839 (575) - (150) 3,841Discontinued operations (291) - 277 - - (14)
As at December 31, 2016 7,023 24,076 2,046 - - 33,145
As at December 31, 2016, the Corporation has approximately $37,319 of non-capital losses and approximately$51,693 in net capital losses available to reduce future years’ income for tax purposes (subject to confirmation byincome tax authorities). The non-capital losses expire as follows:
$December 31
2025 262026 3252027 -2028 2942029 3392030 692031 1,9642032 2,4272033 2,5942034 7,0552035 3,3982036 18,828
The potential benefit relating to $9,753 of these non-capital losses has not been reflected in these consolidatedfinancial statements.
The net capital losses may only be applied to reduce future taxable capital gains and are not subject to expiry.
The Corporation has also not recognized a deferred tax asset related to the pension obligation in the amount of$717 (2015 – $3,740), as it is not expected to be recoverable.
18 Commitments and Contingencies
Guarantees
The Corporation has provided a joint and several guarantee of $350 relating to performance in Arctic Oil & GasServices Inc.
The Corporation has provided guarantees totalling $nil (2015 – $4,750) relating to Pan Arctic Inuit LogisticsCorporation, an equity investment, which represents 9.50% of the total guarantee for the North Warning Systemoperation and maintenance agreement with Public Works & Government Services Canada. No amounts have beenrecorded in the consolidated financial statements for amounts owing under this guarantee.
Director and officer indemnification agreements
The Corporation has entered into indemnification agreements with its current and former directors and officers toindemnify them, to the extent permitted by law, against any and all charges, costs, expenses, amounts paid insettlement and damages incurred by them as a result of any lawsuit or any other judicial, administrative orinvestigative proceedings in which they are sued as a result of their service. These indemnification claims will besubject to any statutory or other legal limitation period.

34 INUVIALINUVIALINUVIALINUVIALINUVIAL UIT REGIONUIT REGIONUIT REGIONUIT REGIONUIT REGION AL CAL CAL CAL CAL CORPORAORPORAORPORAORPORAORPORATIONTIONTIONTIONTION
Inuvialuit Regional CorporationNotes to Consolidated Financial StatementsDecember 31, 2016
(in thousands of Canadian dollars)
The nature of the indemnification agreements prevents the Corporation from making a reasonable estimate of themaximum potential amount it could be required to pay to counterparties. The Corporation has purchased directors’and officers’ liability insurance. No amount has been recorded in the consolidated financial statements withrespect to these indemnification agreements.
Letters of credit
The Corporation’s subsidiary, NorTerra, has letters of credit outstanding of $2,595 (2015 – $2,682) relating to acredit facility that was settled after year-end. The Corporation has a letter of credit facility included in its $75,000line of credit and a separate $10,000 letter of credit facility that is secured by an assignment of rents andaccounts receivable, along with a $15,000 fixed and floating debenture. As at December 31, 2016, letters of creditoutstanding under these two facilities were $11,435 (2015 – $11,868), of which $8,685 was settled after year-end. The total amount outstanding under all letter of credit facilities is $14,030 (2015 – $14,550).
Commitments
The Corporation leases various offices, buildings, property, aircraft and other equipment under non-cancellableoperating lease agreements. The majority of the lease agreements are renewable at the end of the lease period atmarket rates.
The future aggregate minimum lease payments under non-cancellable operating leases are as follows:
$No later than 1 year 15,758Later than 1 year and no later than 5 years 45,171Later than 5 years 19,942
80,871
19 Capital Transfers
The Inuvialuit have received $152,000 of financial compensation provided for in the IFA. The final payment wasreceived in 1997. During 2016, the Corporation distributed $2,423 (2015 – $2,547) to the Inuvialuit beneficiaries.These capital distributions were made in accordance with the Corporation’s distribution policy.
The Corporation’s objectives when managing capital are to maintain capital to sustain and grow the Corporation’soperations and provide a return of capital to the beneficiaries. Management develops the capital strategy andoversees the capital management processes. The Corporation has defined capital as capital transfers andretained earnings. There has been no change in capital management from the prior year.
20 Development Revenue
Included in development revenue are the following amounts:2016 2015
$ $
Air transportation 207,960 239,065Manufacturing 64,259 65,341Groceries 19,223 19,318Real estate 3,750 3,978Oil and gas - 3,589Management fees and other 1,260 478
296,452 331,769

FINFINFINFINFIN A NA NA NA NA NCIAL REPORCIAL REPORCIAL REPORCIAL REPORCIAL REPOR T 20T 20T 20T 20T 201111166666 35
Inuvialuit Regional CorporationNotes to Consolidated Financial StatementsDecember 31, 2016
(in thousands of Canadian dollars)
21 Expenses by Nature
Included in development and general and administrative expenses are the following:
2016 2015$ $
Operating expenses – income-producing real estate 2,451 2,681Operating lease payments 27,618 30,962Pension expense – defined benefit 26 125Pension expense – defined contribution 2,021 2,999Salaries and wages 93,694 97,125Foreign exchange loss (gain) 474 (2,291)
22 Finance Expense
Included in finance expense are the following:2016 2015
$ $
Interest on long-term debt 4,537 6,847Interest on bank indebtedness 2,554 3,244Interest on finance lease obligations 747 846Financing fees 482 112Other 178 372
8,498 11,421
23 Related Party Balances and Transactions
The amounts recognized in the consolidated statement of financial position are as follows:
Relationship 2016 2015$ $
Nappaq Construction Ltd. associate 696 (47)Pan Arctic Inuit Logistics Corporation associate 437 -Arctic Oil & Gas Services Ltd. associate 285 311Aklak Inc. associate 267 (43)Northern Aboriginal Services Corporation associate 150 81Other affiliates Common control 74 228
1,909 530
The amounts recognized in the consolidated statement of comprehensive income are as follows:
Relationship Transaction Recorded as 2016 2015$ $
Northern Aboriginal associate management operating Services Corporation services revenue 155 147Inukshuk Geomatics Inc. associate management operating
services revenue 36 71IEG Consultants Ltd. associate management operating
services revenue 17 15Aklak Inc. associate management operating
services revenue 188 -Aklak Inc. associate royalty fees operating
revenue 179 174Nappaq Construction Ltd. associate commissions operating
revenue 675 20

36 INUVIALINUVIALINUVIALINUVIALINUVIAL UIT REGIONUIT REGIONUIT REGIONUIT REGIONUIT REGION AL CAL CAL CAL CAL CORPORAORPORAORPORAORPORAORPORATIONTIONTIONTIONTION
Inuvialuit Regional CorporationNotes to Consolidated Financial StatementsDecember 31, 2016
(in thousands of Canadian dollars)
The amounts recognized in equity are as follows:
Relationship Transaction Recorded as 2016 2015$ $
Inuvialuit Trust shareholder capital
distribution capital stock (2,423) (2,547)
Payment terms on amounts due from (to) related parties are similar to those established in transactions with thirdparties.
Compensation awarded to directors and key management personnel for employee services included:
2016 2015$ $
Salaries and short-term employee benefits 2,240 2,320
24 Financial Instruments and Fair Values
Fair values
As explained in note 3, financial assets and liabilities have been classified into categories that determine theirbasis of measurement and, for items measured at fair value, whether changes in fair value are recognized in netincome or comprehensive income. Those categories are: fair value through profit or loss; loans and receivablesand, for liabilities, amortized cost. The following table shows the fair value and carrying values of assets andliabilities for each of these categories as at December 31, 2016 and 2015.
2016 2015
Fair Carrying Fair Carryingvalue amount value amount
$ $ $ $Assets
Loans and receivablesCash and cash equivalents 100,214 100,214 83,651 83,651Accounts receivable 51,033 51,033 57,880 57,880Due from related parties 1,909 1,909 530 530Loans and advances included in investments, loans and advances 713 713 1,181 1,181
Financial assets at fair value through profit or loss Marketable securities 426,950 426,950 412,845 412,845
LiabilitiesAmortized cost
Bank indebtedness 121,938 121,938 140,949 140,949Accounts payable and accrued liabilities 37,423 37,423 56,967 56,967Long-term debt 75,921 75,921 93,208 93,208Finance lease obligations 16,506 14,326 26,731 25,756Note payable 5,973 5,827 7,955 7,615Financial liabilities to Fixed Income Fund participants 32,027 32,027 30,101 30,101
Financial liabilities at fair value through profit or loss Financial liabilities to Balanced Fund participants 583 583 1,387 1,387
The fair values of cash and cash equivalents, accounts receivable, due from related parties, loans and advances,bank indebtedness and accounts payable and accrued liabilities approximate carrying value due to their short-termnature. The fair value of long-term debt and financial liabilities to Fixed Income Fund participants approximates

FINFINFINFINFIN A NA NA NA NA NCIAL REPORCIAL REPORCIAL REPORCIAL REPORCIAL REPOR T 20T 20T 20T 20T 201111166666 37
carrying value as market rates of interest do not differ significantly for instruments with similar terms to maturity.The methods and assumptions used in estimating the fair value of other financial assets and liabilities are asfollows:
• The fair value of marketable securities and financial liabilities to Balanced Fund participants is determined basedon the following:
• Fair values of financial assets and financial liabilities that are traded in active markets are based on quotedmarket prices or dealer price quotations. For all other financial instruments, the Corporation determines fairvalues using valuation techniques and places reliance on the investment managers and analysts.
• Investment managers use valuation techniques, which include net present value and discounted cash flowmodels, comparison to similar instruments for which market observable prices exist, Black-Scholes andpolynomial option pricing models and other valuation models. Assumptions and inputs used in valuationtechniques include risk free and benchmark interest rates, credit spreads and other premiums used inestimating discount rates, bond and equity prices, foreign currency exchange rates, equity and equity indexprices and expected price volatilities and correlations. The objective of valuation techniques is to arrive at afair value determination that reflects the price of the financial instrument at the reporting date that would havebeen determined by market participants acting at arm’s length.
• For more complex instruments, the Corporation’s investment managers use proprietary valuation models,which usually are developed from recognized valuation models by the Corporation’s advisers. Some or all ofthe significant inputs into these models may not be observable in the market, and are derived from marketprices or rates or are estimated based on assumptions. Examples of instruments involving significantunobservable inputs include certain over the counter derivatives and certain securities for which there is noactive market.
• The fair values of finance lease obligations and note payable are based on cash flows discounted using theCorporation’s market interest rate.
The Corporation measures fair values using the following fair value hierarchy in accordance with IFRS 7, FinancialInstruments – Disclosures, that reflects the significance of the inputs used in making the measurements:
• Level 1 – Quoted market price (unadjusted) in an active market for an identical instrument;
• Level 2 – Valuation techniques based on observable inputs, either directly (i.e., as prices) or indirectly (i.e.,derived from prices). This category includes instruments valued using: quoted market prices in active marketsfor similar instruments; quoted prices for identical or similar instruments in markets that are considered less thanactive; or other valuation techniques where all significant inputs are directly or indirectly observable from marketdata; and
• Level 3 – Valuation techniques using significant unobservable inputs. This category includes all instrumentswhere the valuation technique includes inputs not based on observable data and the unobservable inputs havea significant effect on the instrument’s valuation. This category includes instruments that are valued based onquoted prices for similar instruments where significant unobservable adjustments or assumptions are requiredto reflect differences between the instruments.
The fair value of finance lease obligations and note payable are within Level 3 of the fair value hierarchy.
Inuvialuit Regional CorporationNotes to Consolidated Financial StatementsDecember 31, 2016
(in thousands of Canadian dollars)
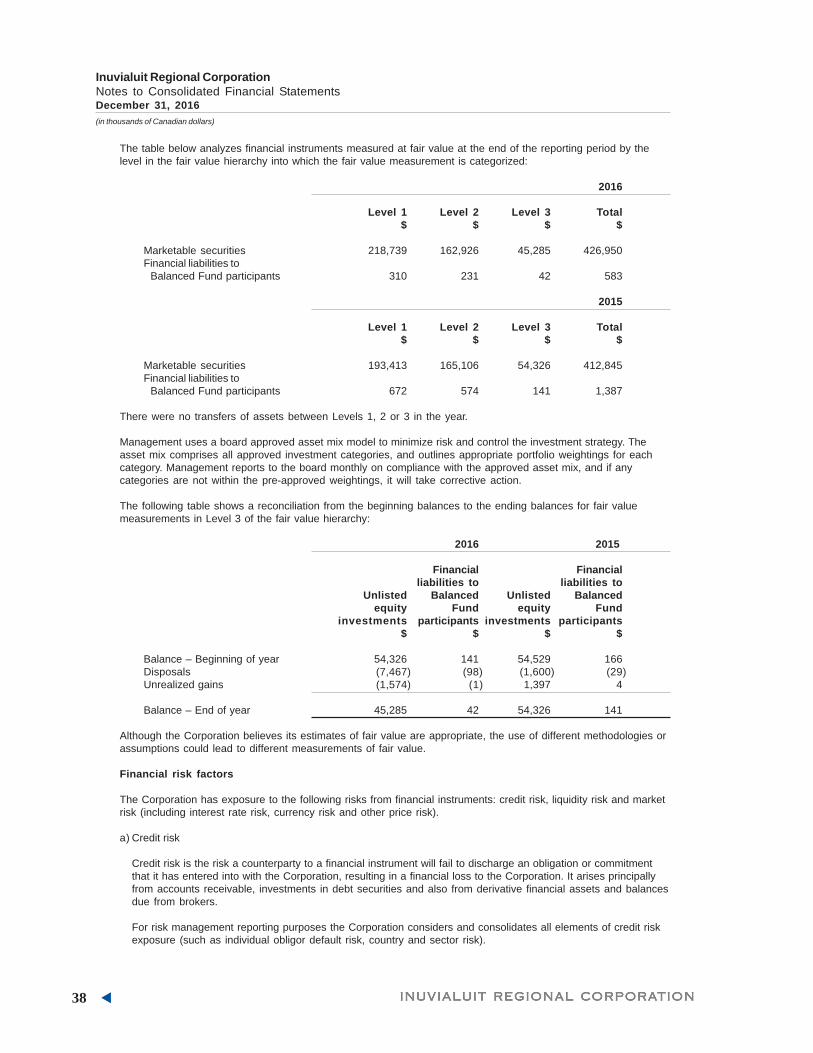
38 INUVIALINUVIALINUVIALINUVIALINUVIAL UIT REGIONUIT REGIONUIT REGIONUIT REGIONUIT REGION AL CAL CAL CAL CAL CORPORAORPORAORPORAORPORAORPORATIONTIONTIONTIONTION
The table below analyzes financial instruments measured at fair value at the end of the reporting period by thelevel in the fair value hierarchy into which the fair value measurement is categorized:
2016
Level 1 Level 2 Level 3 Total$ $ $ $
Marketable securities 218,739 162,926 45,285 426,950Financial liabilities to Balanced Fund participants 310 231 42 583
2015
Level 1 Level 2 Level 3 Total$ $ $ $
Marketable securities 193,413 165,106 54,326 412,845Financial liabilities to Balanced Fund participants 672 574 141 1,387
There were no transfers of assets between Levels 1, 2 or 3 in the year.
Management uses a board approved asset mix model to minimize risk and control the investment strategy. Theasset mix comprises all approved investment categories, and outlines appropriate portfolio weightings for eachcategory. Management reports to the board monthly on compliance with the approved asset mix, and if anycategories are not within the pre-approved weightings, it will take corrective action.
The following table shows a reconciliation from the beginning balances to the ending balances for fair valuemeasurements in Level 3 of the fair value hierarchy:
2016 2015
Financial Financialliabilities to liabilities to
Unlisted Balanced Unlisted Balancedequity Fund equity Fund
investments participants investments participants$ $ $ $
Balance – Beginning of year 54,326 141 54,529 166Disposals (7,467) (98) (1,600) (29)Unrealized gains (1,574) (1) 1,397 4
Balance – End of year 45,285 42 54,326 141
Although the Corporation believes its estimates of fair value are appropriate, the use of different methodologies orassumptions could lead to different measurements of fair value.
Financial risk factors
The Corporation has exposure to the following risks from financial instruments: credit risk, liquidity risk and marketrisk (including interest rate risk, currency risk and other price risk).
a) Credit risk
Credit risk is the risk a counterparty to a financial instrument will fail to discharge an obligation or commitmentthat it has entered into with the Corporation, resulting in a financial loss to the Corporation. It arises principallyfrom accounts receivable, investments in debt securities and also from derivative financial assets and balancesdue from brokers.
For risk management reporting purposes the Corporation considers and consolidates all elements of credit riskexposure (such as individual obligor default risk, country and sector risk).
Inuvialuit Regional CorporationNotes to Consolidated Financial StatementsDecember 31, 2016
(in thousands of Canadian dollars)

FINFINFINFINFIN A NA NA NA NA NCIAL REPORCIAL REPORCIAL REPORCIAL REPORCIAL REPOR T 20T 20T 20T 20T 201111166666 39
• Management of credit risk
The Corporation manages its accounts receivable credit risk by following a program of credit evaluation andby limiting the amount of customer credit. Impairment provisions are made for potential losses that may beincurred at the consolidated statement of financial position date.
For investments in debt securities, the Corporation’s policy over credit risk is to minimize its exposure tocounterparties with a perceived higher risk of default by dealing only with counterparties meeting the creditstandards set out in the Corporation’s Statement of Investment Policies and Goals. Included in this statementare policies that outline a maximum concentration for each investment of no more than 10% of the portfolio,and that the Corporation may own no more than 5% of the total outstanding equity of any one issuer. Thepolicies also include a description of the minimum level of acceptable ratings for fixed income instruments ascategorized by recognized rating agencies.
Credit risk is monitored on a daily basis by the investment managers in accordance with policies andprocedures in place. The Corporation’s credit risks are monitored on a monthly basis by management. Wherethe credit risks are not in accordance with the investment policy or guidelines of the Corporation,management is obliged to rebalance the portfolio.
• Exposure to credit risk
The Corporation’s maximum credit risk exposure at the consolidated statement of financial position date isrepresented by the respective carrying amounts of the financial assets in the consolidated statement offinancial position.
• Investment in debt securities
Credit risk arising on debt securities is mitigated by investing primarily in investment grade rated instruments.Management reviews debt securities monthly and rebalances the portfolio where necessary.
The Corporation may also invest in unrated debt securities whereby management assesses the credit risk ofthese securities using a methodology that is consistent with that used by the credit rating agency.
As at December 31, the Corporation was invested in debt securities with the following credit quality:
Rating 2016 2015$ $
AAA 37,006 34,436A A 40,645 39,905A 17,645 20,327BBB 4,532 4,082Other 6,297 8,308
106,125 107,058
• Balances due from brokers
Balances due from brokers result from margin accounts, cash collateral for borrowed securities and saletransactions awaiting settlement. Credit risk relating to unsettled transactions is considered small due to theshort settlement period involved and the high credit quality of the brokers used. The investment managersmonitor the financial position of the brokers regularly.
• Concentration of credit risk
The Corporation has no concentration of credit risk (2015 – two customers for 22%) in the accountsreceivable balance.
For investments in debt securities, the investment managers review credit concentration of debt securitiesheld based on counterparties and industries.
Inuvialuit Regional CorporationNotes to Consolidated Financial StatementsDecember 31, 2016
(in thousands of Canadian dollars)

40 INUVIALINUVIALINUVIALINUVIALINUVIAL UIT REGIONUIT REGIONUIT REGIONUIT REGIONUIT REGION AL CAL CAL CAL CAL CORPORAORPORAORPORAORPORAORPORATIONTIONTIONTIONTION
As at the reporting date, the Corporation’s debt securities exposures were concentrated in the followingindustries:
2016 2015% %
Governments 61 54Finance 10 12Mortgage-backed securities 3 3Other 26 31
There were no significant concentrations in this portfolio of credit risk to any individual issuer or group ofissuers as at December 31, 2016.
• Settlement risk
The Corporation’s activities may give rise to risk at the time of settlement of transactions. Settlement risk is therisk of loss due to the failure of an entity to honour its obligations to deliver cash, securities or other assetsas contractually agreed.
The aging analysis of accounts receivable is as follows:2016 2015
$ $
0 to 30 days 17,490 30,26631 to 60 days 11,710 4,81761 to 90 days 1,801 8,896Over 90 days 2,283 5,204
33,284 49,183Provision for impairment (440) (1,797)
Accounts receivable 32,844 47,386Other receivables 18,189 10,494
Accounts and other receivables 51,033 57,880
Accounts receivable with an indication of possible impairment primarily relate to customers that are in difficultfinancial situations. The Corporation has determined on a customer by customer basis that impairmentprovisions of $440 (2015 – $1,797) are sufficient to cover credit risk.
The movement in the Corporation’s provision for impairment of accounts receivable is as follows:
2016 2015$ $
Provision for impairment – Beginning of year 1,797 1,736Amounts written off (964) (571)Amounts allowed for 44 632Amounts received (437) -
Provision for impairment – End of year 440 1,797
For investments in debt securities, the Corporation mitigates this risk by conducting settlements through abroker to ensure a trade is settled only when both parties have fulfilled their contractual settlementobligations. Settlement limits form part of the credit approval and limit monitoring processes described earlier.As at the reporting date, the Corporation had no investments in debt securities that were past due.
b) Liquidity risk
Liquidity risk is the risk the Corporation will encounter difficulty in meeting obligations arising from its financialliabilities that are settled by delivering cash or another financial asset, or that such obligations will have to besettled in a manner disadvantageous to the Corporation.
Inuvialuit Regional CorporationNotes to Consolidated Financial StatementsDecember 31, 2016
(in thousands of Canadian dollars)

FINFINFINFINFIN A NA NA NA NA NCIAL REPORCIAL REPORCIAL REPORCIAL REPORCIAL REPOR T 20T 20T 20T 20T 201111166666 41
• Management of liquidity risk
The Corporation’s policy and the investment managers’ approach to managing liquidity is to have sufficientliquidity to meet its liabilities, as and when due, without incurring undue losses or risking damage to theCorporation’s reputation.
The Corporation’s financial assets include unlisted equity investments, which generally are illiquid. In addition,the Corporation holds investments in unlisted open ended investment funds, which are exposed to the risk ofside pockets or redemption restrictions being imposed. As a result, the Corporation may not be able toliquidate quickly some of its investments in these instruments in order to meet its liquidity requirements.
The Corporation’s listed securities are considered to be readily realizable as they are all listed on major stockexchanges.
The Corporation’s liquidity risk is managed on a monthly basis by management in accordance with policiesand procedures in place and approved in the Statement of Investment Policies and Goals.
The table below shows the undiscounted cash flows of the Corporation’s financial liabilities on the basis oftheir earliest possible contractual maturity. The gross amounts include interest payable where appropriate.The Corporation’s expected cash flows on these instruments do not vary significantly from this analysis.
2016
Carrying Less than One to Overamount one year three years three years
$ $ $ $
Bank indebtedness 121,938 121,938 - -Accounts payable and accrued liabilities 37,423 37,423 - -Long-term debt 75,921 75,921 - -Finance lease obligations 14,326 1,161 2,642 18,771Note payable 5,827 2,000 4,000 -Financial liabilities to Fixed Income Fund participants 32,027 32,027 - -Financial liabilities to Balanced Fund participants 583 - - 583Guarantees 350 350 - -Letters of credit 14,030 14,030 - -
2015
Carrying Less than One to Overamount one year three years three years
$ $ $ $
Bank indebtedness 140,949 140,949 - -Accounts payable and accrued liabilities 56,967 56,967 - -Long-term debt 93,208 17,753 85,050 1,800Finance lease obligations 25,756 4,027 11,970 20,092Note payable 7,615 2,000 6,000 -Financial liabilities to Fixed Income Fund participants 30,101 30,101 - -Financial liabilities to Balanced Fund participants 1,387 - - 1,387Guarantees 4,750 4,750 - -Letters of credit 14,550 14,550 - -
Inuvialuit Regional CorporationNotes to Consolidated Financial StatementsDecember 31, 2016
(in thousands of Canadian dollars)

42 INUVIALINUVIALINUVIALINUVIALINUVIAL UIT REGIONUIT REGIONUIT REGIONUIT REGIONUIT REGION AL CAL CAL CAL CAL CORPORAORPORAORPORAORPORAORPORATIONTIONTIONTIONTION
c) Market risk
Market risk is the risk changes in market prices, such as interest rates, equity prices, foreign exchange ratesand credit spreads (not relating to changes in the obligor’s/issuer’s credit standing) will affect the Corporation’sincome or the value of its holdings of financial instruments. The objective of market risk management is tomanage and control market risk exposures within acceptable parameters, while optimizing the return on risk.
• Management of market risk
The Corporation’s strategy for the management of market risk is driven by the Corporation’s investmentobjectives. The Corporation’s market risk is managed on a daily basis by the investment managers inaccordance with policies and procedures in place. The Corporation’s market positions are monitored on amonthly basis by management and the board of directors.
• Exposure to market risk
The market risk of the Corporation’s financial asset and liability positions is monitored by the investmentmanagers and is reported to management.
• Exposure to interest rate risk
The Corporation is exposed to the risk the fair value or future cash flows of its financial instruments willfluctuate as a result of changes in market interest rates. The Corporation is primarily exposed to interest raterisk on bank indebtedness, financial liabilities to Fixed Income Fund participants and long-term debt, all ofwhich have a component of interest that is variable. The Corporation estimates that a change of 100 basispoints in the interest rate as at December 31, 2016 would have increased or decreased net income, net oftax, for the year ended December 31, 2016 by $1,678 (2015 – $1,942).
• Exposure to currency risk
The Corporation invests in financial instruments and enters into transactions denominated in currencies otherthan its functional currency. Consequently, the Corporation is exposed to risks that the exchange rate of itscurrency relative to other foreign currencies may change in a manner that has an adverse effect on the fairvalue or future cash flows of that portion of the Corporation’s financial assets or liabilities denominated incurrencies other than the Canadian dollar.
The Corporation’s policy with respect to managing its currency risk is to limit its total foreign currencyexposure where possible, with guidance from the external managers and advisers. The Corporation’scurrency risk is managed on a daily basis by the investment managers in accordance with policies andprocedures in place. The Corporation’s currency positions and exposures are monitored on a monthly basisby management.
At the reporting date, the carrying values of the Corporation’s financial assets and liabilities held in individualforeign currencies as a percentage of its net assets were as follows:
2016 2015% %
US dollar 18.45 17.10
• Exposure to other price risk
Other price risk is the risk the fair value of the financial instrument will fluctuate as a result of changes inmarket prices (other than those arising from interest rate risk or currency risk), whether caused by factorsspecific to an individual investment, its issuer or factors affecting all instruments in the market.
The Corporation is primarily exposed to other price risk on its marketable securities. Price risk is managed bythe investment managers by diversifying the portfolio and economically hedging using derivative financialinstruments such as options or futures contracts.
The Corporation’s price risk is monitored on a monthly basis by management. Where the price risks are not inaccordance with the investment policy or guidelines of the Corporation, management is required to rebalancethe portfolio as quickly as possible. A 1% change in the fair value of the marketable securities would increaseor decrease net income, net of tax, by $3,117 (2015 – $3,055).
Inuvialuit Regional CorporationNotes to Consolidated Financial StatementsDecember 31, 2016
(in thousands of Canadian dollars)

FINFINFINFINFIN A NA NA NA NA NCIAL REPORCIAL REPORCIAL REPORCIAL REPORCIAL REPOR T 20T 20T 20T 20T 201111166666 43
25 Discontinued Operations
Disposal of Braden-Burry Expediting Ltd.
On August 31, 2016, the Corporation sold the net assets of Braden-Burry Expediting Ltd. (BBE), a subsidiary ofNorTerra, for proceeds of $6,019. The carrying amounts of assets and liabilities as at the date of sale were:
August 31, 2016$
Accounts receivable 4,643Other assets 126Property, plant and equipment 7,001
Total assets 11,770
Accounts payable 3,247
Total liabilities 3,247
Net assets 8,523
The loss on dispoal of BBE was determined as follows:August 31, 2016
$
Cash consideration 6,019Carrying amount of net assets sold 8,523
Loss on disposal (2,504)
Disposal of Northern Industrial Sales Ltd.
On September 19, 2016, the Corporation sold the net assets of Northern Industrial Sales Ltd. (NIS), a subsidiary ofNorTerra, for proceeds of $8,396. The carrying amounts of assets and liabilities as at the date of sale were:
September 19, 2016$
Accounts receivable 4,918Inventories 9,408Property, plant and equipment 1,040Other assets 221
Total assets 15,587
Accounts payable 4,995Finance lease obligations 96
Total liabilities 5,091
Net assets 10,496
The loss on disposal of NIS was determined as follows:September 19, 2016
$
Cash consideration 8,396Carrying amount of net assets sold 10,496
Loss on disposal (2,100)
Loss of control of Northern Transportation Company Limited
Inuvialuit Regional CorporationNotes to Consolidated Financial StatementsDecember 31, 2016
(in thousands of Canadian dollars)

44 INUVIALINUVIALINUVIALINUVIALINUVIAL UIT REGIONUIT REGIONUIT REGIONUIT REGIONUIT REGION AL CAL CAL CAL CAL CORPORAORPORAORPORAORPORAORPORATIONTIONTIONTIONTION
On December 30, 2016, Northern Transportation Company Limited (NTCL), a subsidiary of NorTerra, filed anassignment in bankruptcy under Section 49 of the Bankruptcy and Insolvency Act and a trustee was appointed bythe Office of the Superintendent of Bankruptcy. As a result of the bankruptcy filing, NorTerra lost voting powerover NTCL, its variable rights to returns and its ability to influence any returns from NTCL. This resulted in a loss ofcontrol of NTCL. From December 30, 2016, NTCL has been deconsolidated from the Corporation’s consolidatedfinancial statements.
On deconsolidation, the investment in NTCL was recorded at its fair value of $nil. NTCL is prospectively accountedfor at cost. Furthermore, circumstances indicated that as at December 30, 2016, certain amounts due from NTCLwould not be recoverable and accordingly the Corporation recorded a full impairment of amounts due from NTCL,less $9,589 that was recovered after year-end.
The carrying amount of assets and liabilities as at the date of deconsolidation were:
December 30, 2016$
Cash 13,540Accounts receivable 2,477Inventories 4,408Property, plant and equipment 2,039Other assets 340
Total assets 22,804
Accounts payable 3,387Long-term debt 5,035Pension obligations 9,515
Total liabilities 17,937
Net assets 4,867
The gain on deconsolidation of NTCL was determined as follows:
December 30, 2016$
Amounts recovered on intercompany loans 9,589Carrying amount of net assets 4,867
Gain on deconsolidation 4,722
Inuvialuit Regional CorporationNotes to Consolidated Financial StatementsDecember 31, 2016
(in thousands of Canadian dollars)

FINFINFINFINFIN A NA NA NA NA NCIAL REPORCIAL REPORCIAL REPORCIAL REPORCIAL REPOR T 20T 20T 20T 20T 201111166666 45
Results of discontinued operations
The operating results and loss on disposal relating to BBE and NIS and loss on deconsolidation of NTCL have beenincluded in loss from discontinued operations in the consolidated statement of comprehensive loss.
2016
BBE NIS NTCL Total$ $ $ $
Revenue 11,339 23,415 36,039 70,793Expenses 11,022 23,845 51,234 86,101
Income (loss) before income taxes 317 (430) (15,195) (15,308)Income tax (recovery) expense (458) 2,710 120 2,372
Income (loss) after income tax of discontinued operations 775 (3,140) (15,315) (17,680)(Loss) gain on disposal/deconsolidation after income taxes (2,504) (2,100) 4,722 118
Other comprehensive loss from discontinued operations (1,729) (5,240) (10,593) (17,562)
2015
BBE NIS NTCL Total$ $ $ $
Revenue 14,144 30,367 43,833 88,344Expenses 14,704 31,815 57,420 103,939
Loss before income taxes (560) (1,448) (13,587) (15,595)Income tax (recovery) expense (82) (153) 7,722 7,487
Loss from discontinued operations (478) (1,295) (21,309) (23,082)Actuarial gain on pension obligations - - 1,500 1,500
Other comprehensive loss from discontinued operations (478) (1,295) (19,809) (21,582)
Inuvialuit Regional CorporationNotes to Consolidated Financial StatementsDecember 31, 2016
(in thousands of Canadian dollars)

46 INUVIALINUVIALINUVIALINUVIALINUVIAL UIT REGIONUIT REGIONUIT REGIONUIT REGIONUIT REGION AL CAL CAL CAL CAL CORPORAORPORAORPORAORPORAORPORATIONTIONTIONTIONTION
Aklavik Community CorporationP.O. Box 119Aklavik, NT X0E 0A0
Tel: 867.978.2414Fax: 867.978.2815Email: [email protected]
Inuvik Community CorporationP.O. Box 1365Inuvik, NT X0E 0T0
Tel: 867.777.2603Fax: 867.777.4422E-mail: [email protected]
Paulatuk Community CorporationP.O. Box 92Paulatuk, NT X0E 1N0
Tel: 867.580.3601Fax: 867.580.3508Email: [email protected]
Sachs Harbour Community CorporationP.O. Box 59Sachs Harbour, NT X0E 0Z0
Tel: 867.690.3025Fax: 867.690.4905Email: [email protected]
Tuktoyaktuk Community CorporationP.O. Box 290Tuktoyaktuk, NT X0E 1C0
Tel: 867.977.2390Fax: 867.977.2504Email: [email protected]
Ulukhaktok Community CorporationP.O. Box 161Ulukhaktok, NT X0E 0S0
Tel: 867.396.4701Fax: 867.396.3284Email: [email protected]
Community Corporations
2017 IRC Board of Directors: Lawrence Ruben, Vernon Amos, Jordan McLeod, Gerald Inglangasuk,Colin Okheena, Eddie Dillon and Duane Smith.

FINFINFINFINFIN A NA NA NA NA NCIAL REPORCIAL REPORCIAL REPORCIAL REPORCIAL REPOR T 20T 20T 20T 20T 201111166666 47
Corporate Information
Inuvialuit Regional CorporationBag Service #21, Inuvik, NT X0E 0T0
Tel: 867.777.7000Toll-free: 1.855.777.7011Fax: 867.777.7001E-mail: [email protected]
2017 Board of Directors
Duane Smith Chair and CEOGerald Inglangasuk Vice-ChairEddie Dillon Secretary/TreasurerVernon Amos DirectorJordan McLeod DirectorJack Akhiatak/Colin Okheena DirectorLawrence Ruben Director
Inuvialuit Development CorporationBag Service #7, Inuvik, NT X0E 0T0Wayne Gordon, Chair (2016)Patrick Gruben, Chair (2017)
Tel: 867.777.7000Toll-free: 1.855.777.7011Fax: 867.777.3256E-mail: [email protected]
Inuvialuit Investment CorporationBag Service #21, Inuvik, NT X0E 0T0Floyd Roland, Chair
Tel: 867.777.7000Fax: 867.777.7001E-mail: [email protected]
Inuvialuit Petroleum CorporationBag Service #21, Inuvik, NT X0E 0T0
Tel: 867.777.7000Toll-free: 1.855.777.7011Fax: 867.777.7001E-mail: [email protected]
Subsidiary Corporations and Agencies
Inuvialuit Land Administration CommissionP.O. Box 290, Tuktoyaktuk, NT X0E 1C0Albert Elias, Chair (2016)
Tel: 867.977.7100Fax: 867.977.7101E-mail: [email protected]
Inuvialuit Land AdministrationP.O. Box 290, Tuktoyaktuk, NT X0E 1C0
Tel: 867.977.7100Fax: 867.977.7101E-mail: [email protected]
Community Development DivisionBag Service #21, Inuvik, NT X0E 0T0
Tel: 867.777.7000Fax: 867.777.7001E-mail: [email protected]
Inuvialuit Cultural Resource CentreBag Service #21, 292 Mackenzie RoadInuvik, NT X0E 0T0
Tel: 867.777.2595Fax: 867.777.2799E-mail: [email protected]
2016 Board of Directors
Duane Smith Chair and CEOVernon Amos Vice-ChairGerald Inglangasuk Secretary/TreasurerEddie Dillon DirectorJordan McLeod DirectorColin Okheena DirectorLawrence Ruben Director

Inuvialuit Regional Corporation
Bag Service #21Inuvik, NT Canada X0E 0T0