Embed Size (px)
Citation preview

Disclaimer/DisclosureAviva Life Insurance Company India Limited Aviva Towers ,Sector road,Opp.Golf Course, DLF Phase-V,Sector 43,Gurgoan,Haryana-122 003Tel:+91(0)1242709000-01, Fax: +91(0)124 2571 214 Registered office:2nd Floor,Prakashdeep Building, 7,Tolstoy Marg, New Delhi -110 001
Aviva Investor
IN ULIP PRODUCTS THE INVESTMENT RISK IN THE INVESTMENT PORTFOLIO SHALL BE BORNE BY THE POLICY HOLDER
THE LINKED INSURANCE PRODUCTS DO NOT OFFER ANY LIQUIDITY DURING THE FIRST FIVE YEARS OF THE CONTRACT. THE POLICYHOLDER WILLNOT BE ABLE TO SURRENDER/WITHDRAW THE MONIES INVESTED IN LINKED INSURANCE PRODUCTS COMPLETELY OR PARTIALLY TILL THE END OFTHE FIFTH YEAR.
October 2019

Equity Commentary:
No. Of Funds Managed
Fund Manager Debt Fund Balanced Fund
Jayesh Sundar NA 19
Nitin Garg 6 19
Equity Fund
10
NA
October 2019
MARKET REVIEW
Domestic markets
Indian equities markets remained positive in October 2019 with Nifty at +
4.6%. A global risk on rally was led by positive steps towards resolution of the
US-China trade tariff war and hope of orderly conclusion of Brexit. The Nifty
midcap & small cap Midcap also remained positive by +7% MoM and by
+4.2%. In this calendar year this the only month were all the sectoral indices
have turned positive and the key indices are Auto index was and PSU bank
index were up 13.2% & 13.5%
The fiscal deficit for first half of fiscal year is at INR 6.5t, 93% of Government
estimate for FY20. However, this year's revenue includes a one-time transfer
from RBI of INR1.5t excluding which the deficit would have looked much
bigger. This is caused by slowing GDP, sharp drop in tax receipts. The effect
from corporate income tax reduction done by the Government in late
September, would further affect the fiscal deficit in 2HFY20.
The core sector production is at a multi-year low. Seven out of eight
industries within the core sector reported a contraction for the month
compared to September 2018. The core sector accounts for 40.5% weight in
the index of industrial production (IIP).
Supply disruptions due to heavy rains led to sharp increase in food prices in
the month of September pulling headline CPI higher to 3.99% vs. 3.28% in
previous month. Despite the sharp increase in retail inflation print, headline
CPI for Q2 FY20 at 3.47% is nearly in line with RBI’s projection of 3.4%. Food
inflation in rural India for September was at a subdued 2.97% vs. 7.63% for
urban India. The continued divergence between the food inflation of rural
and urban India shows that the food price increase has not benefitted rural
India and has kept terms of trade weak. This in turn has prevented demand
conditions from recovering in rural India as the households have not
benefitted from the high prices
Core-core inflation (core inflation ex fuel and precious metals) eased to a
26-month low of 4.30% YoY vs. 4.42% YoY in the previous month, reinforcing
weak demand conditions and subdued pricing power . The divergence
between rural and urban CPI which began during mid-2018 has continued
to widen in recent months. Average urban CPI was 210 bps higher than rural
CPI during first seven months of 2019 compared to 10 bps during same
period in 2018.
September trade deficit narrowed to a 7-month low, at US$10.9bn v/s a
deficit of US$13.5bn in August, led by a sharp dip in oil imports on a M-o-M
basis. Meanwhile merchandise exports were marginally lower on a
sequential basis. In terms of Y-o-Y growth trend, export growth remained
weak, contracting by 6.6%YoY, reflecting global growth slowdown. The non-
oil non-gold imports continued to contract (on a YoY basis) for the eighth
consecutive month, underscoring the weakness in domestic demand
conditions. The sharp compression in trade deficit figures indicates downside
risk to current account deficit as % of GDP.
2019 is possibly the best monsoon year since 1994 and this is the first time
since 1997 when India has recorded above normal rains even in an El Nino
year.
On the back of discounts, expectations have been built of a revival in
demand with auto OEMs indicating that this Diwali passenger vehicle and
two-wheeler have seen strong sales.
Global Markets
The IMF is relatively down-beat in its latest forecasts: “Global growth is forecast
at 3.7% for 2018-19, 0.2 percentage points below the April WEO projection,
and is set to soften over the medium term.
In line with this the Federal Reserve cut interest rates for the third time this year
as the US economy continued slowing amid ongoing trade disputes and
weak global growth. The Federal Reserve lowered the target for its
benchmark rate by a quarter point to a range of 1.5% to 1.75%. The move
was the third cut in four months. The decision comes as US economic growth
slowed to an annual rate of 1.9% in the most recent quarter. There are
indications that there would not be any further rate cut in the next policy. The
US stock market’s three primary indices all ticked closer toward ending the
month at new all-time highs as investors cheered strong earnings and progress
on U.S.-China trade.
The global manufacturing sector deteriorated further in September, but
edged closer to stabilisation. The PMI is rising for the second month running to
49.7. Although still below the neutral mark of 50.0 that separates improvement
from deterioration, it was the highest reading since May..
Views
Both emerging markets as well as developed markets saw a sharp rally on the
hope of resolution to the US-China tariff wars and an orderly conclusion to
Brexit
India has been facing a slowdown admidst a liquidity crisis for NBFCs and
declining savings rate. The corporate tax rate cut announced by the
Government is likely to stimulate faltering consumption demand and
strengthen corporate earnings and lead to a revival in private sector demand
in the medium to long term. High frequency indicators already point towards
a pick up in demand. Inflation remaining below target opens up additional
space for the RBI to continue with its easing cycle. Further, the other reform
measures announced by the Government are also expected to contribute to
growth over the next few quarters
Over the medium to long term, there are sufficient catalysts for domestic
economy to gain momentum and potential for a healthy performance in the
equity markets:
1) With the reform measures and the corporate tax cuts, India’s growth rates
are expected to revive in the medium to long term.
2) Lower US interest rates can help to boost FPI debt flows into India which
can be taken as a positive. Debt inflows were around $ 1.2 bn in October so
far
3) Rural focus by Government has the potential for change in sentiments and
rising consumption by rural India
4) The fiscal stimulus combined with monetary easing is expected to revive
consumption demand, capex cycle recovery led by private sector is
expected to boost growth

Fixed Income Outlook:
No. Of Funds Managed
Fund Manager Debt Fund Balanced Fund
Jayesh Sundar NA 19
Nitin Garg 6 19
Equity Fund
10
NA
October 2019
MARKET REVIEW
Markets in the month of October traded in range with positive biasness. 10
Year benchmark government security ended the month at 6.66% versus 6.69%
last month. The Monetary Policy Committee (MPC) held on 4 Oct 2019 as
expected lowered rates by 25bp and maintained an accommodative
stance. Consequently, key policy rates stand as follows - Repo rate at 5.15%,
Reverse Repo at 4.90% and Marginal Standing Facility (MSF) at 5.40%. These
decisions were in consonance with the objective to achieve the medium
term target of 4% CPI inflation within a band of +/- 2%. The MPC further
lowered its GDP growth projection for FY20 to 6.1% (earlier 6.9%) with risks
evenly balanced. The inflation forecast indicated that CPI is expected to be
within target range with forecast largely unchanged (except a slight upward
revision to QE Sept). .
CPI inflation for the month of September came in higher than expectations at
3.99% vs. 3.28% last month, driven primarily by base even while sequential
momentum in both food and core inflation moderated. Food inflation rose to
4.7% from 2.96% with Vegetables spiking to 15.5% and Pulses to 8.4%. Besides
food prices most heads of inflation were well controlled. Fuel inflation eased
further to -2.2% from -1.7%, Housing inflation eased to 4.75% from 4.84%
while Misc inflation fell to 4.45% from 4.71%. Core inflation eased to 4.02% from
4.25% in the previous month. Moderation in core momentum was on
expected lines driven by slowing growth momentum in housing component,
clothing & footwear as well as the miscellaneous basket. Going forward, Food
prices will continue to remain firm for the next couple of months due to
seasonal factors, however core inflation is expected to moderate further
given the growing economic slack and widening output gap.
September WPI came way below market expectation at 0.33%, its lowest level
in 39 months. The deceleration can be attributed to the decline in prices of
primary articles, fuel & power and larger favourable base effect. On a
sequential basis, Primary Articles entered the negative territory, by posting a
price decrease of -0.63% in Sep-19, lowest level in 9 months. Fuel and Power
also decelerated by -0.50% in September. However, momentum in
heavy weight segment of WPI i.e. Manufactured Products observed a positive
yet mere price rise of 0.08% as compared to -0.25% in the month prior.
From trade perspective, exports saw another steep contraction of 6.6% YoY in
September 2019, which was despite a base of 2% YoY contraction in
September 2018, as a prolonged adverse global trading climate continues to
take its toll on Indian exports. Import contraction also continued in
September, with a substantial 13.8% YoY dip in inward shipments, as demand
at home remained anaemic. Due to the significant reduction in imports, the
trade deficit in September was curtailed to USD 10.9 bn versus USD 15.0 bn in
September 2018. Over April-September 2019, exports have shown a 2.4% YoY
contraction, while contraction for imports is a steeper 7.0% YoY. Total trade
deficit for H1 FY2020 now stands at USD 83.7 bn, far lower than USD 98.2 seen
in April-September 2018.
From global perspective, trade war continues to be an overhang for global
growth that has been moderating. This led to a flight to safety for the global
capital flows, thereby pushing the sovereign yields to lower levels. US GDP
growth continues to be muted led by decline in manufacturing. In Euro
region the economic case for a fiscal boost seems compelling as the global
growth slowdown and risk of recession take a toll as European economies are
tightly linked with the global trade. China reported 27yr low GDP growth at
6.2% for 2Q 2019 which may slow further in the coming quarters in the light of
trade uncertainties and diminishing policy effectiveness.
Outlook
Given the scenario of low economic growth along with the
inflation being under control, bond markets seem to be placed in
a favorable position. However, the credit environment seems to be
worsening by the day and we therefore continue to sell corporate
bonds and maintain a higher weightage of government securities
in our portfolios. Also, the global backdrop of trade war, global
monetary easing and softening commodity prices may further
lead to softening of local bond yields. We are maintaining neutral
to slightly overweight stance in our portfolios as we believe that the
trajectory for Indian bond yields is lower in the short run. However,
fears of worsening fiscal deficit along with subsequent growth and
inflation revival may limit the downside in bonds yield trajectory.

Fund Details Security Name Net Asset (%)
Goverment Securities 78.47%
8.17% GOI 2044 18.28%
7.72% GOI 2025 13.80%
7.32% GOI 2024 10.71%
NAV as on October 31,2019: 24.3343 9.15% GOI 2024 9.25%
Inception Date: 06-Feb-08 6.79% GOI 2029 9.02%
Fund Manager: Nitin Garg 7.17% GOI 2028 5.67%
8.28% GOI 2027 4.91%
Fund v/s Benchmark Return (%) 8.2% GOI 2025 2.44%
1 Month 6 Months 1 Year 2 Years*
3 Years*
Inception* 8.4% GOI 2024 1.90%
Portfolio return 1.01% -1.13% 2.56% 1.31% 3.03% 7.87% 8.26% GOI 2027 1.09%
Benchmark** 1.15% 7.65% 13.55% 7.48% 7.38% 7.49% Others 1.40%
Corporate Bonds 16.18%
Yes Bank Ltd. 5.27%
Targeted Asset Allocation (%) Indiabulls Housing Finance Ltd. 5.18%
Security Type Min Max Adani Ports and Special Economic Zone Ltd. 2.69%
Cash and Money Market Instruments 0.00% 40.00% Reliance Capital Ltd. 1.88%
Government and other Debt Securities 60.00% 100.00% Dewan Housing Finance Corporation Ltd. 0.63%
Indiabulls Housing Finance Ltd. 0.53%
Cash and Money Markets 5.35%
Portfolio Total 100.00%
Asset Class Wise AUM
Asset Class AUM (in Cr.)
Equity Nil
Debt 3.98
Total 3.98
Modified Duration#
Security Type Duration
Fixed Income Investments 5.71
Asset Mix
Sectoral Break-Up$
Rating Profile
* Compound Annual Growth Rate (CAGR)
$Sector Classification is as per National Industrial Classification ( All Economic Activities) -2008 NIC
**Benchmark for this fund is CRISIL Composite Bond Fund Index
#Duration of Fixed Income Investments is a measure of sensitivity of the assets price to interest rate movement. Shorter the duration lesser is the sensitivity due to movement in interest rates.
Investment Objective: The investment objective of the debt fund is to provide progressive
capital growth with relatively lower investment risks.
The risk profile for this fund is Low
October 2019
The actual asset allocation will remain within the 'minimum' and 'maximum' range based on
market opportunities and future outlook of the markets.
5.35%
2.69%
13.49%
78.47%
Others
Warehousing & support activit. for
transp.
Financial & insur. activit.
Soveriegn
78.47%
16.18%
5.35%
Goverment Securities Corporate Bonds Cash and Money Markets
Life Unit Linked
Bond FundULIF01306/02/2008LIFEDEBTFU122
5.42%
8.64% 2.63%
2.58%
80.73%
A+ AA+ AAA D SOVEREIGN

Fund Details Security Name Net Asset (%)
Equities 14.53%
HDFC Bank Ltd. 1.84%
Reliance Industries Ltd. 1.49%
Housing Development Finance Corporation Ltd. 1.03%
NAV as on October 31,2019: 30.3193 ICICI Bank Ltd. 0.96%
Inception Date: 27-Jan-04 Larsen & Toubro Ltd. 0.81%
Fund Manager: Jayesh Sundar, Nitin Garg Infosys Ltd. 0.80%
ITC Ltd. 0.66%
Fund v/s Benchmark Return (%) Tata Consultancy Services Ltd. 0.51%
1 Month 6 Months 1 Year 2 Years*
3 Years*
Inception* Kotak Mahindra Bank Ltd. 0.49%
Portfolio return 1.33% 3.28% 8.64% 4.30% 5.55% 7.91% Hindustan Unilever Ltd. 0.47%
Benchmark** 1.51% 6.74% 13.82% 7.56% 8.05% 7.62% Others 5.47%
Goverment Securities 55.58%
7.32% GOI 2024 11.00%
Targeted Asset Allocation (%) 7.72% GOI 2025 10.67%
Security Type Min Max 8.17% GOI 2044 10.29%
Cash and Money Market Instrument 0.00% 40.00% 7.17% GOI 2028 9.20%
Equity 0.00% 20.00% 6.79% GOI 2029 5.50%
Government and other Debt Securities 60.00% 100.00% 9.15% GOI 2024 3.84%
6.84% GOI 2022 2.01%
8.2% GOI 2025 1.95%
8.26% GOI 2027 0.73%
Asset Class Wise AUM 8.08% GOI 2022 0.38%
Asset Class AUM (in Cr.) Others 0.01%
Equity 20.85 Corporate Bonds 27.16%
Debt 122.58 Yes Bank Ltd. 9.14%
Total 143.43 Adani Ports and Special Economic Zone Ltd. 4.78%
Indiabulls Housing Finance Ltd. 4.74%
Modified Duration#
LIC Housing Finance Ltd. 3.72%
Security Type Duration Mahindra & Mahindra Ltd. 3.60%
Fixed Income Investments 5.45 Dewan Housing Finance Corporation Ltd. 0.47%
Indiabulls Housing Finance Ltd. 0.43%
Shriram Transport Finance Co. Ltd. 0.28%
Cash and Money Markets 2.73%
Portfolio Total 100.00%
Asset Mix
Sectoral Break-Up$
Rating Profile
* Compound Annual Growth Rate (CAGR)
$Sector Classification is as per National Industrial Classification ( All Economic Activities) -2008 NIC
**Benchmark return has been computed by applying benchmark weightages on CRISIL Composite Bond Fund Index and NIFTY 50 INDEX
#Duration of Fixed Income Investments is a measure of sensitivity of the assets price to interest rate movement. Shorter the duration lesser is the sensitivity due to movement in interest rates.
Investment Objective: The investment objective of the fund is to provide progressive returns
on your investment and carry capital guarantee as defined in the policy terms &
conditions.
The risk profile for this fund is Low
October 2019
The actual asset allocation will remain within the 'minimum' and 'maximum' range based on
market opportunities and future outlook of the markets.
5.06%
0.45%
0.66%
0.70%
0.81%
1.64%
1.70%
4.15%
4.82%
24.43%
55.58%
Others
Electricity, gas, steam and air
conditioning supply
Manf. of tobacco prod.
Manf. of chemic.s & chemic. prod.
Civil engineering
Manf. of coke & refined petrol. prod.
Compt prgm, consult. & related
activit.
Manf. of motor vehic ,trailr & semi-
trailr
Warehousing & support activit. for
transp.
Financial & insur. activit.
Soveriegn14.53%
55.58%
27.16%
2.73%
Equities Goverment Securities Corporate Bonds Cash and Money Markets
Life Unit Linked
Secure FundULIF00627/01/2004LIFESECURE122
11.01%
12.34%
9.14%
0.57%
66.95%
A+ AA+ AAA D SOVEREIGN

Fund Details Security Name Net Asset (%)
Equities 14.85%
HDFC Bank Ltd. 1.86%
Reliance Industries Ltd. 1.52%
Housing Development Finance Corporation Ltd. 1.05%
NAV as on October 31,2019: 25.6335 ICICI Bank Ltd. 0.99%
Inception Date: 11-Jul-06 Larsen & Toubro Ltd. 0.83%
Fund Manager: Jayesh Sundar, Nitin Garg Infosys Ltd. 0.81%
ITC Ltd. 0.68%
Fund v/s Benchmark Return (%) Tata Consultancy Services Ltd. 0.53%
1 Month 6 Months 1 Year 2 Years*
3 Years*
Inception* Kotak Mahindra Bank Ltd. 0.50%
Portfolio return 1.33% 0.28% 5.22% 2.64% 4.49% 7.33% Hindustan Unilever Ltd. 0.48%
Benchmark** 1.51% 6.74% 13.82% 7.56% 8.05% 8.23% Others 5.60%
Goverment Securities 56.72%
8.17% GOI 2044 10.37%
Targeted Asset Allocation (%) 7.72% GOI 2025 10.35%
Security Type Min Max 7.32% GOI 2024 8.58%
Cash and Money Market Instruments 0.00% 40.00% 9.15% GOI 2024 7.77%
Equity 0.00% 20.00% 7.17% GOI 2028 7.54%
Government and other Debt Securities 60.00% 100.00% 6.79% GOI 2029 5.56%
9.2% GOI 2030 2.67%
8.2% GOI 2025 1.46%
6.84% GOI 2022 0.93%
Asset Class Wise AUM 8.26% GOI 2027 0.74%
Asset Class AUM (in Cr.) Others 0.75%
Equity 3.95 Corporate Bonds 25.40%
Debt 22.60 Yes Bank Ltd. 7.90%
Total 26.55 Indiabulls Housing Finance Ltd. 5.05%
Adani Ports and Special Economic Zone Ltd. 4.85%
Modified Duration#
Mahindra & Mahindra Ltd. 3.24%
Security Type Duration LIC Housing Finance Ltd. 1.59%
Fixed Income Investments 5.54 Indian Railway Finance Corporation Ltd. 0.79%
Dewan Housing Finance Corporation Ltd. 0.75%
Reliance Capital Ltd. 0.75%
Indiabulls Housing Finance Ltd. 0.48%
Cash and Money Markets 3.03%
Portfolio Total 100.00%
Asset Mix
Sectoral Break-Up$
Rating Profile
* Compound Annual Growth Rate (CAGR)
$Sector Classification is as per National Industrial Classification ( All Economic Activities) -2008 NIC
**Benchmark return has been computed by applying benchmark weightages on CRISIL Composite Bond Fund Index and NIFTY 50 INDEX
#Duration of Fixed Income Investments is a measure of sensitivity of the assets price to interest rate movement. Shorter the duration lesser is the sensitivity due to movement in interest rates.
Investment Objective: Progressive return on your investment by investing majority portion in
debt securities, with a minimum exposure to equities.
The risk profile for this fund is Low
October 2019
The actual asset allocation will remain within the 'minimum' and 'maximum' range based on
market opportunities and future outlook of the markets.
5.42%
0.46%
0.68%
0.71%
0.83%
1.67%
1.75%
3.80%
4.89%
23.07%
56.72%
Others
Electricity, gas, steam and air
conditioning supply
Manf. of tobacco prod.
Manf. of chemic.s & chemic. prod.
Civil engineering
Manf. of coke & refined petrol. prod.
Compt prgm, consult. & related
activit.
Manf. of motor vehic ,trailr & semi-
trailr
Warehousing & support activit. for
transp.
Financial & insur. activit.
Soveriegn14.85%
56.72%
25.40%
3.03%
Equities Goverment Securities Corporate Bonds Cash and Money Markets
Life Unit Linked
Protector FundULIF00911/07/2006LIFPROTECT122
9.56%
12.55%
7.46%
1.82%
68.61%
A+ AA+ AAA D SOVEREIGN

Fund Details Security Name Net Asset (%)
Equities 34.22%
HDFC Bank Ltd. 4.35%
Reliance Industries Ltd. 3.50%
Housing Development Finance Corporation Ltd. 2.41%
NAV as on October 31,2019: 70.5996 ICICI Bank Ltd. 2.27%
Inception Date: 06-Jun-02 Larsen & Toubro Ltd. 1.90%
Fund Manager: Jayesh Sundar, Nitin Garg Infosys Ltd. 1.87%
ITC Ltd. 1.55%
Fund v/s Benchmark Return (%) Tata Consultancy Services Ltd. 1.21%
1 Month 6 Months 1 Year 2 Years*
3 Years*
Inception* Kotak Mahindra Bank Ltd. 1.14%
Portfolio return 1.64% 1.57% 7.88% 3.71% 5.97% 12.37% Hindustan Unilever Ltd. 1.11%
Benchmark** 1.99% 5.48% 14.10% 7.60% 8.89% 10.54% Others 12.91%
Goverment Securities 47.06%
7.72% GOI 2025 11.37%
Targeted Asset Allocation (%) 7.17% GOI 2028 7.29%
Security Type Min Max 7.32% GOI 2024 7.17%
Cash and Money Market Instruments 0.00% 40.00% 8.17% GOI 2044 5.62%
Equity 0.00% 45.00% 9.15% GOI 2024 3.42%
Government and other Debt Securities 50.00% 90.00% 6.79% GOI 2029 3.21%
8.2% GOI 2025 2.64%
6.84% GOI 2022 2.11%
8.4% GOI 2024 1.19%
Asset Class Wise AUM 8.28% GOI 2032 1.16%
Asset Class AUM (in Cr.) Others 1.88%
Equity 107.29 Corporate Bonds 15.49%
Debt 206.15 Mahindra & Mahindra Ltd. 3.57%
Total 313.44 Indiabulls Housing Finance Ltd. 3.29%
Adani Ports and Special Economic Zone Ltd. 1.88%
Modified Duration#
LIC Housing Finance Ltd. 1.70%
Security Type Duration Yes Bank Ltd. 1.67%
Fixed Income Investments 5.37 Shriram Transport Finance Co. Ltd. 1.32%
Reliance Capital Ltd. 0.80%
Rural Electrification Corporation 0.68%
Indiabulls Housing Finance Ltd. 0.30%
LIC Housing Finance Ltd. 0.14%
Others 0.14%
Cash and Money Markets 3.23%
Asset Mix Portfolio Total 100.00%
Sectoral Break-Up$
Rating Profile
* Compound Annual Growth Rate (CAGR)
$Sector Classification is as per National Industrial Classification ( All Economic Activities) -2008 NIC
**Benchmark return has been computed by applying benchmark weightages on CRISIL Composite Bond Fund Index and NIFTY 50 INDEX
#Duration of Fixed Income Investments is a measure of sensitivity of the assets price to interest rate movement. Shorter the duration lesser is the sensitivity due to movement in interest rates.
Investment Objective: The fund is designed to provide long-term cumulative capital growth
while controlling risk, by availing opportunities in debt and equity markets.
The risk profile for this fund is Medium
October 2019
The actual asset allocation will remain within the 'minimum' and 'maximum' range based on
market opportunities and future outlook of the markets.
8.75%
1.09%
1.55%
1.64%
1.90%
1.98%
3.84%
4.02%
4.87%
23.30%
47.06%
Others
Electricity, gas, steam and air
conditioning supply
Manf. of tobacco prod.
Manf. of chemic.s & chemic. prod.
Civil engineering
Warehousing & support activit. for
transp.
Manf. of coke & refined petrol. prod.
Compt prgm, consult. & related
activit.
Manf. of motor vehic ,trailr & semi-
trailr
Financial & insur. activit.
Soveriegn34.22%
47.06%
15.49%
3.23%
Equities Goverment Securities Corporate Bonds Cash and Money Markets
Life Unit Linked
Balanced FundULIF00106/06/2002LIFBALANCE122
2.61%
10.58%
12.15%
1.42%
73.25%
A+ AA+ AAA D SOVEREIGN
Fund Details Security Name Net Asset (%)
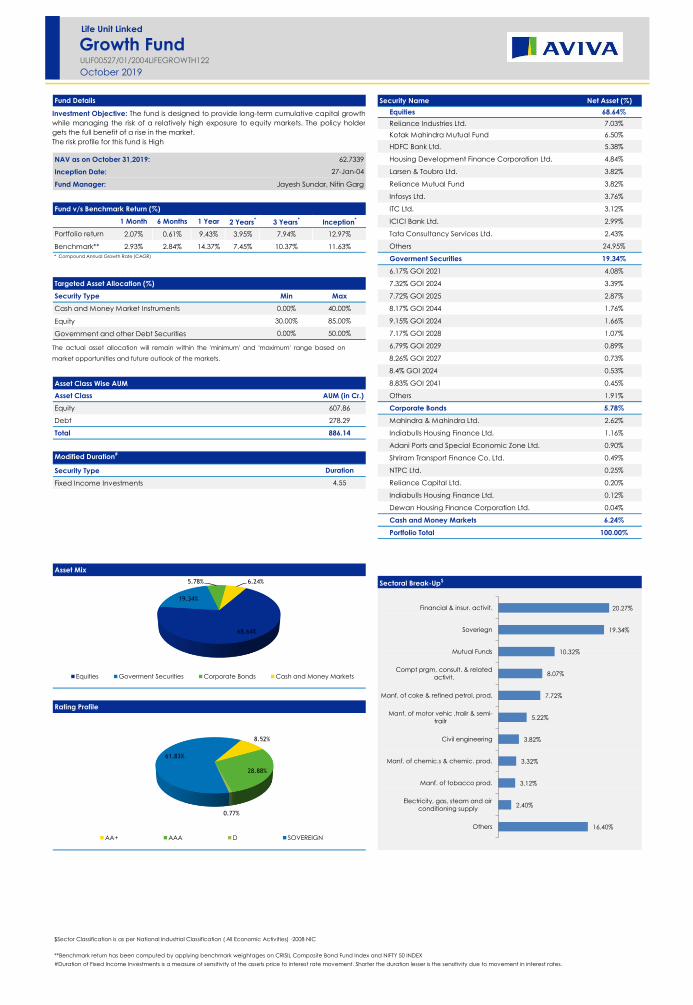
Equities 68.64%
Reliance Industries Ltd. 7.03%
Kotak Mahindra Mutual Fund 6.50%
HDFC Bank Ltd. 5.38%
NAV as on October 31,2019: 62.7339 Housing Development Finance Corporation Ltd. 4.84%
Inception Date: 27-Jan-04 Larsen & Toubro Ltd. 3.82%
Fund Manager: Jayesh Sundar, Nitin Garg Reliance Mutual Fund 3.82%
Infosys Ltd. 3.76%
Fund v/s Benchmark Return (%) ITC Ltd. 3.12%
1 Month 6 Months 1 Year 2 Years*
3 Years*
Inception* ICICI Bank Ltd. 2.99%
Portfolio return 2.07% 0.61% 9.43% 3.95% 7.94% 12.97% Tata Consultancy Services Ltd. 2.43%
Benchmark** 2.93% 2.84% 14.37% 7.45% 10.37% 11.63% Others 24.95%
Goverment Securities 19.34%
6.17% GOI 2021 4.08%
Targeted Asset Allocation (%) 7.32% GOI 2024 3.39%
Security Type Min Max 7.72% GOI 2025 2.87%
Cash and Money Market Instruments 0.00% 40.00% 8.17% GOI 2044 1.76%
Equity 30.00% 85.00% 9.15% GOI 2024 1.66%
Government and other Debt Securities 0.00% 50.00% 7.17% GOI 2028 1.07%
6.79% GOI 2029 0.89%
8.26% GOI 2027 0.73%
8.4% GOI 2024 0.53%
Asset Class Wise AUM 8.83% GOI 2041 0.45%
Asset Class AUM (in Cr.) Others 1.91%
Equity 607.86 Corporate Bonds 5.78%
Debt 278.29 Mahindra & Mahindra Ltd. 2.62%
Total 886.14 Indiabulls Housing Finance Ltd. 1.16%
Adani Ports and Special Economic Zone Ltd. 0.90%
Modified Duration#
Shriram Transport Finance Co. Ltd. 0.49%
Security Type Duration NTPC Ltd. 0.25%
Fixed Income Investments 4.55 Reliance Capital Ltd. 0.20%
Indiabulls Housing Finance Ltd. 0.12%
Dewan Housing Finance Corporation Ltd. 0.04%
Cash and Money Markets 6.24%
Portfolio Total 100.00%
Asset Mix
Sectoral Break-Up$
Rating Profile
* Compound Annual Growth Rate (CAGR)
$Sector Classification is as per National Industrial Classification ( All Economic Activities) -2008 NIC
**Benchmark return has been computed by applying benchmark weightages on CRISIL Composite Bond Fund Index and NIFTY 50 INDEX
#Duration of Fixed Income Investments is a measure of sensitivity of the assets price to interest rate movement. Shorter the duration lesser is the sensitivity due to movement in interest rates.
Investment Objective: The fund is designed to provide long-term cumulative capital growth
while managing the risk of a relatively high exposure to equity markets. The policy holder
gets the full benefit of a rise in the market.
The risk profile for this fund is High
October 2019
The actual asset allocation will remain within the 'minimum' and 'maximum' range based on
market opportunities and future outlook of the markets.
16.40%
2.40%
3.12%
3.32%
3.82%
5.22%
7.72%
8.07%
10.32%
19.34%
20.27%
Others
Electricity, gas, steam and air
conditioning supply
Manf. of tobacco prod.
Manf. of chemic.s & chemic. prod.
Civil engineering
Manf. of motor vehic ,trailr & semi-
trailr
Manf. of coke & refined petrol. prod.
Compt prgm, consult. & related
activit.
Mutual Funds
Soveriegn
Financial & insur. activit.
68.64%
19.34%
5.78% 6.24%
Equities Goverment Securities Corporate Bonds Cash and Money Markets
Life Unit Linked
Growth FundULIF00527/01/2004LIFEGROWTH122
8.52%
28.88%
0.77%
61.83%
AA+ AAA D SOVEREIGN

Fund Details Security Name Net Asset (%)
Equities 94.72%
Kotak Mahindra Mutual Fund 10.37%
Reliance Industries Ltd. 9.82%
HDFC Bank Ltd. 8.46%
NAV as on October 31,2019: 27.0397 Infosys Ltd. 5.52%
Inception Date: 30-Jan-08 Larsen & Toubro Ltd. 5.16%
Fund Manager: Jayesh Sundar Housing Development Finance Corporation Ltd. 4.94%
ICICI Bank Ltd. 4.65%
Fund v/s Benchmark Return (%) ITC Ltd. 4.64%
1 Month 6 Months 1 Year 2 Years*
3 Years*
Inception* Tata Consultancy Services Ltd. 3.55%
Portfolio return 2.51% -0.68% 10.10% 4.14% 9.05% 8.87% Hindustan Unilever Ltd. 3.29%
Benchmark** 3.51% 1.10% 14.35% 7.20% 11.17% 7.33% Others 34.32%
Cash and Money Markets 5.28%
Portfolio Total 100.00%
Targeted Asset Allocation (%)
Security Type Min Max
Debt and Money Market Instruments 0.00% 40.00%
Equity 60.00% 100.00%
Asset Class Wise AUM
Asset Class AUM (in Cr.)
Equity 55.57
Debt 3.09
Total 58.66
Modified Duration#
Security Type Duration
Fixed Income Investments N.A.
Asset Mix
Sectoral Break-Up$
* Compound Annual Growth Rate (CAGR)
$Sector Classification is as per National Industrial Classification ( All Economic Activities) -2008 NIC
**Benchmark for this fund is NIFTY 50 INDEX
#Duration of Fixed Income Investments is a measure of sensitivity of the assets price to interest rate movement. Shorter the duration lesser is the sensitivity due to movement in interest rates.
Investment Objective: The fund is designed to provide long-term cumulative capital growth
while managing the risk of exposure to equity markets. The policy holder gets the full benefit
of a rise in the market.
The risk profile for this fund is High
October 2019
The actual asset allocation will remain within the 'minimum' and 'maximum' range based on
market opportunities and future outlook of the markets.
16.06%
2.80%
3.16%
3.82%
4.64%
4.85%
5.16%
10.83%
11.86%
12.78%
24.04%
Others
Manf. of other transport equipment
Electricity, gas, steam and air
conditioning supply
Manf. of motor vehic ,trailr & semi-
trailr
Manf. of tobacco prod.
Manf. of chemic.s & chemic. prod.
Civil engineering
Manf. of coke & refined petrol. prod.
Compt prgm, consult. & related
activit.
Mutual Funds
Financial & insur. activit.
94.72%
5.28%
Equities Cash and Money Markets
Life Unit Linked
Enhancer FundULIF01230/01/2008LIENHANCER122

Fund Details Security Name Net Asset (%)
Equities 94.94%
Kotak Mahindra Mutual Fund 10.80%
Reliance Industries Ltd. 9.68%
HDFC Bank Ltd. 7.78%
NAV as on October 31,2019: 19.9281 Infosys Ltd. 5.51%
Inception Date: 02-Jan-08 Larsen & Toubro Ltd. 5.10%
Fund Manager: Jayesh Sundar Housing Development Finance Corporation Ltd. 5.06%
ITC Ltd. 4.58%
Fund v/s Benchmark Return (%) ICICI Bank Ltd. 4.45%
1 Month 6 Months 1 Year 2 Years*
3 Years*
Inception* Tata Consultancy Services Ltd. 3.49%
Portfolio return 2.69% 1.02% 13.27% 6.74% 10.95% 6.02% Hindustan Unilever Ltd. 3.24%
Benchmark** 3.51% 1.10% 14.35% 7.20% 11.17% 5.68% Others 35.25%
Cash and Money Markets 5.06%
Portfolio Total 100.00%
Targeted Asset Allocation (%)
Security Type Min Max
Debt Securities Incl. Money Market Instruments 0.00% 20.00%
Equity 80.00% 100.00%
Asset Class Wise AUM
Asset Class AUM (in Cr.)
Equity 55.47
Debt 2.95
Total 58.42
Modified Duration#
Security Type Duration
Fixed Income Investments N.A.
Asset Mix
Sectoral Break-Up$
* Compound Annual Growth Rate (CAGR)
$Sector Classification is as per National Industrial Classification ( All Economic Activities) -2008 NIC
**Benchmark for this fund is NIFTY 50 INDEX
#Duration of Fixed Income Investments is a measure of sensitivity of the assets price to interest rate movement. Shorter the duration lesser is the sensitivity due to movement in interest rates.
Investment Objective: The investment objective of this fund is to generate returns in line with
the stock market index - NIFTY 50.Subject to exposure norms applicable under the IRDA of
India (Investment) regulations.
The risk profile for this fund is High
October 2019
The actual asset allocation will remain within the 'minimum' and 'maximum' range based on
market opportunities and future outlook of the markets.
16.23%
3.01%
3.12%
3.78%
4.58%
5.01%
5.10%
10.76%
11.97%
13.10%
23.34%
Others
Manf. of other transport equipment
Electricity, gas, steam and air
conditioning supply
Manf. of motor vehic ,trailr & semi-
trailr
Manf. of tobacco prod.
Manf. of chemic.s & chemic. prod.
Civil engineering
Manf. of coke & refined petrol. prod.
Compt prgm, consult. & related
activit.
Mutual Funds
Financial & insur. activit.
94.94%
5.06%
Equities Cash and Money Markets
Life Unit Linked
Index FundULIF01002/01/2008LIFEINDEXF122

Fund Details Security Name Net Asset (%)
Equities 93.32%
State Bank of India 9.45%
NTPC Ltd. 8.36%
Oil & Natural Gas Corpn Ltd. 7.76%
NAV as on October 31,2019: 13.1136 Bharat Petroleum Corporation Ltd. 7.04%
Inception Date: 08-Jan-10 Oil India Ltd. 6.48%
Fund Manager: Jayesh Sundar Gail (India) Ltd. 5.99%
Gujarat State Petronet Ltd. 5.42%
Fund v/s Benchmark Return (%) Rural Electrification Corporation 5.33%
1 Month 6 Months 1 Year 2 Years*
3 Years*
Inception* Container Corporation Of India Ltd. 4.35%
Portfolio return 6.93% -3.25% 4.15% -9.90% 0.41% 2.80% Canara Bank Ltd. 4.16%
Benchmark** 7.98% -3.43% 1.56% -12.54% -3.13% -3.03% Others 28.98%
Cash and Money Markets 6.68%
Portfolio Total 100.00%
Targeted Asset Allocation (%)
Security Type Min Max
Money Market & Other Cash Instruments 0.00% 40.00%
Equity 60.00% 100.00%
Debt 0.00% 40.00%
Asset Class Wise AUM
Asset Class AUM (in Cr.)
Equity 87.01
Debt 6.23
Total 93.24
Modified Duration#
Security Type Duration
Fixed Income Investments N.A.
Asset Mix
Sectoral Break-Up$
* Compound Annual Growth Rate (CAGR)
$Sector Classification is as per National Industrial Classification ( All Economic Activities) -2008 NIC
**Benchmark for this fund is BSE PSU Index
#Duration of Fixed Income Investments is a measure of sensitivity of the assets price to interest rate movement. Shorter the duration lesser is the sensitivity due to movement in interest rates.
Investment Objective: To generate steady returns through investment in PSU and related
equities.
The risk profile for this fund is High
October 2019
The actual asset allocation will remain within the 'minimum' and 'maximum' range based on
market opportunities and future outlook of the markets.
9.17%
1.46%
2.55%
3.04%
3.82%
4.35%
5.42%
12.79%
14.24%
19.99%
23.17%
Others
Mining of metal ores
Manf. of basic metals
Manuf of compu, electronic and
optcl prodt
Mining of coal & lignite
Warehousing & support activit. for
transp.
Land Transport & Transport Via
Pipelines
Manf. of coke & refined petrol. prod.
Extrac. of crude petrol. & natural gas
Electricity, gas, steam and air
conditioning supply
Financial & insur. activit.
93.32%
6.68%
Equities Cash and Money Markets
Life Unit Linked
PSU FundULIF02208/01/2010LIFEPSUFND122

Fund Details Security Name Net Asset (%)
Equities 88.71%
Bharti Airtel Ltd. 9.35%
Larsen & Toubro Ltd. 9.35%
NTPC Ltd. 8.90%
NAV as on October 31,2019: 11.0630 Adani Ports and Special Economic Zone Ltd. 7.83%
Inception Date: 08-Jan-10 Power Grid Corporation of India Ltd. 7.64%
Fund Manager: Jayesh Sundar Tata Power Co. Ltd. 6.84%
Container Corporation Of India Ltd. 4.91%
Fund v/s Benchmark Return (%) Transport Corporation of India 3.79%
1 Month 6 Months 1 Year 2 Years*
3 Years*
Inception* Ahluwalia Contracts Ltd. 3.67%
Portfolio return -0.82% -2.72% 4.67% -10.42% 0.65% 1.03% HDFC Bank Ltd. 3.49%
Benchmark** 3.56% 6.92% 11.87% -3.69% 4.99% -1.01% Others 22.94%
Cash and Money Markets 11.29%
Portfolio Total 100.00%
Targeted Asset Allocation (%)
Security Type Min Max
Money Market & Other Cash Instruments 0.00% 40.00%
Equity 60.00% 100.00%
Debt 0.00% 40.00%
Asset Class Wise AUM
Asset Class AUM (in Cr.)
Equity 25.54
Debt 3.26
Total 28.79
Modified Duration#
Security Type Duration
Fixed Income Investments N.A.
Asset Mix
Sectoral Break-Up$
* Compound Annual Growth Rate (CAGR)
$Sector Classification is as per National Industrial Classification ( All Economic Activities) -2008 NIC
**Benchmark for this fund is Nifty Infrastructure
#Duration of Fixed Income Investments is a measure of sensitivity of the assets price to interest rate movement. Shorter the duration lesser is the sensitivity due to movement in interest rates.
Investment Objective: To generate steady returns through investment in infrastructure and
related equities
The risk profile for this fund is High
October 2019
The actual asset allocation will remain within the 'minimum' and 'maximum' range based on
market opportunities and future outlook of the markets.
16.43%
2.78%
3.15%
3.67%
3.79%
3.83%
4.96%
9.35%
13.72%
14.94%
23.38%
Others
Manuf of fbricted metl prdut, except
mchn, equp
Manuf of compu, electronic and
optcl prodt
Construction of buildings
Postal and Courier Activities
Manf. of other non-metallic mineral
prod.
Financial & insur. activit.
Telecommunications
Civil engineering
Warehousing & support activit. for
transp.
Electricity, gas, steam and air
conditioning supply
88.71%
11.29%
Equities Cash and Money Markets
Life Unit Linked
Infrastructure FundULIF01908/01/2010LIFEINFRAF122
Fund Details Security Name Net Asset (%)
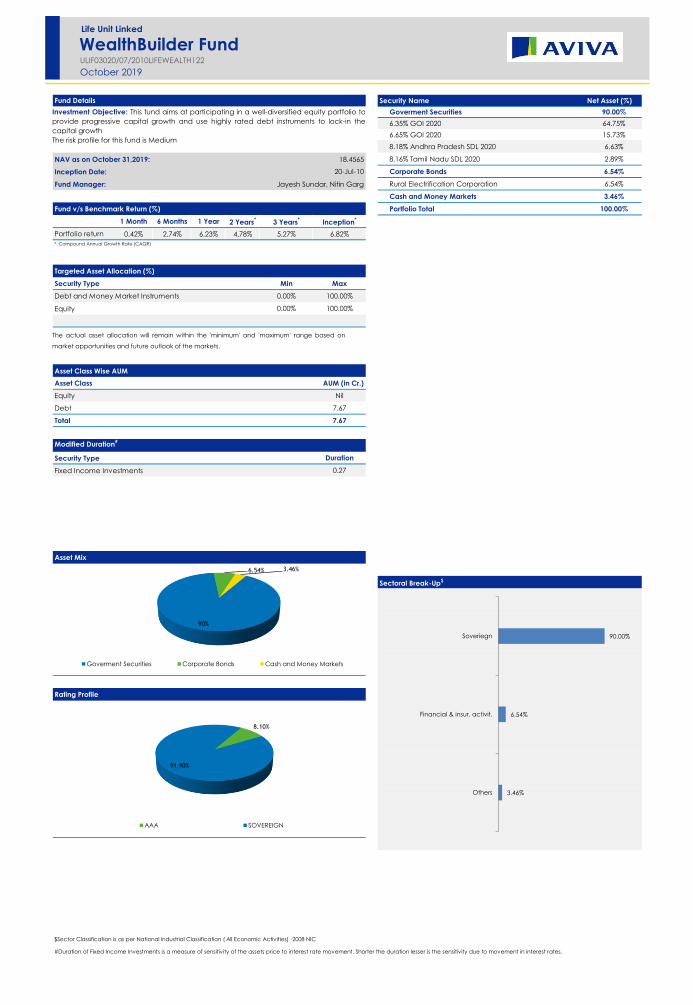
Goverment Securities 90.00%
6.35% GOI 2020 64.75%
6.65% GOI 2020 15.73%
8.18% Andhra Pradesh SDL 2020 6.63%
NAV as on October 31,2019: 18.4565 8.16% Tamil Nadu SDL 2020 2.89%
Inception Date: 20-Jul-10 Corporate Bonds 6.54%
Fund Manager: Jayesh Sundar, Nitin Garg Rural Electrification Corporation 6.54%
Cash and Money Markets 3.46%
Fund v/s Benchmark Return (%) Portfolio Total 100.00%
1 Month 6 Months 1 Year 2 Years*
3 Years*
Inception*
Portfolio return 0.42% 2.74% 6.23% 4.78% 5.27% 6.82%
Targeted Asset Allocation (%)
Security Type Min Max
Debt and Money Market Instruments 0.00% 100.00%
Equity 0.00% 100.00%
Asset Class Wise AUM
Asset Class AUM (in Cr.)
Equity Nil
Debt 7.67
Total 7.67
Modified Duration#
Security Type Duration
Fixed Income Investments 0.27
Asset Mix
Sectoral Break-Up$
Rating Profile
$Sector Classification is as per National Industrial Classification ( All Economic Activities) -2008 NIC
#Duration of Fixed Income Investments is a measure of sensitivity of the assets price to interest rate movement. Shorter the duration lesser is the sensitivity due to movement in interest rates.
* Compound Annual Growth Rate (CAGR)
Investment Objective: This fund aims at participating in a well-diversified equity portfolio to
provide progressive capital growth and use highly rated debt instruments to lock-in the
capital growth
The risk profile for this fund is Medium
October 2019
The actual asset allocation will remain within the 'minimum' and 'maximum' range based on
market opportunities and future outlook of the markets.
3.46%
6.54%
90.00%
Others
Financial & insur. activit.
Soveriegn
90%
6.54% 3.46%
Goverment Securities Corporate Bonds Cash and Money Markets
Life Unit Linked
WealthBuilder FundULIF03020/07/2010LIFEWEALTH122
8.10%
91.90%
AAA SOVEREIGN

Fund Details Security Name Net Asset (%)
Equities 76.91%
Kotak Mahindra Mutual Fund 9.67%
Reliance Industries Ltd. 7.75%
HDFC Bank Ltd. 6.31%
NAV as on October 31,2019: 21.9684 Larsen & Toubro Ltd. 4.65%
Inception Date: 01-Aug-11 Infosys Ltd. 4.19%
Fund Manager: Jayesh Sundar, Nitin Garg ITC Ltd. 3.85%
Housing Development Finance Corporation Ltd. 3.77%
Fund v/s Benchmark Return (%) ICICI Bank Ltd. 3.71%
1 Month 6 Months 1 Year 2 Years*
3 Years*
Inception* Tata Consultancy Services Ltd. 2.63%
Portfolio return 2.01% -0.07% 9.86% 4.81% 9.27% 10.00% Hindustan Unilever Ltd. 2.42%
Benchmark** 3.07% 1.53% 13.28% 7.08% 10.68% 9.62% Others 27.96%
Cash and Money Markets 23.09%
Portfolio Total 100.00%
Targeted Asset Allocation (%)
Security Type Min Max
Debt and Money Market Instruments 0.00% 100.00%
Equity 0.00% 100.00%
Asset Class Wise AUM
Asset Class AUM (in Cr.)
Equity 66.66
Debt 20.01
Total 86.68
Modified Duration#
Security Type Duration
Fixed Income Investments N.A.
Asset Mix
Sectoral Break-Up$
* Compound Annual Growth Rate (CAGR)
$Sector Classification is as per National Industrial Classification ( All Economic Activities) -2008 NIC
**Benchmark return has been computed by applying benchmark weightages on NIFTY 50 INDEX & CRISIL LIQUID INDEX
#Duration of Fixed Income Investments is a measure of sensitivity of the assets price to interest rate movement. Shorter the duration lesser is the sensitivity due to movement in interest rates.
October 2019
The actual asset allocation will remain within the 'minimum' and 'maximum' range based on
market opportunities and future outlook of the markets.
31.63%
2.08%
2.62%
3.25%
3.58%
3.85%
4.65%
8.91%
8.96%
11.55%
18.92%
Others
Manf. of other transport equipment
Electricity, gas, steam and air
conditioning supply
Manf. of motor vehic ,trailr & semi-
trailr
Manf. of chemic.s & chemic. prod.
Manf. of tobacco prod.
Civil engineering
Compt prgm, consult. & related
activit.
Manf. of coke & refined petrol. prod.
Mutual Funds
Financial & insur. activit.
76.91%
23.09%
Equities Cash and Money Markets
Life Unit Linked
Dynamic P/E FundULIF03201/08/2011LIFDYNAMIC122
Investment Objective: To provide long term capital appreciation through dynamic asset
allocation between Debt and Equity. The allocation to Equity and Equity Related Securities is
determined with reference to the Forward Price Earning (P/E) multiple of the Nifty 50 index
and the remainder is invested in Debt and Money Market instruments.
The risk profile for this fund is High

Fund Details Security Name Net Asset (%)
Goverment Securities 75.36%
7.72% GOI 2025 18.43%
8.17% GOI 2044 12.36%
7.17% GOI 2028 11.64%
NAV as on October 31,2019: 19.9330 7.32% GOI 2024 10.85%
Inception Date: 08-Jan-10 9.15% GOI 2024 8.28%
Fund Manager: Nitin Garg 6.79% GOI 2029 7.02%
8.4% GOI 2024 2.08%
Fund v/s Benchmark Return (%) 9.2% GOI 2030 1.82%
1 Month 6 Months 1 Year 2 Years*
3 Years*
Inception* 8.2% GOI 2025 1.68%
Portfolio return 0.92% 0.01% 3.58% 1.53% 2.99% 7.28% 8.26% GOI 2027 0.83%
Benchmark** 1.15% 7.65% 13.55% 7.48% 7.38% 8.30% Others 0.37%
Corporate Bonds 20.97%
Indiabulls Housing Finance Ltd. 6.05%
Targeted Asset Allocation (%) Adani Ports and Special Economic Zone Ltd. 4.50%
Security Type Min Max Mahindra & Mahindra Ltd. 2.99%
Debt 60.00% 100.00% LIC Housing Finance Ltd. 2.83%
Money Market & other cash instruments 0.00% 40.00% Shriram Transport Finance Co. Ltd. 1.87%
Dewan Housing Finance Corporation Ltd. 1.05%
Reliance Capital Ltd. 0.84%
Indiabulls Housing Finance Ltd. 0.41%
Indian Railway Finance Corporation Ltd. 0.26%
Asset Class Wise AUM Housing Development Finance Corporation Ltd. 0.17%
Asset Class AUM (in Cr.) Cash and Money Markets 3.67%
Equity Nil Portfolio Total 100.00%
Debt 119.18
Total 119.18
Modified Duration#
Security Type Duration
Fixed Income Investments 5.67
Asset Mix
Sectoral Break-Up$
Rating Profile
* Compound Annual Growth Rate (CAGR)
$Sector Classification is as per National Industrial Classification ( All Economic Activities) -2008 NIC
**Benchmark for this fund is CRISIL Composite Bond Fund Index
#Duration of Fixed Income Investments is a measure of sensitivity of the assets price to interest rate movement. Shorter the duration lesser is the sensitivity due to movement in interest rates.
Investment Objective: To generate a steady income through investment in high quality
fixed income securities
The risk profile for this fund is Low
October 2019
The actual asset allocation will remain within the 'minimum' and 'maximum' range based on
market opportunities and future outlook of the markets.
3.67%
2.99%
4.50%
13.48%
75.36%
Others
Manf. of motor vehic ,trailr & semi-
trailr
Warehousing & support activit. for
transp.
Financial & insur. activit.
Soveriegn
75.36%
20.97%
3.67%
Goverment Securities Corporate Bonds Cash and Money Markets
Life Unit Linked
Bond Fund-IIULIF01608/01/2010LIFDEBT-II122
13.19%
7.35%
1.94%
77.51%
AA+ AAA D SOVEREIGN

Fund Details Security Name Net Asset (%)
Equities 14.32%
HDFC Bank Ltd. 1.85%
Reliance Industries Ltd. 1.47%
Housing Development Finance Corporation Ltd. 1.01%
NAV as on October 31,2019: 19.7551 ICICI Bank Ltd. 0.95%
Inception Date: 08-Jan-10 Larsen & Toubro Ltd. 0.80%
Fund Manager: Jayesh Sundar, Nitin Garg Infosys Ltd. 0.78%
ITC Ltd. 0.65%
Fund v/s Benchmark Return (%) Tata Consultancy Services Ltd. 0.51%
1 Month 6 Months 1 Year 2 Years*
3 Years*
Inception* Kotak Mahindra Bank Ltd. 0.48%
Portfolio return 1.19% -0.02% 4.66% 2.30% 4.05% 7.18% Hindustan Unilever Ltd. 0.47%
Benchmark** 1.51% 6.74% 13.82% 7.56% 8.05% 8.50% Others 5.35%
Goverment Securities 66.82%
7.72% GOI 2025 15.81%
Targeted Asset Allocation (%) 7.32% GOI 2024 11.80%
Security Type Min Max 7.17% GOI 2028 8.76%
Money Market & other cash instruments 0.00% 40.00% 8.17% GOI 2044 8.61%
Equity 0.00% 20.00% 9.15% GOI 2024 7.26%
Debt 25.00% 100.00% 6.79% GOI 2029 5.43%
6.84% GOI 2022 2.16%
8.2% GOI 2025 2.06%
8.4% GOI 2024 1.80%
Asset Class Wise AUM 9.2% GOI 2030 1.60%
Asset Class AUM (in Cr.) Others 1.53%
Equity 7.15 Corporate Bonds 14.61%
Debt 42.77 Indiabulls Housing Finance Ltd. 3.92%
Total 49.91 Adani Ports and Special Economic Zone Ltd. 3.22%
Mahindra & Mahindra Ltd. 3.20%
Modified Duration#
LIC Housing Finance Ltd. 1.05%
Security Type Duration Dewan Housing Finance Corporation Ltd. 0.90%
Fixed Income Investments 5.41 Reliance Capital Ltd. 0.75%
Shriram Transport Finance Co. Ltd. 0.61%
Power Finance Corporation Ltd. 0.41%
Indiabulls Housing Finance Ltd. 0.30%
Power Grid Corporation of India Ltd. 0.25%
Cash and Money Markets 4.25%
Portfolio Total 100.00%
Asset Mix
Sectoral Break-Up$
Rating Profile
* Compound Annual Growth Rate (CAGR)
$Sector Classification is as per National Industrial Classification ( All Economic Activities) -2008 NIC
**Benchmark return has been computed by applying benchmark weightages on CRISIL Composite Bond Fund Index and NIFTY 50 INDEX
#Duration of Fixed Income Investments is a measure of sensitivity of the assets price to interest rate movement. Shorter the duration lesser is the sensitivity due to movement in interest rates.
Investment Objective: To generate steady returns with a minimum exposure to equities
The risk profile for this fund is Low
October 2019
The actual asset allocation will remain within the 'minimum' and 'maximum' range based on
market opportunities and future outlook of the markets.
6.49%
0.65%
0.69%
0.70%
0.80%
1.62%
1.68%
3.26%
3.75%
13.54%
66.82%
Others
Manf. of tobacco prod.
Manf. of chemic.s & chemic. prod.
Electricity, gas, steam and air
conditioning supply
Civil engineering
Manf. of coke & refined petrol. prod.
Compt prgm, consult. & related
activit.
Warehousing & support activit. for
transp.
Manf. of motor vehic ,trailr & semi-
trailr
Financial & insur. activit.
Soveriegn14.32%
66.82%
14.61%
4.25%
Equities Goverment Securities Corporate Bonds Cash and Money Markets
Life Unit Linked
Protector Fund-IIULIF02108/01/2010LIPROTE-II122
9.64%
8.38%
1.98%
80.01%
AA+ AAA D SOVEREIGN
Fund Details Security Name Net Asset (%)
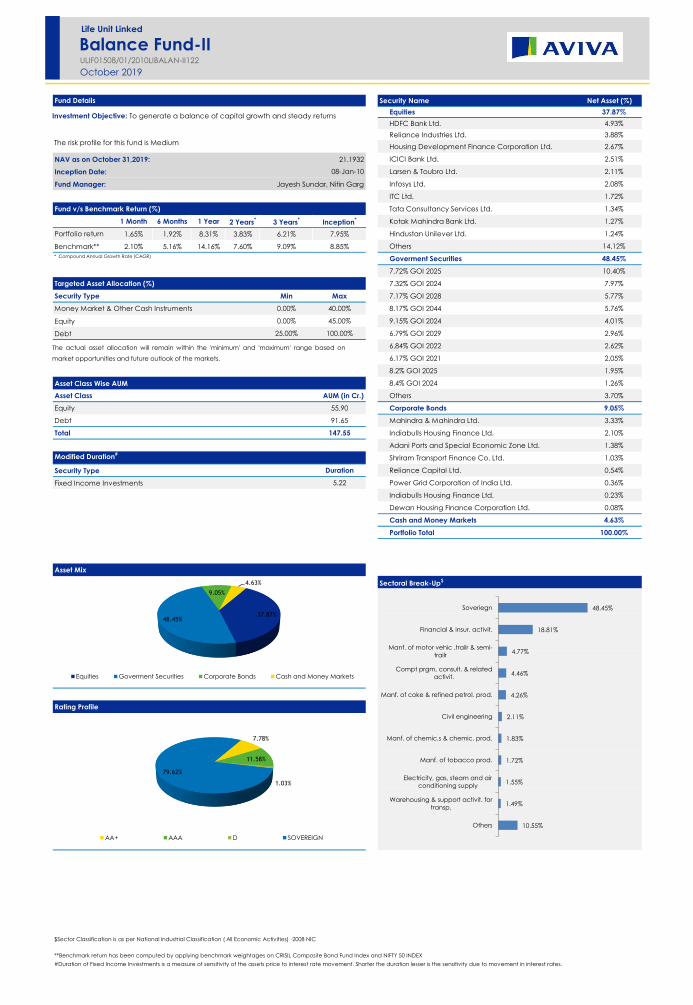
Equities 37.87%
HDFC Bank Ltd. 4.93%
Reliance Industries Ltd. 3.88%
Housing Development Finance Corporation Ltd. 2.67%
NAV as on October 31,2019: 21.1932 ICICI Bank Ltd. 2.51%
Inception Date: 08-Jan-10 Larsen & Toubro Ltd. 2.11%
Fund Manager: Jayesh Sundar, Nitin Garg Infosys Ltd. 2.08%
ITC Ltd. 1.72%
Fund v/s Benchmark Return (%) Tata Consultancy Services Ltd. 1.34%
1 Month 6 Months 1 Year 2 Years*
3 Years*
Inception* Kotak Mahindra Bank Ltd. 1.27%
Portfolio return 1.65% 1.92% 8.31% 3.83% 6.21% 7.95% Hindustan Unilever Ltd. 1.24%
Benchmark** 2.10% 5.16% 14.16% 7.60% 9.09% 8.85% Others 14.12%
Goverment Securities 48.45%
7.72% GOI 2025 10.40%
Targeted Asset Allocation (%) 7.32% GOI 2024 7.97%
Security Type Min Max 7.17% GOI 2028 5.77%
Money Market & Other Cash Instruments 0.00% 40.00% 8.17% GOI 2044 5.76%
Equity 0.00% 45.00% 9.15% GOI 2024 4.01%
Debt 25.00% 100.00% 6.79% GOI 2029 2.96%
6.84% GOI 2022 2.62%
6.17% GOI 2021 2.05%
8.2% GOI 2025 1.95%
Asset Class Wise AUM 8.4% GOI 2024 1.26%
Asset Class AUM (in Cr.) Others 3.70%
Equity 55.90 Corporate Bonds 9.05%
Debt 91.65 Mahindra & Mahindra Ltd. 3.33%
Total 147.55 Indiabulls Housing Finance Ltd. 2.10%
Adani Ports and Special Economic Zone Ltd. 1.38%
Modified Duration#
Shriram Transport Finance Co. Ltd. 1.03%
Security Type Duration Reliance Capital Ltd. 0.54%
Fixed Income Investments 5.22 Power Grid Corporation of India Ltd. 0.36%
Indiabulls Housing Finance Ltd. 0.23%
Dewan Housing Finance Corporation Ltd. 0.08%
Cash and Money Markets 4.63%
Portfolio Total 100.00%
Asset Mix
Sectoral Break-Up$
Rating Profile
* Compound Annual Growth Rate (CAGR)
$Sector Classification is as per National Industrial Classification ( All Economic Activities) -2008 NIC
**Benchmark return has been computed by applying benchmark weightages on CRISIL Composite Bond Fund Index and NIFTY 50 INDEX
#Duration of Fixed Income Investments is a measure of sensitivity of the assets price to interest rate movement. Shorter the duration lesser is the sensitivity due to movement in interest rates.
Investment Objective: To generate a balance of capital growth and steady returns
The risk profile for this fund is Medium
October 2019
The actual asset allocation will remain within the 'minimum' and 'maximum' range based on
market opportunities and future outlook of the markets.
10.55%
1.49%
1.55%
1.72%
1.83%
2.11%
4.26%
4.46%
4.77%
18.81%
48.45%
Others
Warehousing & support activit. for
transp.
Electricity, gas, steam and air
conditioning supply
Manf. of tobacco prod.
Manf. of chemic.s & chemic. prod.
Civil engineering
Manf. of coke & refined petrol. prod.
Compt prgm, consult. & related
activit.
Manf. of motor vehic ,trailr & semi-
trailr
Financial & insur. activit.
Soveriegn37.87%
48.45%
9.05%
4.63%
Equities Goverment Securities Corporate Bonds Cash and Money Markets
Life Unit Linked
Balance Fund-IIULIF01508/01/2010LIBALAN-II122
7.78%
11.58%
1.03%
79.62%
AA+ AAA D SOVEREIGN
Fund Details Security Name Net Asset (%)
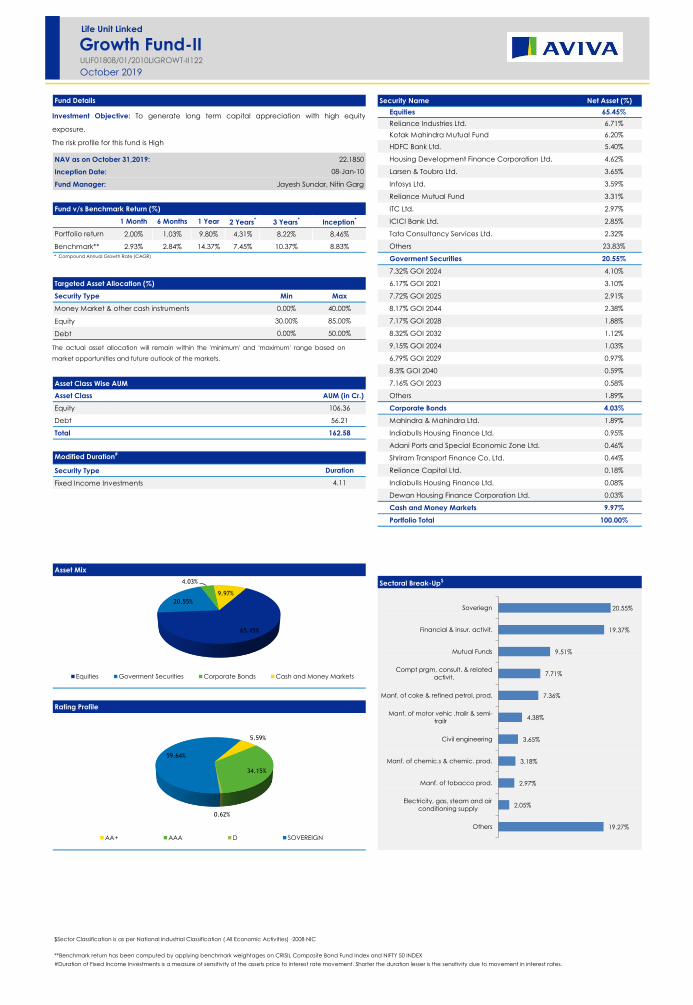
Equities 65.45%
Reliance Industries Ltd. 6.71%
Kotak Mahindra Mutual Fund 6.20%
HDFC Bank Ltd. 5.40%
NAV as on October 31,2019: 22.1850 Housing Development Finance Corporation Ltd. 4.62%
Inception Date: 08-Jan-10 Larsen & Toubro Ltd. 3.65%
Fund Manager: Jayesh Sundar, Nitin Garg Infosys Ltd. 3.59%
Reliance Mutual Fund 3.31%
Fund v/s Benchmark Return (%) ITC Ltd. 2.97%
1 Month 6 Months 1 Year 2 Years*
3 Years*
Inception* ICICI Bank Ltd. 2.85%
Portfolio return 2.00% 1.03% 9.80% 4.31% 8.22% 8.46% Tata Consultancy Services Ltd. 2.32%
Benchmark** 2.93% 2.84% 14.37% 7.45% 10.37% 8.83% Others 23.83%
Goverment Securities 20.55%
7.32% GOI 2024 4.10%
Targeted Asset Allocation (%) 6.17% GOI 2021 3.10%
Security Type Min Max 7.72% GOI 2025 2.91%
Money Market & other cash instruments 0.00% 40.00% 8.17% GOI 2044 2.38%
Equity 30.00% 85.00% 7.17% GOI 2028 1.88%
Debt 0.00% 50.00% 8.32% GOI 2032 1.12%
9.15% GOI 2024 1.03%
6.79% GOI 2029 0.97%
8.3% GOI 2040 0.59%
Asset Class Wise AUM 7.16% GOI 2023 0.58%
Asset Class AUM (in Cr.) Others 1.89%
Equity 106.36 Corporate Bonds 4.03%
Debt 56.21 Mahindra & Mahindra Ltd. 1.89%
Total 162.58 Indiabulls Housing Finance Ltd. 0.95%
Adani Ports and Special Economic Zone Ltd. 0.46%
Modified Duration#
Shriram Transport Finance Co. Ltd. 0.44%
Security Type Duration Reliance Capital Ltd. 0.18%
Fixed Income Investments 4.11 Indiabulls Housing Finance Ltd. 0.08%
Dewan Housing Finance Corporation Ltd. 0.03%
Cash and Money Markets 9.97%
Portfolio Total 100.00%
Asset Mix
Sectoral Break-Up$
Rating Profile
* Compound Annual Growth Rate (CAGR)
$Sector Classification is as per National Industrial Classification ( All Economic Activities) -2008 NIC
**Benchmark return has been computed by applying benchmark weightages on CRISIL Composite Bond Fund Index and NIFTY 50 INDEX
#Duration of Fixed Income Investments is a measure of sensitivity of the assets price to interest rate movement. Shorter the duration lesser is the sensitivity due to movement in interest rates.
Investment Objective: To generate long term capital appreciation with high equity
exposure.
The risk profile for this fund is High
October 2019
The actual asset allocation will remain within the 'minimum' and 'maximum' range based on
market opportunities and future outlook of the markets.
19.27%
2.05%
2.97%
3.18%
3.65%
4.38%
7.36%
7.71%
9.51%
19.37%
20.55%
Others
Electricity, gas, steam and air
conditioning supply
Manf. of tobacco prod.
Manf. of chemic.s & chemic. prod.
Civil engineering
Manf. of motor vehic ,trailr & semi-
trailr
Manf. of coke & refined petrol. prod.
Compt prgm, consult. & related
activit.
Mutual Funds
Financial & insur. activit.
Soveriegn
65.45%
20.55%
4.03%
9.97%
Equities Goverment Securities Corporate Bonds Cash and Money Markets
Life Unit Linked
Growth Fund-IIULIF01808/01/2010LIGROWT-II122
5.59%
34.15%
0.62%
59.64%
AA+ AAA D SOVEREIGN

Fund Details Security Name Net Asset (%)
Equities 91.38%
Kotak Mahindra Mutual Fund 9.88%
Reliance Industries Ltd. 9.57%
HDFC Bank Ltd. 8.17%
NAV as on October 31,2019: 26.0112 Infosys Ltd. 5.48%
Inception Date: 08-Jan-10 Larsen & Toubro Ltd. 4.98%
Fund Manager: Jayesh Sundar Housing Development Finance Corporation Ltd. 4.93%
ICICI Bank Ltd. 4.65%
Fund v/s Benchmark Return (%) ITC Ltd. 4.52%
1 Month 6 Months 1 Year 2 Years*
3 Years*
Inception* Tata Consultancy Services Ltd. 3.43%
Portfolio return 2.54% -0.34% 10.59% 4.69% 9.52% 10.23% Hindustan Unilever Ltd. 3.16%
Benchmark** 3.51% 1.10% 14.35% 7.20% 11.17% 8.68% Others 32.61%
Cash and Money Markets 8.62%
Portfolio Total 100.00%
Targeted Asset Allocation (%)
Security Type Min Max
Money Market & Other Cash Instruments 0.00% 40.00%
Equity 60.00% 100.00%
Debt 0.00% 40.00%
Asset Class Wise AUM
Asset Class AUM (in Cr.)
Equity 376.11
Debt 35.35
Total 411.46
Modified Duration#
Security Type Duration
Fixed Income Investments N.A.
Asset Mix
Sectoral Break-Up$
* Compound Annual Growth Rate (CAGR)
$Sector Classification is as per National Industrial Classification ( All Economic Activities) -2008 NIC
**Benchmark for this fund is NIFTY 50 INDEX
#Duration of Fixed Income Investments is a measure of sensitivity of the assets price to interest rate movement. Shorter the duration lesser is the sensitivity due to movement in interest rates.
Investment Objective: To provide aggressive, long term capital growth with high equity
exposure.
The risk profile for this fund is High
October 2019
The actual asset allocation will remain within the 'minimum' and 'maximum' range based on
market opportunities and future outlook of the markets.
18.92%
2.71%
3.00%
3.70%
4.52%
4.65%
4.98%
10.54%
11.63%
11.81%
23.54%
Others
Manf. of other transport equipment
Electricity, gas, steam and air
conditioning supply
Manf. of motor vehic ,trailr & semi-
trailr
Manf. of tobacco prod.
Manf. of chemic.s & chemic. prod.
Civil engineering
Manf. of coke & refined petrol. prod.
Compt prgm, consult. & related
activit.
Mutual Funds
Financial & insur. activit.
91.38%
8.62%
Equities Cash and Money Markets
Life Unit Linked
Enhancer Fund-IIULIF01708/01/2010LIFENHN-II122

Fund Details Security Name Net Asset (%)
Equities 93.31%
Kotak Mahindra Mutual Fund 10.58%
Reliance Industries Ltd. 9.60%
HDFC Bank Ltd. 7.58%
NAV as on October 31,2019: 21.6977 Infosys Ltd. 5.48%
Inception Date: 08-Jan-10 Housing Development Finance Corporation Ltd. 5.04%
Fund Manager: Jayesh Sundar Larsen & Toubro Ltd. 5.01%
ITC Ltd. 4.54%
Fund v/s Benchmark Return (%) ICICI Bank Ltd. 4.45%
1 Month 6 Months 1 Year 2 Years*
3 Years*
Inception* Tata Consultancy Services Ltd. 3.45%
Portfolio return 2.64% 0.74% 12.56% 6.11% 10.35% 8.21% Hindustan Unilever Ltd. 3.18%
Benchmark** 3.51% 1.10% 14.35% 7.20% 11.17% 8.68% Others 34.40%
Cash and Money Markets 6.69%
Portfolio Total 100.00%
Targeted Asset Allocation (%)
Security Type Min Max
Debt and Money Market Instruments 0.00% 20.00%
Equity 80.00% 100.00%
Asset Class Wise AUM
Asset Class AUM (in Cr.)
Equity 81.41
Debt 5.85
Total 87.27
Modified Duration#
Security Type Duration
Fixed Income Investments N.A.
Asset Mix
Sectoral Break-Up$
* Compound Annual Growth Rate (CAGR)
$Sector Classification is as per National Industrial Classification ( All Economic Activities) -2008 NIC
**Benchmark for this fund is NIFTY 50 INDEX
#Duration of Fixed Income Investments is a measure of sensitivity of the assets price to interest rate movement. Shorter the duration lesser is the sensitivity due to movement in interest rates.
Investment Objective: To generate returns in line with the stock market index - NIFTY 50.
The risk profile for this fund is High
October 2019
The actual asset allocation will remain within the 'minimum' and 'maximum' range based on
market opportunities and future outlook of the markets.
17.60%
2.96%
3.03%
3.74%
4.54%
4.90%
5.01%
10.67%
11.87%
12.64%
23.04%
Others
Manf. of other transport equipment
Electricity, gas, steam and air
conditioning supply
Manf. of motor vehic ,trailr & semi-
trailr
Manf. of tobacco prod.
Manf. of chemic.s & chemic. prod.
Civil engineering
Manf. of coke & refined petrol. prod.
Compt prgm, consult. & related
activit.
Mutual Funds
Financial & insur. activit.
93.31%
6.69%
Equities Cash and Money Markets
Life Unit Linked
Index Fund-IIULIF02008/01/2010LIFINDX-II122

Fund Details Security Name Net Asset (%)
Treasury Bill 82.10%
364 Days Treasury Bill 2019 24.66%
364 Days Treasury Bill 2019 18.08%
364 Days Treasury Bill 2020 12.40%
NAV as on October 31,2019: 18.3270 364 Days Treasury Bill 2020 10.25%
Inception Date: 27-Jan-11 364 Days Treasury Bill 2019 7.06%
Fund Manager: Nitin Garg 364 Days Treasury Bill 2020 3.44%
364 Days Treasury Bill 2020 3.43%
Fund v/s Benchmark Return (%) 364 Days Treasury Bill 2020 2.78%
1 Month 6 Months 1 Year 2 Years*
3 Years*
Inception* Cash and Money Markets 17.90%
Portfolio return 0.47% 3.05% 6.30% 6.16% 6.06% 7.16% Portfolio Total 100.00%
Targeted Asset Allocation (%)
Security Type Min Max
Money Market 0.00% 40.00%
Government Securities 60.00% 100.00%
Asset Class Wise AUM
Asset Class AUM (in Cr.)
Equity Nil
Debt 140.62
Total 140.62
Modified Duration#
Security Type Duration
Fixed Income Investments 0.34
Asset Mix
Sectoral Break-Up$
Rating Profile
$Sector Classification is as per National Industrial Classification ( All Economic Activities) -2008 NIC
#Duration of Fixed Income Investments is a measure of sensitivity of the assets price to interest rate movement. Shorter the duration lesser is the sensitivity due to movement in interest rates.
* Compound Annual Growth Rate (CAGR)
Investment Objective: The investment objective of the Discontinued Policy Fund is to
provide a minimum guaranteed return as prescribed by IRDAI from time to time.
The risk profile for this fund is Low
October 2019
The actual asset allocation will remain within the 'minimum' and 'maximum' range based on
market opportunities and future outlook of the markets.
1.33%
16.57%
82.10%
Others
Financial & insur. activit.
Soveriegn
82.10%
17.90%
Treasury Bill Cash and Money Markets
Life Unit Linked
Discontinued Policy FundULIF03127/01/2011LIDISCPLCY122
16.57%
1.33%
82.10%
A1+ AAA SOVEREIGN
Fund Details Security Name Net Asset (%)
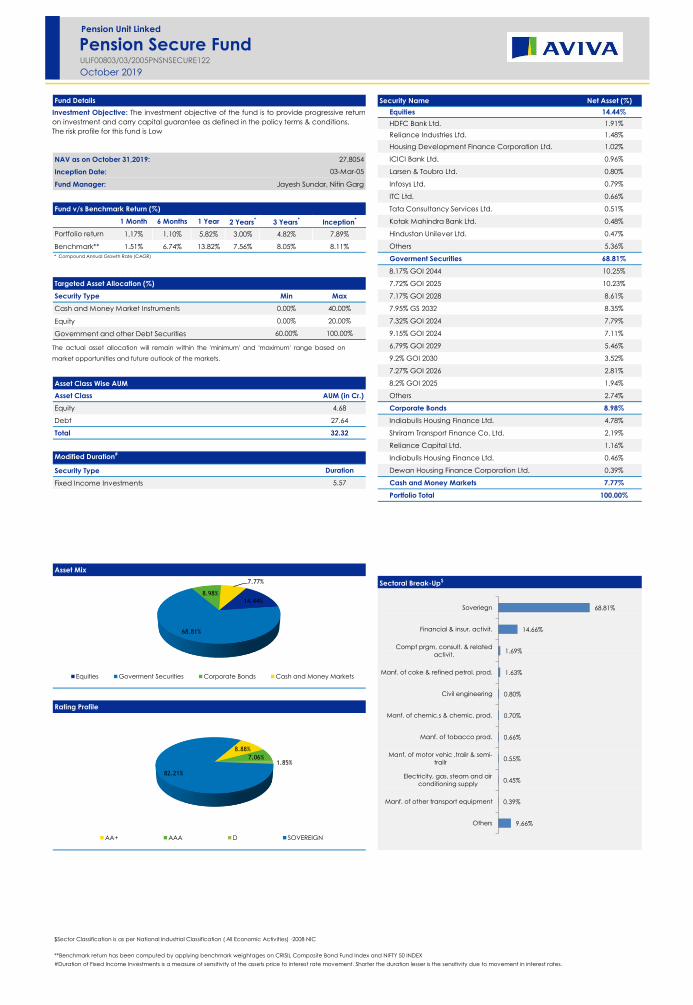
Equities 14.44%
HDFC Bank Ltd. 1.91%
Reliance Industries Ltd. 1.48%
Housing Development Finance Corporation Ltd. 1.02%
NAV as on October 31,2019: 27.8054 ICICI Bank Ltd. 0.96%
Inception Date: 03-Mar-05 Larsen & Toubro Ltd. 0.80%
Fund Manager: Jayesh Sundar, Nitin Garg Infosys Ltd. 0.79%
ITC Ltd. 0.66%
Fund v/s Benchmark Return (%) Tata Consultancy Services Ltd. 0.51%
1 Month 6 Months 1 Year 2 Years*
3 Years*
Inception* Kotak Mahindra Bank Ltd. 0.48%
Portfolio return 1.17% 1.10% 5.82% 3.00% 4.82% 7.89% Hindustan Unilever Ltd. 0.47%
Benchmark** 1.51% 6.74% 13.82% 7.56% 8.05% 8.11% Others 5.36%
Goverment Securities 68.81%
8.17% GOI 2044 10.25%
Targeted Asset Allocation (%) 7.72% GOI 2025 10.23%
Security Type Min Max 7.17% GOI 2028 8.61%
Cash and Money Market Instruments 0.00% 40.00% 7.95% GS 2032 8.35%
Equity 0.00% 20.00% 7.32% GOI 2024 7.79%
Government and other Debt Securities 60.00% 100.00% 9.15% GOI 2024 7.11%
6.79% GOI 2029 5.46%
9.2% GOI 2030 3.52%
7.27% GOI 2026 2.81%
Asset Class Wise AUM 8.2% GOI 2025 1.94%
Asset Class AUM (in Cr.) Others 2.74%
Equity 4.68 Corporate Bonds 8.98%
Debt 27.64 Indiabulls Housing Finance Ltd. 4.78%
Total 32.32 Shriram Transport Finance Co. Ltd. 2.19%
Reliance Capital Ltd. 1.16%
Modified Duration#
Indiabulls Housing Finance Ltd. 0.46%
Security Type Duration Dewan Housing Finance Corporation Ltd. 0.39%
Fixed Income Investments 5.57 Cash and Money Markets 7.77%
Portfolio Total 100.00%
Asset Mix
Sectoral Break-Up$
Rating Profile
* Compound Annual Growth Rate (CAGR)
$Sector Classification is as per National Industrial Classification ( All Economic Activities) -2008 NIC
**Benchmark return has been computed by applying benchmark weightages on CRISIL Composite Bond Fund Index and NIFTY 50 INDEX
#Duration of Fixed Income Investments is a measure of sensitivity of the assets price to interest rate movement. Shorter the duration lesser is the sensitivity due to movement in interest rates.
Investment Objective: The investment objective of the fund is to provide progressive return
on investment and carry capital guarantee as defined in the policy terms & conditions.
The risk profile for this fund is Low
October 2019
The actual asset allocation will remain within the 'minimum' and 'maximum' range based on
market opportunities and future outlook of the markets.
9.66%
0.39%
0.45%
0.55%
0.66%
0.70%
0.80%
1.63%
1.69%
14.66%
68.81%
Others
Manf. of other transport equipment
Electricity, gas, steam and air
conditioning supply
Manf. of motor vehic ,trailr & semi-
trailr
Manf. of tobacco prod.
Manf. of chemic.s & chemic. prod.
Civil engineering
Manf. of coke & refined petrol. prod.
Compt prgm, consult. & related
activit.
Financial & insur. activit.
Soveriegn14.44%
68.81%
8.98%
7.77%
Equities Goverment Securities Corporate Bonds Cash and Money Markets
Pension Unit Linked
Pension Secure FundULIF00803/03/2005PNSNSECURE122
8.88%
7.06%1.85%
82.21%
AA+ AAA D SOVEREIGN

Fund Details Security Name Net Asset (%)
Equities 15.60%
HDFC Bank Ltd. 1.92%
Reliance Industries Ltd. 1.60%
Housing Development Finance Corporation Ltd. 1.10%
NAV as on October 31,2019: 22.5771 ICICI Bank Ltd. 1.03%
Inception Date: 08-Feb-08 Larsen & Toubro Ltd. 0.86%
Fund Manager: Jayesh Sundar, Nitin Garg Infosys Ltd. 0.85%
ITC Ltd. 0.71%
Fund v/s Benchmark Return (%) Tata Consultancy Services Ltd. 0.55%
1 Month 6 Months 1 Year 2 Years*
3 Years*
Inception* Kotak Mahindra Bank Ltd. 0.52%
Portfolio return 1.37% -0.90% 3.98% 1.91% 4.01% 7.18% Reliance Mutual Fund 0.52%
Benchmark** 1.51% 6.74% 13.82% 7.56% 8.05% 7.71% Others 5.94%
Goverment Securities 56.15%
7.72% GOI 2025 15.56%
Targeted Asset Allocation (%) 8.17% GOI 2044 10.01%
Security Type Min Max 7.17% GOI 2028 7.72%
Cash and Money Market Instruments 0.00% 40.00% 9.15% GOI 2024 5.03%
Equity 0.00% 20.00% 9.2% GOI 2030 4.80%
Government and other Debt Securities 60.00% 100.00% 7.32% GOI 2024 4.38%
6.79% GOI 2029 3.75%
8.2% GOI 2025 2.11%
6.84% GOI 2022 0.92%
Asset Class Wise AUM 8.26% GOI 2027 0.82%
Asset Class AUM (in Cr.) Others 1.05%
Equity 2.07 Corporate Bonds 24.68%
Debt 11.23 Adani Ports and Special Economic Zone Ltd. 7.25%
Total 13.30 Indian Railway Finance Corporation Ltd. 3.93%
LIC Housing Finance Ltd. 3.17%
Modified Duration#
Indiabulls Housing Finance Ltd. 3.10%
Security Type Duration Yes Bank Ltd. 2.37%
Fixed Income Investments 5.16 Housing Development Finance Corporation Ltd. 2.34%
Reliance Capital Ltd. 1.13%
Dewan Housing Finance Corporation Ltd. 0.75%
Indiabulls Housing Finance Ltd. 0.64%
Cash and Money Markets 3.57%
Portfolio Total 100.00%
Asset Mix
Sectoral Break-Up$
Rating Profile
* Compound Annual Growth Rate (CAGR)
$Sector Classification is as per National Industrial Classification ( All Economic Activities) -2008 NIC
**Benchmark return has been computed by applying benchmark weightages on CRISIL Composite Bond Fund Index and NIFTY 50 INDEX
#Duration of Fixed Income Investments is a measure of sensitivity of the assets price to interest rate movement. Shorter the duration lesser is the sensitivity due to movement in interest rates.
Investment Objective: Progressive return on your investment by investing majority portion in
debt securities, with a minimum exposure to equities
The risk profile for this fund is Low
October 2019
The actual asset allocation will remain within the 'minimum' and 'maximum' range based on
market opportunities and future outlook of the markets.
6.11%
0.52%
0.59%
0.71%
0.75%
0.86%
1.76%
1.82%
7.30%
23.43%
56.15%
Others
Mutual Funds
Manf. of motor vehic ,trailr & semi-
trailr
Manf. of tobacco prod.
Manf. of chemic.s & chemic. prod.
Civil engineering
Manf. of coke & refined petrol. prod.
Compt prgm, consult. & related
activit.
Warehousing & support activit. for
transp.
Financial & insur. activit.
Soveriegn15.60%
56.15%
24.68%
3.57%
Equities Goverment Securities Corporate Bonds Cash and Money Markets
Pension Unit Linked
Pension Protector FundULIF01408/02/2008PNSPROTECT122
2.87%
13.35%
13.25%
2.28%
68.23%
A+ AA+ AAA D SOVEREIGN

Fund Details Security Name Net Asset (%)
Equities 33.65%
HDFC Bank Ltd. 4.24%
Reliance Industries Ltd. 3.45%
Housing Development Finance Corporation Ltd. 2.37%
NAV as on October 31,2019: 54.6641 ICICI Bank Ltd. 2.23%
Inception Date: 11-Feb-03 Larsen & Toubro Ltd. 1.87%
Fund Manager: Jayesh Sundar, Nitin Garg Infosys Ltd. 1.84%
ITC Ltd. 1.53%
Fund v/s Benchmark Return (%) Tata Consultancy Services Ltd. 1.19%
1 Month 6 Months 1 Year 2 Years*
3 Years*
Inception* Kotak Mahindra Bank Ltd. 1.12%
Portfolio return 1.63% 0.52% 6.82% 3.23% 5.62% 11.20% Hindustan Unilever Ltd. 1.10%
Benchmark** 1.99% 5.48% 14.10% 7.60% 8.89% 9.95% Others 12.71%
Goverment Securities 49.92%
7.72% GOI 2025 11.20%
Targeted Asset Allocation (%) 7.17% GOI 2028 8.87%
Security Type Min Max 7.32% GOI 2024 7.86%
Cash and Money Market Instruments 0.00% 40.00% 8.17% GOI 2044 7.27%
Equity 0.00% 45.00% 9.2% GOI 2030 3.99%
Government and other Debt Securities 50.00% 90.00% 6.79% GOI 2029 3.52%
7.16% GOI 2023 2.86%
8.2% GOI 2025 1.85%
8.26% GOI 2027 1.15%
Asset Class Wise AUM 9.15% GOI 2024 1.06%
Asset Class AUM (in Cr.) Others 0.29%
Equity 14.58 Corporate Bonds 13.01%
Debt 28.71 Indiabulls Housing Finance Ltd. 4.29%
Total 43.28 Power Grid Corporation of India Ltd. 3.01%
LIC Housing Finance Ltd. 2.48%
Modified Duration#
Adani Ports and Special Economic Zone Ltd. 1.98%
Security Type Duration Reliance Capital Ltd. 0.81%
Fixed Income Investments 5.28 Indiabulls Housing Finance Ltd. 0.32%
Dewan Housing Finance Corporation Ltd. 0.12%
Cash and Money Markets 3.42%
Portfolio Total 100.00%
Asset Mix
Sectoral Break-Up$
Rating Profile
* Compound Annual Growth Rate (CAGR)
$Sector Classification is as per National Industrial Classification ( All Economic Activities) -2008 NIC
**Benchmark return has been computed by applying benchmark weightages on CRISIL Composite Bond Fund Index and NIFTY 50 INDEX
#Duration of Fixed Income Investments is a measure of sensitivity of the assets price to interest rate movement. Shorter the duration lesser is the sensitivity due to movement in interest rates.
Investment Objective: The fund is designed to provide long-term cumulative capital growth
while controlling overall risk, by availing opportunities in debt and equity markets.
The risk profile for this fund is Medium
October 2019
The actual asset allocation will remain within the 'minimum' and 'maximum' range based on
market opportunities and future outlook of the markets.
8.87%
1.27%
1.53%
1.62%
1.87%
2.08%
3.78%
3.95%
4.06%
21.05%
49.92%
Others
Manf. of motor vehic ,trailr & semi-
trailr
Manf. of tobacco prod.
Manf. of chemic.s & chemic. prod.
Civil engineering
Warehousing & support activit. for
transp.
Manf. of coke & refined petrol. prod.
Compt prgm, consult. & related
activit.
Electricity, gas, steam and air
conditioning supply
Financial & insur. activit.
Soveriegn33.65%
49.92%
13.01%
3.42%
Equities Goverment Securities Corporate Bonds Cash and Money Markets
Pension Unit Linked
Pension Balanced FundULIF00311/02/2003PNSBALANCE122
10.15%
11.48%
1.42%
76.95%
AA+ AAA D SOVEREIGN

Fund Details Security Name Net Asset (%)
Equities 51.37%
Reliance Industries Ltd. 5.26%
Kotak Mahindra Mutual Fund 4.84%
HDFC Bank Ltd. 4.02%
NAV as on October 31,2019: 36.6540 Housing Development Finance Corporation Ltd. 3.62%
Inception Date: 03-Mar-05 Reliance Mutual Fund 2.97%
Fund Manager: Jayesh Sundar, Nitin Garg Larsen & Toubro Ltd. 2.85%
Infosys Ltd. 2.81%
Fund v/s Benchmark Return (%) ITC Ltd. 2.33%
1 Month 6 Months 1 Year 2 Years*
3 Years*
Inception* ICICI Bank Ltd. 2.24%
Portfolio return 1.81% 1.33% 8.76% 3.93% 6.93% 9.96% Tata Consultancy Services Ltd. 1.82%
Benchmark** 2.46% 4.18% 14.29% 7.56% 9.66% 10.27% Others 18.61%
Goverment Securities 38.66%
7.72% GOI 2025 7.43%
Targeted Asset Allocation (%) 7.17% GOI 2028 6.04%
Security Type Min Max 7.32% GOI 2024 4.46%
Cash and Money Market Instruments 0.00% 40.00% 8.17% GOI 2044 4.22%
Equity 20.00% 60.00% 9.15% GOI 2024 3.91%
Government and other Debt Securities 20.00% 60.00% 6.84% GOI 2022 2.08%
6.79% GOI 2029 1.77%
7.95% GS 2032 1.44%
6.17% GOI 2021 1.40%
Asset Class Wise AUM 8.26% GOI 2027 1.36%
Asset Class AUM (in Cr.) Others 4.55%
Equity 29.57 Corporate Bonds 5.10%
Debt 28.01 Indiabulls Housing Finance Ltd. 1.61%
Total 57.59 Adani Ports and Special Economic Zone Ltd. 1.30%
Shriram Transport Finance Co. Ltd. 0.88%
Modified Duration#
Power Grid Corporation of India Ltd. 0.67%
Security Type Duration Reliance Capital Ltd. 0.35%
Fixed Income Investments 4.92 Indiabulls Housing Finance Ltd. 0.20%
Dewan Housing Finance Corporation Ltd. 0.09%
Cash and Money Markets 4.87%
Portfolio Total 100.00%
Asset Mix
Sectoral Break-Up$
Rating Profile
* Compound Annual Growth Rate (CAGR)
$Sector Classification is as per National Industrial Classification ( All Economic Activities) -2008 NIC
**Benchmark return has been computed by applying benchmark weightages on CRISIL Composite Bond Fund Index and NIFTY 50 INDEX
#Duration of Fixed Income Investments is a measure of sensitivity of the assets price to interest rate movement. Shorter the duration lesser is the sensitivity due to movement in interest rates.
Investment Objective: The fund is designed to provide long-term cumulative growth while
managing the risk of relatively high exposure to equity markets.
The risk profile for this fund is High
October 2019
The actual asset allocation will remain within the 'minimum' and 'maximum' range based on
market opportunities and future outlook of the markets.
13.08%
1.94%
2.27%
2.33%
2.47%
2.85%
5.77%
6.04%
7.81%
16.78%
38.66%
Others
Manf. of motor vehic ,trailr & semi-
trailr
Electricity, gas, steam and air
conditioning supply
Manf. of tobacco prod.
Manf. of chemic.s & chemic. prod.
Civil engineering
Manf. of coke & refined petrol. prod.
Compt prgm, consult. & related
activit.
Mutual Funds
Financial & insur. activit.
Soveriegn
51.37%
38.66%
5.10%4.87%
Equities Goverment Securities Corporate Bonds Cash and Money Markets
Pension Unit Linked
Pension Growth FundULIF00703/03/2005PNSNGROWTH122
8.33%
10.15%
0.91%
80.62%
AA+ AAA D SOVEREIGN

Fund Details Security Name Net Asset (%)
Equities 93.50%
Kotak Mahindra Mutual Fund 10.57%
Reliance Industries Ltd. 9.61%
HDFC Bank Ltd. 7.58%
NAV as on October 31,2019: 24.5785 Infosys Ltd. 5.48%
Inception Date: 22-Jan-08 Housing Development Finance Corporation Ltd. 5.04%
Fund Manager: Jayesh Sundar Larsen & Toubro Ltd. 5.01%
ITC Ltd. 4.55%
Fund v/s Benchmark Return (%) ICICI Bank Ltd. 4.45%
1 Month 6 Months 1 Year 2 Years*
3 Years*
Inception* Tata Consultancy Services Ltd. 3.45%
Portfolio return 2.68% 1.03% 13.26% 6.79% 11.03% 7.97% Hindustan Unilever Ltd. 3.18%
Benchmark** 3.51% 1.10% 14.35% 7.20% 11.17% 7.81% Others 34.58%
Cash and Money Markets 6.50%
Portfolio Total 100.00%
Targeted Asset Allocation (%)
Security Type Min Max
Debt Securities Incl. Money Market Instruments 0.00% 20.00%
Equity 80.00% 100.00%
Asset Class Wise AUM
Asset Class AUM (in Cr.)
Equity 108.67
Debt 7.55
Total 116.22
Modified Duration#
Security Type Duration
Fixed Income Investments N.A.
Asset Mix
Sectoral Break-Up$
* Compound Annual Growth Rate (CAGR)
$Sector Classification is as per National Industrial Classification ( All Economic Activities) -2008 NIC
**Benchmark for this fund is NIFTY 50 INDEX
#Duration of Fixed Income Investments is a measure of sensitivity of the assets price to interest rate movement. Shorter the duration lesser is the sensitivity due to movement in interest rates.
Investment Objective: The investment objective of this fund is to generate returns in line with
the stock market index - NIFTY 50
The risk profile for this fund is High
October 2019
The actual asset allocation will remain within the 'minimum' and 'maximum' range based on
market opportunities and future outlook of the markets.
17.44%
2.96%
3.06%
3.74%
4.55%
4.91%
5.01%
10.68%
11.87%
12.73%
23.05%
Others
Manf. of other transport equipment
Electricity, gas, steam and air
conditioning supply
Manf. of motor vehic ,trailr & semi-
trailr
Manf. of tobacco prod.
Manf. of chemic.s & chemic. prod.
Civil engineering
Manf. of coke & refined petrol. prod.
Compt prgm, consult. & related
activit.
Mutual Funds
Financial & insur. activit.
93.50%
6.50%
Equities Cash and Money Markets
Pension Unit Linked
Pension Index FundULIF01122/01/2008PNSNINDEXF122

Fund Details Security Name Net Asset (%)
Equities 89.13%
Bharti Airtel Ltd. 9.36%
Larsen & Toubro Ltd. 9.34%
NTPC Ltd. 8.79%
NAV Adani Ports and Special Economic Zone Ltd. 7.80%
Inception Date: 25-Jan-10 Power Grid Corporation of India Ltd. 7.62%
Fund Manager: Jayesh Sundar Tata Power Co. Ltd. 6.91%
Container Corporation Of India Ltd. 4.91%
Fund v/s Benchmark Return (%) Transport Corporation of India 3.79%
1 Month 6 Months 1 Year 2 Years*
3 Years*
Inception* Ahluwalia Contracts Ltd. 3.77%
Portfolio return -0.83% -2.99% 4.16% -10.61% 0.50% 1.41% HDFC Bank Ltd. 3.49%
Benchmark** 3.56% 6.92% 11.87% -3.69% 4.99% -0.51% Others 23.35%
Cash and Money Markets 10.87%
Portfolio Total 100.00%
Targeted Asset Allocation (%)
Security Type Min Max
Cash and Money Market Instruments 0.00% 40.00%
Equity 60.00% 100.00%
Asset Class Wise AUM
Asset Class AUM (in Cr.)
Equity 5.24
Debt 0.64
Total 5.88
Modified Duration#
Security Type Duration
Fixed Income Investments N.A.
Asset Mix
Sectoral Break-Up$
* Compound Annual Growth Rate (CAGR)
$Sector Classification is as per National Industrial Classification ( All Economic Activities) -2008 NIC
**Benchmark for this fund is Nifty Infrastructure
#Duration of Fixed Income Investments is a measure of sensitivity of the assets price to interest rate movement. Shorter the duration lesser is the sensitivity due to movement in interest rates.
Investment Objective: This fund is designed to generate steady returns through investment
in infrastructure and related equities.
The risk profile for this fund is High
October 2019
The actual asset allocation will remain within the 'minimum' and 'maximum' range based on
market opportunities and future outlook of the markets.
16.02%
2.88%
3.15%
3.77%
3.79%
4.03%
4.99%
9.36%
13.73%
14.96%
23.32%
Others
Manuf of fbricted metl prdut, except
mchn, equp
Manuf of compu, electronic and
optcl prodt
Construction of buildings
Postal and Courier Activities
Manf. of other non-metallic mineral
prod.
Financial & insur. activit.
Telecommunications
Civil engineering
Warehousing & support activit. for
transp.
Electricity, gas, steam and air
conditioning supply
89.13%
10.87%
Equities Cash and Money Markets
Pension Unit Linked
Pension Infrastructure FundULIF02525/01/2010PNSNINFRAF122

Fund Details Security Name Net Asset (%)
Equities 91.19%
State Bank of India 9.45%
NTPC Ltd. 8.31%
Oil & Natural Gas Corpn Ltd. 7.32%
NAV Bharat Petroleum Corporation Ltd. 6.92%
Inception Date: 25-Jan-10 Oil India Ltd. 6.08%
Fund Manager: Jayesh Sundar Gail (India) Ltd. 5.98%
Rural Electrification Corporation 5.32%
Fund v/s Benchmark Return (%) Gujarat State Petronet Ltd. 5.31%
1 Month 6 Months 1 Year 2 Years*
3 Years*
Inception* Container Corporation Of India Ltd. 4.22%
Portfolio return 6.76% -3.34% 4.02% -10.05% 0.40% 2.97% Canara Bank Ltd. 4.13%
Benchmark** 7.98% -3.43% 1.56% -12.54% -3.13% -3.04% Others 28.15%
Cash and Money Markets 8.81%
Portfolio Total 100.00%
Targeted Asset Allocation (%)
Security Type Min Max
Cash and Money Market Instruments 0.00% 40.00%
Equity 60.00% 100.00%
Asset Class Wise AUM
Asset Class AUM (in Cr.)
Equity 13.03
Debt 1.26
Total 14.29
Modified Duration#
Security Type Duration
Fixed Income Investments N.A.
Asset Mix
Sectoral Break-Up$
* Compound Annual Growth Rate (CAGR)
$Sector Classification is as per National Industrial Classification ( All Economic Activities) -2008 NIC
**Benchmark for this fund is BSE PSU Index
#Duration of Fixed Income Investments is a measure of sensitivity of the assets price to interest rate movement. Shorter the duration lesser is the sensitivity due to movement in interest rates.
Investment Objective: This fund is designed to generate steady returns through investment
in PSU and related equities.
The risk profile for this fund is High
October 2019
The actual asset allocation will remain within the 'minimum' and 'maximum' range based on
market opportunities and future outlook of the markets.
11.22%
1.42%
2.53%
2.97%
3.83%
4.22%
5.31%
12.32%
13.40%
19.69%
23.09%
Others
Mining of metal ores
Manf. of basic metals
Manuf of compu, electronic and
optcl prodt
Mining of coal & lignite
Warehousing & support activit. for
transp.
Land Transport & Transport Via
Pipelines
Manf. of coke & refined petrol. prod.
Extrac. of crude petrol. & natural gas
Electricity, gas, steam and air
conditioning supply
Financial & insur. activit.
91.19%
8.81%
Equities Cash and Money Markets
Pension Unit Linked
Pension PSU FundULIF02725/01/2010PNSNPSUFND122

Fund Details Security Name Net Asset (%)
Equities 16.37%
HDFC Bank Ltd. 2.14%
Reliance Industries Ltd. 1.68%
Housing Development Finance Corporation Ltd. 1.16%
NAV as on October 31,2019: 18.4358 ICICI Bank Ltd. 1.09%
Inception Date: 08-Jan-10 Larsen & Toubro Ltd. 0.91%
Fund Manager: Jayesh Sundar, Nitin Garg Infosys Ltd. 0.90%
ITC Ltd. 0.75%
Fund v/s Benchmark Return (%) Tata Consultancy Services Ltd. 0.58%
1 Month 6 Months 1 Year 2 Years*
3 Years*
Inception* Kotak Mahindra Bank Ltd. 0.55%
Portfolio return 1.27% -6.42% -2.61% -1.74% 1.26% 6.46% Hindustan Unilever Ltd. 0.54%
Benchmark** 1.51% 6.74% 13.82% 7.56% 8.05% 8.53% Others 6.07%
Goverment Securities 71.52%
8.17% GOI 2044 12.68%
Targeted Asset Allocation (%) 7.17% GOI 2028 11.63%
Security Type Min Max 7.72% GOI 2025 10.21%
Debt and Money Market Instruments 80.00% 100.00% 8.79% Gujarat SDL 2022 8.86%
Equity 0.00% 20.00% 6.79% GOI 2029 6.97%
7.32% GOI 2024 5.89%
9.15% GOI 2024 5.57%
7.95% GS 2032 5.37%
8.2% GOI 2025 2.16%
Asset Class Wise AUM 8.28% GOI 2027 0.72%
Asset Class AUM (in Cr.) Others 1.46%
Equity 0.49 Corporate Bonds 8.66%
Debt 2.51 Indiabulls Housing Finance Ltd. 3.43%
Total 3.00 Reliance Capital Ltd. 2.50%
Dewan Housing Finance Corporation Ltd. 1.67%
Modified Duration#
Indiabulls Housing Finance Ltd. 1.06%
Security Type Duration Cash and Money Markets 3.45%
Fixed Income Investments 5.74 Portfolio Total 100.00%
Asset Mix
Sectoral Break-Up$
Rating Profile
* Compound Annual Growth Rate (CAGR)
$Sector Classification is as per National Industrial Classification ( All Economic Activities) -2008 NIC
**Benchmark return has been computed by applying benchmark weightages on CRISIL Composite Bond Fund Index and NIFTY 50 INDEX
#Duration of Fixed Income Investments is a measure of sensitivity of the assets price to interest rate movement. Shorter the duration lesser is the sensitivity due to movement in interest rates.
Investment Objective: Progressive return on your investment by investing majority portion in
debt securities, with a minimum exposure to equities
The risk profile for this fund is Low
October 2019
The actual asset allocation will remain within the 'minimum' and 'maximum' range based on
market opportunities and future outlook of the markets.
5.66%
0.49%
0.51%
0.60%
0.75%
0.80%
0.91%
1.81%
1.93%
15.02%
71.52%
Others
Mutual Funds
Electricity, gas, steam and air
conditioning supply
Manf. of motor vehic ,trailr & semi-
trailr
Manf. of tobacco prod.
Manf. of chemic.s & chemic. prod.
Civil engineering
Manf. of coke & refined petrol. prod.
Compt prgm, consult. & related
activit.
Financial & insur. activit.
Soveriegn16.37%
71.52%
8.66%
3.45%
Equities Goverment Securities Corporate Bonds Cash and Money Markets
Pension Unit Linked
Pension Protector Fund-IIULIF02825/01/2010PNPROTE-II122
5.49%2.01%
5.09%
87.42%
AA+ AAA D SOVEREIGN

Fund Details Security Name Net Asset (%)
Equities 32.19%
HDFC Bank Ltd. 4.05%
Reliance Industries Ltd. 3.30%
Housing Development Finance Corporation Ltd. 2.27%
NAV as on October 31,2019: 20.4637 ICICI Bank Ltd. 2.14%
Inception Date: 25-Jan-10 Larsen & Toubro Ltd. 1.79%
Fund Manager: Jayesh Sundar, Nitin Garg Infosys Ltd. 1.76%
ITC Ltd. 1.46%
Fund v/s Benchmark Return (%) Tata Consultancy Services Ltd. 1.14%
1 Month 6 Months 1 Year 2 Years*
3 Years*
Inception* Kotak Mahindra Bank Ltd. 1.07%
Portfolio return 1.55% 1.97% 8.48% 3.87% 6.05% 7.60% Hindustan Unilever Ltd. 1.05%
Benchmark** 1.99% 5.48% 14.10% 7.60% 8.89% 8.94% Others 12.16%
Goverment Securities 54.85%
7.32% GOI 2024 10.87%
Targeted Asset Allocation (%) 7.72% GOI 2025 10.59%
Security Type Min Max 7.17% GOI 2028 8.23%
Debt and Money Market Instruments 55.00% 100.00% 8.17% GOI 2044 6.61%
Equity 0.00% 45.00% 9.2% GOI 2030 3.55%
6.84% GOI 2022 2.92%
8.79% Gujarat SDL 2022 2.81%
6.79% GOI 2029 2.53%
9.15% GOI 2024 2.12%
Asset Class Wise AUM 8.2% GOI 2025 1.82%
Asset Class AUM (in Cr.) Others 2.80%
Equity 3.05 Corporate Bonds 8.27%
Debt 6.43 Indiabulls Housing Finance Ltd. 4.35%
Total 9.48 Adani Ports and Special Economic Zone Ltd. 2.26%
Shriram Transport Finance Co. Ltd. 1.07%
Modified Duration#
Indiabulls Housing Finance Ltd. 0.33%
Security Type Duration Dewan Housing Finance Corporation Ltd. 0.26%
Fixed Income Investments 5.08 Cash and Money Markets 4.69%
Portfolio Total 100.00%
Asset Mix
Sectoral Break-Up$
Rating Profile
* Compound Annual Growth Rate (CAGR)
$Sector Classification is as per National Industrial Classification ( All Economic Activities) -2008 NIC
**Benchmark return has been computed by applying benchmark weightages on CRISIL Composite Bond Fund Index and NIFTY 50 INDEX
#Duration of Fixed Income Investments is a measure of sensitivity of the assets price to interest rate movement. Shorter the duration lesser is the sensitivity due to movement in interest rates.
Investment Objective: The fund is designed to provide long-term cumulative capital growth
while controlling overall risk, by availing opportunities in debt and equity markets.
The risk profile for this fund is Medium
October 2019
The actual asset allocation will remain within the 'minimum' and 'maximum' range based on
market opportunities and future outlook of the markets.
9.90%
1.00%
1.21%
1.46%
1.55%
1.79%
2.35%
3.62%
3.78%
18.49%
54.85%
Others
Electricity, gas, steam and air
conditioning supply
Manf. of motor vehic ,trailr & semi-
trailr
Manf. of tobacco prod.
Manf. of chemic.s & chemic. prod.
Civil engineering
Warehousing & support activit. for
transp.
Manf. of coke & refined petrol. prod.
Compt prgm, consult. & related
activit.
Financial & insur. activit.
Soveriegn32.19%
54.85%
8.27%
4.69%
Equities Goverment Securities Corporate Bonds Cash and Money Markets
Pension Unit Linked
Pension Balanced Fund-IIULIF02325/01/2010PNBALAN-II122
12.05% 5.10%
0.40%
82.45%
AA+ AAA D SOVEREIGN

Fund Details Security Name Net Asset (%)
Equities 49.02%
Reliance Industries Ltd. 5.02%
Kotak Mahindra Mutual Fund 4.62%
HDFC Bank Ltd. 4.01%
NAV as on October 31,2019: 22.2998 Housing Development Finance Corporation Ltd. 3.45%
Inception Date: 25-Jan-10 Larsen & Toubro Ltd. 2.73%
Fund Manager: Jayesh Sundar, Nitin Garg Infosys Ltd. 2.69%
Reliance Mutual Fund 2.60%
Fund v/s Benchmark Return (%) ITC Ltd. 2.23%
1 Month 6 Months 1 Year 2 Years*
3 Years*
Inception* ICICI Bank Ltd. 2.13%
Portfolio return 1.75% -0.51% 6.89% 2.86% 6.28% 8.56% Tata Consultancy Services Ltd. 1.74%
Benchmark** 2.46% 4.18% 14.29% 7.56% 9.66% 9.09% Others 17.80%
Goverment Securities 37.88%
7.32% GOI 2024 7.46%
Targeted Asset Allocation (%) 7.72% GOI 2025 6.42%
Security Type Min Max 7.17% GOI 2028 5.37%
Debt and Money Market Instruments 40.00% 80.00% 8.17% GOI 2044 4.82%
Equity 20.00% 60.00% 9.15% GOI 2024 3.20%
9.2% GOI 2030 2.45%
7.16% GOI 2023 1.92%
6.79% GOI 2029 1.77%
6.17% GOI 2021 1.70%
Asset Class Wise AUM 8.3% GOI 2040 1.04%
Asset Class AUM (in Cr.) Others 1.73%
Equity 5.81 Corporate Bonds 5.44%
Debt 6.04 Indiabulls Housing Finance Ltd. 2.61%
Total 11.85 Adani Ports and Special Economic Zone Ltd. 1.81%
Reliance Capital Ltd. 0.63%
Modified Duration#
Dewan Housing Finance Corporation Ltd. 0.21%
Security Type Duration Indiabulls Housing Finance Ltd. 0.18%
Fixed Income Investments 4.76 Cash and Money Markets 7.66%
Portfolio Total 100.00%
Asset Mix
Sectoral Break-Up$
Rating Profile
* Compound Annual Growth Rate (CAGR)
$Sector Classification is as per National Industrial Classification ( All Economic Activities) -2008 NIC
**Benchmark return has been computed by applying benchmark weightages on CRISIL Composite Bond Fund Index and NIFTY 50 INDEX
#Duration of Fixed Income Investments is a measure of sensitivity of the assets price to interest rate movement. Shorter the duration lesser is the sensitivity due to movement in interest rates.
Investment Objective: The fund is designed to provide long-term cumulative growth while
managing the risk of relatively high exposure to equity markets.
The risk profile for this fund is High
October 2019
The actual asset allocation will remain within the 'minimum' and 'maximum' range based on
market opportunities and future outlook of the markets.
15.65%
1.86%
1.95%
2.23%
2.38%
2.73%
5.51%
5.77%
7.22%
16.82%
37.88%
Others
Manf. of motor vehic ,trailr & semi-
trailr
Warehousing & support activit. for
transp.
Manf. of tobacco prod.
Manf. of chemic.s & chemic. prod.
Civil engineering
Manf. of coke & refined petrol. prod.
Compt prgm, consult. & related
activit.
Mutual Funds
Financial & insur. activit.
Soveriegn
49.02%
37.88%
5.44% 7.66%
Equities Goverment Securities Corporate Bonds Cash and Money Markets
Pension Unit Linked
Pension Growth Fund-IIULIF02425/01/2010PNGROWT-II122
9.15%
13.76%
1.68%
75.41%
AA+ AAA D SOVEREIGN
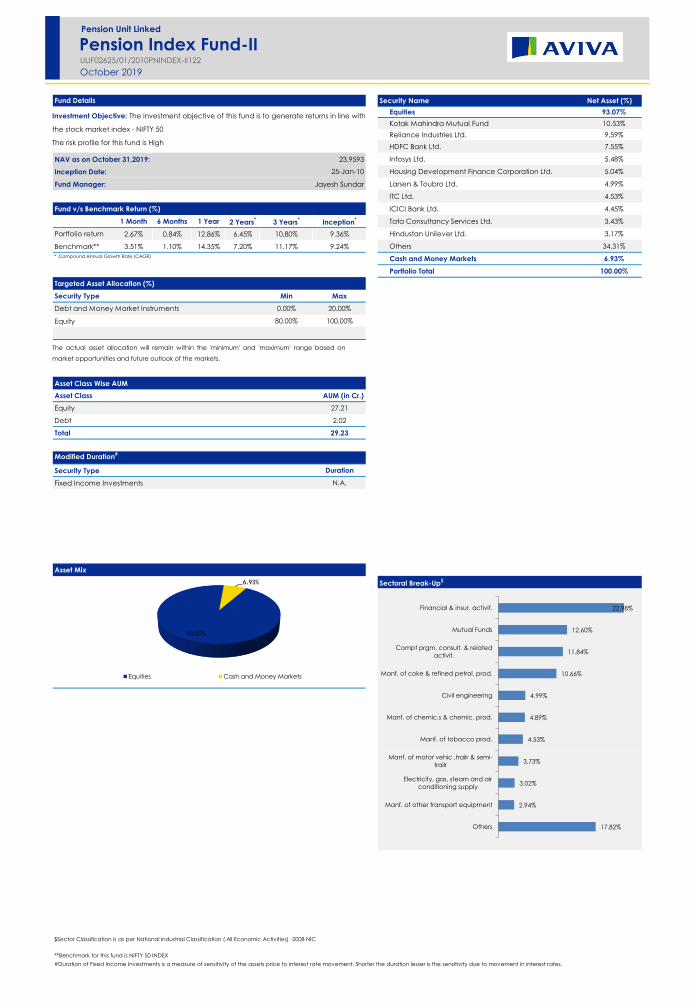
Fund Details Security Name Net Asset (%)
Equities 93.07%
Kotak Mahindra Mutual Fund 10.53%
Reliance Industries Ltd. 9.59%
HDFC Bank Ltd. 7.55%
NAV as on October 31,2019: 23.9593 Infosys Ltd. 5.48%
Inception Date: 25-Jan-10 Housing Development Finance Corporation Ltd. 5.04%
Fund Manager: Jayesh Sundar Larsen & Toubro Ltd. 4.99%
ITC Ltd. 4.53%
Fund v/s Benchmark Return (%) ICICI Bank Ltd. 4.45%
1 Month 6 Months 1 Year 2 Years*
3 Years*
Inception* Tata Consultancy Services Ltd. 3.43%
Portfolio return 2.67% 0.84% 12.86% 6.45% 10.80% 9.36% Hindustan Unilever Ltd. 3.17%
Benchmark** 3.51% 1.10% 14.35% 7.20% 11.17% 9.24% Others 34.31%
Cash and Money Markets 6.93%
Portfolio Total 100.00%
Targeted Asset Allocation (%)
Security Type Min Max
Debt and Money Market Instruments 0.00% 20.00%
Equity 80.00% 100.00%
Asset Class Wise AUM
Asset Class AUM (in Cr.)
Equity 27.21
Debt 2.02
Total 29.23
Modified Duration#
Security Type Duration
Fixed Income Investments N.A.
Asset Mix
Sectoral Break-Up$
* Compound Annual Growth Rate (CAGR)
$Sector Classification is as per National Industrial Classification ( All Economic Activities) -2008 NIC
**Benchmark for this fund is NIFTY 50 INDEX
#Duration of Fixed Income Investments is a measure of sensitivity of the assets price to interest rate movement. Shorter the duration lesser is the sensitivity due to movement in interest rates.
Investment Objective: The investment objective of this fund is to generate returns in line with
the stock market index - NIFTY 50
The risk profile for this fund is High
October 2019
The actual asset allocation will remain within the 'minimum' and 'maximum' range based on
market opportunities and future outlook of the markets.
17.82%
2.94%
3.02%
3.73%
4.53%
4.89%
4.99%
10.66%
11.84%
12.60%
22.98%
Others
Manf. of other transport equipment
Electricity, gas, steam and air
conditioning supply
Manf. of motor vehic ,trailr & semi-
trailr
Manf. of tobacco prod.
Manf. of chemic.s & chemic. prod.
Civil engineering
Manf. of coke & refined petrol. prod.
Compt prgm, consult. & related
activit.
Mutual Funds
Financial & insur. activit.
93.07%
6.93%
Equities Cash and Money Markets
Pension Unit Linked
Pension Index Fund-IIULIF02625/01/2010PNINDEX-II122
Advt. no. AN Nov 1/19 IRDAI Regist
For more details, call nowon the toll-free number
For non-MTNL/BSNLusers the number is
1 8 0 0 - 1 0 3 - 7 7 6 6 0 1 2 4 - 2 7 0 9 0 4 6(Monday to Saturday, 8 a.m to 8 p.m)
and Philosophy which are reviewed periodically. All investments are made within the Parameters laid down by the Investment Mandates and Philosophy.
Disclaimer
Benchmark Indices Provided by CRISIL
returns due to such changes in weights for sub indices. CRISIL indices are sole property of CRISIL Limited (CRISIL) indices shall not be
indices, based on data obtained for any errors or for the results obtained from the use of the indices. CRISIL especially states that it has no nancial liability whatsoever to the users of CRISIL indices.
www.avivaindia.com
Aviva Trade logo displayed above belongs to Aviva Brands Limited and is used by Aviva Life Insurance Company India Limited under License.
policies are subject to investment risks associated with capital markets and the NAVs of the units may go up or down based on the performance of the fund and factors the capital market. The insured is responsible for his/her decisions. Aviva Life Insurance Company India Limited is only the name of the Insurance Company and the various funds under this contract are the names of the unit linked life insurance contract and do not in any way indicate the quality of the contract, its future prospects or returns. Please
insurance company. The premiums and funds are subject to certain charges related to the fund or to the premium paid and there is a possibility of increase in charges. The various funds under this contract are the names of the funds and do not in any way indicate the quality of these plans, their future prospects and returns. Unit-linked funds are subjects to market risks and there is no assurance or
BEWARE OF SPURIOUS PHONE CALLS AND FICTITIOUS or FRAUDULENT OFFERS. IRDAI to public that IRDAI or its do
bonus. Public receiving such phone calls are requested to lodge a police complaint along with details of phone call, number.
CAGR- Compounded Annualised Growth Rate
Aviva Tower, Sector Road, Opp. Golf Course, Sector 43, Gurgaon, Haryana -122 003CIN: U66010DL2000PLC107880Tel: +91(0) 124 270 9000-01, Fax: +91(0) 124 257 1214E-mail: [email protected]
2nd Floor, Prakashdeep Building,7 Tolstoy Marg, New Delhi - 110 001
Aviva Life Insurance Company India Limited
BEWARE OF SPURIOUS I FRAUD PHONE CALLS!
phone calls are requested to lodge a police complaint.


