Embed Size (px)
Citation preview

University of Pennsylvania University of Pennsylvania
ScholarlyCommons ScholarlyCommons
Operations, Information and Decisions Papers Wharton Faculty Research
6-2011
Intuitive Biases in Choice Versus Estimation: Implications for the Intuitive Biases in Choice Versus Estimation: Implications for the
Wisdom of Crowds Wisdom of Crowds
Joseph P. Simmons University of Pennsylvania
Lief D. Nelson
Jeffrey Galak
Shane Fredrick
Follow this and additional works at: https://repository.upenn.edu/oid_papers
Part of the Marketing Commons, Organizational Behavior and Theory Commons, Other Business
Commons, and the Other Education Commons
Recommended Citation Recommended Citation Simmons, J. P., Nelson, L. D., Galak, J., & Fredrick, S. (2011). Intuitive Biases in Choice Versus Estimation: Implications for the Wisdom of Crowds. Journal of Consumer Research, 38 (1), 1-15. http://dx.doi.org/10.1086/658070
At the time of publication, author Joseph P. Simmons was affiliated with the Yale university. Currently (July 2016), he is a faculty member in the Operation, Information and Decision Department of the Wharton School at the University of Pennsylvania.
This paper is posted at ScholarlyCommons. https://repository.upenn.edu/oid_papers/107 For more information, please contact [email protected].

Intuitive Biases in Choice Versus Estimation: Implications for the Wisdom of Intuitive Biases in Choice Versus Estimation: Implications for the Wisdom of Crowds Crowds
Abstract Abstract Although researchers have documented many instances of crowd wisdom, it is important to know whether some kinds of judgments may lead the crowd astray, whether crowds’ judgments improve with feedback over time, and whether crowds’ judgments can be improved by changing the way judgments are elicited. We investigated these questions in a sports gambling context (predictions against point spreads) believed to elicit crowd wisdom. In a season-long experiment, fans wagered over $20,000 on NFL football predictions. Contrary to the wisdom-of-crowds hypothesis, faulty intuitions led the crowd to predict “favorites” more than “underdogs” against point spreads that disadvantaged favorites, even when bettors knew that the spreads disadvantaged favorites. Moreover, the bias increased over time, a result consistent with attributions for success and failure that rewarded intuitive choosing. However, when the crowd predicted game outcomes by estimating point differentials rather than by predicting against point spreads, its predictions were unbiased and wiser.
Disciplines Disciplines Marketing | Organizational Behavior and Theory | Other Business | Other Education
Comments Comments At the time of publication, author Joseph P. Simmons was affiliated with the Yale university. Currently (July 2016), he is a faculty member in the Operation, Information and Decision Department of the Wharton School at the University of Pennsylvania.
This journal article is available at ScholarlyCommons: https://repository.upenn.edu/oid_papers/107

Carnegie Mellon UniversityResearch Showcase @ CMU
Tepper School of Business
12-2009
Intuitive Biases in Choice vs. Estimation:Implications for the Wisdom of CrowdsJoseph P. SimmonsYale University
Lief D. NelsonUniversity of California - Berkeley
Jeffrey GalakCarnegie Mellon University, [email protected]
Shane FrederickYale University
Follow this and additional works at: http://repository.cmu.edu/tepper
Part of the Economic Policy Commons, and the Industrial Organization Commons
This Working Paper is brought to you for free and open access by Research Showcase @ CMU. It has been accepted for inclusion in Tepper School ofBusiness by an authorized administrator of Research Showcase @ CMU. For more information, please contact [email protected].

1
Intuitive Biases in Choice vs. Estimation:
Implications for the Wisdom of Crowds
Joseph P. Simmons Leif D. Nelson Jeff Galak Shane Frederick
Yale University University of California at Berkeley
Carnegie Mellon University Yale University
Joseph P. Simmons is Assistant Professor of Marketing, Yale School of Management, 135 Prospect Street, New Haven, CT 06520 (e-mail: [email protected]; phone: 203-432-6670). Leif D. Nelson is Assistant Professor of Marketing, Haas School of Business, University of California at Berkeley, Berkeley, CA 94720 (e-mail: [email protected]; phone: 510-643-8918). Jeff Galak is Assistant Professor of Marketing, Tepper School of Business, Carnegie Mellon University, 5000 Forbes Avenue, Pittsburgh, PA 15213 (e-mail: [email protected]; phone: 412-268-5810). Shane Frederick is Associate Professor of Marketing, Yale School of Management, 135 Prospect Street, New Haven, CT 06520 (e-mail: [email protected]; phone: 203-436-8122). This research was partially funded by a Whitebox Behavioral Studies Fellowship Grant awarded to Joseph P. Simmons.

2
Although researchers have documented instances of crowd wisdom, it is important to know
whether some kinds of judgments may lead the crowd astray, whether crowds’ judgments
improve with feedback over time, and whether crowds’ judgments can be improved by changing
the way judgments are elicited. We investigated these hypotheses in a sports gambling context
(predictions against point spreads) believed to elicit crowd wisdom. In a season-long experiment,
fans wagered over $20,000 on NFL football predictions. Contrary to the wisdom-of-crowds
hypothesis, faulty intuitions led the crowd to predict “favorites” more than “underdogs” against
spreads that disadvantaged favorites, even when bettors knew that the spreads disadvantaged
favorites. Moreover, the bias increased over time, a result consistent with attributions for success
and failure that rewarded intuitive choosing. However, when the crowd predicted game outcomes
by estimating point differentials rather than by predicting against point spreads, its predictions
were unbiased and wiser.
Keywords: Heuristics and Biases, Intuition, Learning, Attributions, Preference Reversals

3
Decades of research have uncovered the many ways in which consumers’ judgments err (e.g.,
Alba and Hutchinson 2000; Bettman, Luce, and Payne 1998; Gilovich, Griffin, and Kahneman
2002; Kahneman and Tversky 2000; Simonson 1989; Thaler 1985), as well as the many ways in
which consumers’ judgments might be improved (e.g., Bertrand, Mullainathan, and Shafir 2006;
Huber 1975; Thaler and Sunstein 2008). One of the more intriguing suggestions for improving
judgments comes from a rapidly growing literature on the wisdom of crowds. The wisdom-of-
crowds hypothesis predicts that the independent judgments of a crowd of individuals (as
measured by any form of central tendency) will be relatively accurate, even when most of the
individuals in the crowd are ignorant and error-prone (Surowiecki 2004). Examples abound
(Dunning 2007; Hastie and Kameda 2005; Sunstein 2006; Surowiecki 2004; Yaniv 2004). Lorge,
Fox, Davitz, and Brenner (1958) found that students’ average estimate of the temperature of a
classroom was only 0.4 degrees from accuracy, a result that was better than 80% of the
individuals’ judgments. Treynor (1987) asked 56 students to estimate the number of jelly beans
in a jar. The average guess was 871, very close to the true number of 850, and better than 98% of
the students’ individual guesses. And, Francis Galton (1907) reported the results of a regional
fair competition that required people to estimate the weight of an ox. The average estimate was
1,197, just one pound away from the 1,198-pound ox’s true weight!
The wisdom-of-crowds hypothesis has tremendous practical implications. First, it suggests
that decisions made by majority rule (or by averaging opinions) will often outperform decisions
made by single judges or experts (Hastie and Kameda 2005; Larrick and Soll 2006; Soll and
Larrick 2009) or decisions made by group discussion (Sunstein 2006). Second, it suggests that
decisions made by majority rule (or by averaging opinions) will often be accurate in an absolute
sense, an implication that partially accounts for the rapidly increasing use of information markets

4
to forecast events and to inform policy decisions (Hahn and Tetlock 2006; Ho and Chen 2007).
Indeed, as detailed below, crowd wisdom has been implicated as a cause of market efficiency1
(Surowiecki 2004; Treynor 1987).
Although researchers have documented many instances of crowd wisdom, it is important to
go beyond these demonstrations to know whether some kinds of judgments may lead the crowd
astray. Furthermore, do crowds’ judgments improve with feedback over time? Can different
methods of elicitation yield better (or worse) judgments? This paper investigates these questions
in a sports gambling context that (1) tends to arouse potentially misleading intuitions, but (2)
features prices that are widely believed to reflect crowd wisdom.
The Conditions of Crowd Wisdom
The wisdom-of-crowds hypothesis derives from mathematical principles. If a crowd’s
judgment is comprised of signal-plus-noise, averaging judgments will cancel out the noise and
extract the signal (Hogarth 1978; Makridakis and Winkler 1983).
Two conditions are necessary for the production of crowd wisdom. First, and most obviously,
at least some members of the crowd must possess, and be motivated to express, relevant
knowledge. For example, a crowd comprised entirely of people who know nothing at all about
major league baseball would err considerably if its members were asked to predict the 2010
batting average of Nick Markakis. Second, individual errors in judgment must not be systematic.
For example, if all of the judges in a crowd make the same mistake, then averaging responses
1 Of course, market efficiency can arise even when crowds are predominantly unwise, so long as the market’s structure encourages and allows a minority of wise traders to drive prices (e.g., Forsythe, Rietz, and Ross 1999; Oliven and Rietz 2004). Nevertheless, as detailed below, scholars attribute the efficiency of some markets – especially point spread betting markets – to crowd wisdom, thereby implying that the wisdom of such markets is dependent on, and indicative of, the wisdom of the crowd of bettors.
5
will obviously not negate the error. Because systematic errors compromise the production of
crowd wisdom, it is important to identify, and foster, conditions that decrease the likelihood of
such errors. Scholars have emphasized two such conditions – independence and diversity.
Independence is important because judges who talk to one another are likely to share the same
knowledge, and, hence, the same errors. In addition, group discussion can reinforce or even
exacerbate individuals’ biases (Sunstein 2006). Similarly, diversity is important because even
judges who do not interact may share the same knowledge (e.g., because they acquire
information from the same sources) or desires, and may therefore fall prey to the same errors.
For example, salient but ill-founded rumors about, say, a company’s intention to acquire another
company, may influence the crowd’s majority, and the crowd may consequently err in its
assessment of the company’s value (Shiller 2005).
In sum, wisdom-of-crowds proponents predict that crowds will be wise when the crowds’
judges are (1) knowledgeable, (2) motivated to be accurate, (3) independent, and (4) diverse. The
empirical question is whether this prediction is generally true.
Although most wisdom-of-crowds researchers have focused on documenting the surprising
ability of crowds to make wise judgments, it is understood that crowds will perform poorly
(relative to accuracy) when they are systematically biased. Thus, one threat to the generality of
the wisdom-of-crowds hypothesis is the possibility that knowledgeable and motivated judges
may systematically err even when the conditions of diversity and independence are met. Indeed,
researchers in psychology, marketing, economics, and finance have spent decades documenting
systematic biases in the ways in which individuals make judgments and decisions (e.g., Bettman,
Luce, and Payne 1998; Gilovich, Griffin, and Kahneman 2002; Kahneman and Tversky 2000;
Simonson 1989). For example, research shows that, on average, people are overly optimistic:

6
They judge the outcomes of favorable events to be more likely than the outcomes of unfavorable
events (e.g., Forsythe, Rietz, and Ross 1999; Krizan and Windschitl 2007; Kunda 1990).
Nevertheless, proponents of the wisdom-of-crowds hypothesis may find it easy to explain away
this evidence. First, they may contend that many systematic biases arise only among populations
(e.g., college students) that lack the requisite knowledge or only under conditions that provide no
incentives for accurate responses. Second, systematic biases that persist even among the highly
motivated and highly knowledgeable (e.g., optimism) may nevertheless produce errors that
cancel out in a diverse sample (e.g., Camerer 1998). Thus, even if people tend to overestimate
the likelihood of their preferred outcome, a crowd comprised of people with different preferences
may produce an average judgment that converges on the right answer. Finally, wisdom-of-
crowds proponents may acknowledge that crowd wisdom will be compromised when judges are
systematically biased, while contending that such instances are rare in real market settings (List
2003).
Thus, a fair test of the wisdom-of-crowds hypothesis requires an investigation of a crowd of
knowledgeable, independent, and diverse participants that has incentives to make accurate
judgments in a realistic market setting. In this paper we report a 17-week-long experimental
investigation that meets these requirements. Specifically, we examine whether a crowd of
knowledgeable NFL football fans exhibits wisdom or ignorance in a betting context that has been
cited as an important example of crowd wisdom.
Point Spread Betting Markets

7
Point spread betting markets offer one of the most celebrated real-world examples of crowd
wisdom (Surowiecki 2004), and one with enormous consequences. According to the American
Gaming Association (2008), American consumers wagered $2.6 billion on sporting events in
Nevada in 2007, and the AGA’s website reports that that number represents less than 1% of all
sports betting nationwide. By their estimate, $380 billion is wagered on sporting events every
year. That is more than the GDP of Denmark.
To illustrate how these markets work, consider a National Football League (NFL) game
between the Baltimore Ravens and the Washington Redskins. At the time of this writing (and,
frankly, throughout most of history), the Ravens are vastly superior to the Redskins, and so, in
the parlance of gambling, the Ravens would be deemed the favorite and the Redskins would be
the underdog. When gamblers attempt to bet on football or basketball games, they often do so
against a point spread, a point amount that is subtracted from the favorite’s score so as to better
equate the two teams. A bet on the favorite wins only if the favorite wins by more than the point
spread. A bet on the underdog wins if the favorite wins by less than the point spread or if the
underdog wins the game. If the favorite’s margin of victory is equal to the point spread, then the
outcome of the bet is a tie and no money changes hands.
Many scholars and laypeople believe that point spreads are designed to generate equal
betting on both teams (Avery and Chevalier 1999; Dana and Knetter 1994; Gandar, Zuber,
O’Brien, and Russo 1988; Gray and Gray 1997; Lee and Smith 2002; Oskarsson, Van Boven,
McClelland, and Hastie 2009; Snowberg, Wolfers, and Zitzewitz 2005; Surowiecki 2004).
According to this view, oddsmakers employed by casinos set an initial point spread, and bettors
begin placing bets by deciding whether the favorite will win by more or less than the spread.
Once the betting starts, oddsmakers adjust the point spread in an attempt to generate equal bets

8
on both teams. For example, if most early bettors bet on the favorite, then the spread will be
slightly increased in order to entice future gamblers to bet on the underdog. Because gamblers
have to risk $11 in order to win $10, generating equal bets on each team guarantees a 5% profit
for casinos, which are assumed to pursue this strategy in order to guarantee a profit and to avoid
risking a loss on any of the games.
If point spreads generate equal bets on each team, then point spreads provide a reliable
measure of the public’s prediction of game outcomes. Surowiecki (2004) writes, “a game’s point
spread ends up representing bettors’ collective judgment of what the final outcome of that game
will be,” a belief that is implicitly or explicitly endorsed in many academic investigations of
point spread markets (Avery and Chevalier 1999; Dana and Knetter 1994; Gandar et al. 1988;
Gray and Gray 1997; Lee and Smith 2002; Snowberg et al. 2005).2 Moreover, if point spreads
provide a measure of collective belief, then the accuracy of point spreads provides a measure of
collective wisdom. And, in fact, point spreads are extremely accurate (Radzevick and Moore
2008; Sauer 1998), and very difficult for gamblers to consistently defeat (Simmons and Nelson
2006). On precisely this basis, Surowiecki (2004, p. 13) has concluded, “The public . . . is pretty
smart,” and point spread accuracy is attributed to the emergence of crowd wisdom.
Unfortunately, this rosy conclusion is based on a false assumption. Point spreads do not, as is
commonly believed, typically equate the bets on both teams (Jeffries and Oliver 2000; Levitt
2004; Roxborough and Rhoden 1998; Simmons and Nelson 2006), and therefore point spreads
2 For example, Dana and Knetter (1994) say that the spread “can be thought of as the best forecast of bettor behavior, rather than the best forecast of the game outcome” (p. 1318), Avery and Chevalier (1999) report that “most accounts of the [point spread betting] market emphasize the propensity of casinos to set and alter the [spread] over time to balance betting” (p. 502), and Snowberg, Wolfers, and Zitzewitz (2005) write that “half of the bets fall on either side” of the spread and that “the spread reveals the market’s expectation of the median” outcome (p. 367). As evidence of the tenacity with which some people hold this belief, consider the following quotation from a November 17 2008 New York Times article: “Normally, sports books set [spreads] to encourage equal betting on both sides – ensuring the book a commission-based profit regardless of the winner. But . . . bets on this [Steelers-Chargers] game ran 4 to 1 in favor of the Steelers.”

9
do not represent the crowd’s prediction of game outcomes.3 As a consequence, point spread
accuracy cannot be attributed to crowd wisdom (but rather to the expertise of those who set and
adjust the spreads). Thus, the efficiency of point spread betting markets is not indicative of
crowd wisdom, and whether crowds are wise or unwise in these markets is a question that must
be answered by directly assessing the wisdom of gamblers.
Investigating Crowd Wisdom in Point Spread Betting Markets
In point spread betting markets, wise crowds will predict without systematic bias and will
choose wisely against inaccurate point spreads. However, past research suggests that wisdom
may not prevail in this context (and in many contexts in which emotional, intuitive responses
conflict with more rational, deliberative responses; Simmons and Nelson 2006). When predicting
against point spreads, bettors’ initial inclination – their intuition – is to believe that the superior
team (the favorite) will win against the spread.4 Moreover, bettors are usually quite confident in
their intuition to choose the favorite – in Simmons and Nelson’s (2006) parlance, most bettors
have high intuitive confidence – and are therefore quite reluctant to abandon it. Thus, although
point spreads are very accurate, bettors bet on favorites much more often than they bet on
underdogs against point spreads, and they seem to lend insufficient weight to point spreads when
3 In fact, point spreads rarely generate equal betting on each team, and so casinos often risk losing money on individual games. For example, in a sample of NFL football betting data that we scraped from Sportsbook.com’s website in 2006 (N = 192 games), we found that only 5.2% of the games featured a distribution of wagers that guaranteed a profit for the casino, meaning that the casino faced the possibility of a loss (and the possibility of a big win) in over 94% of the games. Levitt (2004) similarly finds that “the bookmaker does not appear to be trying to set prices to equalize the amount of money bet on either side of a wager” (p. 225). Casinos, it seems, adopt a long-term strategy that involves accepting losses on individual games in favor of making a profit over a large sample of games. 4 In keeping with Simmons and Nelson (2006), we define an intuition as a first impression that is based on a subset of the relevant information. In this context, bettors’ intuitions are based only an assessment of which team they believe will win the game. Their first impressions ignore the point spread, and other relevant information (e.g., home field advantage).
10
assessing which team is going to win against the spread (Levitt 2004; Simmons and Nelson
2006). Indeed, an analysis of predictions made by thousands of people competing in a fantasy
football league found that the majority – the crowd – predicted favorites in over 90% of the
games in their sample, even though favorites and underdogs were equally likely to win against
the spread (Simmons and Nelson 2006).
Of course, when bets on favorites and underdogs are equally likely to win, betting on
favorites more than underdogs does not constitute evidence that crowds are unwise, any more
than would a systematic tendency to bet “tails” on a series of fair coin flips. Indeed, the wisdom-
of-crowds hypothesis hinges on whether bettors predict accurately against inaccurate point
spreads, such as those designed to exploit their judgmental tendencies. Indeed, although
systematically betting on “tails” is at worst merely peculiar when the coin is fair, it is distinctly
unwise if the coin systematically, and detectably, favors heads. Thus, it is important to know
whether crowds bet on favorites more than underdogs even when point spreads are increased
(and therefore biased against favorites). To date, only one study has investigated this question
(Simmons and Nelson 2006, Study 3b), and it did find that people predicted favorites more often
than underdogs against increased spreads, a fact that decreased the accuracy of their predictions.
However, this study did not provide an adequate test of the wisdom of crowds. Most notably, the
study used a sample (undergraduate football fans from Princeton University) that was lacking in
diversity and knowledge, two ingredients that are necessary for the production of crowd wisdom.
The experiment described below provides a rigorous and more comprehensive test of the
wisdom-of-crowds hypothesis in this setting. We asked a knowledgeable and diverse sample of
NFL football fans to predict NFL games against point spreads for the entirety of the 2007 17-
week NFL season. The study’s sample met all of the knowledge and diversity requirements

11
suggested by wisdom-of-crowds proponents. And, critically, the point spreads were increased,
therefore allowing us to test whether crowds are appropriately sensitive to these increases, or
whether they will wrongly choose favorites over underdogs the majority of the time.
Importantly, this experiment also allowed us to investigate three additional questions related
to the wisdom-of-crowds hypothesis. First, because the study was conducted over 17 weeks, this
experiment gave us the opportunity to examine whether crowd wisdom improves with feedback
over time. Indeed, it seems sensible to expect crowds to get better over time, especially as bettors
accumulate feedback that suggests that choosing favorites is unwise. Second, although the
strongest version of the wisdom-of-crowds hypothesis predicts that people will be sensitive to
minor adjustments to the point spread even when they are not told of these adjustments
(Surowiecki 2004), it is possible that a weaker version is more accurate – that people will
abandon their intuitions and respond to point spread adjustments only if they are told that
adjustments may have taken place. In this experiment, we warned a randomly chosen subset of
the participants that many of the point spreads were increased, allowing us to test whether crowd
wisdom increases when participants know that, and how, point spread adjustments have been
made. Third, as discussed in the next section, this experiment tested whether crowd wisdom
depends on how predictions are elicited.
Does Crowd Wisdom Depend on How You Ask The Question?
In point spread betting markets predictions are elicited by asking gamblers to choose which
team to bet on against a given point spread, and when faced with this choice gamblers predict
favorites more than underdogs (Levitt 2004; Simmons and Nelson 2006). But what if predictions

12
were elicited not by asking people to choose against provided point spreads, but instead by
asking people to estimate the point differential directly? On the one hand, the two questions are
logically equivalent, and so one might expect them to elicit identical predictions. Indeed, when
people predict that the favorite will win against a 10-point spread, they should also estimate the
favorite to win by more than 10 points.
On the other hand, much research shows that logically identical methods of judgment
elicitation can yield quite different judgments (Carmon and Simonson 1998; Fischer, Carmon,
Ariely, and Zauberman 1999; Grether and Plott 1979; Shafir and LeBoeuf 2002; Slovic and
Lichtenstein 1983; Tversky, Sattath, and Slovic 1988; Tversky and Thaler 1990). Such
preference reversals emerge because different ways of asking the same question induce different
considerations and thought processes. In the point spread betting context, people who are making
choices have to ask themselves, “Is the point spread big enough to convince me to abandon my
intuition that the favorite is the right choice?” and the high confidence that people have in their
intuitions often causes them to underweight the point spread’s magnitude and to answer “No” to
this question (Simmons and Nelson 2006). However, those generating estimates have only to ask
themselves, “What will the point differential be?,” a question that may focus them on the very
dimension (the point spread) that typically receives insufficient weight when they are asked to
decide which team to bet on. Thus, it is possible that although choosing against point spreads
induces predictions that are biased in favor of intuition, estimating the exact point differential of
each game induces predictions that are less biased—and therefore wiser.
In the experiment described below, we asked some of the participants to estimate the exact
point differentials of each NFL football game, and they were rewarded based on how closely
their prediction matched the eventual game outcome. This allowed us to test whether estimating

13
exact point differentials yields less biased and more accurate predictions than choosing against
point spreads and, thus, whether crowd wisdom is affected by how predictions are elicited.
THE EXPERIMENT
Participants
About one month before the start of the 2007 NFL football season, we recruited NFL fans to
participate in a season-long NFL football study. We recruited participants by sending an e-mail
to members of a website that we use to conduct experiments, and we asked the members to
forward the invitation on to NFL fans. People interested in participating followed a link to a
webpage that asked them to provide their name, location (city and state), and favorite team. In
addition, in an effort to identify knowledgeable NFL football fans, we asked them to rate how
closely they followed the 2006 NFL football season (1 = not at all; 7 = extremely), and we asked
them to recall, without looking up the answer, the two teams that played in the previous season’s
Super Bowl.
Over 1,000 people expressed interest in participating in the study, and more than 80% of
them were not members of the website, and thus the by-product of word-of-mouth solicitations.
We invited 240 people to register for the study a week before the start of the NFL season, 60
people for each of four experimental conditions. Of these, 178 (74.2%) did so, and only those
who registered prior to the first week were invited to participate in subsequent weeks.
Though we did not advertise this fact, only those who reported following the previous NFL
season “extremely closely” (i.e., a “7” on the scale) and who knew which teams played in the

14
previous season’s Super Bowl were deemed eligible for participation. Moreover, as indicated in
an end-of-study survey, Table 1 shows that our participants followed the 2007 NFL football
season extremely closely and spent a great deal of time reading about and watching the NFL.
Indeed, if one conservatively assumes that the average NFL game lasts 3 hours, Table 1 shows
that the median participant reported spending about 16 hours per week consuming NFL-related
media. This is equivalent to about 1/7 of a typical person’s non-sleeping hours.
Our sample was demographically and geographically diverse. Seventy percent of our
participants were male, and their ages ranged from 18 to 60 years old, with an average age of 33.
Our final sample of 178 participants lived in 40 different U.S. states (the most common state was
California, the home of 9.6% of our sample). In addition, our sample had diverse rooting
interests, as each of the 32 NFL teams was represented among the list of participants’ favorite
teams (the most common favorite team was the Pittsburgh Steelers, preferred by 11.2% of our
sample).
Experimental Conditions
At the start of the season participants were randomly assigned to one of four experimental
conditions, and they remained in their assigned condition for the duration of the experiment.
Participants assigned to the “Choice” condition (n = 43) predicted NFL football games
against point spreads that were increased relative to the official point spread. They were not told
that the point spreads were increased. Participants in the “Warned Choice” condition (n = 39)
faced an identical task, except that each week they were told that some of the point spreads were
increased. Specifically, before making their predictions each week, they read, “Although official

15
point spreads are designed to give each team an equal chance to win the bet, the point spreads
inserted below are not necessarily the official point spreads. In fact, some of the point spreads
have been increased, though none of them have been decreased. If you have read these
instructions, please click the box below.” Participants then clicked a box to indicate that they had
read the warning.
Participants in the “Estimate” condition (n = 45) did not make predictions against point
spreads. Instead, they simply predicted which team would win the game and by how many
points. Finally, participants in the “Choice/Estimate” condition (n = 51) predicted each game
against a point spread before predicting the game’s exact point differential.
Procedure
Participants logged on to a website each week to make their predictions. The website served
as a home base for participants, who could use the 24-hour site not only to make predictions, but
also to check on the rules of participation, to review the terms of payment, to contact the
experimenters, and to access their betting histories. A participant’s betting history webpage
featured a list of every prediction he made, and also kept an updated tally of the money he earned
while participating in the study.
Every Thursday of the 17-week NFL football season, participants received an e-mail inviting
them to make their predictions for the week. Although some NFL games were played on
Thursdays, Saturdays, and Mondays, the vast majority of games were played on Sundays, and
only Sundays featured at least one NFL game every week (in fact, it always featured at least 11
NFL games). Because of this, and to foster a weekly routine, we asked participants to predict

16
only games played on Sundays. In total, they were asked to predict the outcomes of 226 games.
They could submit their predictions up until one hour before the first game of the week was
scheduled to begin (their usual deadline was 12 pm Eastern Time on Sunday), and once their
predictions were submitted they could not alter them. Participants who did not submit their
predictions by Saturday afternoon were sent a reminder e-mail, and those who missed the
deadline did not participate in that particular week of the study (but they were invited to
participate in all subsequent weeks).
Each week, participants in the Choice and Warned Choice conditions were presented with the
list of games that would be played on Sunday. Each game listed the visiting team followed by the
home team, and the point spread was provided in parentheses next to the favorite, as is
customary. For example, a game played between the visiting Miami Dolphins and the home
Washington Redskins appeared as, “Miami Dolphins at Washington Redskins (-4.0).” The “(-
4.0)” was the point spread, meaning that a bet on the Redskins would win if the Redskins won by
more than 4 points, and a bet on the Dolphins would win if the Redskins won by less than 4
points or if the Dolphins won the game. Before making their predictions in the first week of the
season, participants in the Choice and Warned Choice conditions underwent a tutorial to ensure
that they understood the rules of predicting against point spreads, and they could access this
tutorial via the study’s website at any time. No participants ever questioned the rules or
challenged their earnings, facts that strongly suggest that all participants understood the rules of
predicting against point spreads.
The wisdom-of-crowds hypothesis predicts that crowds will take advantage of attempts to
exploit them, thereby emerging “wise.” To test this, the point spreads were adjusted in an attempt
to exploit previously identified systematic tendencies. Most notably, because prior research

17
found that people are more likely to bet on favorites than on underdogs (at least against accurate
point spreads), we increased the point spreads for every game, thereby making underdogs more
likely to win against the spread. In addition, prior research has found that people are more likely
to bet on visiting favorites than on home favorites, presumably because people underestimate the
NFL’s significant home field advantage (Levitt 2004; Simmons and Nelson 2006). In an attempt
to exploit this potential source of error, we increased the spreads a greater amount (3 points)
when the favorite was the visiting team than when it was the home team (1 point). All spread
adjustments were made on Wednesday evening of each week, and so those adjustments were
based on official point spreads retrieved at that time (we retrieved the spreads from
vegasinsider.com). Although slight changes to the official spreads between Thursday and Sunday
were common – due to news of injuries, weather, etc. (Roxborough and Rhoden 1998) – the
spreads we provided were never altered once participants were invited to make their predictions
on Thursday. This ensured that all participants made predictions against the same point spreads,
regardless of when their predictions were submitted.
Participants in the Choice and Warned Choice conditions were asked to assign one of five
possible wager amounts to each prediction: $0.50, $1.00, $1.50, $2.00, or $2.50. Requiring
participants to wager at least $0.50 on each game ensured that they were motivated to accurately
predict every game. Because we had a limited, though reasonably sized, budget for this study,
the sum of participants’ weekly wager amounts could not exceed an average of $1.50 per game.
For example, participants could not wager more than $21.00 in a week featuring 14 games.
Participants were instructed that, within each week, a winning bet would earn them the amount
they wagered, a losing bet would lose them the amount they wagered, and a tie would earn them
$0. Importantly, to help prevent systematic attrition, all weeks were independent and participants

18
could never lose money by participating in this study. For example, if a given week resulted in
$5 worth of winnings, then the participant won $5 and that was his to keep no matter what his
performance was during subsequent (or previous) weeks. If, however, a given week resulted in a
total loss, then this was not treated as a loss but rather as a gain of $0. These rules were
implemented to encourage participants to participate each week of the season, no matter how
much they had won or lost previously, and no matter how much they expected to win or lose in
the future. At the same time, these rules did not disturb participants’ incentives to provide
accurate predictions each week. Participants in all conditions received a gift certificate for the
amount of their winnings at the end of the season.
Each week, participants in the Estimate condition were presented with the list of games to be
played on Sunday, but the games were presented without point spreads. Thus, the
Dolphins/Redskins game alluded to earlier was presented simply as “Miami Dolphins at
Washington Redskins.” For each game, participants first predicted which team would win the
game and then they predicted how many points the winning team would win by. Participants
were paid based on how closely their prediction matched the actual game outcome. They were
paid $2.50 for a perfect prediction, $2.00 for a prediction that deviated by one point, $1.50 for a
prediction that deviated by two points, $1.00 for a prediction that deviated by three points, and
$0.50 for a prediction that deviated by four points. Participants earned nothing for predictions
that deviated by more than four points.
Finally, participants in the Choice/Estimate condition first made a prediction against the
same point spreads featured in the Choice and Warned Choice conditions. Then, as in the
Estimate condition, they predicted which team would win the game and by how many points.
Although participants in this condition first made a prediction against a point spread, they did not

19
set wager amounts, and they were not compensated based on the accuracy of this prediction.
Rather, their compensation was based solely on their point differential prediction, exactly as
participants in the Estimate condition were compensated. We included this condition to help us
determine whether any differences that arose between the Choice and Estimate conditions were
attributable to (1) merely considering the point spreads and/or (2) being asked to predict the
exact point differential of the game.
Follow-Up Survey
Approximately one week after the season ended, participants were asked to complete an
online follow-up survey, and 167 of the 178 original respondents did so. We constructed two
versions of the survey – one for participants in the Choice and Warned Choice conditions and
one for participants in the Estimate and Choice/Estimate conditions. For all participants, the
survey asked them questions (shown in Table 1) designed to assess their level of involvement in
NFL football. All participants were also asked to rate their liking of each of the 32 NFL teams on
a scale ranging from -3 (strongly dislike) to +3 (strongly like). Finally, only Choice and Warned
Choice participants (1) indicated whether they believed the point spreads were generally
unbiased, too high, or too low, and (2) completed a survey designed to assess whether they
attributed winning or losing predictions to luck or to skill (described in more detail below).
RESULTS
Attrition

20
Attrition was minimal in this study. Of the 178 original participants, only 9 (5.1%) quit
before Week 10, and only 12 (6.7%) quit before Week 14. The average participant made 202
predictions (89.4%), participated in 15.2 weeks, and quit 16.1 weeks into the 17-week season.
Importantly, these measures of attrition did not differ by condition (ps > .65). Within the two
Estimate conditions, attrition did not correlate with earnings (ps > .18). Within the two Choice
conditions, attrition did correlate with earnings: Participants who remained in the study longer
tended to earn more money per prediction than participants who quit the study earlier (rs > .40,
ps < .001). If one assumes that participants who remained in the study were better predictors of
NFL football games than participants who quit, this pattern of attrition would favor the
hypothesis that, within the Choice conditions, the crowd will perform better over time. As
reported below, this hypothesis was not confirmed.
In sum, attrition in this study was very low, and it did not differ by condition. Because of
this, and because the results reported below are not affected by removing participants who quit
the study early, we included all participants in the analyses reported below.
The Choice Conditions
According to the wisdom-of-crowds hypothesis, a majority of knowledgeable, motivated,
independent, and diverse individuals will choose wisely when predicting against inaccurate point
spreads, even when they are not told that the point spreads are inaccurate. To test this hypothesis,
we determined, for each game, the Choice condition crowd’s prediction against the spread. We
did this in two different ways. By the “wager” method, we determined whether the percentage of

21
money wagered on the favorite was greater than, less than, or equal to 50%, indicating a choice
of “favorite,” “underdog,” or “no preference,” respectively. This method gave greater weight to
participants who bet more money on the game. By the “counting” method, we simply determined
whether the percentage of people choosing the favorite was greater than, less than, or equal to
50%. This method gave each participant equal weight regardless of how much they wagered on
the game. For simplicity, we will report only the results of the wager method except when the
results of the two methods differ. However, results of the counting method are included in Tables
2, 3, 4, 5, and 6.
Because all of the point spreads in this study were increased, favorites lost more games than
they won against the spread (98 wins, 124 losses, and 4 ties), and predicting favorites was
therefore an unwise strategy. The wisdom-of-crowds hypothesis predicts that the Choice
condition crowd will (1) tend to choose underdogs more than favorites against increased point
spreads, (2) win more games than it loses, and (3) outperform most of its individual members.
None of these predictions was confirmed (see Tables 2, 3, and 4). In contrast to the wisdom-of-
crowds hypothesis, the Choice condition crowd unwisely bet on the favorite in 89.4% of the
games in the sample, χ2 (1, N = 226) = 140.19, p < .001, thus exhibiting the same strong
tendency to choose favorites found in research using unbiased spreads (Simmons and Nelson
2006). As a result, the Choice condition crowd lost significantly more games (56.8%) than it won
(43.2%), χ2 (1, N = 222) = 4.05, p = .044, and the crowd performed worse than 93% of its
individual members. Clearly, crowd wisdom was absent from this condition.
Although the strong version of the wisdom-of-crowds hypothesis predicts that crowds will
predict wisely against inaccurate point spreads, a weaker version predicts that crowds will
predict wisely only when they are told that the spreads are inaccurate. Consistent with this, the

22
Warned Choice condition crowd, which was told that some of the spreads were increased,
predicted slightly fewer favorites than the Choice condition crowd: using the wager method, χ2
(1, N = 226) = 4.15, p = .041; using the counting method, χ2 (1, N = 226) = 1.77, p = .182.
However, as shown in Tables 2, 3, and 4, the Warned Choice condition crowd also predicted
favorites for the vast majority of the games (82.7%), χ2 (1, N = 226) = 96.92, p < .001, also lost
(57.9%) more games than it won (42.1%), χ2 (1, N = 221) = 5.54, p = .018, and also performed
worse than almost all (97.4%) of its individual members. Thus, the crowd was unwise even when
its members were told that the spreads were increased.5
The small effect of warning on predictions may have been due to the failure of participants in
the Warned Choice condition to attend to or believe the warning. However, there are reasons to
doubt this. First, we required all participants in the Warned Choice condition to check a box to
indicate that they had read the warning, thus making it very difficult for them to ignore it
completely. Second, favorites lost more often than they won in this study; thus, participants were
exposed to feedback consistent with the warning, which should have increased their tendency to
believe it. Third, in the end-of-season survey, most of the participants in the Warned Choice
condition reported that the spreads were too high (65.7%) vs. too low (5.7%) or unbiased
(28.6%). Moreover, the tendency to believe that the spreads were too high was greater in the
Warned Choice condition than in the Choice condition (42.5%), χ2 (1, N = 75) = 4.04, p = .044.
This suggests that most participants attended to the warning and believed it.6
5 Although point spreads were increased by a greater amount when the favorite was the visiting team than when the favorite was the home team, the Choice condition crowd predicted visiting favorites (94.6%) more often than home favorites (85.8%), χ2 (1, N = 226) = 4.39, p = .036. This suggests that the crowd underestimated the effect of home field advantage (Levitt 2004; Simmons and Nelson 2006). In the Warned Choice condition, the crowd predicted visiting favorites (87.9%) slightly more often than they predicted home favorites (79.9%), χ2 (1, N = 225) = 2.52, p = .113. 6 The Warned Choice condition results presented in Tables 2, 3, and 4 are unchanged if we include only participants who reported that the spreads were “too high” in the end-of-season survey. Thus, even a crowd comprised solely of those who acknowledged that the spreads were biased against favorites predicted favorites (78.7%) more than

23
We have argued that the Choice and Warned Choice crowds predicted more favorites than
underdogs because they unwisely believed that favorites were more likely to beat the spread.
Alternatively, it could be argued, the crowd may have wisely believed that favorites were less
likely to win, but chose to forego financial gain in the service of a preference for betting on
favorites. If this were true, then we would expect participants to have wagered less on favorite
predictions than on underdog predictions, in order to minimize the financial stake in an enjoyable
but unwise selection. Alternatively, if participants were simply unwise in their assessment of the
game outcome, then they should either have wagered an equal amount on predicted favorites and
predicted underdogs, or, if they were (unwisely) more confident in favorite than underdog
predictions, they should have wagered more on predicted favorites than on predicted underdogs.
In fact, participants wagered more money per predicted favorite than per predicted underdog
(Simmons and Nelson 2006). Across games, Choice condition crowd members wagered an
average of $1.45 on each favorite prediction and $1.28 on each underdog prediction, t(225) =
9.94, p < .001. Warned Choice condition crowd members wagered an average of $1.48 on each
favorite prediction and $1.37 on each underdog prediction, t(224) = 6.37, p < .001.7 These results
favor the conclusion that crowds unwisely believed that favorites would win against the spread,
and challenge the conclusion that crowds defied their wisdom by knowingly betting on inferior
but preferred options.
Although crowd wisdom was absent from each of the Choice conditions, it is reasonable to
expect crowd wisdom to increase over time, as evidence of the inferiority of favorites increases.
Once again, however, the data fail to support this hypothesis. As shown in Table 5, the tendency
underdogs (p < .001), won (43.0%) fewer games than it lost (p = .037), and was outperformed by almost all (96.2%) of its individual members. 7 We eliminated one game in which all Warned Choice members chose to bet on the favorite. These results were the same when we analyzed the data across participants rather than across games.

24
for the crowd to unwisely predict favorites actually increased over the course of the season. The
correlation between time (the week predictions were made) and the tendency to predict favorites
was positive and significant in the Choice condition, r(224) = .21, p = .002, and the Warned
Choice condition, r(223) = .14, p = .034. (The correlation in the Warned Choice condition was
marginally significant [p = .14] when we analyzed predictions based on the counting method).
The relationship between time and accuracy was negligible: r(220) = .03, p = .696 in the Choice
condition; r(219) = .03, p = .679 in the Warned Choice condition. Moreover, as shown in Tables
5 and 6, the crowd was biased toward favorites throughout the season, and at no four-week
stretch did the crowd perform better than 50%. Thus, the crowd did not improve as it accrued
knowledge and experience.
It is interesting to consider why the crowd increased its predictions of favorites over time,
despite the fact that favorites performed poorly against the spread. If the crowd was wise, this
pattern should emerge only if the performance of favorites improved over time. However, the
performance of favorites did not differ over time, r(220) = .01, p = .905, and we are therefore in
need of another explanation. We will entertain two possibilities.
First, research shows that the more confidently people believe that the favorite will simply
win the game, the more likely they are to predict favorites to win against the spread (following
Simmons and Nelson 2006, we will refer to this belief as intuitive confidence, because it
represents confidence in the intuition that the favorite will win).8 Thus, one plausible explanation
is that people became increasingly certain that favorites would win the games as the season
progressed, and that this increase in intuitive confidence led to an increase in betting on favorites.
8 This correlation between intuitive confidence and predictions is strong despite the fact that there is no correlation between intuitive confidence and whether the favorite beats the point spread, because well-calibrated differences in confidence are offset by differences in point spread magnitude (e.g., bookmakers set larger spreads for games with more pronounced favorites; Simmons and Nelson 2006). Indeed, in this study, games with higher intuitive confidence had significantly larger point spreads, r(224) = .70, p < .001.
25
To investigate this possibility, we used data from Yahoo.com’s fantasy football website. Each
week of the football season thousands of people log onto Yahoo.com to compete to accurately
predict the winners of NFL football games, and each week Yahoo.com reports the percentage of
people predicting each team to win. For each of the games in our sample, we measured intuitive
confidence by recording the percentage of people in the Yahoo.com sample who predicted that
the favorite would win the game. This reasonably assumes that games with a greater percentage
of people believing that the favorite will win are associated with greater intuitive confidence (cf.
Koriat 2008).
Consistent with Simmons and Nelson (2006), intuitive confidence strongly predicted when
the crowd chose favorites: r(224) = .42, p < .001 in the Choice condition; r(223) = .42, p < .001
in the Warned Choice condition (see Table 7). In addition, there was a trend for intuitive
confidence to increase over time, r(224) = .11, p = .102. However, although the relation between
time and the Warned Choice condition’s predictions of favorites decreased somewhat after
controlling for intuitive confidence, r(222) = .11, p = .110, the Choice condition’s predictions of
favorites increased over time even after controlling for intuitive confidence, r(222) = .18, p =
.007. This indicates that as the season progressed, people were marginally more confident that
the favorite would win the games. This increase in intuitive confidence may have contributed to
the increase in betting on favorites against the point spread, but it seems not to account for it
entirely.
A second possibility is attributional. Because predicting in line with one’s intuitions may
“feel right” (Simmons and Nelson 2006), people may attribute successful intuitive (favorite)
predictions to skill and unsuccessful favorite predictions to luck. Conversely, because predicting
against one’s intuitions may “feel wrong,” people may attribute successful nonintuitive

26
(underdog) predictions to luck and unsuccessful underdog predictions to skill. This attributional
pattern could cause people to “learn” that predicting favorites is wiser than predicting underdogs,
even if favorites lose more than underdogs against the spread.
To investigate this possibility, at the end of the season participants in the Choice and Warned
Choice conditions (N = 75) completed a survey designed to assess whether they attributed
winning or losing predictions to luck or to skill. Approximately half of the participants were
presented with a list of all of their losing predictions from Weeks 14 through 16. For each
prediction, they indicated whether they considered it a “Bad Decision” or whether they were
incorrect because they were “Unlucky.” The other half of the participants saw a list of their
winning predictions from Weeks 14 through 16. For each prediction, they indicated whether they
considered it a “Good Decision” or whether they were correct because they were “Lucky.”
The results of the Choice and Warned Choice conditions were identical, and so we combined
them for the analysis. A 2 (Correct vs. Incorrect Prediction) x 2 (Favorite vs. Underdog
Prediction) ANOVA on the percentage of predictions participants attributed to luck yielded two
major findings (see Figure 1). First, consistent with previous research (Gilovich 1983),
participants were much more likely to attribute incorrect (vs. correct) predictions to luck, F(1,
73) = 38.10, p < .001. Second, and most important, there was a significant interaction, F(1, 73) =
8.03, p < .006, indicating that participants’ attributions differed for favorite vs. underdog
predictions. Participants were significantly less likely to attribute correct favorite (vs. underdog)
predictions to luck, t(37) = 2.87, p = .007, and they were somewhat more likely to attribute
incorrect favorite (vs. underdog) predictions to luck, t(36) = -1.21, p = .232. These results are
consistent with the attributional explanation for the increase in favorite predictions as the season
progressed. Participants’ attributional tendencies may have rendered them more likely to learn

27
that a correct favorite (vs. underdog) prediction was good, and that an incorrect underdog (vs.
favorite) prediction was bad.
In sum, the results reported in this section fail to support the wisdom-of-crowds hypothesis.
When they are asked to choose which team to bet on, crowds are not sensitive to point spread
adjustments, even when they are told that adjustments have been made. Instead, predictions
against point spreads seem guided less by accuracy than by a reliance on intuition that causes
people to bet on favorites more than underdogs, a systematic tendency that, in this circumstance,
costs money. Moreover, this bias not only persists with feedback over time, but actually seems to
increase with feedback over time, perhaps because attributions for success and failure reinforce
intuitive choices.
The Estimate Conditions
Although the crowd was systematically biased (and unwise) when choosing which team to
bet on against point spreads, asking people to estimate the point differentials directly may cause
them to focus on the very dimension (the point differential) that receives insufficient weight
when making choices. Thus, this method of prediction elicitation may yield less biased (and
wiser) predictions. To test this hypothesis, we determined, for each game, the Estimate
condition’s prediction against the spread. We did this by converting the mean (and median) point
differential predictions into predictions against the point spread. Specifically, for each game we
determined whether the mean (and median) point differential prediction was greater than, less
than, or equal to the point spread presented in the Choice conditions, indicating a prediction of
“favorite,” “underdog,” or “no preference,” respectively.

28
The results of the Estimate condition contrasted starkly with the results of the Choice
conditions (see Tables 2, 3, and 4). Using the mean predictions, the Estimate condition crowd
predicted the underdog in 82.7% of the games, χ2 (1, N = 226) = 96.92, p < .001, correctly
predicted 55.4% of the games against the spread, χ2 (1, N = 222) = 2.59, p = .107, and
outperformed 95.6% of its members. Using the median predictions, the Estimate condition crowd
predicted the underdog in the majority (70.4%) of the games in the sample, χ2 (1, N = 226) =
37.45, p < .001, correctly predicted 50.9% of the games against the spread, χ2 (1, N = 214) =
0.07, p = .784, and outperformed 57.8% of its individual members. (Neither prediction
tendencies nor accuracy changed over time: -.09 < rs < .08, ps > .180). Thus, different elicitation
procedures yielded drastically different predictions, and Estimate condition predictions were
wiser than Choice condition predictions.
The Estimate condition crowd may have performed well either because estimating the point
differential of the games yielded unbiased estimates or because estimating the point differential
caused the crowd to exhibit a bias that is opposite the one exhibited by the Choice condition
crowds – namely, a bias toward the underdog. Only if the former is true should we conclude that
estimating point differentials yields relatively wise predictions. To resolve this issue, we
determined whether each prediction overestimated or underestimated the favorite’s actual
performance against the underdog. Using the mean prediction, the crowd overestimated the
favorite’s performance in 48.9% of the games. Using the median prediction, the crowd
overestimated the favorite’s performance in 52.4% of the games. Neither of these percentages
differed significantly from 50%. Thus, the Estimate condition’s predictions were not biased

29
toward underdogs (or favorites), but were equally likely to overestimate and underestimate the
favorite’s performance.9
Having established that the Estimate condition crowd predicted differently, and more wisely,
than the Choice condition crowd, we now attempt to explain this discrepancy. Analyzing the
predictions of the Choice/Estimate condition – who predicted which team would win against the
point spread before providing their point differential prediction – allows us to examine the merits
of two alternative explanations. On the one hand, merely considering the favorite against a point
spread may be enough to bias predictions toward favorites, perhaps because the point spread
signals that the favorite is the better team. On the other hand, it may be the act of making point
differential predictions that removes the bias toward favorites, perhaps because it encourages
participants to consider the very dimension (the point differential) that they typically
underweight when deciding which team to bet on. If the first explanation is true, then the
Choice/Estimate condition’s predictions should more closely resemble those of the Choice
conditions than those of the Estimate condition. If the second explanation is true, then the
Choice/Estimate condition’s predictions should more closely resemble those of the Estimate
condition than those of the Choice conditions.
The Choice/Estimate condition crowd was slightly more likely to predict favorites than was
the Estimate condition crowd, but was dramatically less likely to predict favorites than the
Choice condition crowds (see Table 2). Indeed, the Choice/Estimate condition crowd more
closely resembled the Estimate condition crowd than the Choice condition crowds. Most notably,
as was true of the Estimate condition crowd, the Choice/Estimate condition crowd predicted
9 Using the median predictions, the Estimate condition crowd was more likely to predict visiting favorites (37.6%) than home favorites (20.3%), χ2 (1, N = 218) = 7.91, p = .005, suggesting that, like the Choice condition crowd, this crowd also underestimated the effect of home field advantage. However, using the mean predictions yielded no such tendency: The Estimate condition crowd predicted visiting favorites (16.3%) and home favorites (17.9%) with equal frequency, χ2 (1, N = 226) = 0.10, p = .754.

30
underdogs more often than favorites: using the median predictions, χ2 (1, N = 218) = 3.60, p =
.057; using the mean predictions, χ2 (1, N = 222) = 61.39, p < .001. All told, this suggests that
although considering the point spreads slightly increased the predictions of favorites, considering
the point spreads did not induce an overall bias toward favorites, and thus that aspect of the
method cannot fully explain the discrepancy between the Choice and Estimate conditions.
Rather, it is the act of estimating the point differential (vs. choosing which team to bet on) that
seems responsible for most of this discrepancy.
Why should estimating point differentials yield different predictions than choosing which
team to bet on? One possibility is that the discrepancy arises from the facts that (1) people bet on
teams that they like more than teams that they dislike, and (2) people tend to prefer good teams
(favorites) to bad teams (underdogs). In order for Choice condition participants to bet on a
favored team that they like, they have to predict that the favorite will beat the spread. However,
in order for Estimate condition participants to bet on a favored team that they like, they have to
predict only that the favorite will win the game – not that the favorite will beat the spread. Thus,
when the favorite is preferred to the underdog, only Estimate condition participants are able to
bet on their preferred team without predicting that the team will beat the spread. Thus,
predictions guided by preference may cause Choice condition crowds to predict more favorites
than Estimate condition crowds.
To examine this possibility, we relied on data collected at the end-of-season survey, when we
asked participants to rate their liking of each of the 32 NFL teams on a 7-point scale (-3 =
strongly dislike; +3 = strongly like). For each prediction, we used the liking ratings to code
whether the participant preferred the favorite, preferred the underdog, or had no preference
between the two teams. Table 7 shows the percentage of favorites predicted by the crowd as a

31
function of preference and condition. Consistent with the “liking” explanation, the crowd was
more likely to predict favorites as their preference for the favorite increased. However,
inconsistent with this explanation, the effect of liking on predictions was of equal size in the
Choice and Estimate conditions. Indeed, Table 7 shows that, no matter their preference, the
Choice condition crowds predicted more favorites than underdogs and the Estimate condition
crowd predicted more underdogs than favorites. Thus, although people do seem to bet on teams
they like more than teams they dislike, this fact does not explain the discrepancy between the
Choice and Estimate conditions.
Another possibility, suggested earlier, is that although high intuitive confidence often causes
bettors to underweight the point spread and to side with their intuitions (the favorite) when they
are choosing which team to bet on (Simmons and Nelson 2006), asking bettors to predict the
point differential of the game may attenuate the potentially biasing influence of intuitive
confidence and cause them to weigh the point spread more heavily. To test this hypothesis, we
examined condition differences in (1) the correlation between intuitive confidence – the
percentage of people predicting the favorite to simply win the game in the Yahoo.com sample –
and predictions, and (2) the correlation between point spread magnitude and predictions. As
shown in Table 8, the correlations between intuitive confidence and the tendency to predict
favorites were significantly higher in the two Choice conditions (all rs > .38) than in the two
Estimate conditions (all rs < .19), all zs > 2.20, ps < .029. And, the correlations between point
spread magnitude and the tendency to predict favorites were significantly lower (i.e., more
negative) in the two Estimate conditions (all rs < -.13) than in the two Choice conditions (all rs >
.04) than in the two Choice conditions, all zs > 1.86, ps < .065 (15 out of the 16 differences in
correlations were significant at p < .05). Thus, participants gave greater weight to intuitive

32
confidence when they made choices, and greater weight to the point spread’s magnitude when
they estimated point differentials directly.
GENERAL DISCUSSION
This research presented three major findings. First, when predicting against biased point
spreads, crowds were systematically biased and ultimately unwise. This is a striking finding,
especially because this investigation featured many elements that were designed to cultivate
crowd wisdom. We investigated decision making in a domain that is widely believed to elicit
crowd wisdom. We ensured that our sample included knowledgeable and enthusiastic football
fans with diverse backgrounds and rooting interests. We gave all participants financial incentives
to be accurate. We told a subset of the participants that the spreads were biased. And, we
conducted this study over the course of a four-month-long season, therefore allowing participants
to learn over time. Despite these favorable elements, when predicting against point spreads, the
crowd was systematically biased and consequently unwise.
This finding raises a number of questions. First, why are crowds systematically biased when
predicting against point spreads? We believe that systematic biases arise because people are
swayed by confidently-held intuitions that favor the favorite and underweight point spreads
(Simmons and Nelson 2006). Simmons and Nelson (2006) have validated this theory in their
investigation of predictions against point spreads, but the current investigation extends this
notion to new circumstances. First, we found that their theory applies not only to predictions
against unbiased spreads but also to predictions against biased spreads. This is important because
it means that the tendency to choose favorites over underdogs can be profitably exploited by

33
increasing point spreads. Moreover, it suggests that their theory applies not only to situations that
require participants to choose between equal alternatives, but also to situations in which the
nonintuitive choice is objectively, and detectably, superior. Second, their theory also applies
when people know that the spreads are biased. This is intriguing because it suggests that, in this
context, the temptation to rely on one’s intuitions is so strong as to lead people to rely on what
they intuitively feel to be true (the favorite will prevail against the spread) rather than on what
they generally know to be true (the favorite will usually lose against the spread). This finding is
consistent with dual-process models of decision making, which emphasize how people often
offer intuitive answers to questions even when they know, on a less emotional level, that those
answers are inferior (Denes-Raj and Epstein 1994; Kahneman and Frederick 2002; Loewenstein,
Weber, Hsee, and Welch 2001; Shiv et al. 2005; also see Dunning 2007). As John Steinbeck
(1952) wrote in East of Eden, “It is one of the triumphs of the human that he can know a thing
and still not believe it.”
Another question arising from this finding pertains to the operation of point spread betting
markets. If gamblers are so heavily biased toward favorites, and if casinos know this (and they
do; see Jeffries and Oliver 2000), then why don’t casinos exploit this bias by increasing the
spreads? One reason is that setting inaccurate spreads exposes the casino to risks that they would
not face by setting accurate spreads. For example, although most people tend to bet on favorites,
gamblers who rely on good mathematical models (rather than intuitive decision processes) to
predict game outcomes could exploit inaccuracies in the spread. Indeed, there is anecdotal
evidence that casinos are afraid of the “smart money,” bettors who are ostensibly better than
casinos at predicting a subset of game outcomes (Konik 2006). By aiming for accurate point
spreads, casinos can ensure themselves of a long-run profit while dissuading the smart money

34
from placing bets. A second reason has to do with competition. Especially in the age of the
Internet, bettors often have many options when they are deciding which casino to use to place
their bets, and bettors who prefer to bet on favorites will prefer the casino offering the lowest
spread. Thus, in order for a casino to attract most gamblers (i.e., those who tend to bet on
favorites), the casino must offer point spreads that are no higher than the competition.
Our second major finding was that the Choice condition crowds increasingly chose favorites
over time even though choosing favorites produced worse outcomes. Thus, despite objective
feedback to the contrary, these crowds actually seemed to learn that choosing favorites was wise.
One possible and intriguing explanation for this result is attributional. Indeed, we discovered that
people not only endorsed self-serving attributions, attributing winning predictions to skill and
losing predictions to luck (Gilovich 1983), but they also endorsed intuition-serving attributions,
as they were more likely to attribute intuitive (vs. non-intuitive) winning predictions to skill and
intuitive (vs. non-intuitive) losing predictions to luck. Thus, in the long run, people are likely to
reinforce themselves for intuitive predictions and punish themselves for non-intuitive
predictions. This process may partially explain why strong intuitions may be resistant to change
even in the face of objective feedback.
Finally, our third major finding is that although crowd wisdom was absent from the (Choice)
conditions that predicted game outcomes against point spreads, predictions were drastically
different – and wiser – among the (Estimate) conditions that predicted the point differentials of
the games. This difference may have emerged because estimating exact point differentials
encourages people to give full weight to a dimension (the point spread) that is typically
underweighted when they are choosing which team to bet on. This finding adds to a large

35
literature showing that different methods of eliciting judgments induce different considerations
and processes, and hence often different judgments.
This finding suggests that although crowds are unwise when the question is posed as it
usually is in real-world betting contexts, they may be wise when the question is posed
differently. Thus, although this research suggests that wisdom-of-crowds proponents are wrong
to assume that point spread betting markets offer evidence of crowd wisdom, this assumption
might be correct in (as of yet non-existent) markets designed to elicit estimates of exact point
differentials. This represents a generally important point about the elicitation of crowd wisdom.
Although this research emphasizes that crowd wisdom may sometimes be elusive even under
conditions of knowledge, motivation, independence, and diversity, it also emphasizes that crowd
wisdom depends on the judgmental biases of the crowd members. Thus, predicting whether a
crowd will be wise or unwise demands an understanding of the psychological processes induced
by the judgmental environment. Although systematic biases may ruin the crowd’s judgments
when judgments are elicited in manner that encourages intuitive responding, those biases may be
absent from logically identical methods of eliciting the same information, and the crowd may
emerge wiser.

36
REFERENCES
Alba, Joseph W. and J. Wesley Hutchinson (2000), “Knowledge Calibration: What Consumers
Know and What They Think They Know,” Journal of Consumer Research, 27, 123-156.
American Gaming Association (2008), State of the States: The AGA Survey of Casino
Entertainment, AGA, Washington, D.C.
Avery, Christopher and Judith Chevalier (1999), “Identifying Investor Sentiment from Price
Paths: The Case of Football Betting,” Journal of Business, 72 (4), 493-521.
Bertrand, Marianne, Sendhil Mullainathan, and Eldar Shafir (2006), “Behavioral Economics and
Marketing in Aid of Decision Making Among the Poor,” Journal of Public Policy and
Marketing, 25 (1), 8-23.
Bettman, James R., Mary Frances Luce, and John W. Payne (1998), “Constructive Consumer
Choice Processes,” Journal of Consumer Research, 25 (2), 187-217.
Camerer, Colin F. (1998), “Can Asset Markets Be Manipulated? A Field Experiment with
Racetrack Betting,” Journal of Political Economy, 106 (3), 457-482.
Carmon, Ziv and Itamar Simonson (1998), “Price-Quality Trade-offs in Choice Versus
Matching: New Insights Into the Prominence Effect,” Journal of Consumer Psychology, 7
(4), 323-343
Chen, Kay-Yut and Charles Plott (2002), “Information Aggregation Mechanisms: Concept,
Design and Implementation for a Sales Forecasting Problem,” California Institute of
Technology Social Science Working Paper No. 1131.
Dana, James D. Jr. and Michael M. Knetter (1994), “Learning and Efficiency in a Gambling
Market,” Management Science, 40 (10), 1317-1328.

37
Denes-Raj, Veronika and Seymour Epstein (1994), “Conflict between Intuitive and Rational
Processing: When People Behave Against Their Better Judgment,” Journal of Personality
and Social Psychology, 66 (5), 819-829.
Dunning, David (2007), “Prediction: The Inside View,” in Social Psychology: Handbook of
Basic Principles (2nd edition), ed. Arie W. Kruglanski and E. Tory Higgins, New York, NY:
The Guilford Press, 69-90.
Fischer, Gregory W., Ziv Carmon, Dan Ariely, and Gal Zauberman (1999), “Goal-based
Construction of Preferences: Task Goals and the Prominence Effect,” Management Science,
45 (8), 1057-1075.
Forsythe, Robert, Thomas A. Rietz, and Thomas W. Ross (1999), Wishes, Expectations and
Actions: A survey on Price Formation in Election Stock Markets,” Journal of Economic
Behavior and Organization, 39, 83-110.
Galton, Francis (1907), “Vox Populi,” Nature, 75, 450-451.
Gandar, John, Richard Zuber, Thomas O’Brien, and Ben Russo (1988), “Testing Rationality in
the Point Spread Betting Market,” Journal of Finance, 43 (1), 995-1008.
Gilovich, Thomas (1983), “Biased Evaluation and Persistence in Gambling,” Journal of
Personality and Social Psychology, 44 (6), 1110-1126.
Gilovich, Thomas, Dale Griffin, and Daniel Kahneman (Eds.) (2002), Heuristics and Biases: The
Psychology of Intuitive Judgment, Cambridge, UK: Cambridge University Press.
Gray, Philip K. and Stephen F. Gray (1997), Testing Market Efficiency: Evidence from the NFL
Sports Betting Market,” Journal of Finance, 52 (4), 1725-1737.
Grether, David M. and Charles R. Plott (1979), “Economic Theory of Choice and the Preference
Reversal Phenomenon,” American Economic Review, 69, 623-638.

38
Hahn, Robert W. and Paul C. Tetlock (Eds.) (2006), Information Markets: A New Way of Making
Decisions, Washington D.C.: AEI-Brookings Joint Center for Regulatory Studies.
Hastie, Reid and Tatsuya Kameda (2005), “The Robust Beauty of Majority Rules in Group
Decisions,” Psychological Review, 112 (2), 494-508.
Ho, Teck-Hua and Kay-Yut Chen (2007), “New Product Blockbusters: The Magic and Science
of Prediction Markets,” California Management Review, 50, 144-158.
Hogarth, Robin M. (1978), “A Note on Aggregating Opinions,” Organizational Behavior and
Human Performance, 21, 40-46.
Huber, Joel (1975), “Bootstrapping of Data and Decisions,” Journal of Consumer Research, 2
(December), 229-234.
Jeffries, James and Charles Oliver (2000), The Book on Bookies: An Inside Look at a Successful
Sports Gambling Operation, Boulder, CO: Paladin Press.
Kahneman, Daniel and Shane Frederick (2002), “Representativeness Revisited: Attribute
Substitution in Intuitive Judgment,” in Heuristics and Biases: The Psychology of Intuitive
Judgment, ed. Thomas Gilovich, Dale Griffin, and Daniel Kahneman, Cambridge, UK:
Cambridge University Press, 49-81.
Kahneman, Daniel and Amos Tversky (Eds.) (2000), “Choices, Values, and Frames,” New
York, NY: Russell Sage Foundation.
Konik, Michael (2006), The Smart Money: How the World’s Best Sports Bettors Beat the
Bookies Out of Millions, New York, NY: Simon and Schuster.
Koriat, Asher (2008), “Subjective Confidence in One’s Answers: The Consensuality Principle,”
Journal of Experimental Psychology: Learning, Memory, and Cognition, 34 (4), 945-959.
39
Krizan, Zlatan and Paul D. Windschitl (2007), “The Influence of Outcome Desirability on
Optimism,” Psychological Bulletin, 133 (1), 95-121.
Kunda, Ziva (1990), “The Case for Motivated Reasoning,” Psychological Bulletin, 108 (3), 480-
498.
Larrick, Richard E. and Jack B. Soll (2006), “Intuitions About Combining Opinions:
Misappreciation of the Averaging Principle,” Management Science, 52 (1), 111-127.
Lee, Marcus and Gary Smith (2002), “Regression to the Mean and Football Wagers,” Journal of
Behavioral Decision Making, 15, 329-342.
Levitt, Steven D. (2004), “Why Are Gambling Markets Organised So Differently from Financial
Markets?” The Economic Journal, 114 (April), 223-246.
List, John A. (2003), “Does Market Experience Eliminate Market Anomalies?” Quarterly
Journal of Economics, 118, 41-71.
Loewenstein, George F., Eke U. Weber, Christopher K. Hsee, and Ned Welch (2001), “Risk as
Feelings,” Psychological Bulletin, 127 (2), 267-286.
Lorge, Irving, David Fox, Joel Davitz, and Marlin Brenner (1958), “A Survey of Studies
Contrasting the Quality of Group Performance and Individual Performance, 1920-1957,”
Psychological Bulletin, 55 (6), 337-372.
Makridakis, Spyros and Robert L. Winkler (1983), Averages of Forecasts: Some Empirical
Results,” Management Science, 29 (9), 987-996.
Oliven, Kenneth and Thomas A Rietz (2004), “Suckers Are Born but Markets Are Made:
Individual Rationality, Arbitrage, and Market Efficiency on an Electronic Futures Market,”
Management Science, 50 (3), 336-351.

40
Oskarsson, An T., Leaf Van Boven, Gary H. McClelland, and Reid Hastie (2009), “What’s
Next? Judging Sequences of Binary Events,” Psychological Bulletin, 135 (2), 262-285.
Radzevick, Joseph R. and Don A. Moore (2008), “Myopic Biases in Competitions,”
Organization Behavior and Human Decision Processes, 107 (2), 206-218.
Roxborough, Roxy and Mike Rhoden (1998), Sports Book Management: A Guide for the Legal
Bookmaker, Las Vegas, NV: Las Vegas Sports Consultants.
Sauer, Raymond D. (1998), “The Economics of Wagering Markets,” Journal of Economic
Literature, 36 (December), 2021-2064.
Shafir, Eldar and Robyn A. LeBoeuf (2002), “Rationality,” Annual Review of Psychology, 53,
491-517.
Shiller, Robert J. (2005), Irrational Exuberance (2nd edition), Princeton, NJ: Princeton
University Press.
Shiv, Baba, George Loewenstein, Antoine Bechara, Hanna Damasio, and Antonio R. Damasio
(2005), “Investment Behavior and the Negative Side of Emotion,” Psychological Science, 16
(6), 435-439.
Simmons, Joseph P. and Leif D. Nelson (2006), “Intuitive Confidence: Choosing Between
Intuitive and Nonintuitive Alternatives,” Journal of Experimental Psychology: General, 135
(3), 409-428.
Simonson, Itamar (1989), “Choice Based on Reasons: The Case of Attraction and Compromise
Effects,” Journal of Consumer Research, 16 (September), 158-174.
Slovic, Paul and Sarah Lichtenstein (1983), “Preference Reversals: A Broader Perspective,”
American Economic Review, 73, 596-605.

41
Snowberg, Erik, Justin Wolfers, and Eric Zitzewitz (2005), “Information (In)Efficiency in
Prediction Markets,” in Information efficiency in financial and betting markets L. V.
Williams (Ed.). Cambridge, UK: Cambridge University Press.
Soll, Jack B. and Richard P. Larrick (2009), “Strategies for Revising Judgment: How (and How
Well) People Use Others’ Opinions,” Journal of Experimental Psychology: Learning,
Memory, and Cognition, 35 (3), 780-805.
Steinbeck, John (1952), East of Eden, New York, NY: The Viking Press.
Sunstein, Cass R. (2006), Infotopia: How Many Minds Produce Knowledge, New York, NY:
Oxford University Press.
Surowiecki, James (2004), The Wisdom of Crowds, New York, NY: Doubleday.
Thaler, Richard H. (1985), “Mental Accounting and Consumer Choice,” Marketing Science,
4(3), 199-214.
Thaler, Richard H. and Cass R. Sunstein (2008), Nudge: Improving Decisions About Health,
Wealth, and Happiness, New Haven, CT: Yale University Press.
Treynor, Jack L. (1987), “Market Efficiency and the Bean Jar Experiment,” Financial Analysts
Journal, 43 (May-June), 50-52.
Tversky, Amos, Shmuel Sattath, and Paul Slovic (1988), “Contingent Weighting in Judgment
and Choice,” Psychological Review, 95 (3), 371-384.
Tversky, Amos and Richard H. Thaler (1990), “Anomalies: Preference Reversals,” Journal of
Economic Perspectives, 4 (2), 201-211.
Yaniv, Ilan (2004), “The benefits of additional opinions. Current Directions in Psychological
Science, 12, 75-78.
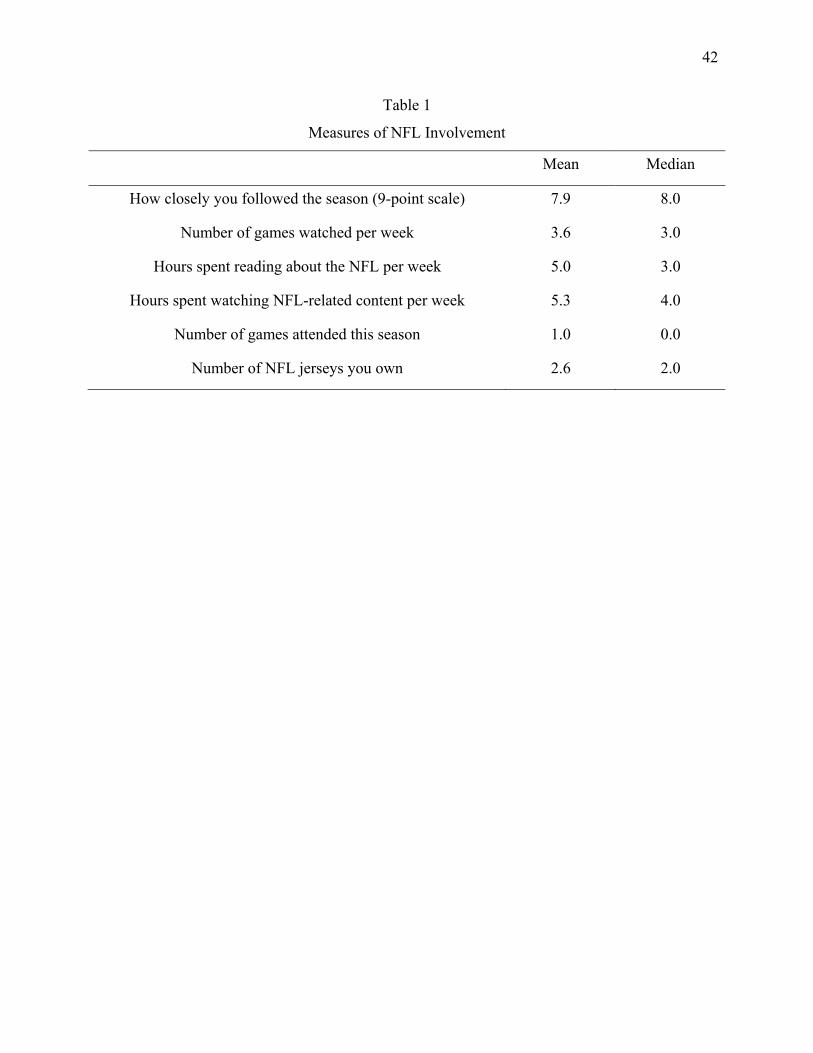
42
Table 1
Measures of NFL Involvement
Mean Median
How closely you followed the season (9-point scale) 7.9 8.0
Number of games watched per week 3.6 3.0
Hours spent reading about the NFL per week 5.0 3.0
Hours spent watching NFL-related content per week 5.3 4.0
Number of games attended this season 1.0 0.0
Number of NFL jerseys you own 2.6 2.0

43
Table 2
The Crowd’s Predictions against the Spread (N = 226 Games)
Favorite Underdog No Preference
Choice
Counting 198 (87.6%)ab 23 (10.2%) 5 (2.2%)
Wager 202 (89.4%)a 24 (10.6%) 0 (0.0%)
Warned Choice
Counting 188 (83.2%)ab 34 (15.0%) 4 (1.8%)
Wager 187 (82.7%)b 38 (16.8%) 1 (0.4%)
Estimate
Median 59 (26.1%)d 159 (70.4%) 8 (3.5%)
Mean 39 (17.3%)e 187 (82.7%) 0 (0.0%)
Choice/Estimate
Median 95 (42.0%)c 123 (54.4%) 8 (3.5%)
Mean 53 (23.5%)de 170 (75.2%) 3 (1.3%)
Note. Within the “Favorite” column, percentages with different subscripts differ significantly (p
< .05).

44
Table 3
The Crowd’s Performance against the Spread (Excluding Ties)
Wins Losses
Choice
Counting 93 (42.9%)bc 124 (57.1%)
Wager 96 (43.2%)bc 126 (56.8%)
Warned Choice
Counting 88 (40.4%)c 130 (59.6%)
Wager 93 (42.1%)bc 128 (57.9%)
Estimate
Median 109 (50.9%)ab 105 (49.1%)
Mean 123 (55.4%)a 99 (44.6%)
Choice/Estimate
Median 103 (48.1%)ab 111 (51.9%)
Mean 111 (50.7%)ab 108 (49.3%)
Note. Within the “Wins” column, percentages with different subscripts differ significantly
(p < .05).

45
Table 4
The Crowd’s Performance Relative to the Performance of Its Individual Members
% of Individuals Predicting a
Higher Percentage of Favorites
against the Spread than the Crowd
% of Individuals the Crowd
Outperformed
Choice
Counting 4.7% 7.0%
Wager 2.3% 7.0%
Warned Choice
Counting 7.7% 0.0%
Wager 10.2% 2.6%
Estimate
Median 80.0% 57.8%
Mean 91.1% 95.6%
Choice/Estimate
Median 68.6% 35.2%
Mean 90.2% 54.9%

46
Table 5
Percentage of Games the Crowd Predicted Favorites against the Spread
Weeks 1-4 Weeks 5-8 Weeks 9-12 Weeks 13-17
Choice
Counting 82.1% 87.2% 90.2% 97.0%
Wager 80.4% 85.4% 94.3% 95.7%
Warned Choice
Counting 81.8% 77.1% 88.0% 89.9%
Wager 75.0% 79.2% 86.8% 89.7%

47
Table 6
The Crowd’s Winning Percentage against the Spread
Weeks 1-4 Weeks 5-8 Weeks 9-12 Weeks 13-17
Choice
Counting 39.3% 42.2% 42.0% 47.0%
Wager 41.1% 41.3% 40.4% 48.5%
Warned Choice
Counting 40.0% 32.6% 36.7% 48.5%
Wager 42.9% 39.1% 36.5% 47.8%

48
Table 7
Percentage of Games in Which the Crowd Predicted Favorites against the Spread
Preferred Favorite Indifferent Preferred Underdog
Choice
Counting 92.2% 86.0% 68.4%
Wager 89.2% 80.1% 66.7%
Warned Choice
Counting 86.0% 80.3% 70.0%
Wager 80.1% 73.2% 66.2%
Estimate
Median 37.5% 27.8% 20.6%
Mean 36.0% 20.4% 18.7%
Choice/Estimate
Median 54.5% 47.5% 28.4%
Mean 42.8% 33.3% 16.0%

49
Table 8
Correlations between Predicting Favorites against the Spread and (1) Intuitive Confidence and
(2) Point Spread Magnitude
Correlation with Intuitive Confidence (p-value)
Correlation with Point Spread Magnitude (p-value)
Choice
Counting .40 (< .001) .05 (.469)
Wager .42 (< .001) .08 (.256)
Warned Choice
Counting .38 (< .001) .05 (.497)
Wager .42 (< .001) .05 (.428)
Estimate
Median .14 (.036) -.26 (< .001)
Mean .19 (.005) -.13 (.048)
Choice/Estimate
Median .05 (.503) -.36 (< .001)
Mean .15 (.021) -.19 (.005)

50
Figure 1
Attributions of Prediction Success to Luck or Skill