Embed Size (px)
Citation preview

Introductory Guide v1.83
©MMXXI Brother Maff via the GalacticChain License ; some rights reserved.
Contents

Table Of Contents
Legal Notices
Brief Word From The Editor
Introduction
Way of the Candlestick Master™ Background
Part I: Candlestick Essentials Made Easy
• Introduction
• Sakata's Five Rules Nutshelled
• The Most Important Candlestick Attributes
• Candlestick Intricacies
• Catching The Candle By The Tail
• Powerful Doji Tips For Serious Crypto Traders
• Pro Candlestick Tips
• Simple Yet Powerful Price Action Trading Strategy
Part II: Game Overview
• Prelude
• Overarching Game Objective
• Candlestick Collections & Quests
• Candle NFT Certification
• Further Game Insights
Appendix I: Candlestick Token (CNDL) Stats
Appendix II: Top 10 High-Performance Candlesticks
Appendix III: Cradle Zone Trading Strategy
Appendix IV: Enhanced Cradle Zone Trading Strategy
Appendix V: Top 7 Tips On How Not To Get Rekt
Appendix VI: Ninja Scalpmaster Trading Strategy
Contents

Legal Notices
The Way of the Candlestick Master™ is independently published and does not necessarily express the views of any parties/sources referenced.
The Publisher of this report has taken reasonable measures to ensure the accuracy of the information contained herein. However, due to the rapidly evolving nature of Stellar and crypto regulation, this does not guarantee its accuracy; thus the Publisher will not accept liability for any loss or damage that may arise directly or indirectly from the content contained herein.
The views expressed herein are strictly the opinion of the Publisher and are for edutainment purposes only and shall not be interpreted as legal, financial, or investment advice in any manner whatsoever.
The Publisher will not accept liability for any loss or damage whatsoever; including without limitation any loss of profit arising directly or indirectly from the use of or reliance on such information.
This document is subject to change at any time without notice, and is provided on an “As-Is” basis for general blockchain-based collectible trading game commentary and is not a substitute for proper due diligence.
Risk Disclosure
Past performance is not necessarily indicative of future results. The risk of loss in cryptocurrency investing can be substantial and may not be suitable for all investors:
• Carefully consider the inherent risks of such an investment in light of your financial condition, investment objectives, level of experience, and risk appetite;
• Avoid investing money that you cannot afford to lose and be aware of all the risks associated with cryptocurrency exchange trading;
• Seek advice from an independent financial advisor if you have any doubts.
In Summary: Your risk is yours and yours alone; therefore always exercise due diligence when any reasonably prudent person would do so.
Fair Use Statement
This document contains copyrighted content, the use of which has not been specifically authorized by the copyright owners.
This material is made available to advance the understanding of open source blockchain technologies, including environmental impact, economic impact, et al, for those who have expressed a prior interest in receiving the included information for research and educational purposes as provided for in Title 17 U.S.C. Section 107 of the US Copyright Law.
If you wish to use such copyrighted material for purposes of your own that go beyond fair use, you must obtain permission from the respective copyright owners.
Contents
Brief Word From The Editor
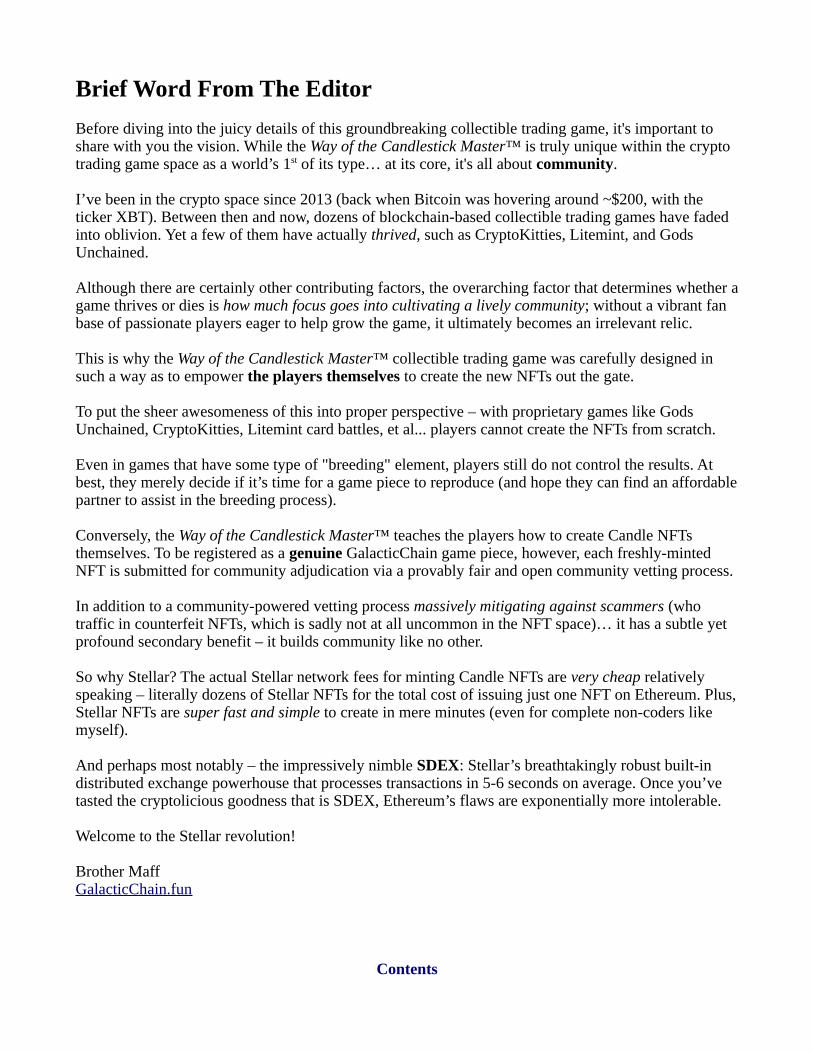
Before diving into the juicy details of this groundbreaking collectible trading game, it's important to share with you the vision. While the Way of the Candlestick Master™ is truly unique within the crypto trading game space as a world’s 1st of its type… at its core, it's all about community.
I’ve been in the crypto space since 2013 (back when Bitcoin was hovering around ~$200, with the ticker XBT). Between then and now, dozens of blockchain-based collectible trading games have faded into oblivion. Yet a few of them have actually thrived, such as CryptoKitties, Litemint, and Gods Unchained.
Although there are certainly other contributing factors, the overarching factor that determines whether agame thrives or dies is how much focus goes into cultivating a lively community; without a vibrant fan base of passionate players eager to help grow the game, it ultimately becomes an irrelevant relic.
This is why the Way of the Candlestick Master™ collectible trading game was carefully designed in such a way as to empower the players themselves to create the new NFTs out the gate.
To put the sheer awesomeness of this into proper perspective – with proprietary games like Gods Unchained, CryptoKitties, Litemint card battles, et al... players cannot create the NFTs from scratch.
Even in games that have some type of "breeding" element, players still do not control the results. At best, they merely decide if it’s time for a game piece to reproduce (and hope they can find an affordablepartner to assist in the breeding process).
Conversely, the Way of the Candlestick Master™ teaches the players how to create Candle NFTs themselves. To be registered as a genuine GalacticChain game piece, however, each freshly-minted NFT is submitted for community adjudication via a provably fair and open community vetting process.
In addition to a community-powered vetting process massively mitigating against scammers (who traffic in counterfeit NFTs, which is sadly not at all uncommon in the NFT space)… it has a subtle yet profound secondary benefit – it builds community like no other.
So why Stellar? The actual Stellar network fees for minting Candle NFTs are very cheap relatively speaking – literally dozens of Stellar NFTs for the total cost of issuing just one NFT on Ethereum. Plus,Stellar NFTs are super fast and simple to create in mere minutes (even for complete non-coders like myself).
And perhaps most notably – the impressively nimble SDEX: Stellar’s breathtakingly robust built-in distributed exchange powerhouse that processes transactions in 5-6 seconds on average. Once you’ve tasted the cryptolicious goodness that is SDEX, Ethereum’s flaws are exponentially more intolerable.
Welcome to the Stellar revolution!
Brother MaffGalacticChain.fun
Contents

Introduction
“It’s not about the size of the dog in the fight. It’s all about the size of the fight in the dog.”
- Ancient Trading Proverb
Although there were numerous reasons so many new crypto enthusiasts got rekt on the back end of the 2017 Bullrun (and throughout the long, dark Bear market thereafter)… by far one of the main overarching reasons is because they had no real idea what they were doing.
They bought the FOMO near the 20K top, and panic-sold the FUD on the plummet straight down into the crypto abyss. And yet more freshly-minted millionaires were created than at any other point in human history (duly commemorated by the iron fist of the IRS).
In retrospect, this was a major inflection point.
Fast forward to 2021, and it’s no surprise newbies are now showing up in droves like bees at a picnic, making repeating the dire mistakes as before. Only this time, institutional investors are laughing all the way to the bank as they scoop up every last OTC bitcoin they can (and no let-up in sight).
Powered by the sleek and sexy Stellar blockchain, and inspired by some of the greatest Candlestick Masters of the 20th & 21st century – from Stephen Bigalow and Steve Nison to Larry Connors and Tina Logan – the Way of the Candlestick Master™ is a powerful gamified learning breakthrough that aims toalleviate the pain and misery of getting rekt (due to a lack of practical knowledge).
The more you explore the Way of the Candlestick Master™, the sharper and more profitable you’ll become in all facets of asset trading. And perhaps even more importantly – you’ll also learn how to protect your investments in sharp market downturns, such as we saw with BTC in Q1 2018 & Q2 2021.
Thus Phase 1 of the Way of the Candlestick Master™ rollout begins by introducing this innovative collectible trading game concept (along with a treasure trove of pure gold information) via the Way of the Candlestick Master™ Introductory Guide.
For example, within these pages, you’re about to discover the ten highest-performing candlestick patterns of all time (thanks hugely to the seminal work of Candlestick Master Tom Bulkowski).
These ten high-probability candle patterns will give you a powerful trading edge by recognizing highly probable price-action trend continuations and reversals quickly and concisely on any time frame.
You’ll also be introduced to certain simple yet profoundly profitable high-performance crypto trading methods, strategies, hot tips, and techniques that will further sharpen your trading edge and increase theprobabilities in your favor:
• High-performance crypto trading strategies and techniques;
• Powerful risk management and stop-loss strategy considerations;
• The hidden advantages of keeping a well-manicured trade journal;
Contents

• And easy emotional hacks that give you a seemingly unfair advantage by radically enhancing your trading psychology, just to name a few.
Based on overall community enthusiasm, Phase 2 of the Way of the Candlestick Master™ will continueexpanding upon the previous phase by introducing the next ten high-profit candle patterns, and a wealthof even more powerful intermediate and advanced synergistic crypto trading techniques, tips, and strategies.
Throughout each phase, the overarching goal is to minimize the learning curve, while maximizing the fun and excitement of the learning process via the world’s 1st collectible trading game of its type. Thus the Way of the Candlestick Master™ is THE premiere blockchain-based collectible trading game that teaches you (from the ground up) exactly how to become a consistently profitable crypto trader.
Moreover, the game is designed in such a way that players learn the core fundamentals layer by layer; thereby systematically mastering the basics from the ground up via the ultimate in Stellar gamification.
Even total crypto trading newbies will be empowered with a solid foundation to build up a highly lucrative part or full-time income via the fastest, funnest learning curve realistically possible.
Do you recall purchasing a vehicle of a make/model you’ve never previously owned before? Next thingyou know, you’re starting to see different colors of that particular make/model almost everywhere you go. Yet before that, they were practically nonexistent.
So it is with candlestick chart patterns. Once you begin to recognize certain time-proven candle chart patterns, you will never look at crypto trading the same way again. And like any skill that is not at all difficult to learn… in the beginning, you’ll still need to get used to it.
As you become more proficient at consciously scanning for suitable specific patterns, however, there will come a point when highly profitable candlestick patterns practically throw themselves at you.
Now imagine enjoying the lighthearted camaraderie of a tight-knit community gathered around creating, trading, and battling Candle NFTs showcasing these high-potency candlestick patterns of the Candlestick Masters gamified on the Stellar blockchain, and you’re starting to intuitively feel the Way of the Candlestick Master™ vision.
In a plummeting global fiat economy in which hyperinflation looms on the horizon like ominous dark clouds hurling Thor-sized lightning bolts of tree-shattering destruction…
Arguably the greatest money-making skill that you will ever learn is candlestick price-action pattern recognition partnered up with a sound risk management strategy. Moreover, we excel at learning when it involves having fun enjoying the process; made even more savory with the comradeship of a shared common bond between crypto fans from across the globe.
In this regard, the Way of the Candlestick Master™ straight up ROCKS by streamlining the learning curve into an enjoyable collectible leisure game built up the rock-solid foundation of community camaraderie!
Contents

Way of the Candlestick Master™ Background
Introduction
Since science has proven that the little brain in the heart has a HUGE impact on how we experience life, all that is required to successfully engage the Shin Shin Toitsu Trading style is to deeply connect with the trader’s physical human heart and the body/big brain will follow (aka “heart-brain coherence”).
We practice Shin Shin Toitsu Trading to aid ourselves in re-establishing this powerful cascading effect of scientifically-documented benefits (this article barely even scratches the surface). One of the lesser-known yet exceedingly powerful benefits is deep (nonlocal) intuition.
All other factors being equal, mastering just one quick and simple HeartMath® technique will radically transform your risk-mitigation skills, consistent profitability, and trade accuracy simultaneously.
Whether you understand it as serendipity, coincidence, or good luck – a direct result of synchronizing our big brain with the little brain in our physical heart is that it allows us to smoothly move through lifein a state of elevated flow/unity with the very life energy of the universe (what the Japanese call “ki” and world-renowned theoretical physicist Max Planck simply referred to as the “matrix”).
The first Japanese character of Shin Shin Toitsu Trading is the Kokoro which has numerous nuances inEnglish, including the authentic/sincere “mind of the heart”:
The second character Karada also has numerous nuances in English, and includes the autonomic nervous system and amygdala (aka “lizard brain”).
When these two are combined they are pronounced Shin-Shin, which implies the duality of heart and mind. In the West, we often think of our heart and mind as separate. In the East, however, they are considered to have been originally one and the same; heart and mind cannot coherently exist independently.
The final character is a complex combination of strokes containing the character "ito" meaning thread, yarn, or string. Therefore the final character is becomes Toitsu; meaning to tie together, bind, or unify:
Contents

The use of the term unify implies that separation from our original and natural state (inner ease) is whatcauses fear, uncertainty, and doubt (FUD). Expressing them together as "heart + mind” implies that they can coexist harmonically.
Thus another rendering of Shin Shin Toitsu becomes: "to realize the original oneness of the heart-mind connection"; and Shin Shin Toitsu Trading becomes "Trading with the heart and mind as one."
In this way, we can gain a deeply intuitive (and seemingly supernatural) trading edge as we positively impact the world around us thanks to HeartMath’s ultra-simple yet amazingly powerful Inner-Ease™ technique below.
Acquiring Your Edge
Although owning one of the several nifty HeartMath gadgets can be quite helpful – they are by no means necessary to derive the wondrous benefits of heart-brain coherence. Like any brand new skill you learn for the very first time, it’ll require a bit of practice to really see and feel the full effect.
The great news is that its fast and super simple to do. While this handy guide goes more into the nitty-gritty details, what follows is a quick and easy method to add inner ease to all areas of your life by practicing the HeartMath Inner-Ease™ Technique.
Moreover, it takes only a short amount of practice to enjoy profound results; thus it’s massively beneficial to do this all throughout your day, a few minutes here and there.
[Editor Note: I cannot highly enough recommend HeartMath’s free “The HeartMath Experience” 90-minute introduction to HeartMath science and techniques.]
HeartMath® Inner-Ease Technique
Prior to entering into each new trading session, optimize your heart-brain coherence with 3-5 minutes of refreshing Heart-Focused Breathing covered below.
Moreover, if you detect that you are stressed (feelings of frustration, impatience, anxiety, overload, anger, being judgmental, mental gridlock, et al), acknowledge your feelings as soon as you sense that you are out of sync.
Then take a short time-out and do Heart-Focused Breathing – this has been shown to help create coherent wave patterns in your heart rhythm and help re-establish balance and calm in your mental and emotional nature while activating the affirming power of your heart:
1. Breathe a little slower and more rhythmic than you normally would;
2. Imagine you are breathing in and out through your heart or chest area;
3. During Heart-Focused Breathing, imagine with each breath that you are drawing in and exhaling a feeling of inner ease and infusing your mental and emotional nature with balance and self-care from your heart.
Contents

The important thing is to both imagine – and feel from deep within your heart – an electromagnetic field of inner ease radiating from your heart as you continue your Heart-Focused Breathing (keeping your mind focused on the solar plexus region). Putting your hands on your heart also greatly helps in this regard, as it shifts your mental focus to your heart.
If you find your mind starting to wander, gently redirect it back down to your heart.
Once you are feeling a profound sense of calm/balance, affirm with a heartfelt commitment that you want to anchor and maintain a state of calm, balanced ease as you re-engage in not just your trading activities – but also all of your projects, challenges or daily interactions.
Not to be confused with NLP anchoring (completely different albeit fully compatible), coherence anchoring sets up a new emotional baseline reference point; meaning that when you're emotionally outof phase, it will be significantly quicker and easier to regain your emotional balance (almost instantly, once you get the hang of it).
Moreover, as you become anchored, you'll feel more buoyant. More power and coherence will measurably flow through your system. This will give you more capacity to move beyond emotional distortion and tap straight into an unlimited reservoir of deep nonlocal intuition (faster than the speed of thought) 24/7.
Inner-Ease is not a tool that makes place your challenges simply dissolve or your causes your deep-rooted behavior patterns to change instantly, as that would require a couple of other HeartMath tools (HeartMath’s Freeze-Frame technique + Cut-Thru method).
However, what Inner-Ease does do:
• It quickly and easily (re-)establishes a baseline calm/inner ease via heart-brain coherence.
• It creates an extra time window, allowing deeper discernment for highly intuitive heart-intelligent choices — conscious choices that can simultaneously open up new opportunities while also helping to prevent and resolve many unnecessary/unwanted predicaments.
• It helps us attune our mental and emotional nature to the most reasonable and effective way for responding to each situation that life brings us (aka the “path of least resistance”).
H/T: This technique courtesy of HeartMath.org.
Contents
Part I: Candlestick Essentials Made Easy
Introduction
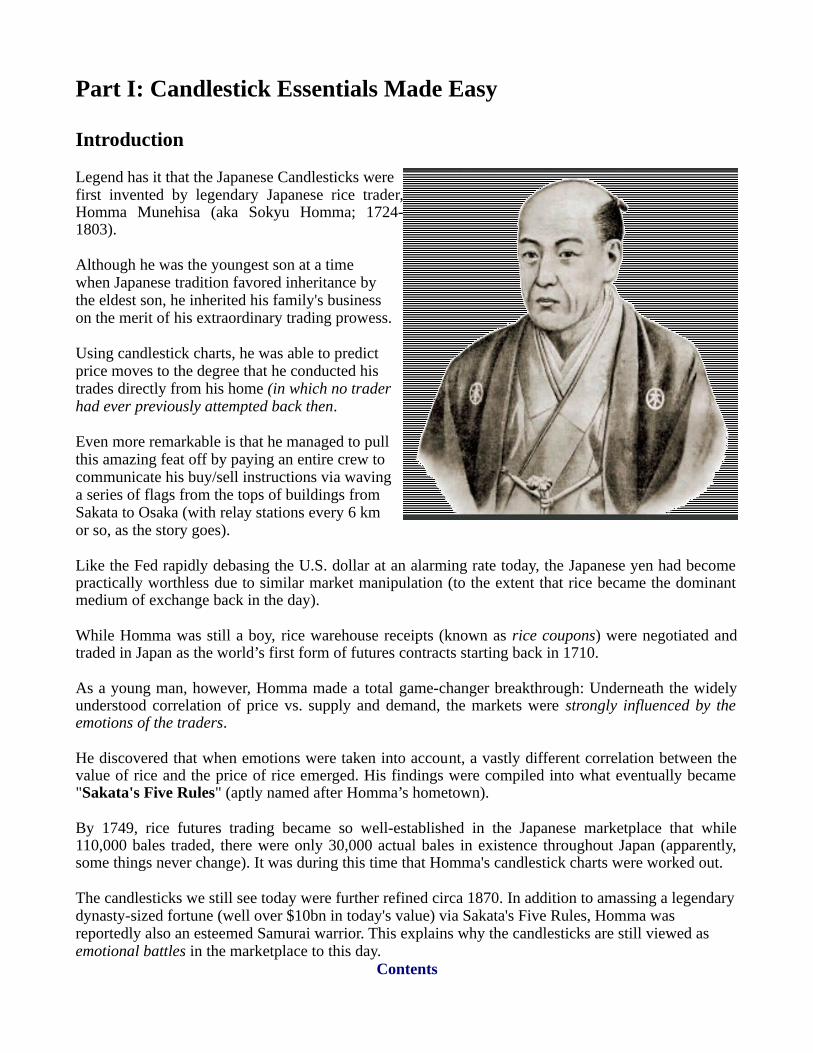
Legend has it that the Japanese Candlesticks werefirst invented by legendary Japanese rice trader,Homma Munehisa (aka Sokyu Homma; 1724-1803).
Although he was the youngest son at a timewhen Japanese tradition favored inheritance bythe eldest son, he inherited his family's businesson the merit of his extraordinary trading prowess.
Using candlestick charts, he was able to predictprice moves to the degree that he conducted histrades directly from his home (in which no traderhad ever previously attempted back then.
Even more remarkable is that he managed to pullthis amazing feat off by paying an entire crew tocommunicate his buy/sell instructions via wavinga series of flags from the tops of buildings fromSakata to Osaka (with relay stations every 6 kmor so, as the story goes).
Like the Fed rapidly debasing the U.S. dollar at an alarming rate today, the Japanese yen had becomepractically worthless due to similar market manipulation (to the extent that rice became the dominantmedium of exchange back in the day).
While Homma was still a boy, rice warehouse receipts (known as rice coupons) were negotiated andtraded in Japan as the world’s first form of futures contracts starting back in 1710.
As a young man, however, Homma made a total game-changer breakthrough: Underneath the widelyunderstood correlation of price vs. supply and demand, the markets were strongly influenced by theemotions of the traders.
He discovered that when emotions were taken into account, a vastly different correlation between thevalue of rice and the price of rice emerged. His findings were compiled into what eventually became"Sakata's Five Rules" (aptly named after Homma’s hometown).
By 1749, rice futures trading became so well-established in the Japanese marketplace that while110,000 bales traded, there were only 30,000 actual bales in existence throughout Japan (apparently,some things never change). It was during this time that Homma's candlestick charts were worked out.
The candlesticks we still see today were further refined circa 1870. In addition to amassing a legendary dynasty-sized fortune (well over $10bn in today's value) via Sakata's Five Rules, Homma was reportedly also an esteemed Samurai warrior. This explains why the candlesticks are still viewed as emotional battles in the marketplace to this day.
Contents
Sakata's Five Rules Nutshelled
Back in the day, traders in Sakata followed a set of methods called Sakata’s Constitution. Homma later adapted Sakata's Five Rules from this constitution. Japanese culture at the time believed the number 3 to be a mystical number, which is why all of Sakata's Five Methods consist of patterns of three.
Homma taught that upon discovering a lucrative trade, the trader should wait for three days (the equivalent of three candlesticks on the applicable candlestick chart time frame). If the trade still looked good after three days, Homma believed it would be profitable.
The Three Mountains pattern shows three candlesticks moving up or down in a trend. Usually, this pattern indicates that the trend is about to end.
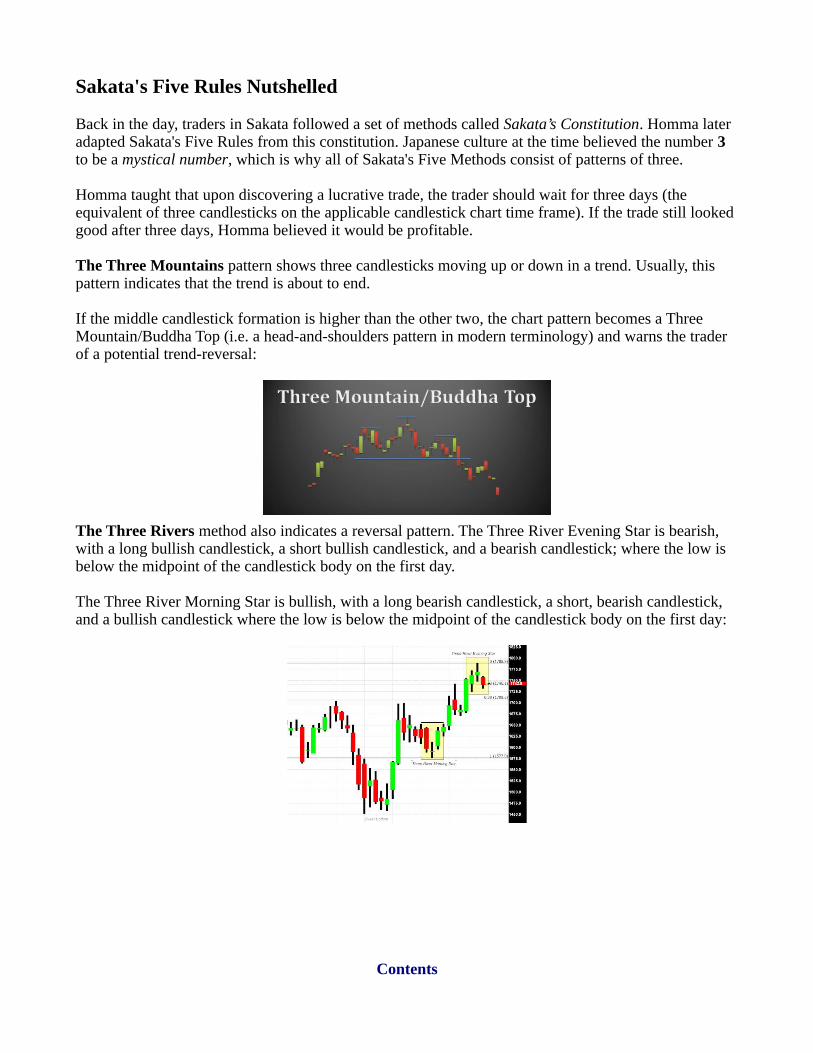
If the middle candlestick formation is higher than the other two, the chart pattern becomes a Three Mountain/Buddha Top (i.e. a head-and-shoulders pattern in modern terminology) and warns the trader of a potential trend-reversal:
The Three Rivers method also indicates a reversal pattern. The Three River Evening Star is bearish, with a long bullish candlestick, a short bullish candlestick, and a bearish candlestick; where the low is below the midpoint of the candlestick body on the first day.
The Three River Morning Star is bullish, with a long bearish candlestick, a short, bearish candlestick, and a bullish candlestick where the low is below the midpoint of the candlestick body on the first day:
Contents

The Three Gaps formation appears when the opening price moves significantly higher or lower than the close of the last candlestick and creates an empty spot on the chart thus indicating a trend reversal:
The Three Parallel Lines pattern refers to three consecutive candlesticks going the same way and having a similar height, thus indicating a strong likelihood that the current trend will continue.
The Rising Three formation is a candlestick followed by three of the opposite candlesticks and then another candlestick of the original polarity, indicating market indecisiveness.
Bearish Rising Three: Bullish Rising Three:
Contents

The Most Important Candlestick Attributes
Regardless of the specific trading strategy or candlestick pattern – there are three attributes of every candlestick worth committing to memory.
All other factors being equal, just digesting these three attributes alone will turbocharge your price action analysis and give you a HUGE competitive advantage.
In no particular order of importance, they are:
• Length of the candle body (aka "real body"). The length shows to what degree who's in control – the longer the real body and shorter the shadows, the stronger the candle is regardless of polarity. No shadows equate to a very strong candlestick relative to its overall length.
• Length of the shadows (aka "wicks" and "tails"). The longer the shadows, the further the trading action occurred beyond the real body open and close. By extension, the longer the shadows and shorter the real body, the weaker the candle is (due to greater market indecision).
• The overall ratio of the shadows relative to the real body. In general, a large real body with short shadows indicates a more definitive buying or selling pressure. Conversely, short candlesticks with relatively long shadows indicate little substantive price movement and represent market indecision/consolidation.
We shall now dive a bit deeper into the most salient granular nuances and how they apply in different circumstances.
Contents

Candlestick Intricacies
While green candlesticks are bullish and red candles are bearish in and of themselves, it ultimately depends on their position relative to the broader candlestick pattern emerging.
Being said:
• Long green bullish candlesticks show strong buying pressure. The longer the bullish candlestickis, the further price action significantly advanced from open to close (buyers were exuberant).
• An unusually long candlestick often foreshadows a potential turning point or support level (panic buying or selling gets too aggressive after a long advance, leading to exhaustion).
• The strongest of candlesticks are the Marubozu brothers Green and Red: The longer, the more potent. Marubozu have very little to no upper or lower shadows. The quintessential Marubozu isa long candlestick in which the high and low are the actual open and close (no shadows at all).
• A Green Marubozu forms when buyers dominate price action from the 1st trade to the last.
• A Red Marubozu forms when the sellers dominate price action from the 1st trade to the last.
Contents

Catching The Candle By The Tail
The upper and lower candlestick shadows provide valuable information about the trading session:
• Candlesticks with a long upper wick and short lower tail indicate that while buyers dominated the session (bidding prices higher), sellers ultimately won out by forcing prices down from theirhighs. This contrast of strong high and weak close resulted in a long upper wick.
• Conversely, candlesticks with long tails and short wicks indicate that sellers dominated the session and drove prices lower. However, the Bulls later reared their horns and bid prices up higher by the end of the session (thus the strong low and weak close created a long lower tail).
Candlesticks with a small real body and only one long upper wick or lower tail (such as a Bearish or Bullish Hammer) typically represent a reversal of sorts. Likewise, candles with a small real body and two relatively long shadows (called spinning tops) also represent an indecision tug-of-war:
In the above illustration, the small candle body indicates low energy from open to close. Yet the shadows indicate that both the Bulls and Bears were active during the session.
Since neither could gain the upper hand, it ended up in a standoff:
• After a long green candlestick, a spinning top indicates weakness among the bulls and a potential change or interruption in trend.
• After a long red candlestick, a spinning top indicates weakness among the bears and a potential change or interruption in trend.
This now brings us to the strongest of the market-indecision candlesticks...
Contents

Powerful Doji Tips For Serious Crypto Traders
Information-rich doji represent an important type of candlestick that are neutral patterns in and of themselves, yet provide excellent information as key components of powerful candlestick patterns.
Fun Fact: Counter-intuitive to the English language, the word “doji” refers to both the singular and plural form; so there is no such thing as “dojis”.
Doji have a distinct wafer-thin real body and often sport freakishly long wicks or tails which form when the open and close are virtually equal (strong market indecision). The combined upper and lower doji shadow lengths reflect the degree of market indecision: the longer the shadows, the more extreme the indecision (and thus, the stronger the doji).
Combined with the previous 2-candlestick price action bias and 2-candlestick future confirmation, doji help to form some of the most powerful of the several dozen candlestick patterns.
When learning to read candlestick chart patterns, doji and spinning tops (and by extension – hammers and shooting stars) are of such paramount importance that they are the base-layer foundation of the Way Of The Candlestick Master™.
It is typically unwise to rely on these candles purely on their own. Clustered together, however, they boldly announce the probability of an intermediate trend reversal.
Being said, the appearance of an extremely strong doji (including a hammer or shooting star) and/or a combination of multiple closely-grouped doji and spinning tops are worth tuning into for a probabilistictrend shift up ahead.
Moreover, seeing both a single strong doji AND a cluster of indecision candles has an overwhelmingly strong probability of seeing a trend reversal.
Although doji are the most prominent of the four... spinning tops, hammers, shooting stars, and doji all share one key characteristic: They convey a sense of indecision – an emotional tug-of-war between buyers and sellers (and exponentially more so when closely clustered).
Essentially, spinning tops are weak doji still worth keeping an eye on; whereas hammers and shooting stars are even stronger since they are a hybrid spinning top/gravestone doji or spinning top/dragonfly doji. Aside from the most common doji signal, the other three main types of doji candlesticks include:
• Long-Legged Doji: Have long upper and lower shadows almost equal in length. However, the trader should observe the candle’s close relative to the midpoint. A close below the midpoint of the candle indicates weakness. This signal indicates that prices traded well above and below the session's opening level, but the close shows little change from the open.
• Dragonfly Doji: Forms a “T” when the open, high, and close are equal. The low creates a long tail with no wick. This signal indicates that sellers drove the prices lower during the session. However, by the end of the session, the Bulls pushed the prices back to the opening and high.
• Gravestone Doji: Opposite of the dragonfly doji, it forms an upside-down "T". It has a long wick and no tail, and it forms when the open, low, and close are equal. It indicates that the
Contents

buyers drove prices higher during the session, then prices came back down to the opening level and the session-low due to the sellers.
While doji with equal open and close wick lengths are consideredmore robust, take heed when ANY spinning tops or doji appear –and especially in multiples.
As previously mentioned, this reversal formation becomes evenstronger if a hammer or shooting star also appears within 1-2candlesticks on either side.
The bigger the cluster, the more probable, more intense, andquicker the reversal tends to be (particularly in conjunction withtime-proven oscillators such as the MACD and RSI).
When a relatively long bullish candlestick (aka “Lightsaber ofJoy”) is followed up by a doji or spinning top, it signals that thebuying pressure is starting to weaken. Conversely, a relativelylong bearish candlestick (aka “Lightsaber of Doom” followed bya doji signals that selling pressure is starting to diminish.
Although extremely rare in crypto charts (vs. traditional stock charts), noticeable gap-up or gap-down between the candlestick and the doji (1st & 3rd candle patterns below) is a significantly stronger reversalindication:
In his book Candlestick Charting Explained, Candlestick Master Greg Morris notes that for a pattern to qualify as a reversal pattern, there should be a prior trend to reverse (i.e. not merely just a choppy ranging/sideways trend). Trend direction can be determined using several different methods such as trend lines, moving averages, or other aspects of technical analysis (covered in detail below).
The trend length and duration will depend on individual preferences. For example, a downtrend might exist as long as the asset was trading below its down trend line, below its previous reaction high, or below a specific moving average. It is also helpful to closely observe the last 5-10 candlesticks of price action, relative to the overall determined trend.
Contents
Pro Candlestick Tips:
• Gaps not only strengthen doji-related signals but ALL candlestick patterns in varying degrees; based on the exact circumstances surrounding the direction, size, and the number of gaps with a particular candlestick pattern.
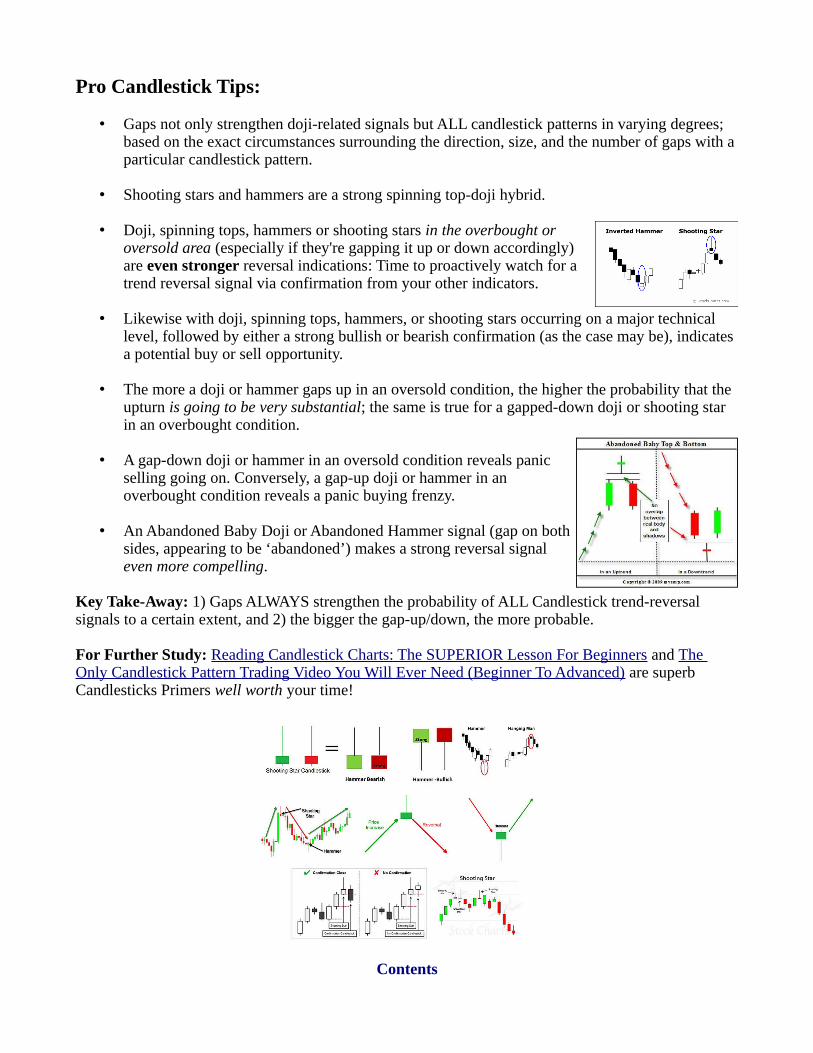
• Shooting stars and hammers are a strong spinning top-doji hybrid.
• Doji, spinning tops, hammers or shooting stars in the overbought oroversold area (especially if they're gapping it up or down accordingly)are even stronger reversal indications: Time to proactively watch for atrend reversal signal via confirmation from your other indicators.
• Likewise with doji, spinning tops, hammers, or shooting stars occurring on a major technical level, followed by either a strong bullish or bearish confirmation (as the case may be), indicates a potential buy or sell opportunity.
• The more a doji or hammer gaps up in an oversold condition, the higher the probability that the upturn is going to be very substantial; the same is true for a gapped-down doji or shooting star in an overbought condition.
• A gap-down doji or hammer in an oversold condition reveals panicselling going on. Conversely, a gap-up doji or hammer in anoverbought condition reveals a panic buying frenzy.
• An Abandoned Baby Doji or Abandoned Hammer signal (gap on bothsides, appearing to be ‘abandoned’) makes a strong reversal signal even more compelling.
Key Take-Away: 1) Gaps ALWAYS strengthen the probability of ALL Candlestick trend-reversal signals to a certain extent, and 2) the bigger the gap-up/down, the more probable.
For Further Study: Reading Candlestick Charts: The SUPERIOR Lesson For Beginners and The Only Candlestick Pattern Trading Video You Will Ever Need (Beginner To Advanced) are superb Candlesticks Primers well worth your time!
Contents
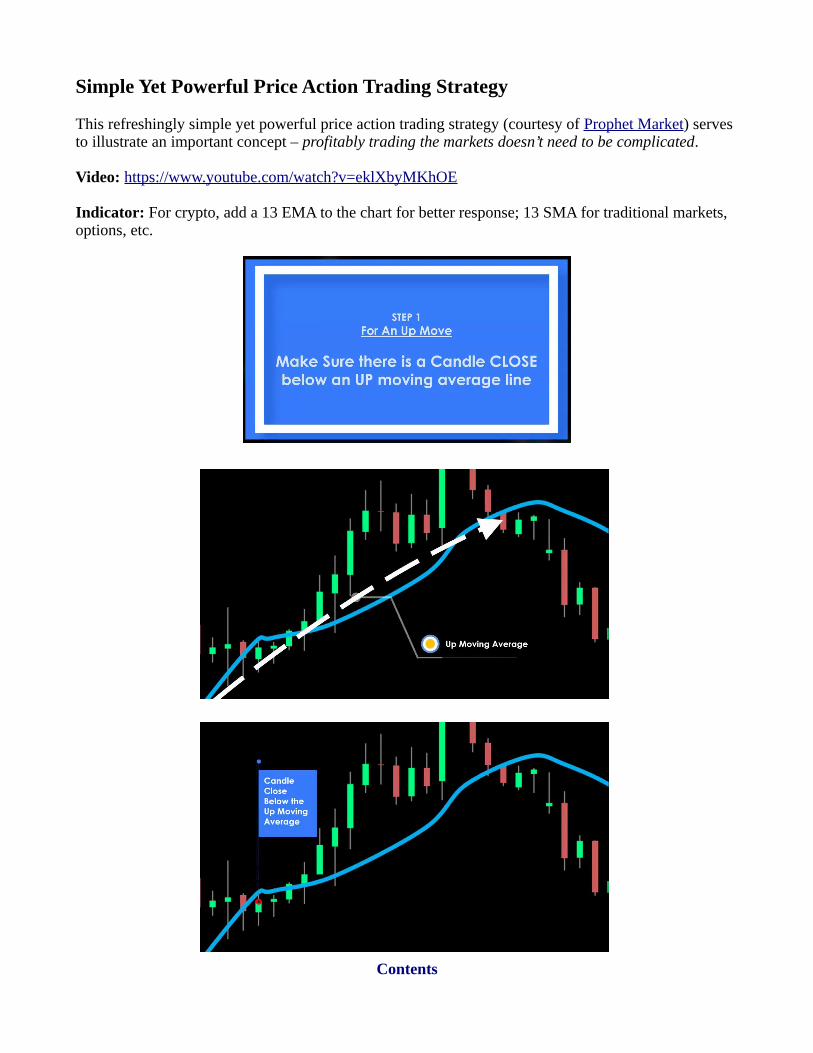
Simple Yet Powerful Price Action Trading Strategy
This refreshingly simple yet powerful price action trading strategy (courtesy of Prophet Market) serves to illustrate an important concept – profitably trading the markets doesn’t need to be complicated.
Video: https://www.youtube.com/watch?v=eklXbyMKhOE
Indicator: For crypto, add a 13 EMA to the chart for better response; 13 SMA for traditional markets, options, etc.
Contents

Contents

Contents

Contents

Part II: Game Overview
Prelude
Generally speaking, there are two types of blockchain-based collectible trading games – intense edge-of-your-seat speed games, and far more laid back/relaxed leisure games.
In the Stellarverse, the Litemint card battle game is in the first category, while ColorGlyph is in the second. Both types of games have their appeal and respective fan bases; which is to say that neither oneis better/worse than the other. It’s merely a matter of taste.
From this perspective, the Way of the Candlestick Master™ Collectible Trading Game leans more toward a leisurely game style, while still capturing the thrills and excitement of gently competitive camaraderie. Summarized, the Way of the Candlestick Master™:
• Is the world’s 1st chain-based collectible trading game featuring high-potency Japanese candle pattern NFTs; made even better thanks to Stellar's ultra-cheap Tx fees, blazingly fast settlement times, and impressive built-in distributed exchange – the stunningly nubile SDEX;
• Retains the relaxing non-video game laid-backness of its predecessors ColorGlyph and CryptoKitties, albeit with more excitement;
• Focuses on building community camaraderie out the gate – a stark contrast to most blockchain-based trading games in which real community-building is usually an inconvenient afterthought.
Overarching Game Objective
Not to confuse simple with ‘easy’, the initial Way of the Candlestick Master™ game objective is quite simple: Go on chart-scanning expeditions called Candlestick Quests in which you create and collect sets of legit Candle NFTs representing the candle patterns within each Candle Collection:
• Accumulate the custom Stellar token Candles (CNDL) while you continue to grab great-looking screenshots – any crypto trading pair/time frame – showcasing the candle patterns within a given Candle Collection (CNDL is both the bounty reward token & proof-of-HODL token used for powering up Candle NFTs).
• When you find a great-looking screenshot worthy of commemorating it as an NFT, simply pin the screenshot to the IPFS via your free Pinata account and tokenize it into a Candle NFT (as per the Community Candle NFT Checklist).
• Once the NFT is created, you’ll then submit it for community adjudication by registering it as per the submission rules.
• And of course you always have the option to buy and/or trade for community-vetted Candle NFTs to grow your Candlestick Collections even faster.
Important Note: Since the relatively few Candle NFTs that Brother Maff himself creates will not be for sale (only awarded for outstanding game achievements), this leaves the market WIDE open for juicy player profits!
Contents

Candlestick Collections & Quests
Initially, Candlestick Collections are comprised of 10-15 specific candles patterns per collection:
• Each separate and unique community-created and registered Candle NFT represents a specific candle pattern within one or more specific Candlestick Collections.
• Each Candlestick Quest will comprise of 5-10 candle patterns directly relating to a specific Candlestick Collection.
Candlepower Value:
The CNDL bounty rewarded for the successful completion of a Candlestick Quest is directly proportional to the Candlepower Value (CPV) of the Quest.
The Candlestick Quest CPV is determined by the total amount of CNDL held by the player at the point their bounty is affirmatively adjudicated + any additional bonus modifiers (such as the rarity of certain candlestick patterns). From this perspective, Candles are the proof-of-burn token for powering up Candle NFTs, as well as the Candlestick Quest Bounty reward token.
Candlestick Quest Bounty Criteria:
Bounties awarded for successfully completing Candlestick Quests are based on the following criteria:
• The collective CPV of the individual Candle NFTs accumulated toward a specific Candlestick Quest;
• Multiplied by any applicable Bonus Modifiers (i.e. if you submitted a perfect Candlestick QuestBounty claim, or you’re lucky enough to own an exceedingly rare and highly-coveted Bounty Doubler NFT, et al).
Quest Bounty Submissions:
Upon completing a Candlestick Quest, you’ll then register your Quest Bounty Claim by submitting blockchain-verifiable proof of ownership of the Candle NFTs accumulated towards a specific Candlestick Collection for community adjudication.
Once the community has been granted up to 24 hours to find any discrepancies with a Quest Bounty claim (i.e. via Stellar.expert or similar) and any discrepancies were made whole, then the well-deservedCandles will be sent to your associated Stellar public key shortly thereafter.
Candle NFT Certification
GalacticChain NFT certification is the official ‘canonization’ of a rigorously-inspected Candle NFT to be inducted into the GalacticChain canon (literally just as Brother Maff himself created it). Simply put, having your NFT certified guarantees that it is 100% genuine and legit.
Contents

However, under no circumstance whatsoever can a community-created Candle NFT be certified until it is first registered and thoroughly vetted by the community.
Candle NFT Certification Perks:
• Its very own GalacticChain Certificate of Authenticity pinned to the IPFS signifying its Stellar Asset ID #, issuer public key, and candle pattern image; and signed with the official GalacticChain NFT certification public key.
• A bare minimum 2X Candlepower boost; based on 1) what the public key submitting Candle NFT for registration was already powered up with at point of certification, 2) multiplied by the Rarity Factor of the candle pattern (if applicable) – and then doubled.
• An NFT Certification Badge added to the player’s user profile, followed up with a community-wide announcement commemorating the newest Candle NFT induction into the official GalacticChain canon.
• The newly-certified Candle NFT’s asset ID#, issuer public key, and IPFS link will also be addedto the official Way of the Candlestick Master™ Collector Catalog (TBA).
Further Game Insights
For further GalacticChain game insights, kindly direct your browser to the following GalacticChain articles:
• Trustlines, Path Payments & Tools Of The Game
• Game Strategy Considerations [Pt. 1]
• Game Strategy Considerations [Pt. 2 ]
• Can Stellar Solve The Fatal Flaw Of Enjin/Ethereum? [Pt. 1]
• Can Stellar Solve The Fatal Flaw Of Enjin/Ethereum? [Pt. 2 ]
If you’d like to stay abreast of further game developments and be among the very first to when the Wayof the Candlestick Master™ game goes live, simply subscribe to the GalacticChain RSS feed (bottom of each post). - Brother Maff
Contents
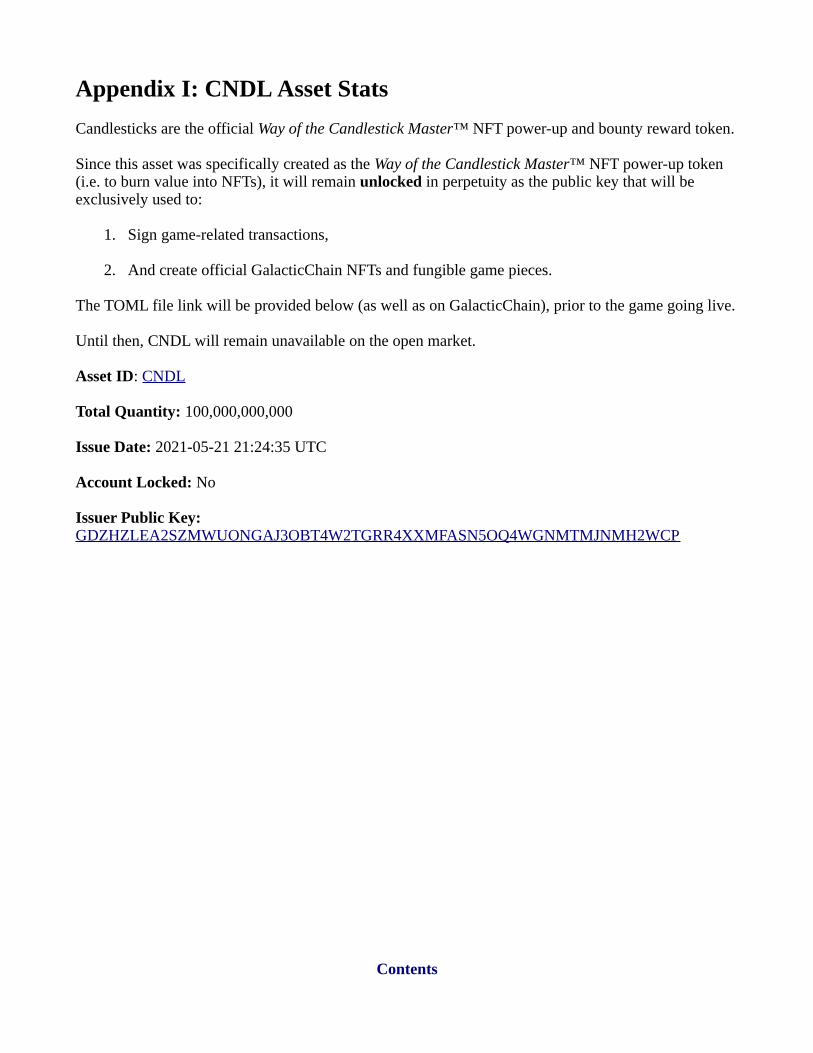
Appendix I: CNDL Asset Stats
Candlesticks are the official Way of the Candlestick Master™ NFT power-up and bounty reward token.
Since this asset was specifically created as the Way of the Candlestick Master™ NFT power-up token (i.e. to burn value into NFTs), it will remain unlocked in perpetuity as the public key that will be exclusively used to:
1. Sign game-related transactions,
2. And create official GalacticChain NFTs and fungible game pieces.
The TOML file link will be provided below (as well as on GalacticChain), prior to the game going live.
Until then, CNDL will remain unavailable on the open market.
Asset ID: CNDL
Total Quantity: 100,000,000,000
Issue Date: 2021-05-21 21:24:35 UTC
Account Locked: No
Issuer Public Key: GDZHZLEA2SZMWUONGAJ3OBT4W2TGRR4XXMFASN5OQ4WGNMTMJNMH2WCP
Contents
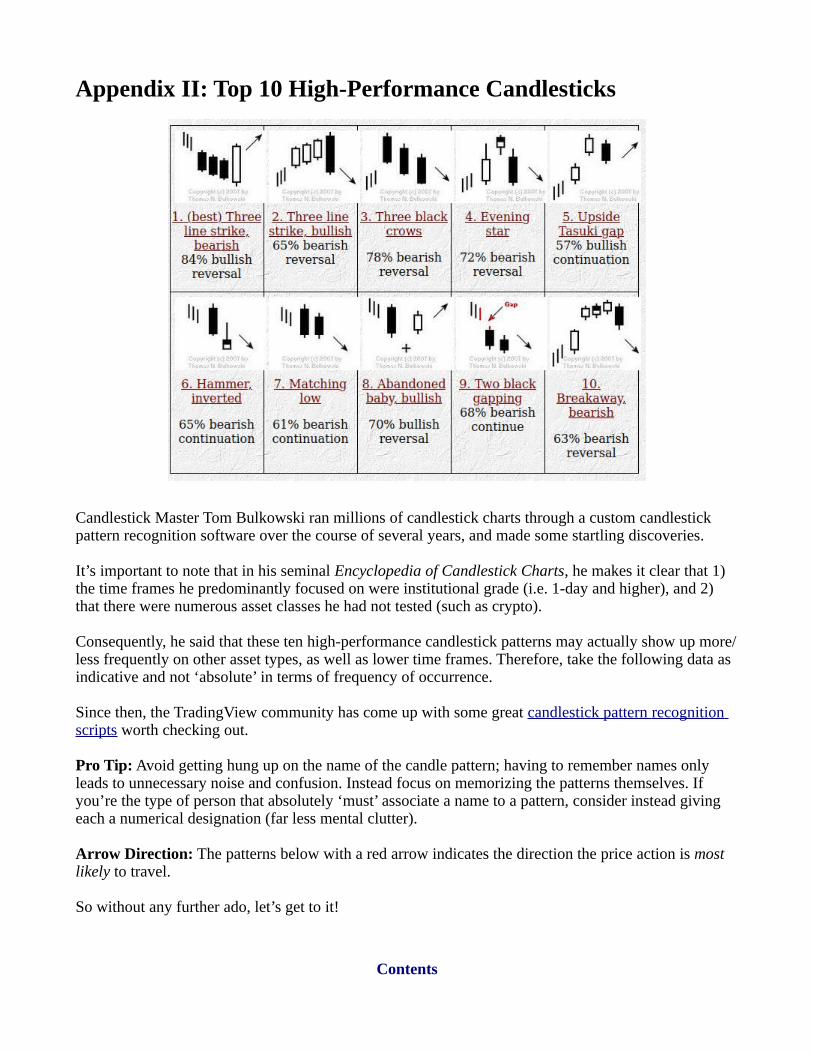
Appendix II: Top 10 High-Performance Candlesticks
Candlestick Master Tom Bulkowski ran millions of candlestick charts through a custom candlestick pattern recognition software over the course of several years, and made some startling discoveries.
It’s important to note that in his seminal Encyclopedia of Candlestick Charts, he makes it clear that 1) the time frames he predominantly focused on were institutional grade (i.e. 1-day and higher), and 2) that there were numerous asset classes he had not tested (such as crypto).
Consequently, he said that these ten high-performance candlestick patterns may actually show up more/less frequently on other asset types, as well as lower time frames. Therefore, take the following data as indicative and not ‘absolute’ in terms of frequency of occurrence.
Since then, the TradingView community has come up with some great candlestick pattern recognition scripts worth checking out.
Pro Tip: Avoid getting hung up on the name of the candle pattern; having to remember names only leads to unnecessary noise and confusion. Instead focus on memorizing the patterns themselves. If you’re the type of person that absolutely ‘must’ associate a name to a pattern, consider instead giving each a numerical designation (far less mental clutter).
Arrow Direction: The patterns below with a red arrow indicates the direction the price action is most likely to travel.
So without any further ado, let’s get to it!
Contents
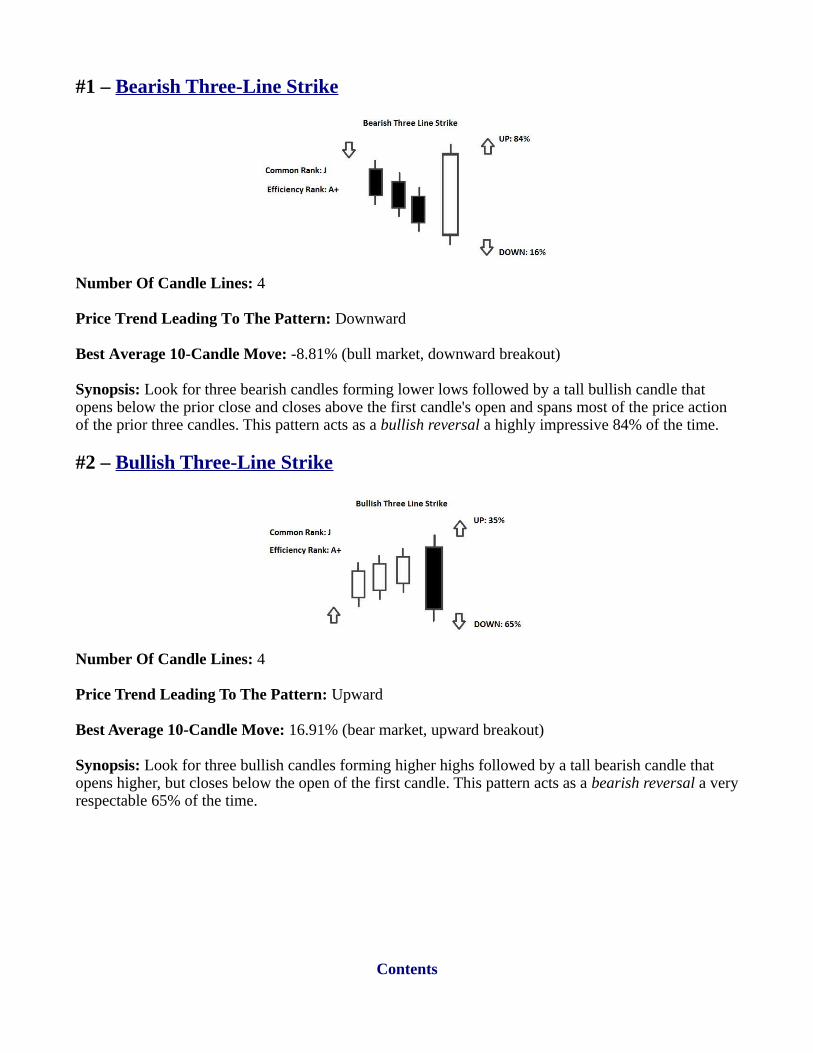
#1 – Bearish Three-Line Strike
Number Of Candle Lines: 4
Price Trend Leading To The Pattern: Downward
Best Average 10-Candle Move: -8.81% (bull market, downward breakout)
Synopsis: Look for three bearish candles forming lower lows followed by a tall bullish candle that opens below the prior close and closes above the first candle's open and spans most of the price action of the prior three candles. This pattern acts as a bullish reversal a highly impressive 84% of the time.
#2 – Bullish Three-Line Strike
Number Of Candle Lines: 4
Price Trend Leading To The Pattern: Upward
Best Average 10-Candle Move: 16.91% (bear market, upward breakout)
Synopsis: Look for three bullish candles forming higher highs followed by a tall bearish candle that opens higher, but closes below the open of the first candle. This pattern acts as a bearish reversal a veryrespectable 65% of the time.
Contents

#3 – Three Black Crows
Number Of Candle Lines: 3
Price Trend Leading To The Pattern: Upward
Best Average 10-Candle Move: 13.31% (bear market, upward breakout)
Synopsis: Look for three tall bearish candles that appear in an upward price trend. Candles 2 and 3 of the pattern should open within the body of the prior candle, and all three should close near their lows, making new lows along the way. Moves downward 78% of the time.
#4 – Evening Star
Number Of Candle Lines: 3
Price Trend Leading To The Pattern: Upward
Best Average 10-Candle Move: 8.77% (bear market, upward breakout)
Synopsis: Look for a tall bullish candle in an upward price trend. Following that, a small bodied candle(any color) should gap above/sit above the bodies of the two adjacent candles (shadows are irrelevant). The last day is a tall bearish candle that opens below the prior candle, and closes at least midway down the body of the first day. Heads south 72% of the time.
Contents

#5 – Upside Tasuki Gap
Number Of Candle Lines: 3
Price Trend Leading To The Pattern: Upward
Best Average 10-Candle Move: -9.20% (bear market, downward breakout)
Synopsis: Look for a bullish candle in an upward price trend. Following that, find another white candle, but this one gaps higher and that includes a gap between the shadows of the two candles. The last day is a bearish candle that opens in the body of the prior candle and closes within the gap created between the first two candles. Moves north 57% of the time.
#6 – Inverted Hammer
Number Of Candle Lines: 2
Price Trend Leading To The Pattern: Downward
Best Average 10-Candle Move: 7.74% (bear market, upward breakout)
Synopsis: Look for a tall bearish candle with a close near the candle's low followed by a short candle with a tall upper shadow (taller is better) and little/no lower tail. The 2nd candle cannot be a doji (must be a distinct hammer) and the open on the 2nd candle must be below the prior candle's close. Moves downward 65% of the time.
Contents

#7 – Matching Low
Number Of Candle Lines: 2
Price Trend Leading To The Pattern: Downward
Best Average 10-Candle Move: 7.15% (bear market, upward breakout)
Synopsis: Look for a bearish candle with a tall body. Following that, find a bearish body with a close (not the low) that matches the prior close. 61% of heading south.
# 8 – Bullish Abandoned Baby
Number Of Candle Lines: 3
Price Trend Leading To The Pattern: Downward
Best Average 10-Candle Move: -10.31% (bear market, downward breakout)
Synopsis: Look for the bullish abandoned baby in a downward price trend and find a bearish candle as the 1st candle. Following that, a doji should appear that gaps below the 2 adjacent candle shadows. The last day is a bullish candle with a lower shadow that remains above the top of the doji. 70% upward.
Contents

#9 – Two Black Gapping
Number Of Candle Lines: 2
Price Trend Leading To The Pattern: Downward
Best Average 10-Candle Move: 6.45% (bear market, upward breakout)
Synopsis: Look for a price gap followed by two bearish candles. The second bearish candle should have a high below the prior candle's high. 68% chance downward.
#10 – Bearish Breakaway Candlestick
Number Of Candle Lines: 5
Price Trend Leading To The Pattern: Upward
Best Average 10-Candle Move: 6.66% (bull market, upward breakout)
Synopsis: Look for 5 candle lines in an upward price trend with the 1st candle being a tall bullish one.
The second day should be a bullish candle with a gap between the two bodies, but the shadows can overlap. Day three should have a higher close and the candle can be either color. Day 4 shows a bullish candle with a higher close. The last day is a tall bearish candle with a close within the gap between the bodies of the first two candles. 63% chance of going south.
Contents
Appendix III: Cradle Zone Trading Strategy
H/T to Craig Cobb and Josh from CryptoBusy for the core crypto trading strategy below. After initiallyfamiliarizing yourself with the Cradle Zone Trading Strategy, this video and this video go into much more granular detail (with numerous examples).
Kindly note that the 200 EMA is nowhere to be found in either of the above videos.
Since this is the #1 overarching indicator Big Money uses to determine overall trend, it was added to quickly and concisely determine the direction and strength of the trend (with respect to price action, and the 10 & 20 EMAs). This adds much stronger validity to the Cradle Zone Trading Strategy.
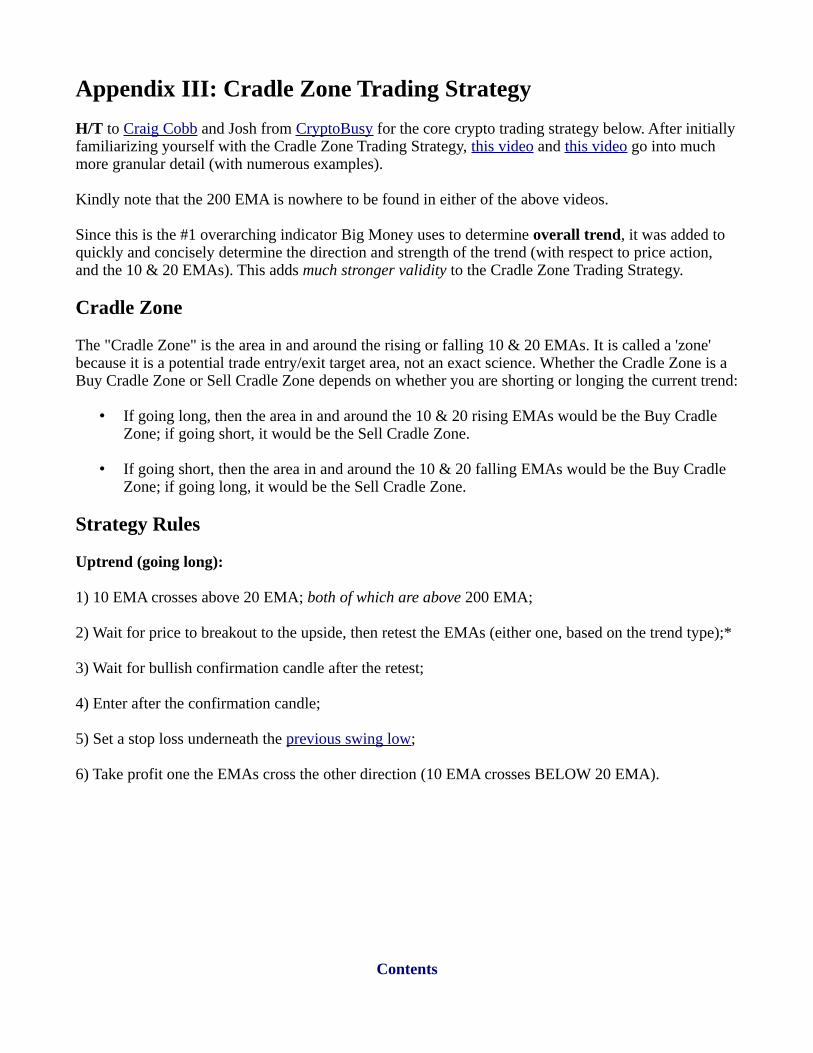
Cradle Zone
The "Cradle Zone" is the area in and around the rising or falling 10 & 20 EMAs. It is called a 'zone' because it is a potential trade entry/exit target area, not an exact science. Whether the Cradle Zone is a Buy Cradle Zone or Sell Cradle Zone depends on whether you are shorting or longing the current trend:
• If going long, then the area in and around the 10 & 20 rising EMAs would be the Buy Cradle Zone; if going short, it would be the Sell Cradle Zone.
• If going short, then the area in and around the 10 & 20 falling EMAs would be the Buy Cradle Zone; if going long, it would be the Sell Cradle Zone.
Strategy Rules
Uptrend (going long):
1) 10 EMA crosses above 20 EMA; both of which are above 200 EMA;
2) Wait for price to breakout to the upside, then retest the EMAs (either one, based on the trend type);*
3) Wait for bullish confirmation candle after the retest;
4) Enter after the confirmation candle;
5) Set a stop loss underneath the previous swing low;
6) Take profit one the EMAs cross the other direction (10 EMA crosses BELOW 20 EMA).
Contents
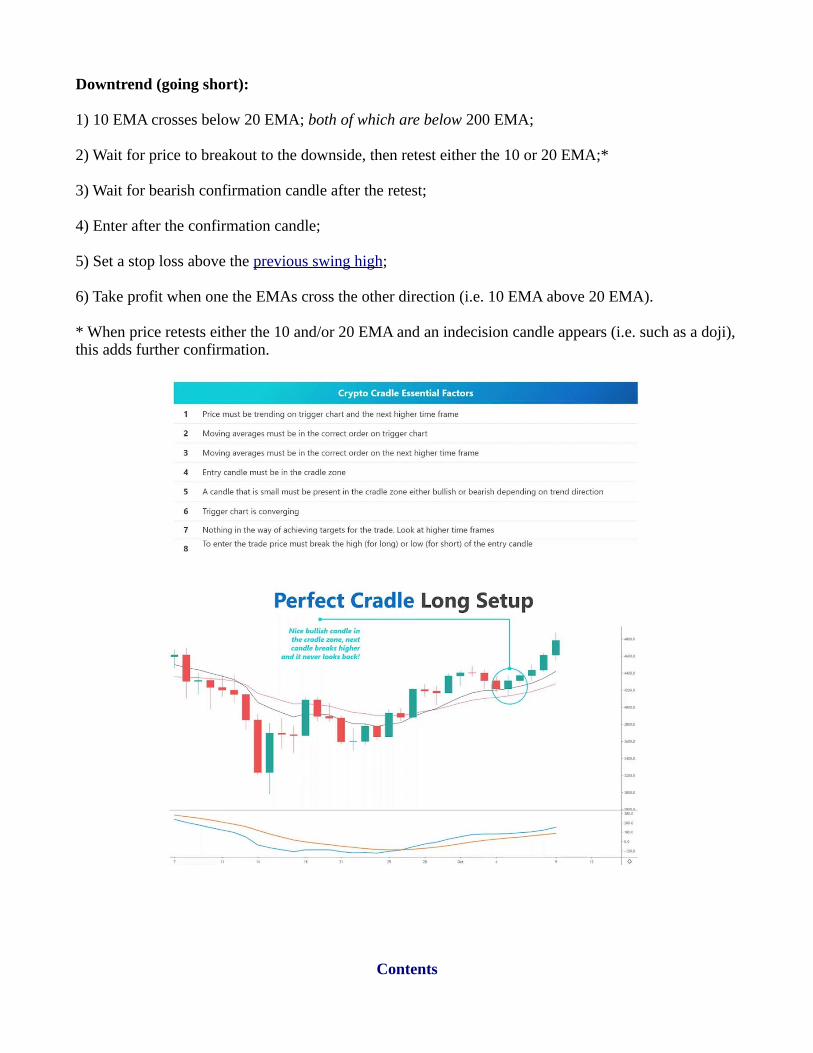
Downtrend (going short):
1) 10 EMA crosses below 20 EMA; both of which are below 200 EMA;
2) Wait for price to breakout to the downside, then retest either the 10 or 20 EMA;*
3) Wait for bearish confirmation candle after the retest;
4) Enter after the confirmation candle;
5) Set a stop loss above the previous swing high;
6) Take profit when one the EMAs cross the other direction (i.e. 10 EMA above 20 EMA).
* When price retests either the 10 and/or 20 EMA and an indecision candle appears (i.e. such as a doji),this adds further confirmation.
Contents

Pro Tip: While a small candle is definitely good when retesting the Cradle Zone, an indecision candle (such as a doji) is even better; thus further strengthening the probabilities of a reversal.
Contents

Support & Resistance Considerations
It would be bad form to not properly instruct you on objectively determining support & resistance levels. In short, the most accurate S/R levels are accomplished with nothing more than straight horizontal lines (diagonal lines are better utilized in determining convergence/divergence and the like).
With that said:
• Swing highs & swing lows are oftentimes an important S/R level;
• Real resistance is when there are at least 2 touches at at a specific upper level "ceiling";
• Real support is when there is at least 2 touches at a specific lower level "floor”;
• When resistance breaks, it often can (but not necessarily will) become a strong support level.
• When support breaks, it often can (but not necessarily will) become a strong resistance level.
• In all cases, more touches equates to stronger S/R probability.
Contents

Appendix IV: Enhanced Cradle Zone Trading Strategy
H/T to The Secret Mindset and Trader DNA for inspiring the following Enhanced Cradle Zone TradingStrategy upgrades!
Brief Introduction While the original Cradle Zone Trading Strategy is a solid jump-off point for developing your own trading system… it leaves lots of room for improvement; hence the Enhanced Cradle Zone Trading Strategy.
Enhancement #1: From the price action standpoint, the trading rules remain the largely the same… except with a twist...
• Original Cradle Zone Trading Strategy – 10 & 20 EMAs to form the cradle (+ 200 EMA to determine overall trend).
• Enhanced Cradle Zone Trading Strategy – Either 12 & 26 EMAs to form the cradle OR change MACD setting to 8/20/5 (not both) + add the 200 EMA to determine overall trend.
The reason for either the 12/26 EMA cradle switch-up or the 8/20/5 MACD switch-up? Trade accuracy.
The 12/26 settings are actually in harmony with the out-of-the-box MACD settings. Conversely, changing the MACD settings to 8/20/5 makes the MACD far more in tune with the 10/20 EMA cradle.
For example, when the MACD line and signal line contacts the center of the histogram, notice just howcrisp the corresponding crossover alignment between the 12 & 26 EMA now becomes:
Apart from the EMA switch-up, the price action trading rules are exactly as per the original Cradle Zone Trading Strategy. And to a certain extent, so are the divergence trading rules as they relate to the MACD… except with a couple of notable twists:
• The original Cradle Zone Trading Strategy (as presented by Craig Cobb) was sadly devoid of the MACD histogram; whereas the Enhanced Cradle Zone Trading Strategy reinstates the histogram back to its rightful place.
Contents

• Consequently, there was only single divergence being taught in the original Cradle Zone Trading Strategy; whereas the Enhanced Cradle Zone Trading Strategy reveals a far more powerful MACD double divergence strategy.
Enhancement #2: MACD Leader (aka MACD-L)
Instead of using the outdated 1st generation MACD, instead try using the vastly improved 2nd generationMACD-L. I’ve always been a huge fan of the MACD from the word go, but ever since I started using the MACD-L… “Holy wowsers, Batman!”
I immediately noticed a profoundly snappier responsiveness (hugely important when trading crypto), and I’ve never looked back since.
MACD Double Divergence Strategy
Although deploying the MACD double divergence strategy will potentially reduce the overall number of signals generated (as compared to the original Cradle Zone Trading Strategy)...
The signals that are generated via the Enhanced Cradle Zone Trading Strategy will be significantly cleaner/stronger (i.e. higher probability). So if having significantly less trading opportunities in general is far less important than having highly accurate signals, you’re gonna like this a lot!
In short, when price action is giving you a particular signal (either buy/long or sell/short) AND the MACD lines are in agreement, as well as the histogram swing direction: VERY probable signal when all 3 are in harmony.
Even if price action and at least one of two MACD indications come into harmony – still a solid signal well worth considering in conjunction with the emerging candlestick patterns, S/R levels, etc.
However, if the MACD and histogram swings are in harmony – BUT price action is signaling otherwise – time to be keeping a close eye on a potential trend shift. The probability of a trend shift becomes immensely stronger when:
• Price action is hugging up on a major S/R level;
• Indecision candles (such as doji, small spinning tops, et al) start showing up;
• And/or a distinct Engulfing signal (relative to the direction of the potential trend shift).
Collectively, this would indicate a HIGHLY probable trend shift ahead. So let us now observe numerous divergence examples to help solidify this powerfully robust strategy.
Contents
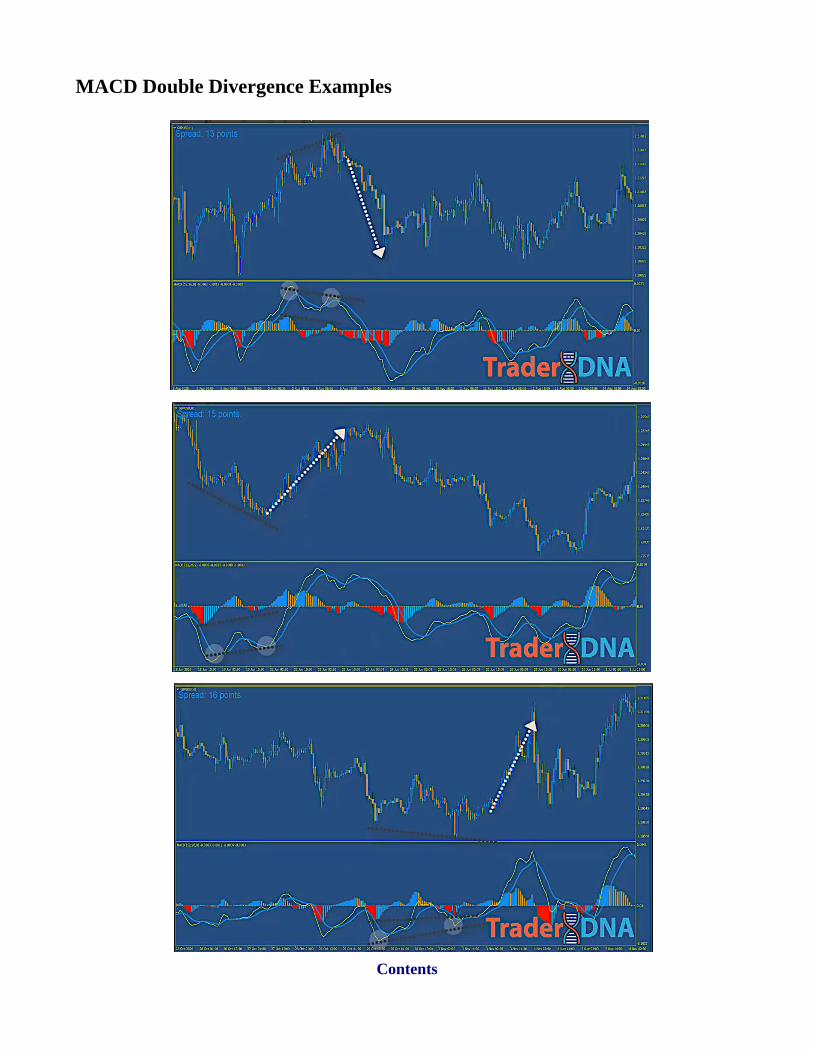
MACD Double Divergence Examples
Contents

Contents

Bringing It All Together
Contents

Contents

Contents

Contents
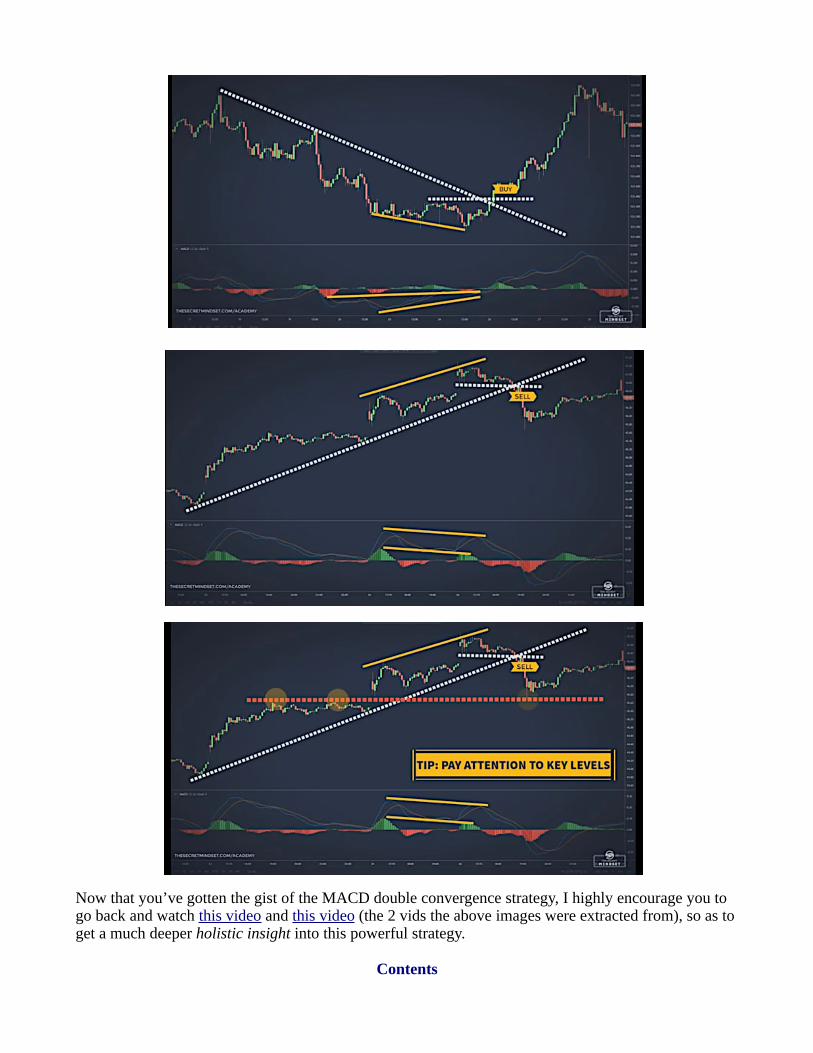
Now that you’ve gotten the gist of the MACD double convergence strategy, I highly encourage you to go back and watch this video and this video (the 2 vids the above images were extracted from), so as to get a much deeper holistic insight into this powerful strategy.
Contents

Appendix V: Top 7 Tips On How Not To Get Rekt
A few hard-learned lessons worth taking to heart, so you don’t have to embrace the suck like I did:
1. Learn to become emotionally detached (think Mr. Spock) and never trade when you’re experiencing unresolved emotional turbulence, for your emotions will always betray you.
2. Avoid ‘marrying’ specific coins/tokens and learn to see them merely as trading instruments.
3. Never, ever get greedy – for it is better to humbly take a small profit with thanksgiving and keep steadily compounding your profits than to get rekt due to being a greedy little beaych.
4. Never trade more than you would gladly pay for your crypto ‘tuition’; because if you can’t comfortably afford to lose it, you’re gonna get rekt; not “if”, but when. The corollary to this – the more desperately you need the money, the faster you'll get rekt.
5. Keep a tight video trading journal of every single one of your orderbook + candlestick chart trade entries & exits (via your preferred video screen grabber of choice) and become a master ofrisk management; thus able to relax and let your profits wander where they may accordingly.
6. When you loyally stick to the trading plan, you become the casino and the probabilities will ultimately work out in your favor. Therefore, either learn to embrace your losses as the acceptable cost of doing business, or embrace the suck – the choice is yours.
7. Never, ever go all in no matter how ‘certain’ you are or how strong your ‘gut feeling’ is. Better is it to get a small percentage of your trading capital liquidated and still be in the game, than to get your whole stack liquidated and have to endure the stress, anxiety and depression that soon follows. Trust me, it royally sucks the big one.
Unadvertised Bonus Tip #1: Never force a trade – always let the trades come to you. Relatively new/inexperienced traders tend to be impatient and want to get in on some action ASAP. You would be wise to avoid such temptations, and instead focus on protecting your capital by chillin’ while the trades come to you. Since crypto is highly volatile – rarely will you have to wait long.
Unadvertised Bonus Tip #2: Any time you lose three trades in a row (and this fully assumes that you are proactively sticking to the trading plan, and not deviating)… walk away and go grab a bite to eat, take a shower, go for a nice walk… whatever it takes to momentarily, yet completely shift your focus.
Then carefully study the three video screen-grabs of those three trades in conjunction (with the TradingView replay feature queued up accordingly) to confirm that you did indeed act exactly according to plan. If so, you’re ready to jump back into a new trading session.
If not, then objectively study your mistakes until you know exactly where you blew it. After you know exactly what not to do next time, you’re ready to go forth boldly and without fear!
In summary, consistently profitable crypto trading (or any other market, for that matter) is all about cultivating the emotional discipline to make a trading plan and stick to it. A profitable yet mediocre trading strategy powered by unwavering emotional discipline will consistently out-perform a high win rate strategy with no emotional discipline powering it.
Contents
Appendix VI: Ninja Scalpmaster Trading Strategy
Strategy Overview
The Ninja Scalpmaster Trading Strategy is all about entering into the “candlestick zone” by harnessing the power of cool, calm and collect emotional discipline to govern when to optimally execute/exit a trade as per the trading plan.
Since more confluence always equates to higher accuracy/stronger probability (albeit less trading opportunities), this ultimately results in the trade-off between less accurate trades, yet more frequent trading opportunities and vice-versa.
Said another way, one person’s trading opportunity is another person’s risk aversion (and only you alone know what your own personal appetite for risk is). The key is to create the perfect risk management trade-off that reflects your own unique trading style.
The Four Pillars Of Profound Profit
Even just a modest 5%-35% profit per trade can quickly amplify small micro-wins into spectacular cumulative profits once you fully intuit the collective power of:
1. Never get greedy;
2. Always stick to the plan;
3. Be ready to exit a trade at the click of a mouse;
4. Compound your profits right back into the next trade accordingly.
To put the power of compounding your trades into perspective:
Example:
Starting with an initial purchase of 10 perpetual futures contracts (i.e. USDT$10.00), and assuming a flat average of 10% profit per trade for sake of illustration (after exchange fees), let’s now see what happens when it is compounded over the course of 12 trades:
• 1st trade would land you USDT$11.00
• 2nd trade enters with 11 contracts and ends with USDT$12.10
• 3rd trade enters with 12 contracts and ends with USDT$13.20
• 4th trade enters with 13 contracts and ends with USDT$ 14.30
• 5th trade enters with 14 contracts and ends with USDT$15.40 (+1 additional contract in fractional remainders on next trade)
Contents

• 6th trade enters with 16 contracts* and ends with USDT$17.60 (+1 additional contract on next trade with a $0.60 remainder left over)
• 7th trade enters with 17 contracts and ends with USDT$18.70 (+2 additional contracts in fractional remainders on next trade with a $0.30 remainder left over)
• 8th trade enters with 19 contracts* and ends with USDT$20.90 (+2 additional contracts in fractional remainders on next trade with a $0.20 remainder left over)
• 9th trade enters with 21 contracts* and ends with USDT$23.10 (+2 additional contracts $0.30 cumulative remainder)
• 10th trade enters with 23 contracts* and ends with USDT$25.30 (+2 additional contracts and $0.60 cumulative remainder)
• 11th trade enters with 25 contracts* and ends with USDT$27.50 (+3 additional contracts and $0.10 cumulative remainder)
• 12th trade enters with 30 contracts* and ends with USDT$33.00 (+ $0.10 cumulative remainder) * The extra contracts are due to your “loose change” accumulating into another USDT$1.00 contract.
Quick Recap: Starting with a $10 trade compounded 12 times over 12 trades, with a flat average of 10% profit/trade... you will have landed (just over) a cool, refreshing 3.3X ROI: Shazam!
That’s not even the exciting part. From the 13th trade onward, it starts radically exponentially compounding hyper-FAST straight up like a hockey stick curve.
In fact, I hereby challenge you to keep going with compounding the next 12 trades (exactly as per the above example), right up to the completion of the 24th trade and behold where you’re now at. THAT, my friend, is the power of compounding!
Obviously, you will not be generating exactly 10% per trade… but you can clearly see the underlying principle involved. The actual amount of profit comes down to how well you trust the plan.
Sometimes, the trading plan will tell you to exit a trade at a modest 1%-3% profit, other times, it could end up doing a delightful ‘moondance’ in the neighborhood of 30%-50% profit when the trading plan finally tells you to exit.
It’s all about becoming a highly-disciplined ‘mechanized’ crypto scalper with an emotionally-detached discipline that never sways from the trading plan even one millimeter to the left or right. And the real beauty about crypto scalping is that you can literally do it a few minutes here, a few minutes there, on your own terms.
Contents
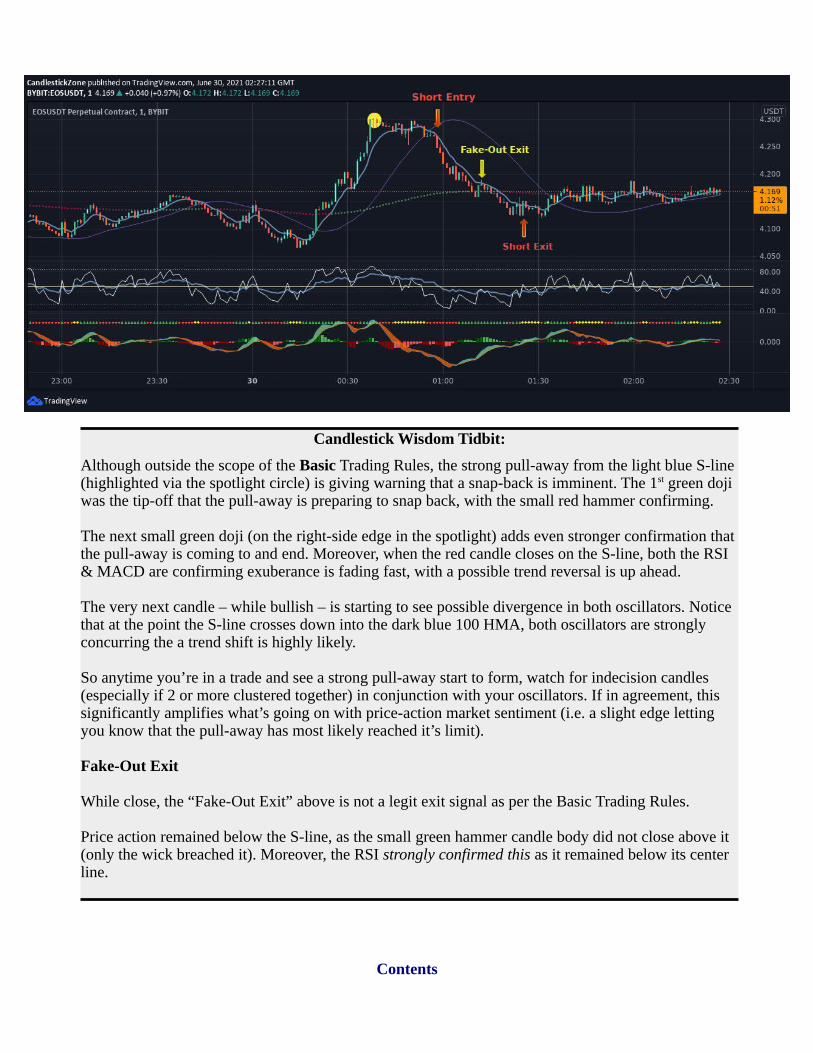
Candlestick Wisdom Tidbit:
Although outside the scope of the Basic Trading Rules, the strong pull-away from the light blue S-line (highlighted via the spotlight circle) is giving warning that a snap-back is imminent. The 1st green doji was the tip-off that the pull-away is preparing to snap back, with the small red hammer confirming.
The next small green doji (on the right-side edge in the spotlight) adds even stronger confirmation thatthe pull-away is coming to and end. Moreover, when the red candle closes on the S-line, both the RSI & MACD are confirming exuberance is fading fast, with a possible trend reversal is up ahead.
The very next candle – while bullish – is starting to see possible divergence in both oscillators. Notice that at the point the S-line crosses down into the dark blue 100 HMA, both oscillators are strongly concurring the a trend shift is highly likely.
So anytime you’re in a trade and see a strong pull-away start to form, watch for indecision candles (especially if 2 or more clustered together) in conjunction with your oscillators. If in agreement, this significantly amplifies what’s going on with price-action market sentiment (i.e. a slight edge letting you know that the pull-away has most likely reached it’s limit).
Fake-Out Exit
While close, the “Fake-Out Exit” above is not a legit exit signal as per the Basic Trading Rules.
Price action remained below the S-line, as the small green hammer candle body did not close above it (only the wick breached it). Moreover, the RSI strongly confirmed this as it remained below its center line.
Contents

Ninja Scalpmaster TradingView Toolkit
In order to make sure even traders with free TradingView accounts can deploy the Ninja Scalpmaster Trading Strategy, I have gone to great lengths to find the perfect indicator combo that fits within the 3-indicator limit of free TradingView accounts:
GR-Multiple Moving Averages
https://www.tradingview.com/script/Iw5G1vDD-GR-Multiple-Moving-Averages/
Inputs:
• Source To Use: close
• Very Fast MA Period: 8
• Very Fast MA Type: EMA
• Set "Fast MA Type" & "Medium MA Type" to "!Do not show" {the Period setting for both are irrelevant}
• Slow MA Period: 100
• Slow MA Type: HMA (Hull)
• Overall Direction MA Period: 200
• Overall Direction MA Type: EMA
• Overall Direction Sentiment Input: Very fast MA
Style:
• Tick the "Very Fast MA" box and choose a light blue color.
• Tick the "Slow MA" and choose a mid-dark blue color (non-obtrusive, yet still visible if you’re directly tuned in).
• Tick the "Overall Direction MA" box and select a suitable green tone for "Color 1", and a suitable red tone for "Color 2".
• Untick all other boxes.
Contents

MACD-X, More Than MACD by DGT
https://www.tradingview.com/script/Gq9I627Q-MACD-X-More-Than-MACD-by-DGT/
Inputs:
• MACD Calculation Method: MACD-LEADER {an ultra-fast 2nd generation MACD with very minimal lag}
• Source: Current Price (close)
• Fast Length: 8
• Slow Length: 20
• Signal Smoothing: 5
• All other settings under the "inputs" tab are irrelevant.
Style:
• Make sure the "Plots Background" box is ticked, if not already.
• Everything else is as you choose.
CryptoNL R.E.D.
https://www.tradingview.com/script/hxdxfXDY-CryptoNL-R-E-D-rsi-ema-and-divergence/
Inputs:
• RSI Period: 5
• RSI Source: close
• Fast Length: 8
• Slow Length: 20
• Pivot Lookback Right: 5
• Pivot Lookback Left: 5
• Max Of Lookback Range: 30
• Min Of Lookback Range: 5
• Untick all other boxes.
Contents
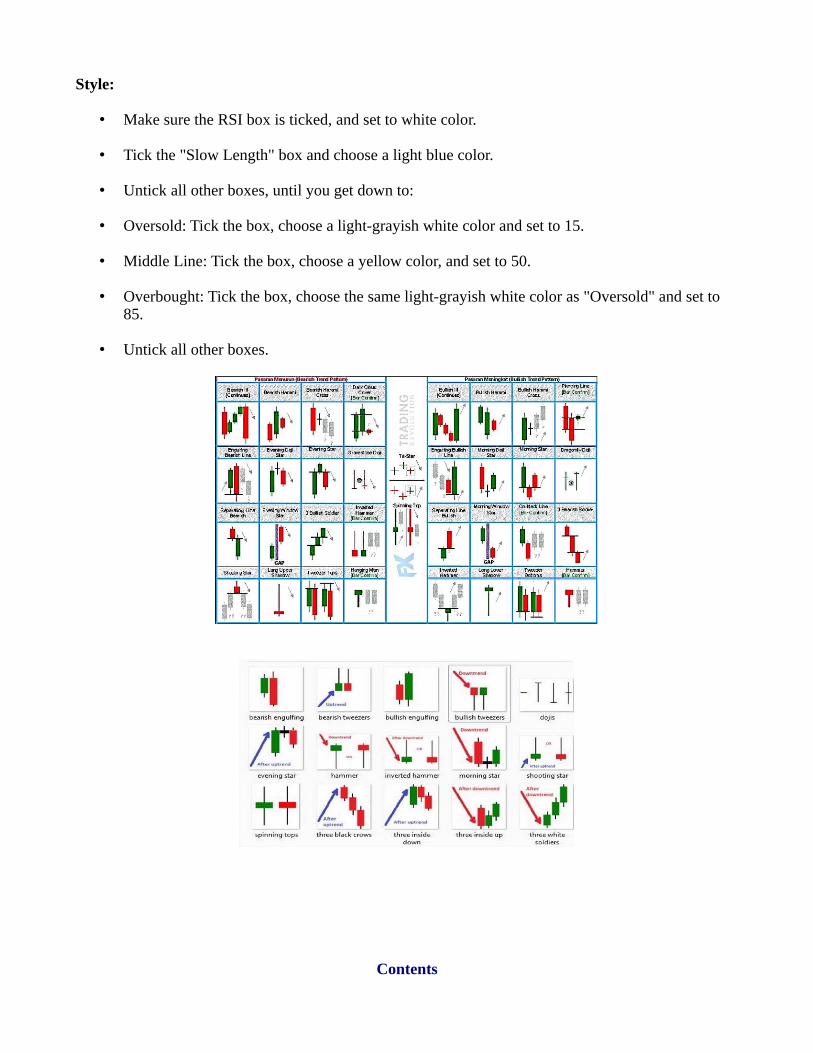
Style:
• Make sure the RSI box is ticked, and set to white color.
• Tick the "Slow Length" box and choose a light blue color.
• Untick all other boxes, until you get down to:
• Oversold: Tick the box, choose a light-grayish white color and set to 15.
• Middle Line: Tick the box, choose a yellow color, and set to 50.
• Overbought: Tick the box, choose the same light-grayish white color as "Oversold" and set to 85.
• Untick all other boxes.
Contents

Basic Trading Rules
Note: The price action signal line (S-line) is the medium blue 8 EMA closely following the candlesticks in the illustrations.
Long Entry:
The S-line should start to be potentially heading above the 100 HMA, with a nice gap forming betweenthem. Bonus points if both above the 200 (which would be green at that point). If the moving averages are all scrunched together – no go. Otherwise:
• Look for a green candle close breaking above the S-line AND above the closest previous red candle’s open (wicks/tails are irrelevant).
• RSI white line should be (at least slightly) crossing above it’s blue moving average AND crossing over or above the yellow center line.
• MACD ribbon & histogram should be both be green and heading north toward/over the center histogram line.
Caveats:
If either of the momentum indicator divergence peaks are noticeably in opposition of price action (relative to the S-line) – and especially if in distinct opposition to the signal price action is producing – this is either a weak or null price action signal.
Therefore, wait for further confirmation if the divergence is very slight (but noticeable) on one of the oscillators. Otherwise, move on to the next trading opportunity.
Long Exit:
• Look for a red candle close breaking below the S-line AND above the closest previous green candle’s open.
• RSI white line should be crossing down through/below it’s blue moving average and moving toward/below the yellow center line.
• MACD ribbon & histogram should be both red and heading south toward/crossing below the center histogram line.
• If the MACD and RSI are noticeably diverging from each other and/or the price action S-line, something definitely ain’t right – price action may well be experiencing a fake-out or other market anomaly happening the moment. Wait for the culmination of confluence to ensure it’s not just a market ‘burp’.
Contents

Short Entry:
The S-line should start to be potentially heading below the 100 HMA, with a significant gap forming between them. Bonus points if both are below the 200 (which would be red at that point). If the movingaverages are all scrunched together, move on to the next trade. Otherwise:
• Look for a red candle close breaking below the S-line AND above the closest previous green candle’s open (wicks/tails are irrelevant).
• RSI white line should be below it’s medium blue moving average and definitively crossing or below the yellow center line.
• MACD ribbon & histogram should be both red & MACD ribbon crossing down or below the center histogram line.
• If either the MACD ribbon and/or RSI is noticeably diverging from the price action S-line, something definitely ain’t right – move on to the next trading opportunity.
Caveats:
As with a Long entry, if either of the momentum indicator divergence peaks are noticeably in opposition of price action (relative to the S-line) – and especially if in distinct opposition to the signal price action is producing – this is either a weak or null price action signal.
Therefore, wait for further confirmation if the divergence is very slight (but noticeable) on one of the oscillators. Otherwise, move on to the next trading opportunity.
Short Exit:
• Look for a green candle close breaking above the S-line AND above the closest previous red candle’s open.
• RSI white line should be crossing up through/above it’s medium blue moving average and moving toward/above the yellow center line.
• MACD ribbon & histogram should be both red and moving north toward or above the center histogram line.
• If either the MACD ribbon and/or RSI is noticeably diverging from the price action S-line, something definitely ain’t right – move on to the next trading opportunity.
Contents
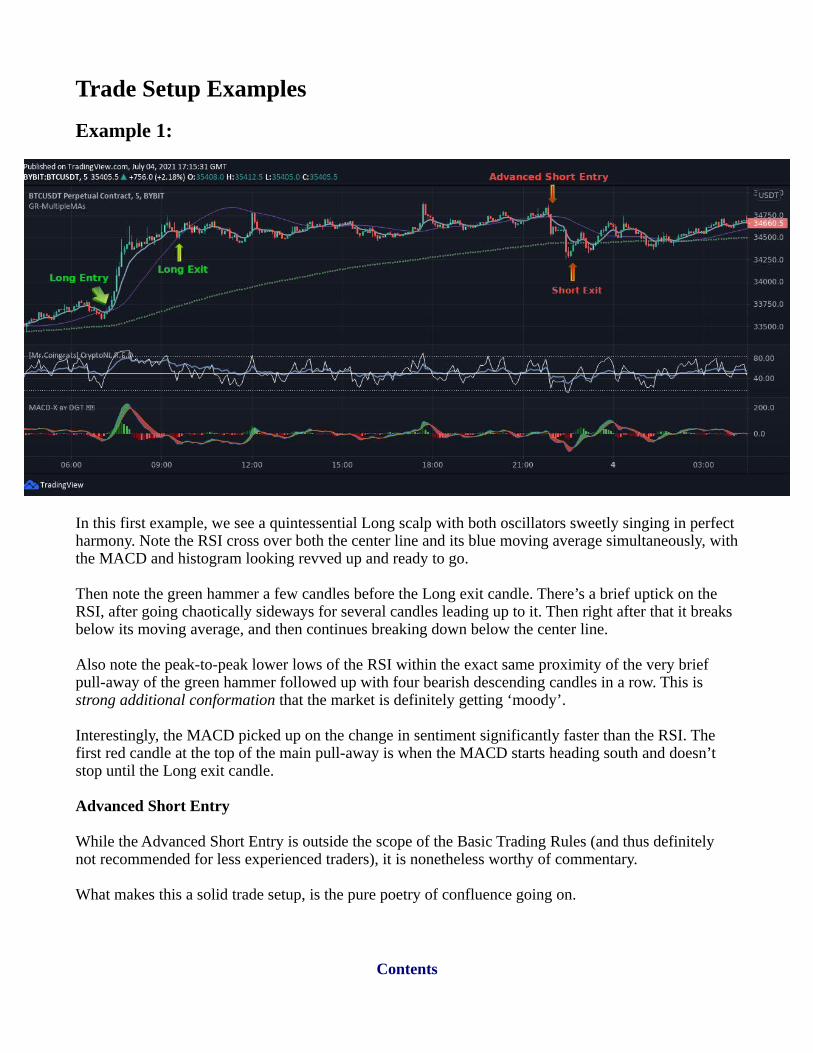
Trade Setup Examples
Example 1:
In this first example, we see a quintessential Long scalp with both oscillators sweetly singing in perfect harmony. Note the RSI cross over both the center line and its blue moving average simultaneously, withthe MACD and histogram looking revved up and ready to go.
Then note the green hammer a few candles before the Long exit candle. There’s a brief uptick on the RSI, after going chaotically sideways for several candles leading up to it. Then right after that it breaks below its moving average, and then continues breaking down below the center line.
Also note the peak-to-peak lower lows of the RSI within the exact same proximity of the very brief pull-away of the green hammer followed up with four bearish descending candles in a row. This is strong additional conformation that the market is definitely getting ‘moody’.
Interestingly, the MACD picked up on the change in sentiment significantly faster than the RSI. The first red candle at the top of the main pull-away is when the MACD starts heading south and doesn’t stop until the Long exit candle.
Advanced Short Entry
While the Advanced Short Entry is outside the scope of the Basic Trading Rules (and thus definitely not recommended for less experienced traders), it is nonetheless worthy of commentary.
What makes this a solid trade setup, is the pure poetry of confluence going on.
Contents

First off, the 1st red candle (right before the entry candle) failed the core requisite of entering a Short position in the Basic Trading Rules (i.e. had to close lower than the previous green candle AND break below the 8 EMA (S-line).
Being said, let’s explore why an experienced scalper would see it starting to look nice and juicy.
Notice how the 8 EMA and 100 HMA are bunched up, with price action barely on top, and the 8 EMA starting to cross south under the 100 HMA.
The RSI briefly spikes to ~85…
Then a red candle appears, and the very next red candle is a Lightsaber of Doom; with both the RSI andMACD heading south right on queue, and the S-line starting to strongly head south and away from the 100 HMA.
On the pull-away, there’s a few candles doing the Sideways Shuffle, then the 2nd Lightsaber of Doom brings it home.
The ideal entry point would have been the moment the 1st Lightsaber of Doom dropped just below the tail of the previous red candle on its way down. Consequently, the safe Short Exit for this setup is the 1st green candle immediately after the 2nd Lightsaber of Doom reaches is conclusion.
Really take a moment to savor all of the luscious confluence simultaneously culminating at that exact moment… hence why the exit point absolutely had to be the very 1st green candle immediately after thepull-away.
Again – not recommended for newbies traders; it’s a great way to get rekt when you don’t truly know what you’re doing. However, this gives you a glimpse into the mindset of a seasoned scalper that understands greater reward also means accepting greater risk.
Contents

Example #2
In this example, the Short Entry for the Basic Trading Rules occurs next candle after the Lightsaber of Doom. Both oscillators stand in confirmation.
However, since the S-Line is so very nicely distanced below the 100 HMA – more experienced traders would consider putting in a Short right after the forming red candle 1) breaks the S-Line, and 2) the RSI starts to cross down through its blue moving average.
On the other side of the above example, we see a Long Entry and Long Exit, both as per the Basic Trading Rules. Both oscillators concur.
Where you see the Advanced Long Exit, a small yet distinct pull-away occurs via a Lightsaber of Joy.
The close of the 1st red candle thereafter would be the ideal exit point for experienced traders. Aside from the fact that a snap-back is imminent, the RSI is slightly over 85 (huge clue), and the MACD is starting to turn red and head south (2nd clue).
Being said, if you are still relatively new to scalping: First and foremost, nail the Basic Trading Rules down (to the point you don’t ‘think’ about them – you instinctively act on the information).
Only then will you have developed the emotional discipline and psychological fortitude to start exploring the more advanced trading concepts discussed.
Contents

Example #3
For those who’ve been following along very closely, the first thing that probably jumped out at you is slight delay in the Long Entry (as per the Basic Trading Rules). Remember that while price action always initially generates the potential entry/exit signals – it’s both oscillators coming into agreement that determines if/when the signal is acted upon.
Never force a trade, but rather kick back and just let the trades come to you. With this in mind, the above Long Entry signal is not truly confirmed until we see the MACD breaking up over the center lineand continuing north.
There’s something else well worth pointing out here that applies to all scalps in general.
Once the Long order is placed, notice how the both oscillators drop at the dip. However, the RSI remains at or above its center line the entire time. Price action confirms this, by never clearly closing below the S-line via a red candle.
Key Take-Away: So long as price action is...
• Riding with/above the S-Line, and the S-Line is riding above the 100 HMA (Long),
• Or riding with/below the S-Line, and the S-Line is riding above the 100 HMA (Short)…
...then let your profits run accordingly. Only refer back to the oscillators for dual-confirmation when price action is actually indicating it’s time to exit your position.
Contents

Example #4
For our last example, I was lucky to capture a beautiful back-to-back trade setup; whereby you would’ve been able to make money only both sides of the move. Moreover, both oscillators concur on the downswing.
Primary Confluence Layers Of Interest
In order for the above Basic Trading Rules to effectively accomplish their objective (i.e. mitigate risk, while opening up juicy trading opportunities with lucrative reward potential), they need to be put into proper context.
Since no two people reading this will be at the same knowledge, skill and/or experience level, I am going to first lay down a solid foundation to build upon.
Not enough can be said about getting back to the basics; especially given the sheer amount of crap being propagated on YouTube. Moreover, what follows applies to ALL trading strategies – not just the Ninja Scalpmaster Trading Strategy.
And although adequately covered in the “Legal Notices” section – none of what follows shall be construed as financial advice: DOYR and know the risks involved.
My job is to help you effectively cut through the noise and confusion, and focus on what actually works. It’s up to you to vet the info relative to your own unique trading style, risk management strategy,etc. With that said, let us now smoothly transition into…
Contents

Multiple Time Frame Confluence
Most often referred to as either “multiple time frame trading” or “multiple time frame confluence”, the principle applies every bit to scalping as it does swing trading or position trading… albeit with its own unique nuances specific to scalping.
Before going into the specific nuances, let us first explore the overarching principle of multi-time frameconfluence, starting with a few crucial caveats:
Caveats To Trading Multiple Time Frames
• Never base your orderbook entries and exits on multiple time frames.
• If an asset is trending hard on 3 or more higher time frames (above the one you’re actually executing your trades on), exercise extreme caution if you plan on going opposite and bucking the primary trend.
• Never use different criteria for identifying commonality between multiple time frames; always apply the exact same set of indicators across all of them.
• Since higher time frames have stronger influence over lower ones (and not vice-versa), when evaluating the R/R ratio of a trade – always give stronger credence to the highest confluence time frame being compared, then proportionally on down from there.
Since this strategy is focused on scalping, these are the macro-time frames I tune into for each trading pair I am potentially looking to take a trade on:
On the 1D chart above, we see a somewhat (yet distinctly) bearish sentiment overall. How do we determine this? Note the dotted 200 moving average is red, with price action just below it. However, also note that both oscillators are hovering right around their mid-points – the RSI slightly under, and the MACD slightly over.
Contents

While overall bearish – because the 8 EMA is actually above the 100 HMA (albeit still below the 200), it could best be described as moderately bearish... “bearish of center” if you will (center = all 3 movingaverages bunched up, with price action weaving right through all of them).
Next, we move down to 1/6th the previous time scale – the 4H chart:
On the above 4H chart, we again see moderately bearish sentiment. Note that the 8 EMA and 100 HMAhave merged, while the RSI has picked up a bit and the MACD is largely the same (i.e. collectively, this does not indicate ‘stronger’ bearish sentiment, but rather slightly weaker bearish sentiment).
Next, we move down to 1/2 of the previous time scale – the 2H chart:
Here on the 2H chart, we see all 3 moving averages scrunched together, and both oscillators still hovering right around their center lines. Bearish sentiment has essentially weakened to the point of capitulating to market indecision (i.e. this chart would be deemed “center”).
Taken holistically with the previous 2 charts, there is strong indication that bearish sentiment is progressively fading fast. Which brings us to the 1H chart…
Contents

Here on the 1H chart, we see the Bulls have boldly exerted themselves with a beautiful breakout to the upside. The 8 EMA is clearly over both the 100 & 200 moving averages, and the 100 HMA is looking to also cross over the 200. However, also note that both oscillators are still chillin’ like Bob Dylan.
Thus, this chart would be considered “cautiously bullish”.
Anyhow, I would continue doing this for the 15M and 5M charts as well.
For those not used to thinking this way, it sounds somewhat difficult. Exactly the opposite – super quick and easy, once you get used to it. It was actually far more difficult for me to explain it than it is toactually do it.
As a matter of fact, it’ll literally take less than a minute once you’re used to it. And you only have to doit 1) once per asset per trading session for each asset you’re looking to trade, and 2) only when you’re proactively looking to potentially trade that particular asset.
However, all other factors being equal – doing so gives you a distinct trading edge. Moreover, it also strengthens your risk management strategy simultaneously. How so?
• When you place trades that largely harmonize with (at least) 3 time frames higher than the one you’ll actually be executing your trades on, you are going with the flow of market sentiment. All other factors equal, this significantly puts the probabilities in your favor. *
• Conversely, this also proportionally strengthens your risk mitigation strategy because you will know exactly when a trade would be potentially going against the overall sentiment of at least 3higher time frames.*
While more experienced traders do occasionally find a juicy trade going against the general trend they deem well worth the risk (such as with strong pull-aways that inevitably must snap back)…
Contents

Relatively new/inexperienced traders would be wise never to buck the trend unless/until they 1) know exactly what they are doing, 2) have carefully weighed the risks involved against the potential rewards, and 3) are 100% confident the counter-trade is worth the risk.
* The more time frames taken into account, the more accurate the market sentiment pulse; hence why you should always compare at least 3 time frames north of your preferred time frame minimum.
Taking Your Charting To The Next Level
Admittedly, it does take a bit longer on the pre-prep, but the effort will more than justify itself in the additional probabilities you will gain (all other factors equal).
As you go through and do you multi-time frame chart comparisons, lay down strictly horizontal lines of major S/R value (diagonal lines are irrelevant to scalping)… except with a powerful twist I’ve neverseen taught/discussed ANYWHERE else (and I’ve watched over 1000++ trading tutorial videos).
Although it works with any multi-time frame scale, lets say you’re entering your trades on the 1M chart. So you’d be laying down your S/R lines on the 5M, 15M and 1H charts. So far, so good.
Now here’s the twist:
Lay down your 1H S/R lines in a light red, the 15M lines in a light yellow, and the 5M lines in a light green. This will give you not one – but two – additional powerful edges:
• Color-coding your horizontal S/R lines gives you a distinct visual indication as to the relative importance of the S/R line being tested (i.e. higher time frames are strongest in importance, hence why the 1H is red, the 15M is yellow, and the 5M is green).
• Moreover, any time two (and especially all three) S/R lines end up very nearly/right on top of each other (on the time frame you’re actually executing your trades on) – HUGELY important S/R level to pay attention to; for this is the direct equivalent of multi-time frames culminating into strong agreement.
You heard this Pro Tip first right here first in the Way of the Candlestick Master!
For those either new S/R analysis, or simply looking to up their game – I highly recommend scoping out the following three superb tutorials videos – pure gold:
• https://www.youtube.com/watch?v=C2qRW9_via4
• https://www.youtube.com/watch?v=vJ-sRke6lzE
• https://www.youtube.com/watch?v=kdp75Y_ZSsY
Contents