Embed Size (px)
Citation preview

Zané Lombard Wits Bioinforma2cs
Adapted from tutorials on the HapMap website (www.hapmap.org) & slide material from L. Ouko
INTRODUCTION TO THE HAPMAP PROJECT

Human gene)c varia)on
Human Genome ~3 billion bp Contain informa2on that influences our physical traits, our likelihood of suffering from disease, and the responses of our bodies to substances that we encounter in the environment.
99.9% similarity among individuals
0.1% difference impacts variable response to environment, pathogens etc among individuals
only about 1.5% of the genome codes for proteins

Single nucleo)de polymorphisms (SNPs) Most common gene2c variant SNPs are used as markers to locate genes in DNA sequences -‐
useful in disease mapping Tes2ng 12 million common SNPs would be extremely
expensive
For a case-‐control study with 1,000 cases & 1,000 controls Genotype all DNAs for all SNPs
That adds up to 24 billion genotypes Imagine, this approach cost 50 cents a genotype.
That’s R12 billion for each disease – completely out of the ques)on!!
GOAL OF HAPMAP
The Interna2onal HapMap Project aims to iden2fy a large frac2on of the gene2c diversity in the human species
The development of the HapMap will enable gene2cists to take advantage of how SNPs and other gene2c variants are organized on chromosomes Gene2c variants that are near each other tend to be inherited together. E.g. all of the people who have an A rather than a G at a par2cular
loca2on in a chromosome can have iden2cal gene2c variants at other SNPs in the chromosomal region surrounding the A.
These regions of linked variants are known as haplotypes. This phenomenon is influenced by recombina2on & linkage disequilibrium

Recombina)on

Linkage Disequilibrium
Origins of haplotypes The non-‐random associa2on between alleles in a popula2on
No LD Linkage Equilibrium
2 SNPs = 4 Haplotypes
Hi LD
2 SNPs = 2 Haplotypes

SNPs, Haplotypes & tagSNPs

Haplotypes SNPs that occur together suggests underlying structure to
genome SNPs occurr in blocks of which there are common varie2es ~65% to 85% of the human genome is organized in haplotypes If blocks easily iden2fied could be important tool for studying
gene2c varia2on in rela2on to disease, drug response etc..
Founded in 2002
Par2cipa2ng ins2tu2ons and funding from Japan, UK, Canada, China, USA and Nigeria
“ ...develop a haplotype map of the human genome, which will describe the common paherns of human DNA sequence varia2on”

Strategy
1. Recruit individuals that represent global diversity
2. Genotype SNPS for all individuals 3. Iden2fy chromosomal regions with groups of strongly
associated SNPs – haplotypes
4. Determine linkage disequilibrium between SNPs 5. Iden2fy tagSNPs for the haplotypes

Popula)ons sampled
Yoruba people in Ibadan, Nigeria 30 both-‐parent-‐and-‐adult-‐child trios
Japanese in Tokyo 45 unrelated individuals
Han Chinese in Beijing 45 unrelated individuals
The U.S. Utah residents of northern and western European ancestry 30 trios Residents with ancestry from Northern and Western Europe

Genotyping
11 Centers for typing: Canada, China, Japan, UK, USA Genotyped at least one common SNP every 5 kb The Phase I HapMap contained 1,007,329 SNPs that passed a
set of quality control filters SNPs at f > or = 0.05 MAF chosen
The HapMap Project contributed ~6 million new SNPs to dbSNP In 2005 dbSNP contained 9.2 million candidate human SNPs, of which
3.6 million have been validated by both alleles having been seen two or more 2mes during discovery (‘double-‐hit’ SNPs), and 2.4 million have genotype data

Haplotyping
Phased haplotypes were generated using the program PHASE version 2.0
Each allele in a genotype is assigned to one or the other parental chromosome using computer algorithms
The numbers and size of possible haplotypes are limited because of recombina2on events

Haplotype output
Nature 426 Dec 2003

Linkage disequilibrium
If two alleles tend to be inherited together more osen than would be predicted, then the alleles are in linkage disequilibrium.
The basis of measuring Linkage Disequilibrium is the difference between the observed and expected frequencies of pairs of alleles.
LD in all genotyped SNPs calculated
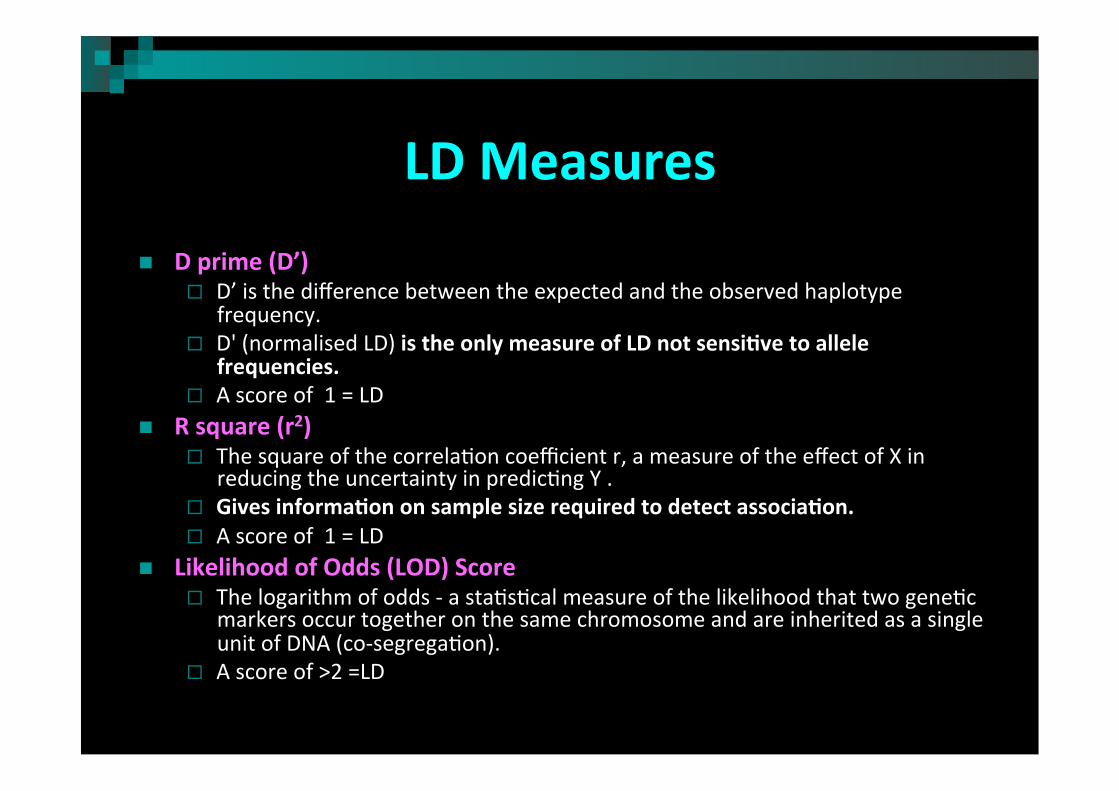
LD Measures
D prime (D’) D’ is the difference between the expected and the observed haplotype
frequency. D' (normalised LD) is the only measure of LD not sensi)ve to allele
frequencies. A score of 1 = LD
R square (r2) The square of the correla2on coefficient r, a measure of the effect of X in
reducing the uncertainty in predic2ng Y . Gives informa)on on sample size required to detect associa)on. A score of 1 = LD
Likelihood of Odds (LOD) Score The logarithm of odds -‐ a sta2s2cal measure of the likelihood that two gene2c
markers occur together on the same chromosome and are inherited as a single unit of DNA (co-‐segrega2on).
A score of >2 =LD
LD Plots
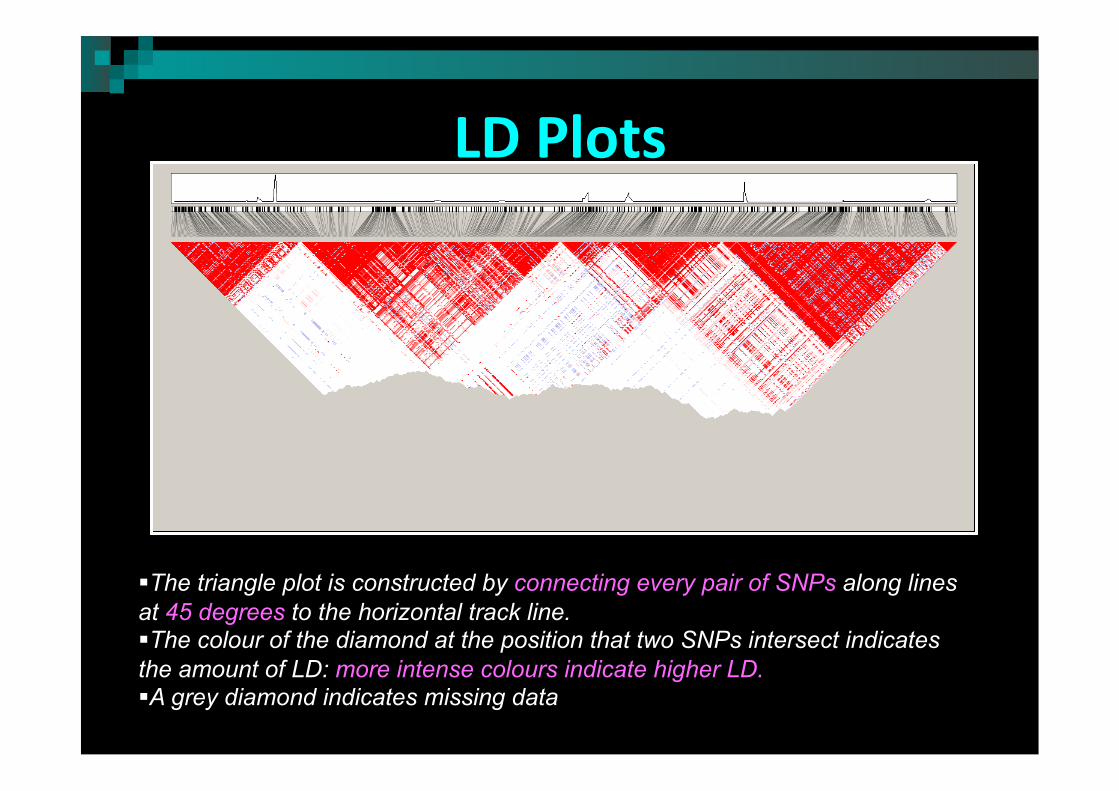
The triangle plot is constructed by connecting every pair of SNPs along lines at 45 degrees to the horizontal track line. The colour of the diamond at the position that two SNPs intersect indicates the amount of LD: more intense colours indicate higher LD. A grey diamond indicates missing data

LD AND tagSNPs
Reduce the number of SNPs needed to genotype region (use few tagSNPs)
High LD -‐ few SNPs sampled Low LD – more SNPs sampled

Interes)ng findings
A: Similarity of allele frequencies in CHB/JPT samples. These were subsequently analyzed jointly
B: Iden2fica2on of recombina2on hot spots 21,617 iden2fied recombina2on hotspots
~1 per 122 kb

Interes)ng findings
C: Haplotype sizes vary across popula2ons due to migra2onal history Haplotypes in non-‐African popula2ons tend to be longer than in African popula2ons
D: LD correlates to genomic features Areas of very high and very low LD have the highest density of genes LD low
associated with immune and neuro-‐physiological genes LD elevated
associated with cell cycle regulators, DNA damage responses, DNA/RNA metabolism.

How HAPMAP could benefit human health
Provide an extensive resource that researchers can use to discover the gene2c variants involved in disease and individual responses to therapeu2c agents
Learn much more about the origins of illnesses and about ways to prevent, diagnose and treat
Associa2on studies
Customizable treatment, new therapies
Cri)que
How to define the haplotype block boundaries
How universal are the blocks (from popula2on to popula2on)
Gene2c varia2ons may reinforce racial stereotypes
Groups studied do not represent human diversity
Different methods for selec2ng tag SNPs give different answers

Retort
Its meant as a tool to study gene)c varia)on at unprecedented levels of accuracy and detail
Offers a direct route to tes2ng ideas about the gene2cs of common diseases
Unsuccessful track-‐record gene2cs has in dissec2ng complex disease traits
All associa2on studies need to be replicated in different groups of people and with rigorous sta2s2cal tests

HAPMAP – Phase Comparison Phase 1 Phase 2 Phase 3
Samples & POP panels
269 samples
(4 panels)
270 samples
(4 panels)
1,184 samples
(11 panels)
Genotyping centers HapMap Interna2onal Consor2um
Perlegen Broad & Sanger
Unique SNPs 1.1 M 3.8 M
(phase I+II)
1.6 M (Affy 6.0 & Illumina 1M)
Sequence Data -‐-‐-‐ -‐-‐-‐ Sequenced ten 100-‐
kb regions (n=692)
Reference Nature (2005) 437:p1299-‐1320
Nature (2007) 449:p851-‐861
Nature (2010)
467: p52-‐58

HAPMAP Phase III
LABEL POPULATION SAMPLE # Samples
ASW African ancestry in Southwest USA 90
CEU Utah residents with Northern and Western European ancestry from the CEPH collection 180
CHB Han Chinese in Beijing, China 90
CHD Chinese in Metropolitan Denver, Colorado 100
GIH Gujarati Indians in Houston, Texas 100 JPT Japanese in Tokyo, Japan 91 LWK Luhya in Webuye, Kenya 100
MEX Mexican ancestry in Los Angeles, California 90
MKK Maasai in Kinyawa, Kenya 180 TSI Toscans in Italy 100 YRI Yoruba in Ibadan, Nigeria 180
1,301

HapMap 3 Samples
• 1,184 samples from diverse populations (N=11) • Individual and community consent for thorough genetic ascertainment (up to complete
resequencing) and public sharing of data on Internet

Interes)ng Outcomes Of the SNPs iden2fied through sequencing, 77% were new
(i.e. not previously in dbSNP) and 99% of those had a MAF < 5% Reveal that many more variants remain to be found, especially rare variants
The International HapMap 3 Consortium, Nature Sept 2010; 467:52-58

Interes)ng Outcomes
Confirmed that non-‐African diversity is largely a subset of African diversity
African samples provided a more complete discovery resource for variant sites in non-‐African than the converse
However, it does not work as well for rare variants Rare variants could likely be more NB in popula2on-‐specific contribu2ons to disease?
Underscores the value of next-‐gen sequencing of whole genomes within various popula2ons to find rare variants that contribute to disease.
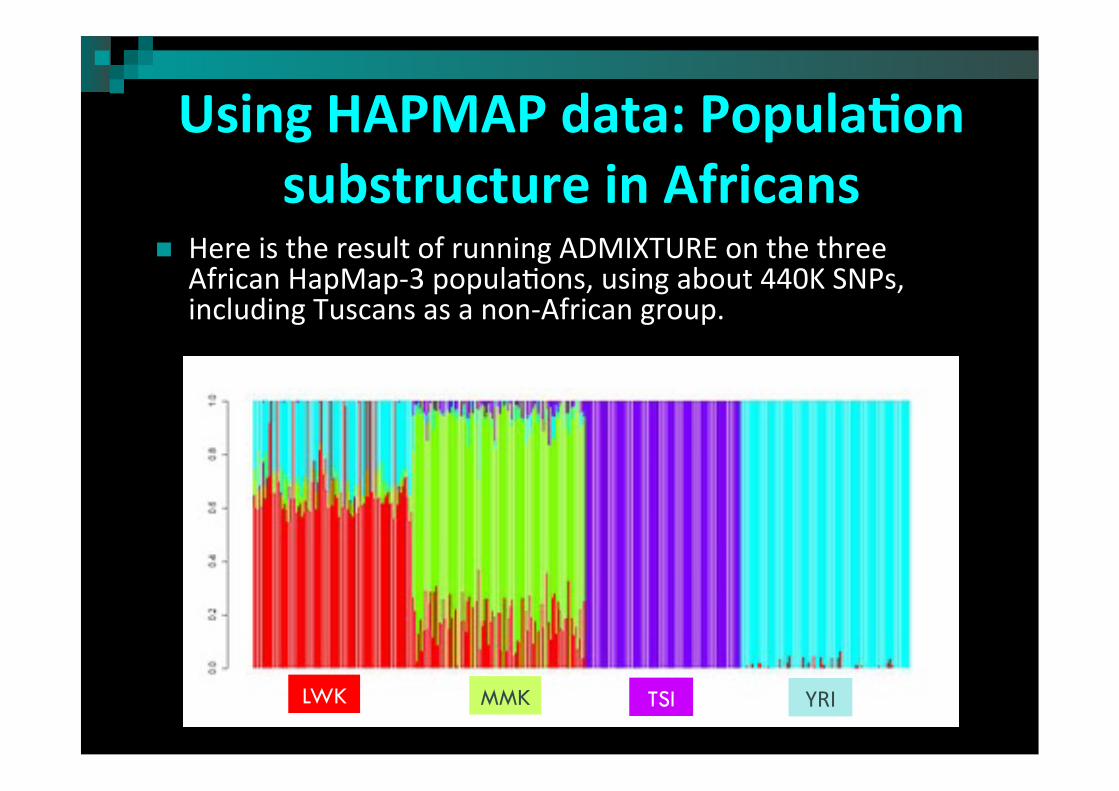
Using HAPMAP data: Popula)on substructure in Africans
Here is the result of running ADMIXTURE on the three African HapMap-‐3 popula2ons, using about 440K SNPs, including Tuscans as a non-‐African group.
TSI YRI LWK MMK


![김동환 2009암학회워크샵.ppt [호환 모드]•Basic concepts of SNPs •Applications of SNPs into cancer research ... 21 SNPs a/w antileukemic drug disposition-> 63 SNPs a/w](https://img.dokumen.tips/doc/110x75/601ede878cebc154024e5352/ee-2009oeoefppt-eeoe-abasic-concepts-of-snps-aapplications.jpg)