Embed Size (px)
Citation preview

YOUTH EMPLOYMENT, RECRUITMENT AND A YOUTH-TARGETED WAGE SUBSIDY: FINDINGS FROM A SOUTH
AFRICAN FIRM LEVEL SURVEY
Volker Schöer and Neil Rankin
The World BankHuman Development UnitAfrica Region
The findings, interpretations, and conclusions expressed in this paper are entirely those of the authors. They do not necessarily represent the views of the International Bank for Reconstruction and Development/World Bank, its affiliated organizations, or those of the Executive Directors of the World Bank or the governments they represent.
72601

YOUTH EMPLOYMENT, RECRUITMENT AND A YOUTH-TARGETED WAGE SUBSIDY: FINDINGS FROM A SOUTH AFRICAN FIRM LEVEL SURVEY
Volker Schöer and Neil Rankin
Johannesburg, June 2011
Acknowledgment: This report was financed by the World Bank’s - Spanish Trust Fund for Impact Evaluation and Results-based Management in Human Development Sectors
African Micro-Economic Research Unit (AMERU), School of Economic and Business Sciences, University of the Witwatersrand; correspondence: [email protected]

Introduction
Employment issues are the most serious problems facing South Africa currently. Among these are the
problems of unemployment, as well as underemployment or lack of decent work for the already
employed, compounded by labour markets that are generally less than efficient in job search and
matching. Unemployment in South Africa, by narrow standards, is approximately 25%, an extraordinarily
high level, made even more worrying by its stagnancy or growth at different times over the past decade.
However, although such levels of unemployment have detrimental effects on all members of society, they
do affect groups differentially. Thus, unemployment rates are consistently, significantly higher for
women, Africans, people from rural areas, and the less educated. Unemployment is highest, too, amongst
the youth in South Africa, and much higher than international norms, despite rising unemployment
amongst youth globally in the past decade (Banerjee et al, 2007 & 2008).
In South Africa, youth is officially defined as people aged between 14 and 35 years old; however, this is
not in line with international definitions, which usually demarcate the 16 to 24 year old group. In fact,
South Africans aged 25 to 35 have unemployment rates close to the national average, whereas the 14 to
24 age group have much higher unemployment rates (Altman, 2007).
With such high unemployment rates, and also very long periods between school and the first job, the
options for finding a first job become crucial for young people in particular (Banerjee et al, 2008). The
statistics reflect that job search and matching is very poor in South Africa, and young people are at
particular risk of becoming discouraged and exiting the labour force because of high job search costs with
low probability of finding employment. Unfortunately, most findings on labour market outcomes in South
Africa are established using only supply side (worker) data while determinants of the demand side (firms)
are generally unknown. This is mainly driven by the availability of regularly collected supply side data
and the paucity of demand side data in South Africa.
The aim of this paper is therefore to shed some light on the employment process of young South Africans
and to investigate firm level responses to the implementation of a targeted hiring voucher for young job
seekers aged 20-24.
The first section of the paper outlines the conceptual framework used to investigate factors that determine
employment of young workers and the impact of a targeted wage subsidy. The second section presents
findings from a firm survey illustrating the firm characteristics that are associated with employing young
1

workers and responses to a hypothetical wage voucher. The third section discusses the findings in the
light of the theory while the fourth section concludes.
Labour market matching and hiring vouchers
Employment rates and wages represent equilibrium outcomes of the interactions between firms (demand
side) and workers (supply side) in the labour market. Due to various kinds of frictions, labour markets are
characterised by imperfect information which makes job matching of job seekers and firms a non-trivial
and costly activity (Pissarides 2000). Firms have to generate a pool of suitable applicants through
advertising of the job and then screen applicants to find the one candidate whose characteristics are most
suitable to the requirements of the job. Job seekers on the other hand have to find firms with suitable
vacancies. Once they have found a firm with a suitable vacancy, job seekers apply and have to convince
the employer that they are the most suitable candidates compared to all other applicants. The outcome of
this matching process is eventually driven by the overlap between the firm’s recruitment channels and the
job seeker’s search methods (Gorter et al 1993; Lindeboom et al 1994; Russo et al 2000; Schöer et al
2010 for South Africa).
Both, firms and job seekers, face an optimization problem with regards to their choice of their
search/recruitment behaviour (see Holzer 1987 for firms’ recruitment optimization; Devine & Kiefer
1991 for job search optimization; and Schöer & Leibbrandt 2007 for job seeker strategies in South Africa)
in order to overcome two main problems: information dissemination and asymmetric information. Firms
and job seekers in the labour market face these two problems during the extensive margin and the
intensive margin of their search process. Search at the extensive margin allows both sides to gather
information about possible options, i.e., more vacancies for the job seeker and more applicants for the
firm. Search at the intensive margin provides more detailed information on already identified options, e.g.
the job requirements and work conditions to the job applicant and the suitability of the applicant to the
firm (Calvo-Armengol 2006). The ability of the search/ recruitment channels to overcome the information
problems at the extensive and intensive margin of search determines the matching quality which itself is
reflected in the wage.
Especially in a slack labour market characterized by mass unemployment like the South African labour
market where the supply of labour significantly exceeds the demand for labour, one can expect the
demand side (firms) to have more of an influence on process and the outcomes of the matching process as
they can decide on what type of labour they want to employ and how they want to employ it.
2

Holzer (1987) outlines the firm’s optimization problem during the hiring process (see also Pellizzari,
2005). He states that hiring follows “an employer search model in which the firm chooses its hiring
policies as a reservation level of perceived productivity in the job applicant when hiring for a particular
vacancy” (Holzer, 1987: 11). The firm will try to maximize profit by:
Max E(profit) = Phire, t * E(profit| productivity of applicant) + (1-Phire, t)*E(profit)t+1 – Chire, t eq (1)
The equation illustrates that a firm aims to maximize its expected profit that stems from filling a vacancy
given the probability of finding and hiring an applicant (Phire, t) with the required characteristics
(productivity level of the hire based on the quality of the match between the characteristics of the job
applicant and the job requirements) and the cost of the hire (Chire, t). The cost of the hire includes the actual
cost of advertising the vacancy and the screening cost as well as any additional training cost to ensure that
the quality of the match between the applicant and the job requirement yields the optimal productivity
level. One can expect firms to be more willing to provide job training if the training improves the quality
of the match and the firm is able to recoup the benefits of this investment. However, the firm can only
evaluate the true productivity level of the applicant after a sufficient period of time has passed. Thus,
when the firm realizes that the appointment did not yield the required (acceptable) matching quality, it
will try to terminate the employment relationship which can imply significant retrenchment costs.
A problem arises when the firm is not able to determine the true productivity level of the applicant and
makes an appointment with substantial uncertainty but also faces significant retrenchment costs. In such
cases, firms are less willing to experiment with applicants whose productivity level is most difficult to
establish in order to reduce the risk of being stuck with a low quality match that is costly to terminate (see
Levinsohn 2007; Go et al 2009).
Thus, the productivity signal of the applicant is crucial in the matching process. Without an appropriate
and reliable productivity signal, the matching process includes a high degree of uncertainty on the side of
the firm. The more difficult it is for the firm to establish the true productivity level of the applicant the
less willing the firm is to engage in an employment relationship with high hiring costs (including training)
and/or retrenchment costs. This clearly also affects the firm’s decision to invest in the human capital of
the new hire. We can expect the firm to invest in the new hire’s human capital when the new hire exhibits
characteristics that indicate that he/she is trainable; when the firm expects to benefit from the investment
(determined by the firm’s future growth expectations and how long it anticipates the employment
relationship with the new hire to last); and the larger the impact of the matching quality on the expected
profit.
3

This, though, represents a major obstacle to young job seekers who can only signal their productivity
potential through their performance at school. However, school performance signals can only act as
productivity proxies when employers are confident in the signaling ability of school performance scores.
While educational qualifications are generally able to fulfill this function, only completed secondary
schooling (matric) and further qualifications seem to be considered trustworthy in South Africa
(Wittenberg 2002; Duff and Fryer 2004, Levinsohn 2007). Thus, school leavers with less than completed
secondary schooling who are looking for unskilled jobs will be least able to convince employers of their
productivity levels.
Why then is getting the first job important for the work-life trajectory of the applicant? Work experience
is crucial for the subsequent work-life trajectory due to the productivity signaling ability of previous work
experience. A subsequent employer can use the fact that someone was employed before as a partial signal
that another firm was willing to engage in the employment relationship. Furthermore, if the applicant
received training from the previous employer, it does not only act as a signal that the previous employer
considered it a worthwhile investment but it also reduces the hiring cost of the subsequent employer as
he/she can potentially build on the existing human capital gain from the previous employment.
South African firms optimize their recruitment behaviour in the following environment: 1) a constant
stream of unskilled job applicants whose productivity levels are difficult to establish; and 2) facing
relatively high retrenchment costs. This, in the line of the above considerations, should lead to the
following recruitment behaviour: 1) firms are less likely to advertise jobs for which they already
experience a high applicant arrival rate; 2) firms are more likely to hire applicants whose productivity
level can be established relatively costlessly; and 3) firms will use recruitment channels that allow them
to gather trustworthy information about the applicant without incurring high recruitment costs. Thus,
unskilled job seekers, who make up the majority of the unemployed, will find it difficult to locate
vacancies that are not advertised; firms are more likely to employ workers with work experience as this
can be used as a reliable productivity signal; and firms will use social networks to establish a pool of
applicants and to establish a trustworthy productivity signal for unskilled jobs.
In such an environment, young unskilled job seekers are systematically disadvantaged. A targeted wage
subsidy for young workers would reduce the cost of a hire of a young applicant whose productivity level
is difficult for the employer to establish. Thus, the wage subsidy would allow firms to “experiment” with
the hire of a young applicant over a more expensive older worker in whose productivity level the
employer is more confident (see Levinsohn 2007).
4

We use the above conceptual framework to investigate the possible impact of a targeted youth wage
subsidy on the firms’ workforce compositions, training and recruitment behaviour. In particular, we look
at the firms’ current employment patterns, recruitment and training and discuss, following the theoretical
framework, how lower wage costs due to the youth wage subsidy might incentivize firms to change their
employment behaviour towards young employees.
Data
As part of the Labour Market Entry Survey (LMES) study, the African Micro-Economic Research Unit at
the University of the Witwatersrand collected information on South African firms via telephonic
interviews. The aim of these firm surveys was to establish responses to hypothetical youth-targeted wage
voucher questions and to relate these responses to firm characteristics their recruitment behaviours.
The sample of firms was drawn from two different sources: firm contact information obtained through
responses of employed young Africans during the LMES as well as from CIPRO data. While the firms
drawn from the LMES are a random draw of firms that hire at least one young African employee, the
firms from the CIPRO data are randomly contacted but limited to firms that employ less than 200 workers
and operate in the manufacturing sector. The firms in the CIPRO data set are limited as their information
is used to randomly assign hiring vouchers to firms in the manufacturing sector. Therefore, enumerators
were instructed to use skeleton versions of the full questionnaire when firms indicated that they did not
have time to answer the full questionnaire. In total, a full set of information for 97 firm and shortened
survey versions for 15 firms have been collected and captured.
The survey includes questions on firm characteristics, an extensive recruitment section and questions on
the firms’ recruitment behaviour in response to a hypothetical targeted wage voucher for young workers.
Specifically, firms were asked to indicate their likely changes in demand for young workers if their wages
were subsidized up to a maximum of R833 per month for a six month period. Young workers are defined
as workers aged 20 -24.
Results
5

Workforce composition
The following section presents descriptive findings of the firm survey. Given the relatively low number of
observations, we report averages as well as medians to account for the impact of outliers. In particular,
the data set includes one very large company with 18000 employees.
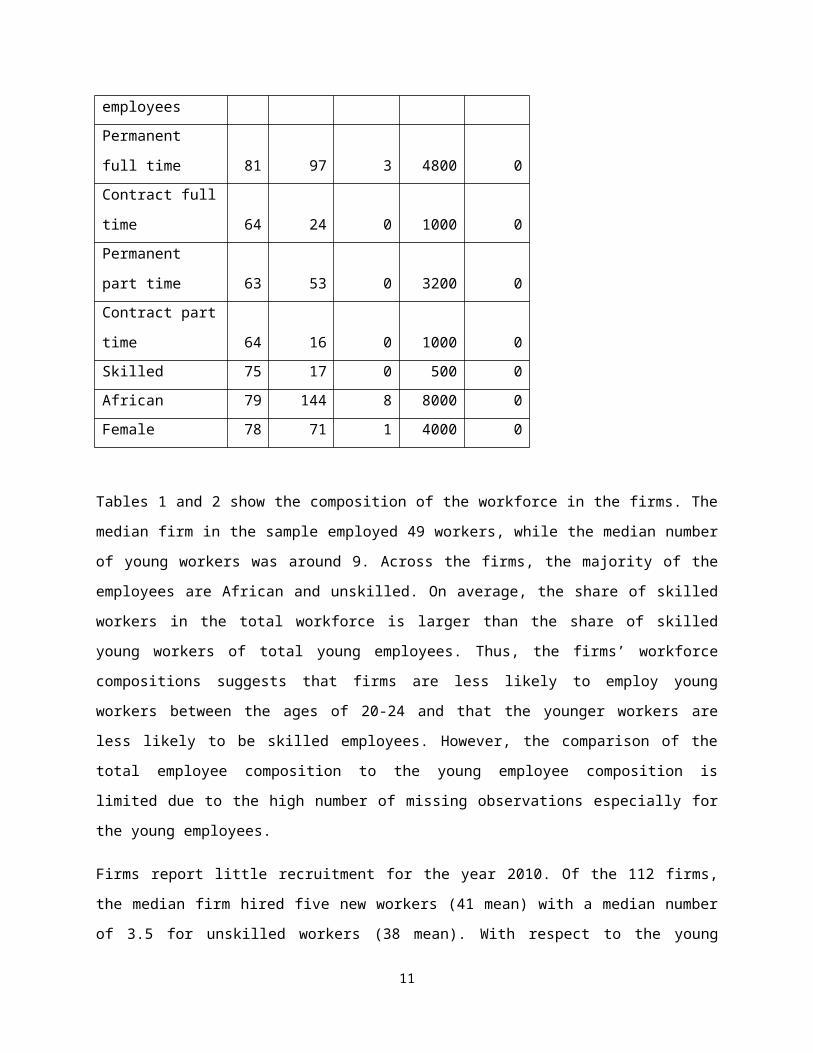
Table 1: Composition of workforce, total workforce (2010)
obs mean median highest lowest
Total employees 112 376 49 18000 2
Permanent full time 102 325 30 14400 0
Contract full time 82 158 0 9027 0
Permanent part
time 78 19 0 1260 0
Contract part time 75 39 0 1800 0
Skilled 97 106 6 3600 0
African 102 312 42.5 15000 0
Female 102 165 10 7200 0
Table 2: Composition of workforce, young employees (age 20-24) (2010)
obs mean median highest lowest
Total young
employees 104 143 8.5 10000 0
Permanent full time 81 97 3 4800 0
Contract full time 64 24 0 1000 0
Permanent part
time 63 53 0 3200 0
Contract part time 64 16 0 1000 0
Skilled 75 17 0 500 0
African 79 144 8 8000 0
Female 78 71 1 4000 0
Tables 1 and 2 show the composition of the workforce in the firms. The median firm in the sample
employed 49 workers, while the median number of young workers was around 9. Across the firms, the
6

majority of the employees are African and unskilled. On average, the share of skilled workers in the total
workforce is larger than the share of skilled young workers of total young employees. Thus, the firms’
workforce compositions suggests that firms are less likely to employ young workers between the ages of
20-24 and that the younger workers are less likely to be skilled employees. However, the comparison of
the total employee composition to the young employee composition is limited due to the high number of
missing observations especially for the young employees.
Firms report little recruitment for the year 2010. Of the 112 firms, the median firm hired five new
workers (41 mean) with a median number of 3.5 for unskilled workers (38 mean). With respect to the
young workers, only 2 young workers were hired by the median firm (31 mean) and only 1 young
unskilled worker was hired at the median (24 mean). This low level of demand could be a reflection of
the financial crisis which seemed to have had its strongest impact on the employment of young workers
(Altman 2010). Table 3 indicates that 22% of the firms in the sample did not hire any new employees in
2010 while a total of 57% of the firms did not hire a single young unskilled worker in 2010. Of the firms
that did hire in 2010, the majority hired relatively few new employees in the range of one to five.
Table 3: Number of new employees hired in 2010
0 1 to 5 6 to10
11
to20
21 to
50
51 to
100
101 to
500
501 to
1000 1000+
New employees
(total) 22% 37% 9% 12% 10% 4% 5% 1% 1%
Unskilled 43% 23% 7% 10% 9% 2% 4% 2% 0%
Young (total) 50% 22% 9% 5% 6% 5% 1% 2% 0%
Young & unskilled 57% 20% 8% 5% 5% 3% 2% 1% 0%
The relatively low demand for unskilled workers is further supported by the fact that only 20% of the
firms indicated that they had vacancies for unskilled workers at the time of the interview.
Expected growth of workforce
7

0.5
11. 5
2
0 .2 .4 .6 .8 1Young employees/total employees
Kernel density estimate
The average firm expects to grow its workforce by 26% (5% median) over the next two years. However,
only 57% of the firms in the sample expect to grow its workforce while 43% expect to keep the same
amount of workers or even reduce its workforce (see graph 1).
Graph 1: Expected workforce changes over the next two years (2010)
Growth
Same
Decline
0% 10% 20% 30% 40% 50% 60%
57%
38%
5%
Patterns of young worker employment
Graph 2 indicates that most firms have a relatively low share of young employees in their workforce. In
the average firm, young employees represent around 25% of the total workforce with 14 firms of the
sample not employing any young people (aged 20-24) at all.
Graph 2: Distribution of young employees to total employee ratio (2010)
Regression 1 shows the association between firm characteristics and the share of young employees in the
firms’ workforce.
8

Regression 1: OLS regression of ratio of young employees to total number of employees
(1)Young employees/
total workforce (OLS)
(2)Young employees/
total workforce (OLS)
Young employees/total workforce
Age (log) -0.0642** -0.162* -0.143*(0.0276) (0.0876) (0.0849)
Age squared (log) 0.0202(0.0173) (0.0167)
Family business -0.0833 -0.0773 0.000131(0.0552) (0.0553) (0.0595)
Unionized firm -0.0886 -0.0595(0.160) (0.162)
Firm size (log of total employees in 2010)
0.0182 0.0185
(0.0243) (0.0242) (0.0237)Union* firm size 0.0155 0.00911 -0.0250
(0.0358) (0.0361) (0.0359)Manufacturing -0.152**
(0.0749)Community/social services
(0.0792)Financial/business services
Hotel/ catering
Construction
Constant 0.405*** 0.498*** 0.432***
Controlling for the size of the firm1 and other firm characteristics, regression 1 indicates that younger
firms are more likely to have a higher share of young employees in their workforce. Compared to the
retail and wholesale sector, which generally employs a larger share of young employees, the
manufacturing sector is more likely to have a lower share of younger employees in its workforce. This
result, though, might be driven by the selection of the sample as all interviewed firms other than the
manufacturing sector employed at least one young worker.
In summary, while young employees already comprise only a relatively low portion of the firms’
workforce, the demand for unskilled young workers has been dampened by the financial crisis.
1 To account for the possible impact of the outlier (firm employing 18 000 employees) as well as a few other very large firms, we use the log of total number of employees
9

Skills training
As is illustrated in graph 3, a large proportion of the firms (87%) in the sample provide training to its new
employee.
Graph 3: Firms providing on the job training to new employees (2010)
13%
87%
No on the job trainingProvide on the job training
The probability of providing training increases with the share of young employees in the total workforce
as is shown in regression 2. This finding is in line with our expectations as it seems to indicate that
employing young workers is more costly as it requires more training.
10

Regression 2: Probit model of firm providing job training (marginal effects)
(1) (2)VARIABLES Providing job training (probit) Providing job training (probit)Age (log) 0.0115 0.0763
(0.0315) (0.0953)Age squared (log) -0.0137
(0.0189)Family business 0.0151 0.00987
(0.0496) (0.0495)Unionized firm -0.525 -0.535
(0.378) (0.370)Firm size (log of total employees in 2010)
-0.00125 -0.000444
(0.0216) (0.0211)Union*firm size 0.105** 0.106**
(0.0493) (0.0480)
Training is also positively associated with an increase in the employment numbers of unionized firms.
SETA accredited training
It is noteworthy that, conditional on providing job training, only 44% of the firms in the sample provide
Sector Education & Training Authority (SETA) accredited job training. Thus, firms seem to provide very
firm specific training which is not necessarily transferable to other jobs. Furthermore, SETA accredited
training allows workers to use the accreditation as a productivity signal when applying for a different job.
Graph 4: Firms providing SETA accredited job training to new employees (conditional on providing training)
56 %
44 % Not SETA accreditedSETA accredited
11

As the output of regression 3 shows, the probability of providing SETA accredited training is negatively
correlated with the share of young employees (also not statistically significant) which suggests that young
employees are less likely to be exposed to SETA accredited training.
On the other hand, SETA accredited training is strongly positively correlated with the size of the firm and
the presence of a union at the firm. Larger firms might be able to use the SETA training system more
efficiently for their training purposes as they are more likely to have dedicated human resource
departments that can arrange and organize for SEAT accredited training that is relevant for the firm.
The positive impact of the presence of a union at the firm suggests that unions can potentially exert
pressure on management to provide accredited training to its workforce rather than firm specific training
only.
Regression 3: Probit model of firm providing SETA accredited job training (conditional on providing training, marginaleffects)
(1) (2)Seta accredited training
(probit)Seta accredited training
(probit)Seta accredited training
(probit)Age (log) -0.0413 -0.245 -0.257
(0.0604) (0.186) (0.194)Age squared (log) 0.0399 0.0427
(0.0347) (0.0360)Family business 0.0189 0.0421 -0.00209
(0.132) (0.135) (0.179)Unionized firm 0.807*** 0.853*** 0.832***
(0.202) (0.171) (0.198)Firm size (log of total employees in 2010)
0.271*** 0.278*** 0.277***
(0.0763) (0.0747) (0.0843)Union* firm size -0.185** -0.204** -0.195*
(0.0938) (0.0926) (0.102)Young employees/ total workforce -0.148 -0.160 -0.146
(0.251) (0.247) (0.276)Manufacturing 0.0632
(0.220)Community/social services 0.0688
(0.199)Financial/business services -0.0770
(0.208)Hotel/ catering -0.0588
(0.275)Government funded learnerships
12
Only around 19% of the firms in the sample offer government financed learnerships to young employees.
Graph 5: Firms offering government funded learnerships
81%
19%
No leanershipsGovernment funded learnerships
As regression 4 shows, family businesses are less likely to offer government funded learnerships to young
employees. The share of young employees in the total workforce, the size of the firm, as well as the
presence of a union at the firm are positively associated with the provision of a government funded
learnership but none of these is statistically significant. Compared to the retail and wholesale sector, all
other sectors show a positive association with the provision of government funded learnerships but only
the community and social service sector is statistically significant.
13

Regression 4: Probit model of firm offering government funded learnerships (marginal effects)
(1) (2)Government funded learnership (probit)
Government funded learnership (probit)
Government fundedlearnership (probit)
Age (log) 0.000432 -0.0104 -0.00475(0.0344) (0.107) (0.0915)
Age squared (log) 0.00212 0.00432(0.0198) (0.0169)
Family business -0.138** -0.138** -0.0986(0.0655) (0.0656) (0.0734)
Unionized firm 0.0787 0.0829(0.222) (0.226)
Firm size (log of total employees in 2010)
0.0330 0.0332
(0.0367) (0.0368) (0.0353)Union* firm size 0.00719 0.00635 -0.0168
(0.0470) (0.0476) (0.0443)Young employees/ total workforce 0.0943 0.0919
(0.130) (0.131)Manufacturing
Community/social services
Financial/business services
In summary, the majority of firms do provide training to their new employees but relatively little
accredited training which employees could take further to signal the firms’ investment in the worker’s
human capital. Especially for the training of young employees, firms seem to be less willing to invest in
costly training.
14

Recruitment and matching
Following the theoretical considerations in the earlier section of this paper, firms were asked to report on
their recruitment behaviour for skilled and unskilled positions.
Graphs 3 and 4 show the preferred channels to advertise unskilled and skilled jobs, respectively. 66% of
the firms in the sample claim that they either do not advertise unskilled jobs (25%) or rely on word-of-
mouth advertising (41%) to create a pool of applicants. Only 26% of the firms use formal channels of
advertisements (newspaper and public notice boards) to advertise unskilled vacancies while the
remainders (8%) use labour brokers or public employment agencies. Thus, without any attachment to the
labour market through social contacts, unskilled job seekers are very unlikely to locate suitable vacancies.
Graph 6: Main channel to advertise unskilled positions
Word-of-mouth
Formal advertisements
No advertising
Employment agency
0% 5% 10% 15% 20% 25% 30% 35% 40% 45%
41%
26%
25%
8%
Advertising of skilled vacancies represents a very different picture. 75% of the firms indicate that they
prefer to announce the availability of skilled positions to a wider audience. Specifically, 35% use formal
advertisement channels, 27% use public and private employment agencies and 13% engage in recruitment
initiatives at schools and universities. This reflects the need of firms to create a pool of suitable applicants
for skilled positions.
Graph 7: Main channel to advertise skilled positions
Formal advertisements
Employment agency
Word-of-mouth
Internal and recuitment initiatives
No advertising
0% 5% 10% 15% 20% 25% 30% 35% 40%
35%
27%
13%
13%
11%
15

For unskilled jobs, however, firms are less willing to incur advertising costs (as is in line with our
expectations given the theory of recruitment optimization). This is not surprising given the high applicant
arrival rate of unskilled job applicants that firms experience.
The median firm faces 15 applicants per month enquiring about an unskilled position (average 55
applicants) which presents firms with a constant supply of unskilled workers. Thus, the high applicant
arrival rate ensures that firms experience a constant pool of workers for jobs with low job requirements.
Regression 5: OLS regression of average number of unskilled applicants approaching firm per month
(1) (2)Avg. number of
unskilled workers approaching firm per
month (OLS)
Avg. number of unskilled workers
approaching firm per month (OLS)
Avg. number ofunskilled workers
approaching firm permonth (OLS)
Age (log) 9.264 -83.81** -87.71**(13.45) (39.74) (40.95)
Age squared (log) 19.71** 20.77**(7.952) (8.192)
Family business 19.01 20.76(25.88) (25.10) (27.83)
Unionized firm -206.1*** -168.8** -143.0*(73.57) (72.91) (79.39)
Firm size (log of total employees in 2010)
3.070 2.945
(11.13) (10.79) (11.18)Union* firm size 50.27*** 42.37** 36.33**
(16.44) (16.26) (17.32)Young employees/ total workforce 56.96 42.65
(48.97) (47.83) (53.76)Manufacturing -19.02
(36.62)Community/social services -3.515
(37.27)Financial/business services -18.71
(51.30)Hotel/ catering
(54.06)Construction -24.43
(85.67)Constant -17.58 75.47
As regression 5 shows, the more visible a firm (larger and unionized) the more likely it is to experience
an increasing number of applicants. Older firms, on the other hand, are less likely to experience a high
16

number of applicants. Also, compared to wholesale and retail stores, as well as hotel and catering
services, all other sectors experience a lower number of unskilled job applicants. This might reflect the
visibility of the firms.
The number of unskilled applicants has to be seen in relation to the demand of unskilled workers. We use
the number of unskilled workers hired in 2010 as a proxy of the annual demand for workers in order to
calculate the number of unskilled applicants for each new hire. We have to upscale the average monthly
number of applicants by multiplying the average monthly number of applicants by 12 to get the annual
applicant arrival rate. Therefore, in 2010, for each new unskilled hire the firm on average experienced 177
applicants over the year (24 median). It is therefore not surprising that is only takes the median firm less
than 1 week (2 weeks average) to fill an unskilled position while a skilled position takes the median firm
around 1 months (2 months on average) to fill.
Graph 8: Main channels through which unskilled applicants approach firms (%)
Direct applications
Formal channels
Workforce referrals
0 10 20 30 40 50 60
55%
29%
16%
As is shown in graph 8, the majority of the unskilled applicants (55%) approach firms by directly
enquiring about vacancies at the gate of the company. Around 29% of the applicants respond to
newspaper advertisements or send their CVs to the company. Only 16% of the applicants approach
companies through someone who works at the company itself.
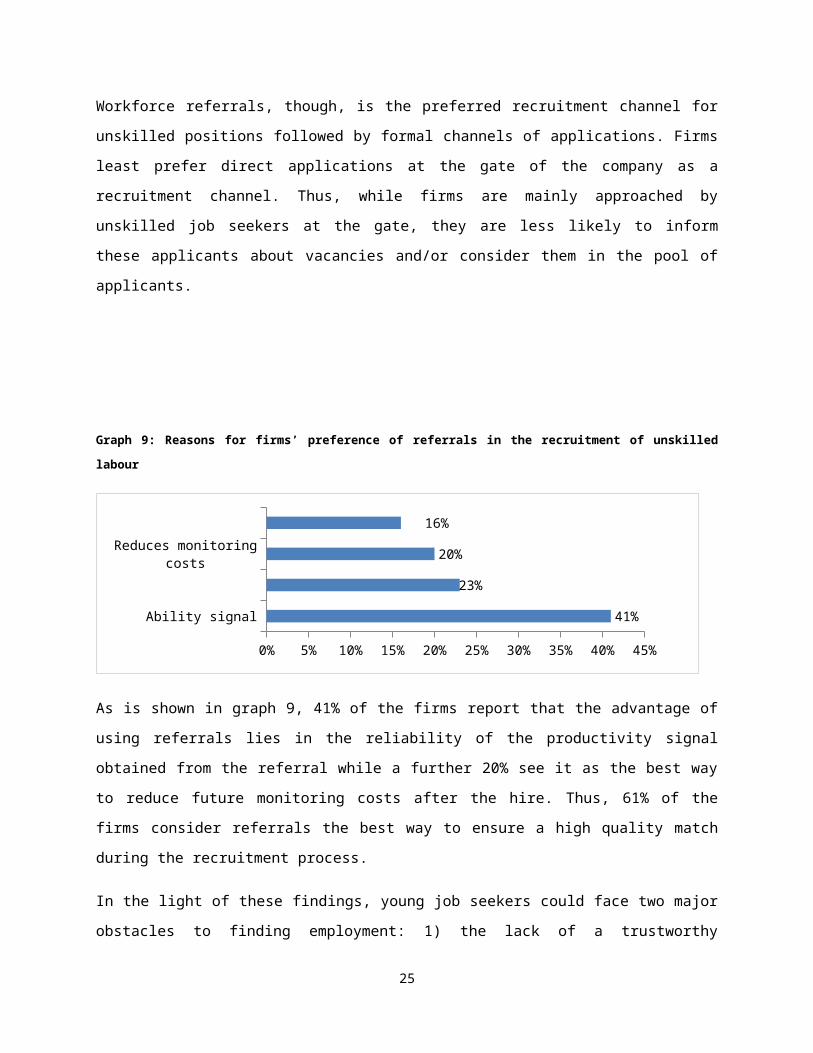
Workforce referrals, though, is the preferred recruitment channel for unskilled positions followed by
formal channels of applications. Firms least prefer direct applications at the gate of the company as a
recruitment channel. Thus, while firms are mainly approached by unskilled job seekers at the gate, they
are less likely to inform these applicants about vacancies and/or consider them in the pool of applicants.
17

Graph 9: Reasons for firms’ preference of referrals in the recruitment of unskilled labour
Ability signal
Do not use referrals
Reduces monitoring costs
Reduces recruitment costs
0% 5% 10% 15% 20% 25% 30% 35% 40% 45%
41%
23%
20%
16%
As is shown in graph 9, 41% of the firms report that the advantage of using referrals lies in the reliability
of the productivity signal obtained from the referral while a further 20% see it as the best way to reduce
future monitoring costs after the hire. Thus, 61% of the firms consider referrals the best way to ensure a
high quality match during the recruitment process.
In the light of these findings, young job seekers could face two major obstacles to finding employment: 1)
the lack of a trustworthy productivity signal which would force firms to take a chance when hiring a
young job applicant; and 2) limited access to relevant job market information as the size of a workers’
social networks tend to increase with employment experience.
According to Levinsohn (2007), the wage voucher would allow firms to be more risk taking and employ
young unskilled applicants at a lower wage cost. To investigate the possible response of firms to the
implementation of a targeted wage subsidy for young employees, firms were asked how access to wage
subsidized young workers would affect their recruitment decisions.
Wages and firm responses to a hypothetical wage voucher
In order to investigate the possible impact of a wage subsidy, we need to understand the current cost of
employing an unskilled worker. The median starting wage of an unskilled worker employed by the
sample of firms is R2830 (R3222 mean)2. Considering these in relation to the proposed wage voucher
2 The median starting wage of a skilled worker in the sample is R7000 (mean R8439.5). However, respondents were more reluctant/could not provide wages for skilled workers. Thus, there are very few observations for skilled wages.
18

0.0
001
.000
2.0
003
0 2000 4000 6000 8000 10000
Average monthly starting wage of unskilled worker (South African Rand)
Kernel density estimate
amount of R833 yields a wage cost subsidy for a newly hired unskilled worker of almost 30% of the
median unskilled starting wage (26% of the mean starting wage of unskilled workers in the sample).
Graph 10: Distribution of monthly starting wages of unskilled workers (2010)
Regression 6 shows determinants of the variation in the monthly starting wage of unskilled workers.
In line with the literature on wage differentials, our sample shows that that the presence of a union leads
to a union premium and that larger firms pay higher starting wages to unskilled workers. Family
businesses and firms with a higher share of young employees in their total workforce, on the other hand,
pay lower starting wages. Compared to the retail and wholesale sector, the financial and business service
sector pays significantly higher starting wages
19

Regression 6: OLS regression of log of monthly starting wages for unskilled workers
(1) (2)Monthly starting
wage (OLS)Monthly starting
wage (OLS)Monthly starting
wage (OLS)
Age (log) -0.0262 0.0552(0.0592) (0.178)
Age squared (log) -0.0170 -0.0246(0.0350) (0.0331)
Family business -0.259** -0.261**(0.124) (0.125)
Unionized firm 0.830** 0.809** 0.872**(0.338) (0.342)
Firm size (log of total employees in 2010)
0.151*** 0.152*** 0.126**
(0.0517) (0.0521) (0.0498)Union* firm size -0.173** -0.169** -0.169**
(0.0751) (0.0760) (0.0736)Young employees/ total workforce -0.452* -0.440*
(0.235) (0.237)Manufacturing
Community/social services
Financial/business services 0.728***
Hotel/ catering -0.0160
Construction
Constant 7.648*** 7.565*** 7.404***With the introduction of the subsidy, one could expect firms and job seekers to negotiate how the subsidy
is shared between the two parties. However, only 43% of the firms in the sample negotiate the starting
wage of unskilled workers (see graph 10).
Graph 10: Ability of new unskilled employees to negotiate their starting wages during recruitment
20

57%
43% Fixed wageNegotiated wage
As regression 7 shows, larger firms as well as firms with a higher share of young employees in their total
workforce are less likely to negotiate starting wages. This is further reflected in graph 11.
Regression 7: Probit model of starting wages of unskilled jobs being negotiated (marginal effects)
(1) (2)Wage negotiated
(Probit)Wage negotiated
(Probit)Wage negotiated
(Probit)Age (log) -0.00160 0.189
(0.0681) (0.227)Age squared (log) -0.0399 -0.0422
(0.0453) (0.0461)Family business 0.0663 0.0677
(0.128) (0.128)Unionized firm 0.233 0.191
(0.359) (0.373)Firm size (log of total employees in 2010)
-0.106* -0.106* -0.116**
(0.0565) (0.0566) (0.0580)Union* firm size 0.0307 0.0400
(0.0843) (0.0863) (0.0907)Young employees/ total workforce -0.568** -0.547**
(0.265) (0.267)Manufacturing
Community/social services -0.0477
Financial/business services
Hotel/ catering
Graph 11: Young employee to total employee ratio relative to ability of negotiating the starting wage
21

0.5
11.
52
0 .2 .4 .6 .8 1Young employee to total employee ratio
Negotiated wages Fixed wages
Responses to hypothetical wage voucher
Firms were asked to indicate how many young workers they would employ additionally to their existing
workforce if the wages of these new hires were to be subsidized up to 50% (up to a total maximum of
R833 per month) for a six month period. 38% of the firms responded positively to this hypothetical
scenario and indicated that they would on average hire 7.5 young workers additionally to their existing
workforce. The remaining 62% of the firms, however, pointed out that their hiring decision of young
applicants with wage vouchers depends on the number of openings that they have, thus they would
consider hiring young applicants in response to the wage voucher but not additionally to their existing
workforce. This is an interesting finding in itself as it suggests that firms would substitute young
applicants for older applicants when faced with the two options in the hiring process.
22
Regression 8: Probit model of firm hiring wage voucher holders additionally to existing workforce (marginal effects)
(1) (2)Hiring voucher
holders additionally to workforce
(Probit)
Hiring voucher holders additionally
to workforce(Probit)
Hiring voucherholders additionally
to workforce(Probit)
Age (log) 0.0931 0.107(0.0663) (0.194)
Age squared (log) -0.00292 -0.00307(0.0372) (0.0381)
Family business -0.294** -0.295**(0.117) (0.119)
Unionized firm 0.522* 0.521* 0.621**(0.288) (0.290)
Firm size (log of total employees in 2010)
-0.00622 -0.00629 -0.00397
(0.0552) (0.0552) (0.0567)Union* firm size -0.140* -0.140* -0.167*
(0.0841) (0.0845) (0.0878)Young employees/ total workforce 0.805*** 0.808*** 0.641**
(0.258) (0.260)Manufacturing
Community/social services
Financial/business services Regression 8 shows firm characteristics that are correlated with the probability of hiring young subsidized
workers additionally to the existing workforce.
Controlling for sectors and other firm characteristics, firms that already employ a larger share of younger
workers in their workforce claim to be more likely to hire additional young workers and thereby grow
their existing workforce. Family businesses and larger firms, on the other hand, are less likely to hire
wage voucher holders additionally to their existing workforce. Surprisingly, firms that report the presence
of a union also report to be more likely to hire voucher holders additionally to their existing workforce.
This might rather reflect the skill level of such firm as one would expect firms with a larger share of
unskilled workers to be unionized.
All in all, the findings seem to suggest that smaller firms who are already employing young workers are
likely to grow in response to the implementation of the wage voucher. This finding is not surprising
given that firms that already employ a larger number of young workers in their workforce seem to pay
23

lower starting wages (see findings in regression 7) and the subsidy itself simply reduces the input cost to
these firms. Thus, the proposed wage subsidy would potentially have a larger impact on the demand for
workers in low wage jobs. Other firms, on the other hand, are more likely to keep the size of their existing
workforce constant but might change the composition of their workforce over time by systematically
increasing the share of younger employees in the workforce.
Replacement of older workers
With the introduction of a targeted wage subsidy, only the hiring cost of a particular group of workers
would be reduced, in this case young workers aged 20 to 24. Thus, firms would have an incentive to use
these subsidized younger workers to substitute workers from other age groups whose wages are not
subsidized and therefore are higher.
Replacement of older workers with higher, non-subsidized wages can happen at two places: during the
recruitment process whereby the firm has to choose between a young applicant and an older applicant,
and/or in the deliberate retrenchment of older workers of the existing workforce to make space for
younger employees. The previous findings indicate that all firms would respond positively to the wage
voucher and consider hiring voucher holders when approached. Thus, the wage voucher is likely to lead
to a systematic preference of younger workers during hiring process when faced with two equally
qualified applicants. The second type of replacement would require a more active approach on the side of
the employer as he/she would have to retrench an existing, older worker in order to free up a position to
be filled with a voucher subsidized, younger worker.
While 27% of the firms say that they would replace (or do not rule it out) older workers with younger
wage subsidized workers, 73% indicated that they would not replace older workers of their existing
workforce through the hire of wage voucher holders. As is indicated in graph 12, the majority of firms
(77%) that report that they would not replace older workers state the level of experience and loyalty as the
main reason for not retrenching older workers and replacing them with younger, wage subsidized
workers. A further 14% claim that it would simply be ‘unethical’ or ‘unfair’ do use the younger, cheaper
workers to replace older workers in the company. A small proportion of the firms that indicated that they
would not replace older workers seem to suggest that they would consider doing so if the voucher period
of 6 months was extended or if retrenchment was less restricted by labour regulations and the presence of
unions.
Graph 12: Reasons for not replacing older workers with younger, wage subsidized workers
24

Worker experience
Unethical/unfair
Labour regulations
Duration of voucher too short
0% 10% 20% 30% 40% 50% 60% 70% 80% 90%
77%
14%
5%
4%
One has to remember that all of the findings on the implementation of a targeted wage subsidy are self
reported behavioural changes in response to a hypothetical scenario. These are not actually observed
behavioural changes. However, they give an indication of the attitude towards the implementation of a
wage voucher.
Discussion
The implementation of the wage subsidy affects the employment behaviour of firms in two ways: on the
one hand, firms can use the subsidized worker as a cheaper production input and increase profit. This
should be the case especially for firms that can determine the productivity level of the applicants. In this
case, we would expect firms to increase their demand for the cheaper input and increase their workforce
by hiring more subsidized workers. On the other hand, firms that cannot establish the true productivity
level of the applicant can use the subsidy to lower the cost of employing a worker with uncertainty. Here
the subsidy acts as an incentive to substitute from one input (older workers whose productivity level is
known) to another (younger workers whose productivity level is unknown) without necessarily increasing
the overall demand for inputs. Thus, the lower wage paid to the younger workers simply reflects the
quality of the match.
Our findings suggest that younger, smaller firms who pay lower starting wages and operate in sectors
which are more suitable for the employment of younger workers are most likely to respond positively to
the implementation of the targeted wage voucher by growing their existing workforce through the hire of
subsidized workers. This is not surprising if the wage cost of younger workers already makes up a larger
share of the firm’s production cost and the wage cost reduction due to the subsidy is proportionally
higher. One can further assume that these firms that already employ a larger number of young workers are
better positioned to establish the productivity level of a young applicant or that the required productivity
level for these jobs is low enough that any applicant is a possible match. Therefore, the subsidy would not
25

necessarily have to offset the uncertainty around the applicant’s productivity level but rather allow these
firms increase profit. A possible outcome of the subsidy could be that a larger share of young job seekers
is pulled into low paying jobs. If any employment experience of young workers improves the subsequent
employment probability, then it should not matter. On the other hand, if the work-life trajectory of the
young workers is dependent on the type of first time employment, then pushing more first time young
workers into low paying jobs might not be the desired outcome.
However, the findings also suggest that other firms would respond positively to the implementation of the
wage voucher, not by creating new positions but by hiring against open vacancies. These firms seem
more likely to be uncertain about the true productivity level of younger applicants but indicate that a
lower wage would compensate for a lower quality match. This is in line with the predictions of the
theoretical framework: given that current starting wages of unskilled workers are around R3000, it
implies that the proposed wage voucher constitutes a significant cost reduction and employers should be
more willing to consider employing a young applicant even if they cannot establish the true productivity
level of the applicant.
This would reduce the current disadvantage of young job seekers who do struggle to convince employers
of their productivity levels. Thus, the proposed wage voucher should affect the workforce composition of
the firms in favour of younger workers over time.
One could further assume that the lower wage cost allow firms to invest more in the human capital of the
young workers. Thus, firms might be more willing to engage in more costly training that is beyond firm
specific training. Especially if this training is accredited and the set of skills are transferable to other jobs,
it would allow young workers to progress into other jobs.
But who of the young job seekers is more likely to benefit from the implementation of the targeted wage
subsidy? If the main reason for not employing young applicants has been the uncertainty about their
productivity levels, one can assume that this problem is more severe for young unskilled job seekers who
do not have trustworthy school performance signals. Young job seekers with reliable school signals
(matric and further education) are more likely to be hired for jobs that have higher levels of job
requirements, i.e., where the quality of the match is increasingly important for the productivity of the new
hire. It is therefore questionable if firms will consider the amount of the subsidy sufficient to offset the
likelihood of employing a young applicant who applies for a skilled position. On the other hand, the
subsidy constitutes a significant portion of starting wages for unskilled workers. Currently, the majority
of firms reduce the pool of applicants for unskilled positions to workers who are related to the existing
26
workforce. The use of referrals was explained in terms of allowing the employer to establish the
productivity level of the applicant.
With the introduction of the wage subsidy, one could expect two possible scenarios. On the one hand,
employers will try and source more young employees through referrals of its existing workforce and
young job seekers in households that are already attached to the labour market are more likely to benefit
from the implementation of the wage subsidy. In contrast, young job seekers of already marginalized
households (without employment and/or other sources of labour market attachment) are likely to remain
marginalized. On the other hand, if firms continue to rely on word-of-mouth recruitment, the pool of
suitable young applicants is limited by the size of the existing workforce. Thus, one could also expect that
firms are more willing to experiment with the employment of young applicants who approach companies
directly when that the cost of taking the risk is reduced due to the subsidy.
Furthermore, because employment probabilities are an equilibrium outcome of the demand and supply
side in the labour market, the perception by young job seekers of an improved employment probability
might increase the search effort of young job seekers which should further increase the employment
probability of this age group.
27

Conclusion
The aim of the paper was to shed some light on the employment patterns of young workers in South
African firms and to describe self-reported firm responses to the hypothetical implementation of a
targeted youth wage subsidy.
The findings suggest that firms generally employ relatively few young people and that the current
recruitment process is likely to create a systematic disadvantage to the employment probabilities of young
job seekers. However, the majority of firms in the sample indicate that they would consider hiring young
applicants when subsidized although not additionally to their existing workforce. Thus, the wage subsidy
is less likely to reduce overall unemployment but one can expect the unemployment rates of the
subgroups to change with a favourable change for the younger age groups.
The impact on the matching process and overall wages (as well as wages for the various age groups) in
the South African labour market are not clear.
Clearly, one limitation of the current study has been the design of the subsidy question in the survey.
Firms were told that the subsidy is only applicable for a six month period and their responses might have
been different for a permanent youth wage subsidy or a subsidy that is available for a longer period of
time. One can assume that the willingness of firms to employ young workers increases with a longer or
more permanent wage subsidy. The same can be said about different amounts of the wage subsidy. The
findings in this study are based on a relatively low subsidy (R833) for a relatively short period of time (6
months). It is therefore reasonable to assume that the responses reflect a lower limit to the implementation
of a targeted wage subsidy and that the effect might be more pronounced for a longer subsidy period or a
larger subsidy amount.
28

REFERENCES
Altman, M. 2007. Youth Labour Market Challenges in South Africa. HSRC Employment, Growth and Development Initiative (EGDI) paper.
Altman M. 2010. Addressing the challenge of youth unemployment. Adcorp Employment Quaterly, June
2010
Banerjee A., Galiani S.; Levinsohn J, McLaren Z Woolard I, 2007. Why has unemployment risen in the
New South Africa? NBER Working Paper 13167, Cambridge, MA: NBER
Banerjee A., Galiani S.; Levinsohn J, McLaren Z Woolard I. 2008 Why has unemployment risen in the
New South Africa? The Economics of Transition, 16(4): 715-740
Calvo-Armengol A. 2006. Social Networks and Labour Market Outcomes. Working paper No 16, Centre
de Recerca en Economia Internacional
Devine T.J. & Kiefer N.M. 1991. Empirical Labour Economics: The Search Approach, Oxford University
Press, Oxford
Duff P. & Fryer D. 2004. The Dynamics of Job Search and the Microfoundations of Unemployment:
Evidence from Duncan Village. paper presented at the DPRU conference “African Development and
Poverty Reduction: the Micro-Macro Linkage”, Cape Town
Go D.S., Kearney M., Korman V., Robinson S. & Thierfelder K. 2009. Wage Subsidy and Labour Market
Flexibility in South Africa. Working paper No 114. ERSA
Gorter C., Nijkamp P. & Rietvield P. 1993. The Impact of Employer’s Recruitment Behaviour on the
Allocation of Vacant Jobs to Unemployed Job Seekers. Empirical Economics. 18: 251-269
Holzer J.H. 1987. Hiring Procedures in the Firm: Their Economic Determinants and Outcomes. NBER
Working paper, No 2185
Levinsohn J. 2007. Two policies to alleviate unemployment in South Africa. Mimeo. University of
Michigan
Lindeboom M., Van Ours J. & Renes G. 1994. Matching Employers and Workers: An Empirical Analysis
of the Effectiveness of Search. Oxford Economic Papers. 46: 45-67
Pissarides C.A. 2000. Equilibrium Unemployment Theory. London: MIT Press
29

Russo G., Rietvield P. & Gorter C. 2000. Recruitment Channel Use and Applicant Arrival: An Empirical
Analysis. Empirical Economics. 25: 673-697
Schöer V. and Leibbrandt M. 2007. Determinants of Job Search Strategies: Evidence from the
Khayelitsha/Mitchell’s Plain Survey. South African Journal of Economics. 74(4): 702 - 724
Schöer V., Rankin N., & Roberts G. 2010. The match between firms, young workers and jobs in South
Africa. Vision or Vacuum? 2010 Transformation Audit. Jan Hofmeyer (editor). Institute for Justice and
Reconciliation
Wittenberg M, 2002. Job Search in South Africa: A nonparametric analysis. South African Journal of
Economics. 70(8): 1163-1197
30


