Embed Size (px)
Citation preview

INTRODUCTION TO ZOHO REPORTING
DAY 3 – SESSION 2.2

SIGN-IN INTO YOUR ACCOUNT
• To Sign-in to your Zoho Account navigate to the following link:
https://www.zoho.com/reports/login.html
• Enter your user name and password and click the “Sign Up Now!” button

CONSIDERATIONS
• To access the Zoho Reporting website, you need the following items:
Reliable internet connection
Internet browser, such as Internet Explorer, Mozilla Firefox, Google Chrome

ZOHO REPORTS LICENSES - USERS
Zoho reports is licensed based on the number of users and Rows(records)
Who is a User?Anyone to whom you privately share your databases, tables(data), reports and dashboards for collaboration is considered a "User" in the Zoho Reports pricing model. A user is identified by his/her unique email address, with which their Zoho Reports account was created/registered.
Example: Suppose you subscribe to a Zoho Reports plan for 5 - you can privately share the data/reports in your account and collaborate with 4 other people.
When sharing reports within other organizations or partners, donors, etc… you have the ability to share reports without having to purchase licenses for these users.
ZOHO REPORTS LICENSES - ROWS/RECORDS
What are rows/records?In Zoho Reports, a row or record is defined in the same context as in a database. In simple terms, a database table consists of rows (records) and columns (fields). Each row in a table represents a set of related data and has the same structure. For example, in a table that represents "Employees", each row would represent a single employee record.
The number of rows shown in the pricing plan, is the sum of all rows/records stored across all your database tables in your Zoho Reports account. As a measure of size, you can assume 100,000 simple rows would be equivalent to 10MB or more in data size. However, this can vary based on the number of columns and the type of data.

REPORTING CHALLENGES
• A common challenge of data collection is how to aggregate, analyze and report on the data.
• The most common program used is MS Excel, which is not an ideal reporting tool; if you need to link multiple sources of data it can take days if not weeks to organize data in a way that it can be reported.
ZOHO DATABASE
Zoho Reports organizes all the information into a logical collection of data called a Database. A database is a logical grouping of datasets (stored in Tables) and all the reports created. The database also contains structural information on how the data (table) is organized and offers users different ways to filter, edit and report on that data.
The user who creates a reporting database is the owner/administrator of the database. Only the administrator can delete the database created by him/her. Also he/she controls the access privileges of the database i.e., who can access, create reports and edit data in the database.

IMPORTING DATA
Click on “Import from File & Feeds” option

IMPORTING DATA LOCALLY
1. Specify the Table Name2. Add a Description 3. Select the File Type as “EXCEL”4. Select Data Location as “Local Drive”

OR… GET THE URL FOR A DATA FEED
1. Select Form in iForm2. Hold the “Shift” button on your keyboard and click on
“JSON” for Feed type
GET THE URL FOR A DATA FEED
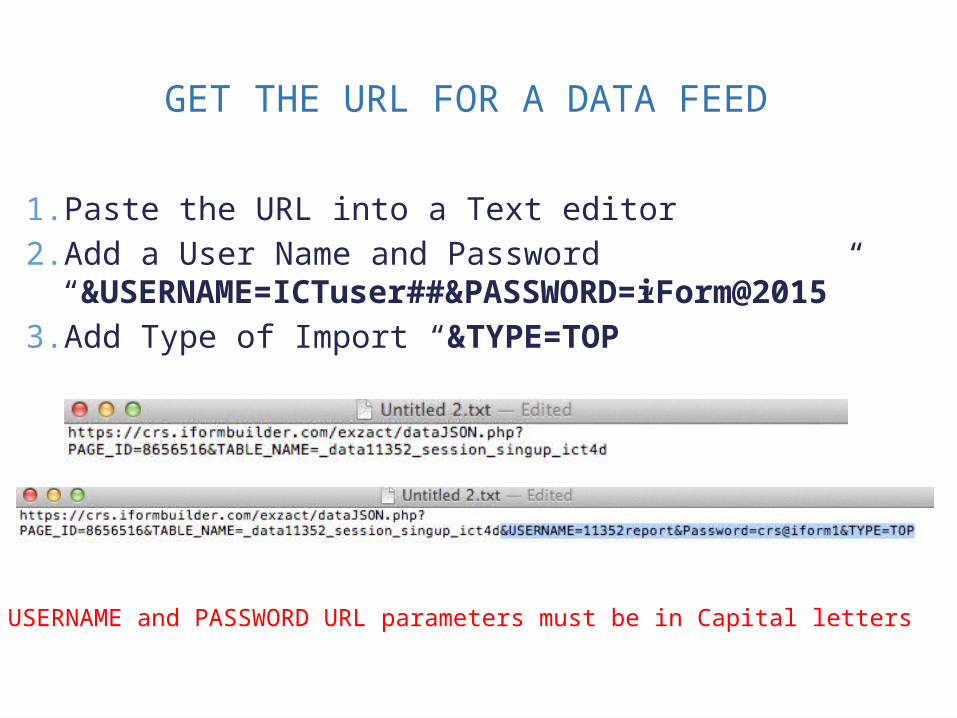
1. Paste the URL into a Text editor2. Add a User Name and Password
“&USERNAME=ICTuser##&PASSWORD=iForm@2015”
3. Add Type of Import “&TYPE=TOP”
Note: USERNAME and PASSWORD URL parameters must be in Capital letters

IMPORTING DATA FROM IFORMBUILDER
Now that we have all the necessary information we are ready to import data into Zoho Report tables.
Click on “New Table” button as shown in screen shot below.

IMPORTING DATA
1. You should see a preview of the data you are importing
IMPORTING DATA
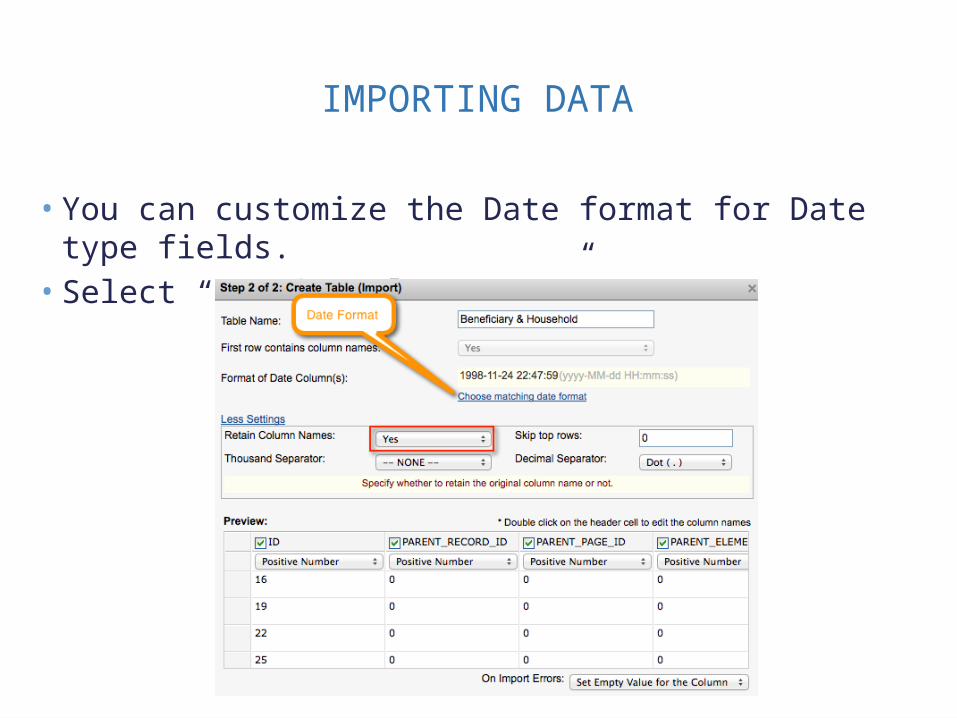
• You can customize the Date format for Date type fields.• Select “Retain Column Name” = Yes

IMPORTING DATA
• Uncheck the columns which you do not require in your report

CREATE YOUR DATABASE!

CONFIRMATION
• You should get a confirmation after successfully importing the data • From this screen you can schedule a periodic import of
the data. Click on “Would you like to schedule this import periodically?”

IFORM - PERIODIC IMPORT
• Select “How do you want to import?” “Add new, replace existing and delete missing records”.• Select “ID” as the Key Field• Specify the import frequency and the Notification
frequency for failures.• Click “Save”

NOW YOU HAVE IMPORTED A DATA FEED
• Note: Using these steps users should import all forms in a parent and child relationship and then re-join these when establishing relationships between tables later on

REPORTING | FIVE GUIDING QUESTIONS
Before starting any report in Zoho try to answer these questions:
1. What indicators need to be reported on?2. Best format of the report? [Charts/tabular ?]3. What are my data sources? 4. Do I need parent form only or related “child”
files, as well?5. What calculations do I need?

GROUP WORK #1
Analyze the workshop registration data
• How many participants per organization, broken down by sex
• % breakdown of favorite colors in group
• # of participants by sector, with the ability to filter by sex
• Report on # of support trips per region, broken down by organizations responding
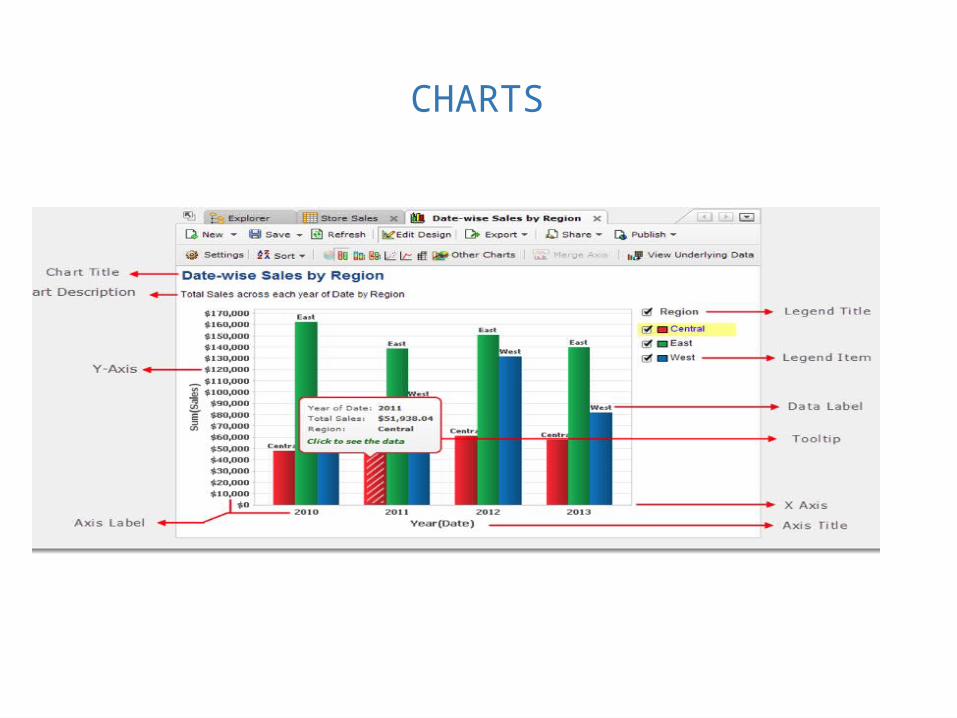
CHARTS
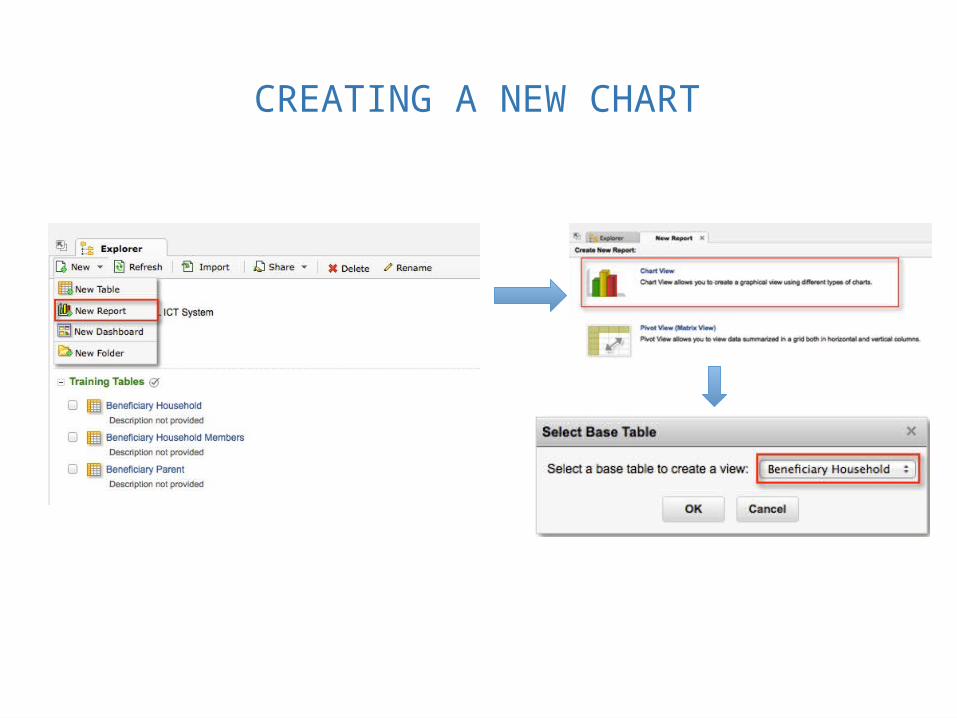
CREATING A NEW CHART

CREATING A NEW CHART, CON’T
• In Edit Design mode, you will notice all the columns of the selected table listed on the left side Column List pane. On the right hand side, you can see the Design Area with shelves to drop the columns and a preview area below to view the chart created.

CREATING A NEW CHART, CON’T
Drag and drop the required columns listed in the Column list pane into the respective shelves in the Graph tab. You can also Select the check box adjacent to each column listed to auto place the columns into the appropriate shelves. After dropping the columns click on the option Click here to Generate Graph to create the new chart.

CHOOSING CHART TYPES

APPLYING FILTERS

USER FILTERS
Zoho Reports allows you to include dynamic filtering capabilities in the reports view mode called User Filters. User filters enables your users who access the report, to apply filters on the report data displayed using the filter columns exposed as part of User Filters. The filter columns included in User Filters can be displayed using a variety of display components like Drop Down boxes, Slider, Date range chooser etc., to suit your needs.

USER FILTERS
To add a string (categorical) column as a User Filter, follow the instructions given below:• Open your report (chart) in Edit Design Mode and then click
User Filters tab in the Design Area.• Drag and drop the required category (string) column which
you want to add as a user filter in the User Filters tab as shown below.

USER FILTERS
Hover your mouse over the dropped column and select Edit from the highlighted options.

USER FILTERS
On clicking the Edit user filter option it opens a dialog box with options to edit the Filter Display Name and to Choose Component type for the user filter, as shown in the screen-shot below.

USER FILTERS
Now when you publish your chart a user will have the ability to select the filter option that would be applied for this chart that dynamically refreshes data based on the user filter

APPLYING FUNCTIONS ON COLUMNS
Zoho Reports allows you to apply aggregate/categorical functions like Sum, Count, Average, Min, Max, etc., on the data columns to group and summarize data in charts. When you apply a function on a column, a single value will be returned, derived based on the values in the column.
The default function for a Numeric (including Currency) data type is Sum and for a Date data type is Year. If the data type of the column is string (Categorical/Dimension column) and not numeric, then the default function applied is Actual Values.

PIVOT TABLES
Pivot Tables allow you to dynamically rearrange, group and summarize data for easy analysis of large data sets. You can transform data in a table(s) into interactive and meaningful summaries easily by using intuitive drag and drop provided by Zoho Reports.
You can also filter, sort and customize the appearance and content of your Pivot Table the way you want it, by using a wide range of options provided by Zoho Reports. For users who view/access the pivot tables, Zoho Reports offers a range of interactivity like Data Drill Down, User Filters, Sorting, Export etc.,

CREATING A PIVOT TABLE
To create a Pivot View, follow the steps given below:1. Open the reporting database containing the required data with
which you want to create a Pivot Table.2. Click New Report button in the left top corner to open the Create
New Report window.3. In the Create New Report window, click Pivot View (Matrix View).
The Select Base Table dialog box opens as shown below.4. Use Select Base Table dialog box to choose the table on which you
want to create the Pivot Table and then click OK.5. This opens a window in Edit Design mode:

CREATING A PIVOT TABLE

CREATING A PIVOT TABLE
Below is a brief description of each of the shelves in the Pivot tab.• Columns: Distinct data values present in the columns dropped in
this shelf will appear as the column headers of your pivot table. You can also have multiple columns dropped in this shelf for summarization. When you add multiple columns, they will be displayed as categorized layers (group within a group) of data vertically.
• Rows: Distinct data values present in the columns dropped in this shelf will appear as the row headers of your pivot table. You can also have multiple columns dropped in this shelf for summarization. When you add multiple columns, they will be displayed as categorized layers (group within a group) of data horizontally.
• Data: Values of the columns dropped in this shelf will appear in the body of the pivot table. Values will be summarized based on the summary function that you select. Also it will be categorized to provide the appropriate summary value for each cell corresponding to the row and column value in the table. You can also have multiple columns dropped in the Data shelf for summarization.

EXAMPLE: PIVOT TABLE
Lets use the following example: we want to create a pivot table showing the count of beneficiaries by Gender and Year of Birth.• For Columns we added “sex” from the beneficiary members table• For Rows we added “date_of_birth” and changed the function to
show Year• For Data we want to count the number of individual beneficiaries

DASHBOARDS
We have created a chart report and a pivot report. Lets put these two reports on a single page; we are going to create a Dashboard.
What is a Dashboard? A dashboard is a composition of multiple summary tables, charts, etc… that are accessible by a user without having to open each report separately.

CREATING A DASHBOARD
To create a Dashboard follow the steps below1. Click on “Explorer” tab2. Click on “New”3. Select “New Dashboard”

CREATING A DASHBOARD

To add report(s) to a Dashboard, drag and drop your report from the left side into the design area.
CREATING A DASHBOARD

To split columns into two sections click “Contract” option.
CREATING A DASHBOARD

If you want to add free text or an image, add it by using “Add Text” or the “Add Image” options from the toolbar
CREATING A DASHBOARD

You can also add “User Filter” options.To add User Filter for your dashboard click on “+Add User Filter” button
CREATING A DASHBOARD
To add a specific column just drag and drop this column into the “Filter” section

You can customize your filter by hovering your mouse over the filter element and clicking “edit”
CREATING A DASHBOARD

RELATIONAL DATA MODEL
Now that we imported data from iFormBuilder we can start building reports and charts but before we can start building reports we want to setup relationships between our tables.

RELATIONAL DATA MODEL
Why do we need to setup relationships between our tables?• Data in iFormBuilder is not stored in a flat format• We may want to relate Beneficiary Registration
Records with Services Delivery records

SETTING UP RELATIONSHIPS IN ZOHO REPORTS
Lets look at an example: we want to report on the members of a household. A household is composed of one or multiple member(s)
Located at
Household
House
hold
Mem
bers
Belong to

SETTING UP RELATIONSHIPS IN ZOHO REPORTS
• In a single Household you can have one or multiple member(s)
• The Parent_Record_ID informs you to which Household (Parent Table) the individual beneficiary (Child Table) belongs.
To join tables you will use “ID” from the parent table (in this example “Beneficiary & Household Registration”) and join this to “Parent_Record_ID” in the “Beneficiary Registration” subform (e.g. dependent) table.

SETTING UP RELATIONSHIPS IN ZOHO REPORTS
To setup relationships between tables in Zoho Reports follow the steps below:
1. Open the Child table first2. Click the “Edit Design” icon

SETTING UP RELATIONSHIPS IN ZOHO REPORTS
Change the data type for Parent_Record_ID column to “Lookup Column”
SETTING UP RELATIONSHIPS IN ZOHO REPORTS
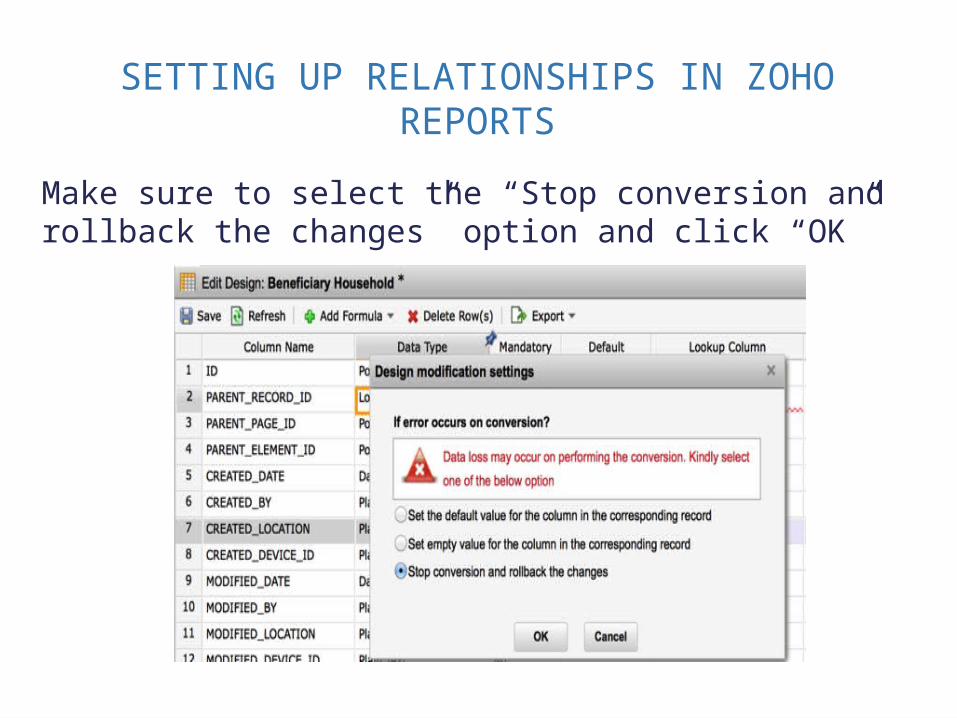
Make sure to select the “Stop conversion and rollback the changes” option and click “OK”

SETTING UP RELATIONSHIPS IN ZOHO REPORTS
Now select the Table and Column that this field is related to by double clicking under “Lookup Column”.
Beneficiary Household is related to the “Beneficiary & Household Registration” parent form.
SETTING UP RELATIONSHIPS IN ZOHO REPORTS
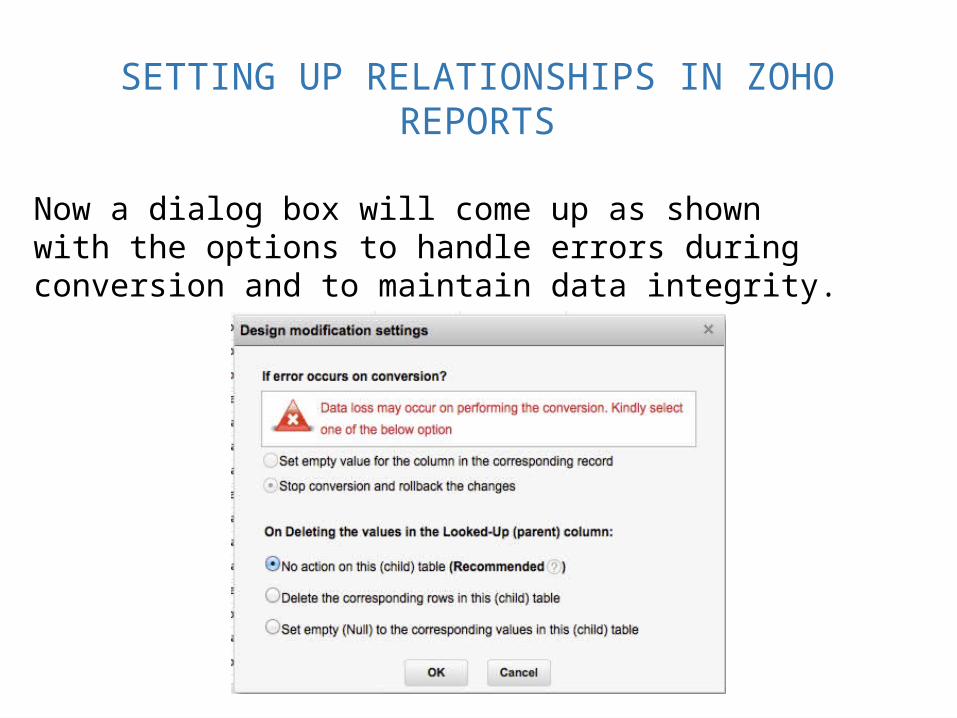
Now a dialog box will come up as shown with the options to handle errors during conversion and to maintain data integrity.
SETTING UP RELATIONSHIPS IN ZOHO REPORTS
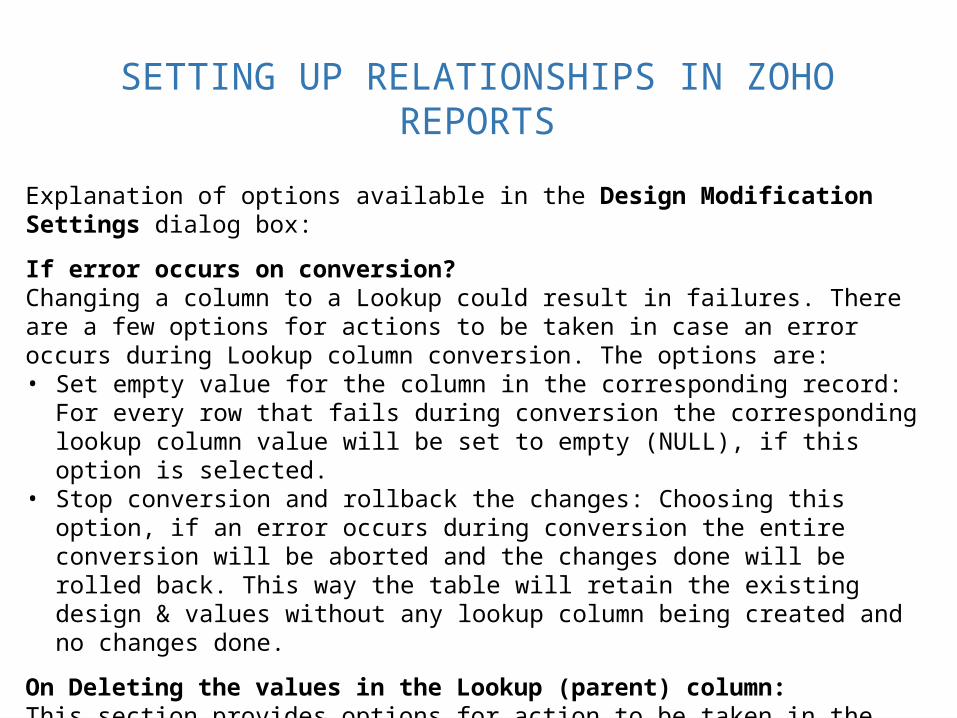
Explanation of options available in the Design Modification Settings dialog box:
If error occurs on conversion?Changing a column to a Lookup could result in failures. There are a few options for actions to be taken in case an error occurs during Lookup column conversion. The options are:• Set empty value for the column in the corresponding record: For every
row that fails during conversion the corresponding lookup column value will be set to empty (NULL), if this option is selected.
• Stop conversion and rollback the changes: Choosing this option, if an error occurs during conversion the entire conversion will be aborted and the changes done will be rolled back. This way the table will retain the existing design & values without any lookup column being created and no changes done.
On Deleting the values in the Lookup (parent) column:This section provides options for action to be taken in the child table (table in which you define the lookup) when a record is deleted in the Parent table (the table which you are looking up).

SETTING UP RELATIONSHIPS IN ZOHO REPORTS
After you set relationships in your table click on the “Save” button.

SETTING UP RELATIONSHIPS IN ZOHO REPORTS
Once the relationship between parent and child table has been established, the contents of both tables should available for analysis when a new chart or table is built.

PRACTICE: IN SMALL GROUPS OR INDIVIDUALLY
Create a dashboard with the following information, with branding for CAFOD and Caritas Europa
• How many support trips per disaster type, broken down by sex
• Breakdown of support trips by region
• # of participants by sector, with the ability to filter by favorite color