Embed Size (px)
Citation preview
Hands-On LabIntroduction to Web Performance and Load Testing with Visual Studio Ultimate 2013Lab version: 12.0.30723.00 Update 3
Last updated: 9/10/2014
CONTENTS
OVERVIEW................................................................................................................................................. 3
EXERCISE 1: CREATING WEB PERFORMANCE TESTS........................................................................3
EXERCISE 2: LOAD TESTING.................................................................................................................18
EXERCISE 3: EXECUTING & ANALYZING LOAD TESTS.....................................................................33
Overview
In this lab, you will be introduced to the web performance and load testing capabilities provided in Visual Studio Ultimate 2013. You will walk through a scenario using a fictional online storefront where your goal is to model and analyze its performance with a number of simultaneous users. This will involve the definition of web performance tests that represent users browsing and ordering products, the definition of a load test based on the web performance tests, and finally the analysis of the load test results.
Prerequisites
In order to complete this lab you will need the Visual Studio 2013 virtual machine provided by Microsoft. For more information on acquiring and using this virtual machine, please see this blog post. Since this lab makes extensive use of computer resources, it is suggested that you provide as much RAM and CPU as you can provide the virtual machine.
Change log
For Update 3:
1. Screenshot updates as necessary, other minor edits
Exercises
This hands-on lab includes the following exercises:
1. Creating Web Performance Tests
2. Load Testing
3. Executing & Analyzing Load Tests
Estimated time to complete this lab: 60 minutes.
Exercise 1: Creating Web Performance Tests
In this exercise, you will setup and execute a basic Web performance test. This type of test generates HTTP requests and records expected responses while measuring response times and throughput.
1. Log in as Adam (VSALM\Adam). All user passwords are P2ssw0rd.
2. Launch Visual Studio 2013 from the taskbar.
3. Select File | New | Project… from the main menu.
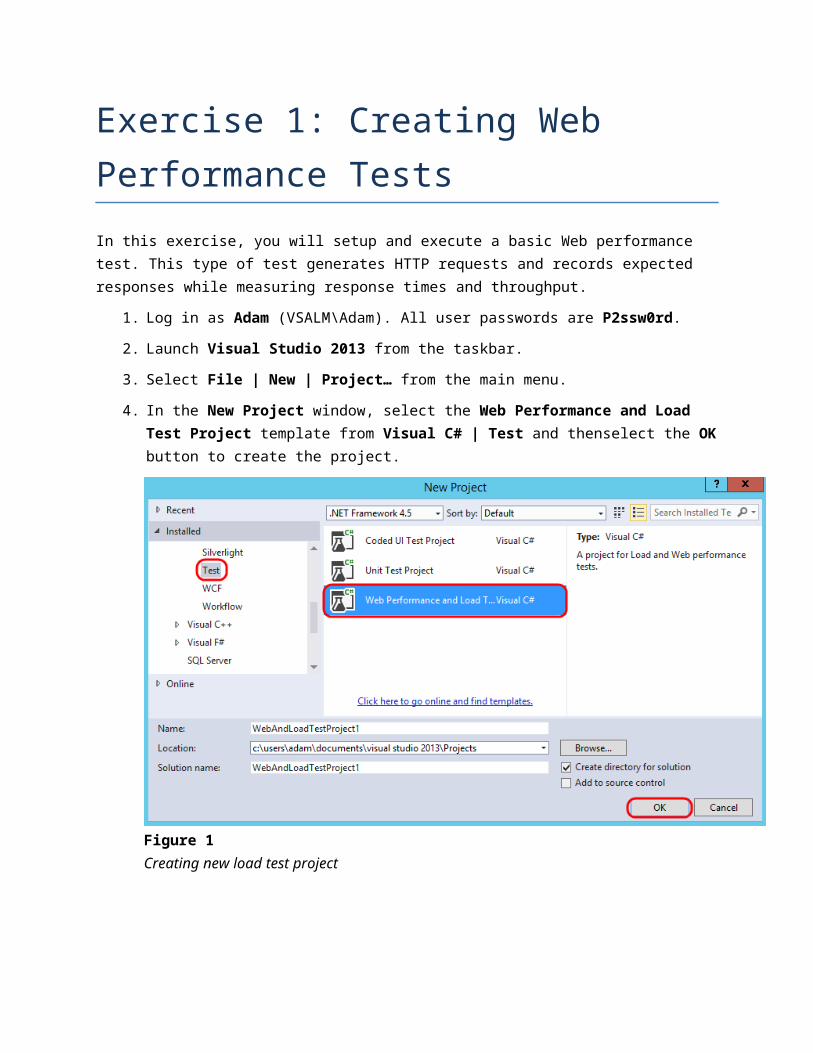
4. In the New Project window, select the Web Performance and Load Test Project template from Visual C# | Test and thenselect the OK button to create the project.
Figure 1Creating new load test project
5. The new web and load test project is created with default test settings and a single web test definition file named WebTest1.webtest. Select the Add Recording button at the top of the Web Performance Test Editor to start recording.
Figure 2Starting the test recorder
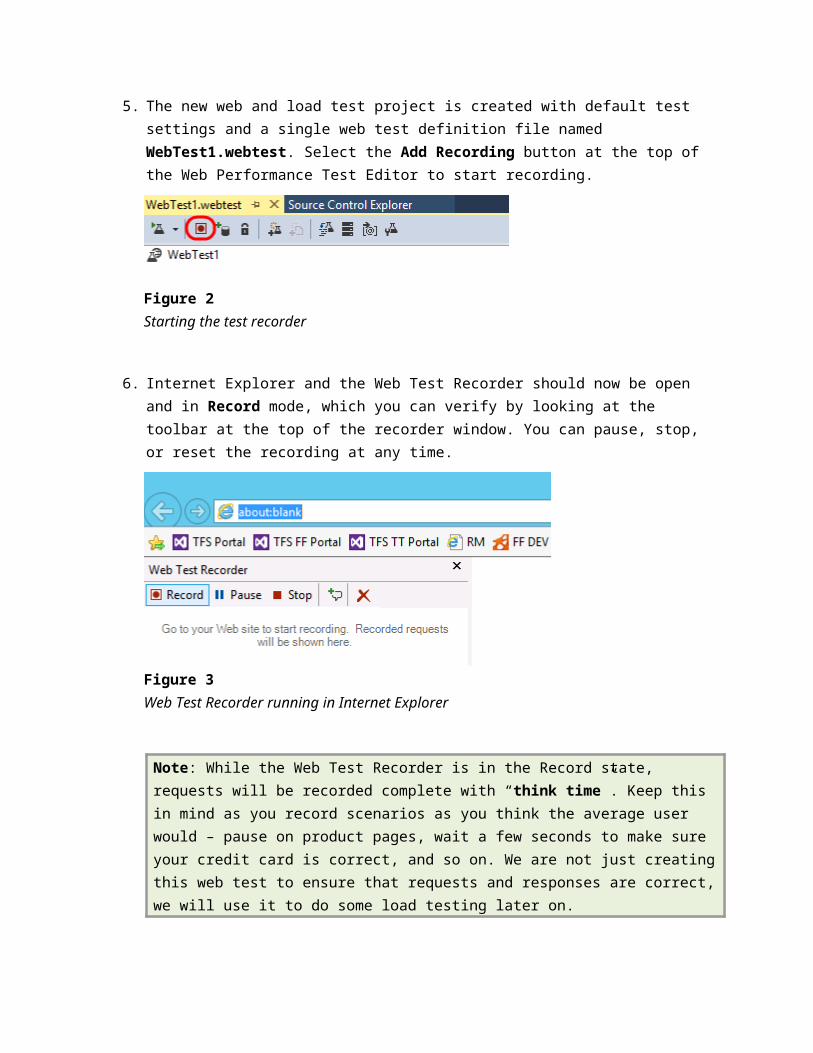
6. Internet Explorer and the Web Test Recorder should now be open and in Record mode, which you can verify by looking at the toolbar at the top of the recorder window. You can pause, stop, or reset the recording at any time.
Figure 3Web Test Recorder running in Internet Explorer
Note: While the Web Test Recorder is in the Record state, requests will be recorded complete with “think time”. Keep this in mind as you record scenarios as you think the average user would – pause on product pages, wait a few seconds to make sure your credit card is correct, and so on. We are not just creating this web test to ensure that requests and responses are correct, we will use it to do some load testing later on.
7. In the next few steps, we will play the part of a customer browsing the site by clicking on a few products and drilling into product details. The goal here is to create a profile that represents the typical browsing scenario for the site for a single user.
8. In Internet Explorer, click on the Tailspin Toys button from the favorites bar to launch the Tailspin Toys website. Note that the request is logged in the test recorder.
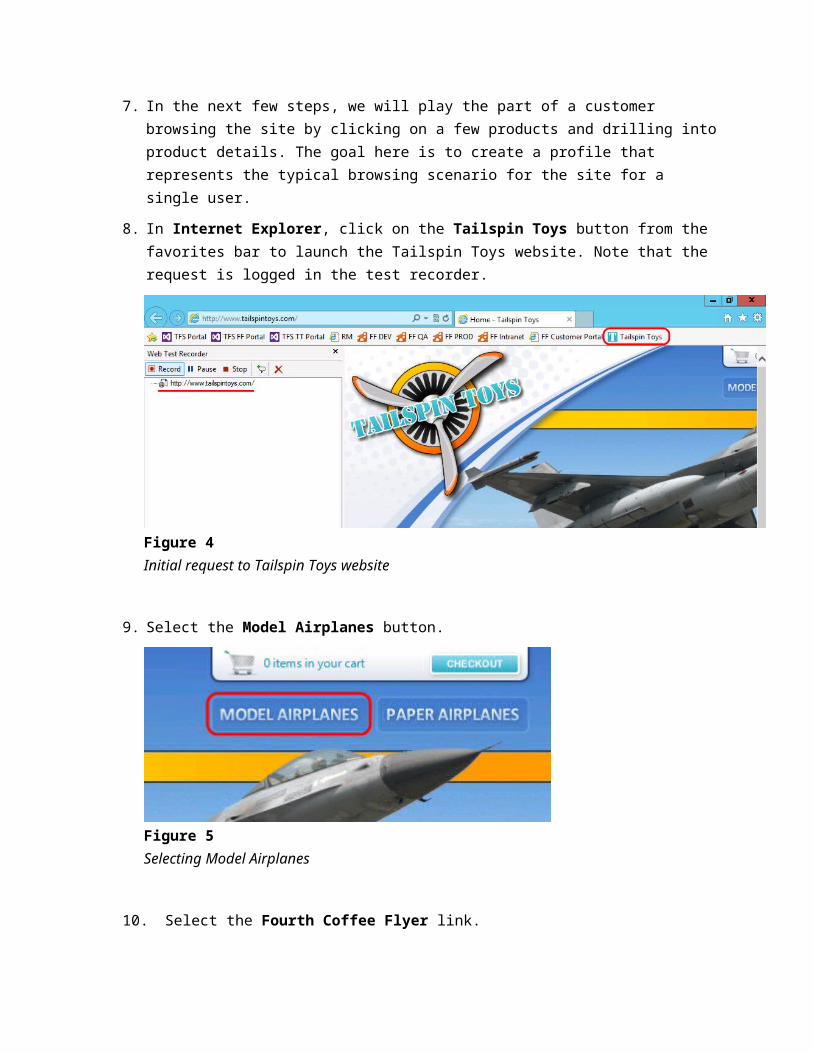
Figure 4Initial request to Tailspin Toys website
9. Select the Model Airplanes button.
Figure 5Selecting Model Airplanes
10. Select the Fourth Coffee Flyer link.
Figure 6Selecting the Fourth Coffee Flyer
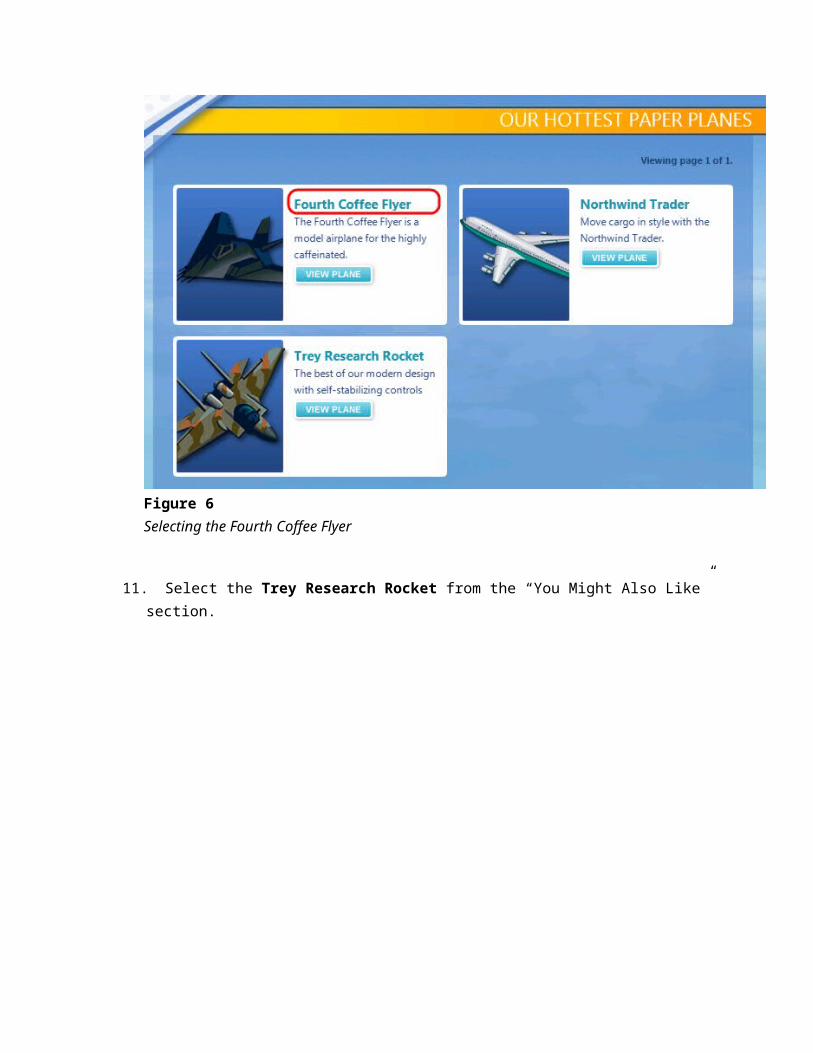
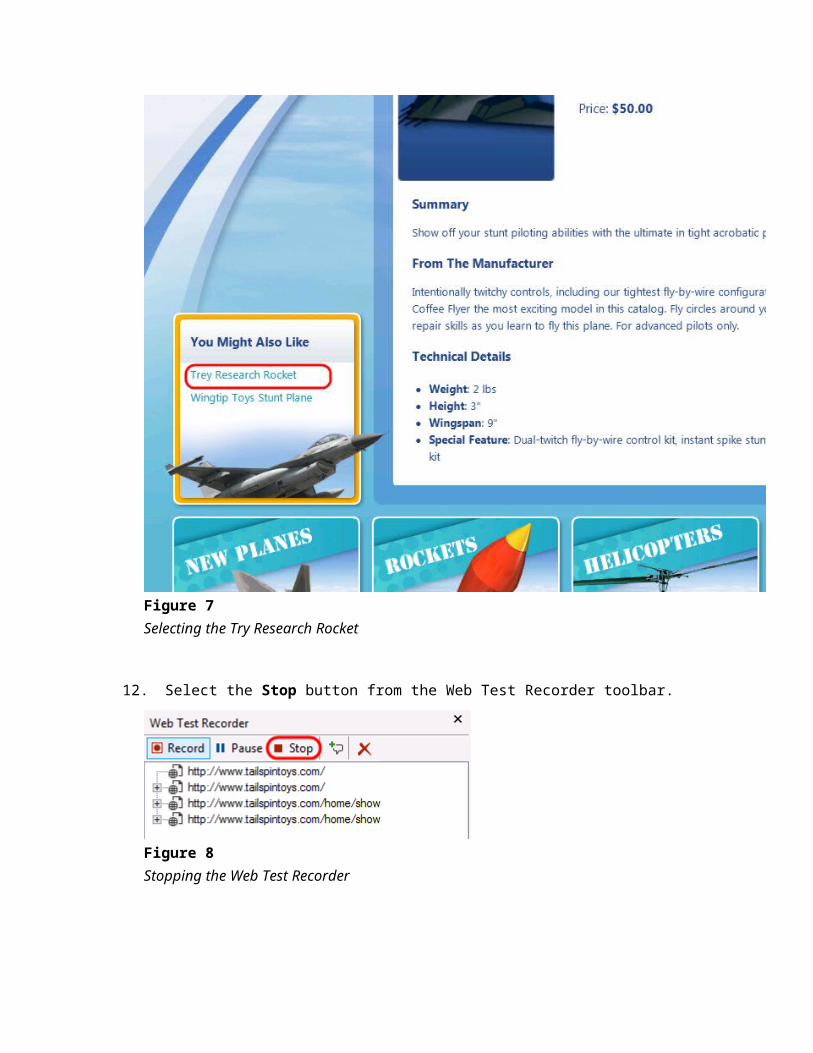
11. Select the Trey Research Rocket from the “You Might Also Like” section.
Figure 7Selecting the Try Research Rocket
12. Select the Stop button from the Web Test Recorder toolbar.
Figure 8Stopping the Web Test Recorder
13. Once the Web Test Recorder stops recording and returns to Visual Studio, two tasks will commence:
◦ Dynamic parameters that could not be identified and extracted during the recording will be identified. Examples of dynamic parameters include cookie values, ASP.NET view state, query string parameters, and post parameters. Extracting dynamic parameters when they are first used will allow the test to be run at any time in the future and therefore we will be able to utilize them as part of a load test.
◦ The recorded web performance test will run and display results.
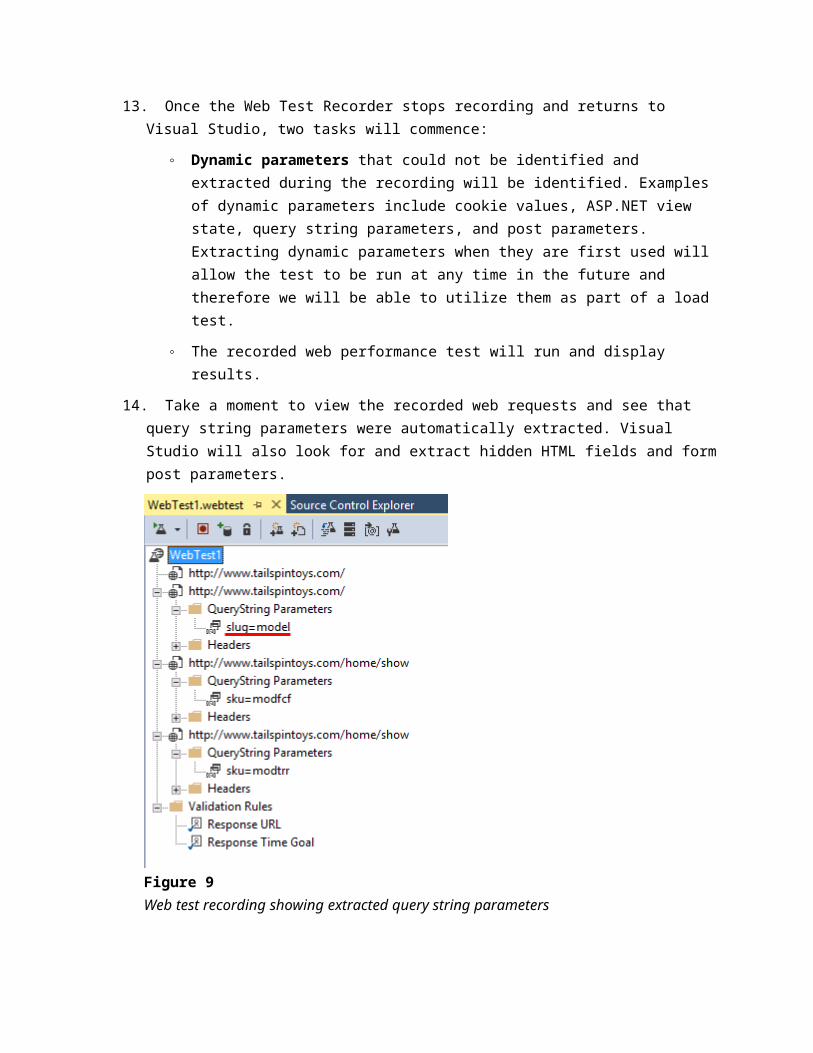
14. Take a moment to view the recorded web requests and see that query string parameters were automatically extracted. Visual Studio will also look for and extract hidden HTML fields and form post parameters.
Figure 9Web test recording showing extracted query string parameters
Note: There are two types of rules that can be applied to the response to each HTTP request, validation and extraction. Validation rules can be used to verify that pages have specific text, tags, attributes, or form fields on them. Extraction rules can be used to store results in the test context as name value pairs – and these rules can extract form fields, text, attributes, headers, regular expressions, and hidden fields.
15. Although it is out of the scope of this lab to dig into other Web performance test features, it is worth pointing a few of them out.
Other Web Performance Test Features
Convert a recorded Web performance test into a coded Web performance test
Add reporting names to clarify identification of Web requests
Customize test with artificial think times
Configure the permitted response time for a Web page
Add a data source to bind to HTTP requests (database, XML, CSV)
Customize execution by using loops, branching, and transactions
Configure credentials for test (basic or Integrated Windows)
16. In Solution Explorer, right-click on WebTest1.webtest and select Rename to change the name to “Browsing.webtest”. This will make it easier to keep track of the scenario that we recorded.
Figure 10Updated web test name
17. Let’s take a look at the recorded think times to make sure they are appropriate. Select the Set Request Details button from the toolbar to open the Request Details window.
Figure 11Location of Set Request Details button
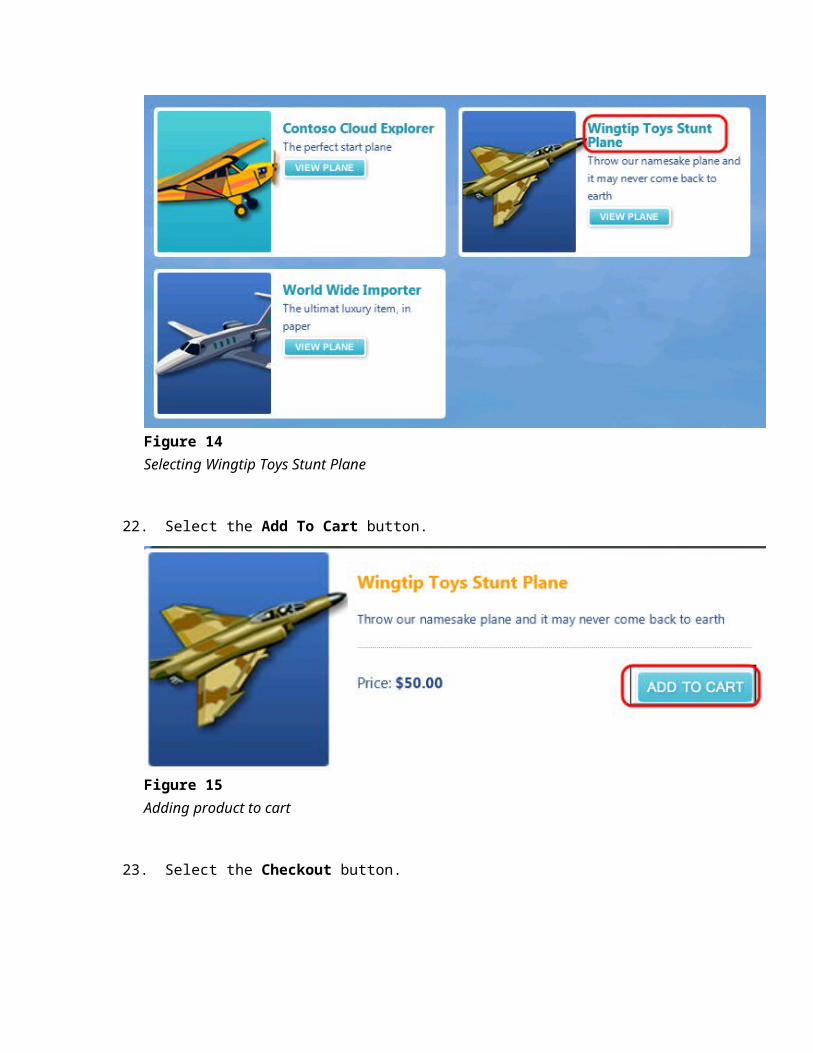
18. The Request Details window shows a grid containing all requests along with a reporting name, think time (in seconds), and response time goals (in seconds). For the purpose of this lab, make sure that the sum of all think times is no more than about 15 seconds. This will help ensure that we can get good results when we create a load test later on. Select the OK button to continue if you made any changes.
Figure 12Request Details window
19. Now let’s add in another web test to represent a customer that browses and purchases a product from the Tailspin Toys website. Select Project | Add Web Performance Test from the main menu in Visual Studio. We could have created a single web test that included both the browsing and buying scenario, but composing the tests in this fashion will make constructing a realistic load test easier later on.
20. Navigate to Tailspin Toys and select the Paper Airplanes button.
Figure 13Selecting Paper Airplanes
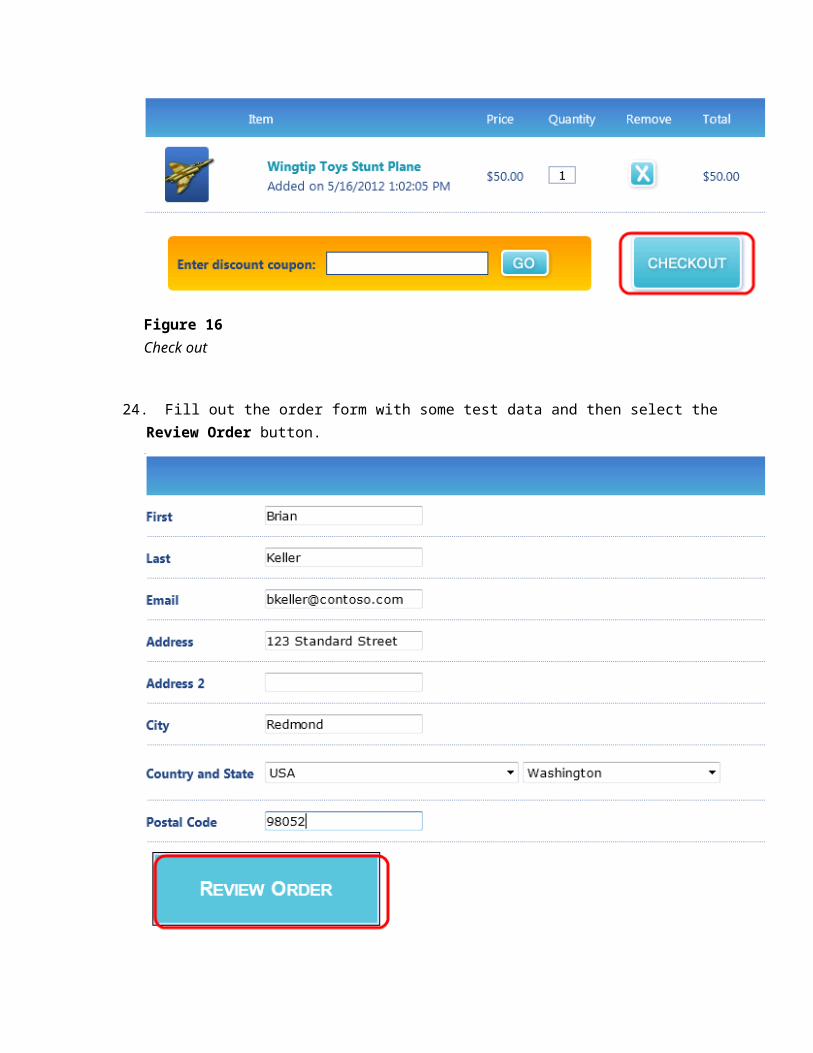
21. Select the Wingtip Toys Stunt Plane link.
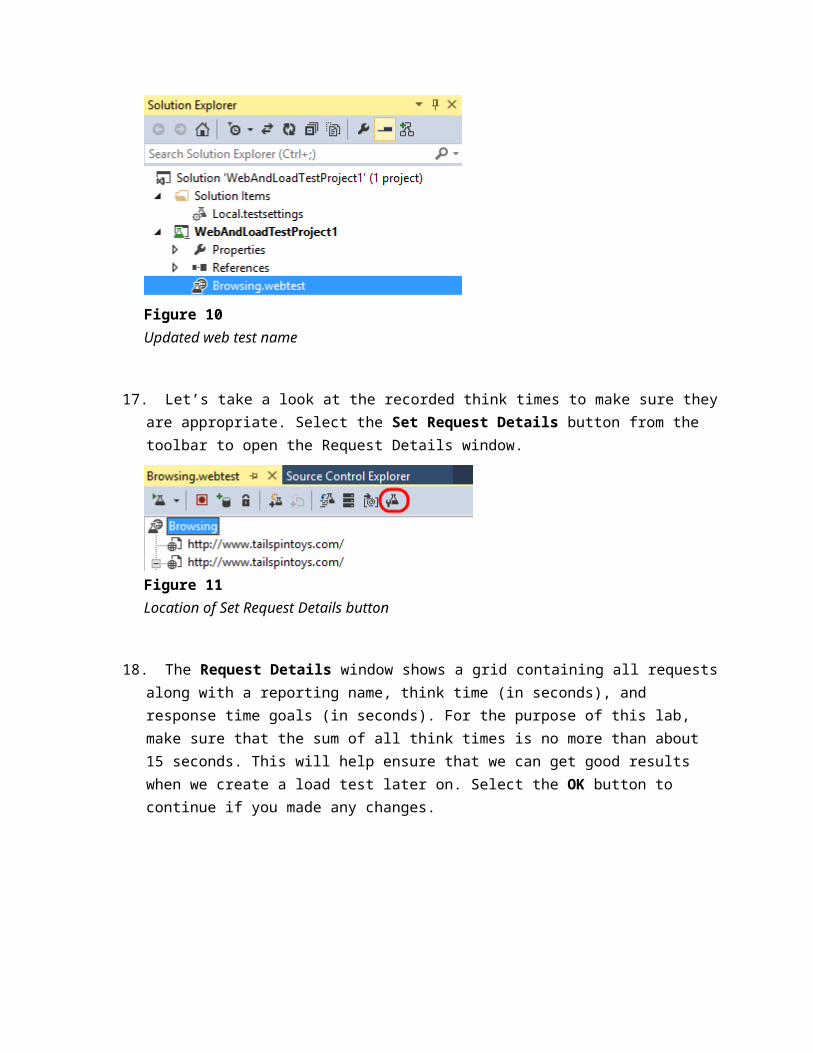
Figure 14Selecting Wingtip Toys Stunt Plane
22. Select the Add To Cart button.
Figure 15Adding product to cart
23. Select the Checkout button.
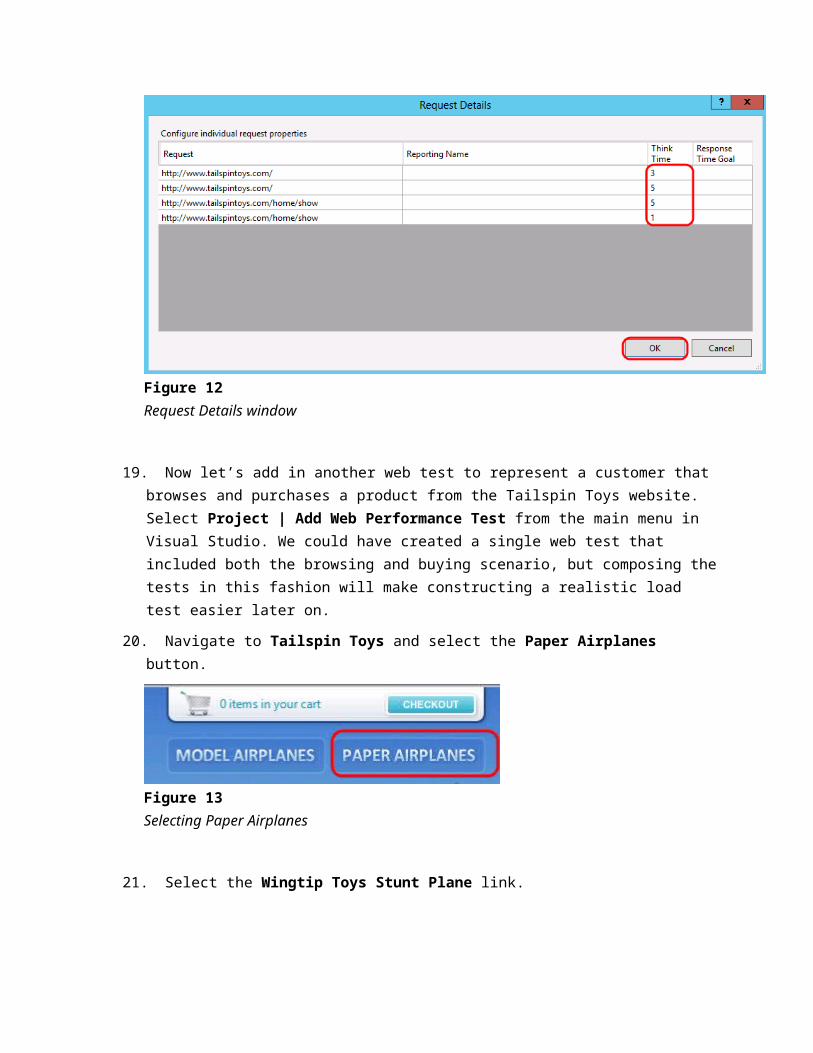
Figure 16Check out
24. Fill out the order form with some test data and then select the Review Order button.
Figure 17Entering address information
25. Select the Place Order button.
Figure 18Placing the order
26. After placing the order, you should see the receipt page. Select the Stop button in the Web Test Recorder to return to Visual Studio.
27. In Solution Explorer, right-click on WebTest1.webtest and select Rename to change the name to “Buying.webtest”.
Figure 19Updated web test name
28. Load the Test Results window and note that the test run that was automatically kicked off ended up failing. Double-click on the test run to view the test result details.
Figure 20Viewing test result details
29. The Test Result Details window shows the sequential list of HTTP requests, responses, some Visual Studio test context, and other details. Take a few minutes to familiarize yourself with the information available here.
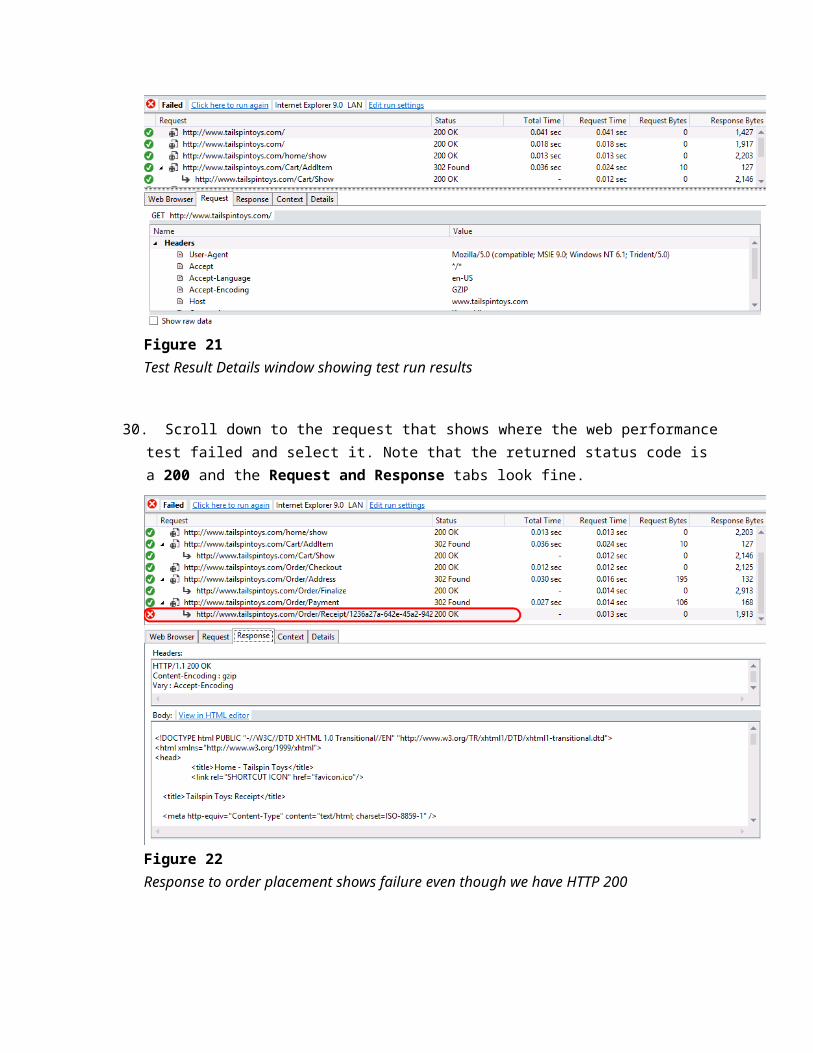
Figure 21Test Result Details window showing test run results
30. Scroll down to the request that shows where the web performance test failed and select it. Note that the returned status code is a 200 and the Request and Response tabs look fine.
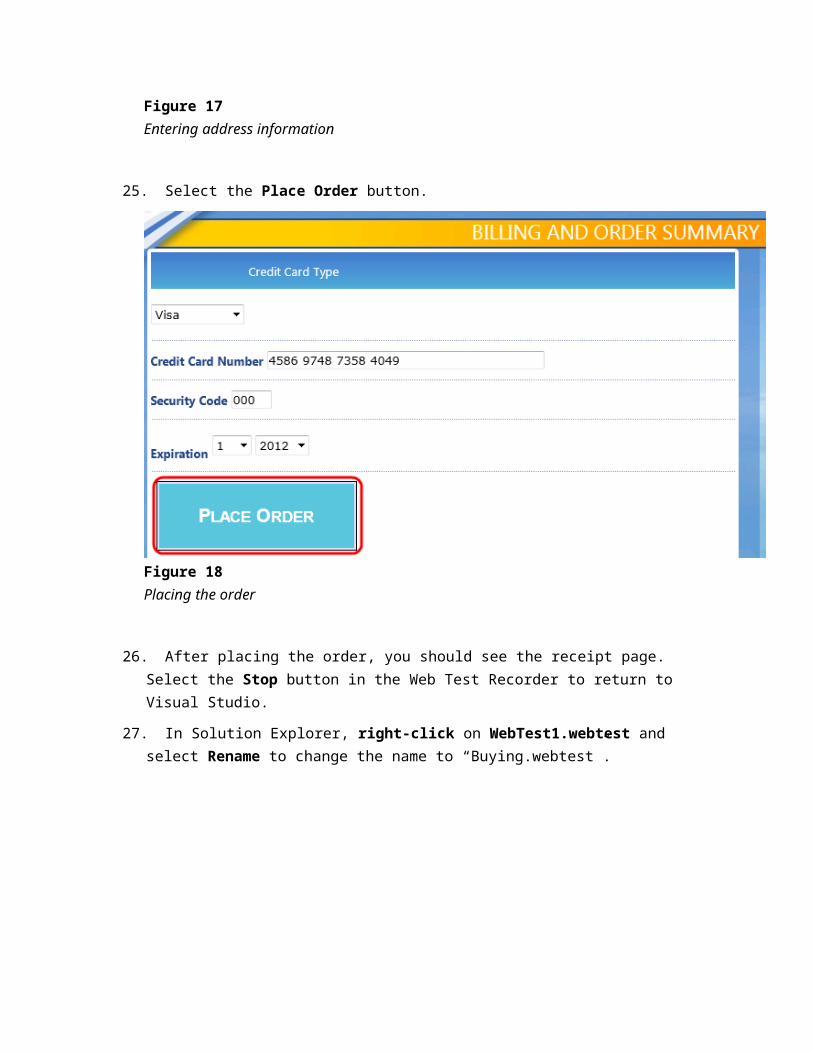
Figure 22Response to order placement shows failure even though we have HTTP 200
31. If you click on the Details tab, you will see that the test failed because a Response URL Validation rule was expecting to see the same response URL that was recorded during the Web Test definition (and that included a unique order number).
Figure 23Details tab showing reason for failure
32. Close the test result details window to return to the Buying web test in the editor.
33. Now that we understand why the web test failed, we can make a modification so that it will succeed and still give us a good test representing a user browsing for and ordering a product. Scroll down to the Validation Rules node and location the Response URL validation rule.
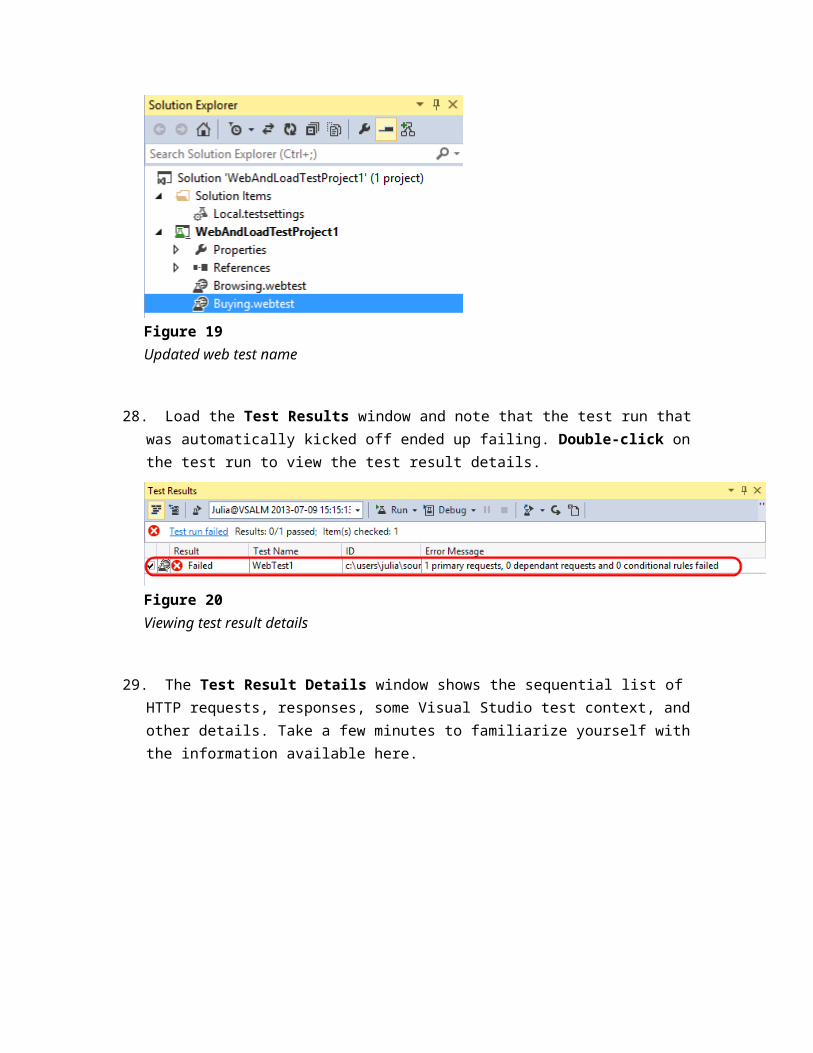
Figure 24Location of Response URL validation rule
34. Right-click on the Response URL and select the Delete option.
Figure 25Deleting the Response URL validation rule
35. Before we verify that removing the Response URL validation rule fixed the problem, let’s take a look at the recorded think times to make sure they are appropriate. Select the Set Request Details button from the toolbar to open the Request Details window.
Figure 26
Location of Set Request Details button
36. For the purpose of this lab, make sure that the sum of all think times are no more than about 30 seconds. This will help ensure that we can get good results when we create a load test later on. Select the OK button to continue if you made any changes.
Figure 27Request Details window
37. Run the Buying web test again to make sure that it passes.
Figure 28Location of Run Test button
Note: By default, web performance tests will run without taking into consideration think times, although it can be configured in the test settings if desired.
38. The web test results should now show green checkmarks next to each step.
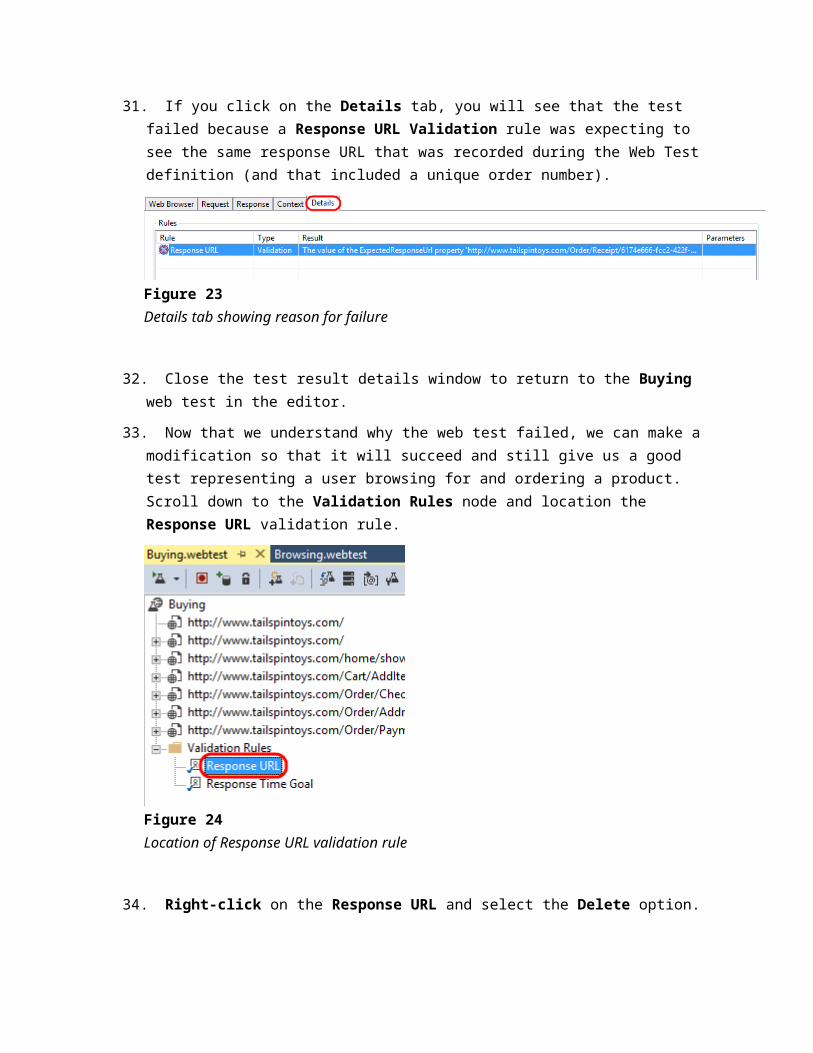
Figure 29All web test requests passed
39. Close the test results window.
Exercise 2: Load Testing
In this exercise, you will use the web performance tests that you created in the previous exercise as the basis of a load test. Building one or more web performance tests that accurately reflect a user scenario is critical to the foundation of a useful load test. To create a load test we will define user load, specify the web performance tests to use, the type of network and browser simulation to use, and the performance counters and other metrics that we want to collect for the duration of the test.
1. Select Project | Add Load Test from the main menu in Visual Studio.
2. In the New Load Test Wizard, select the Next button to start defining the load test scenario.
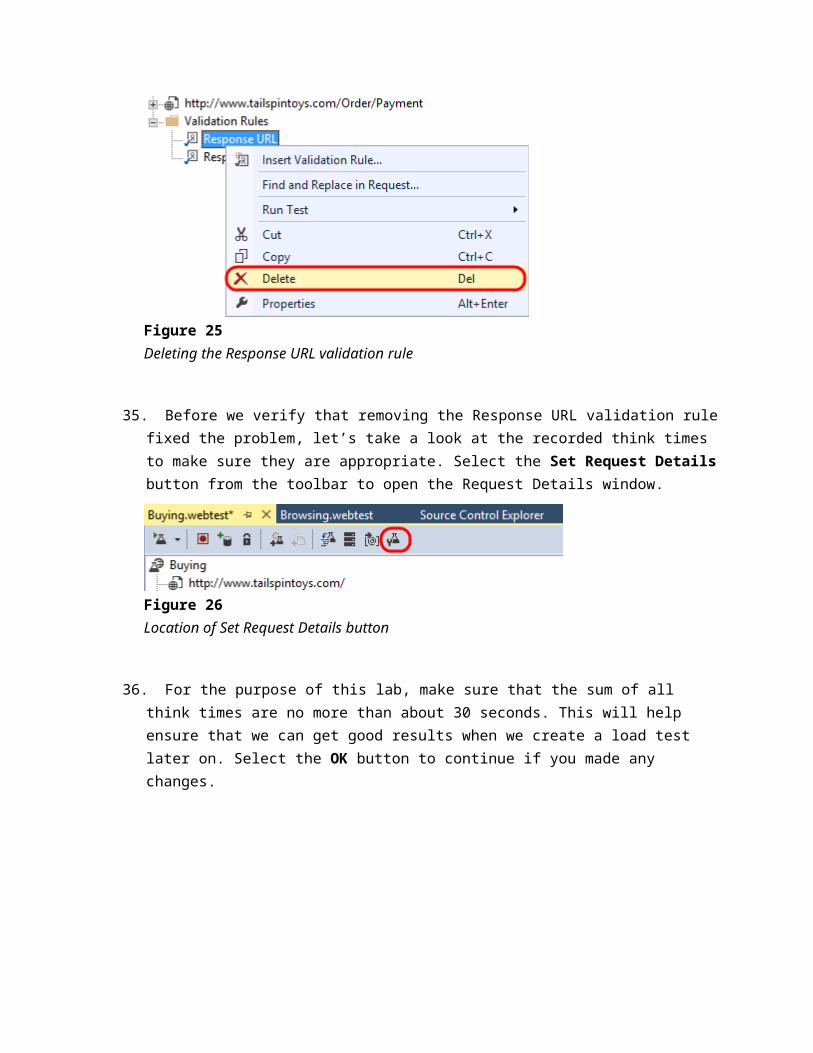
Figure 30New Load Test Wizard walks you through common setup options
3. Enter a name for the scenario like “BrowseAndOrderProduct” but leave the default think time profile in place. The default uses the think times of the web performance tests as a median value, with a normal distribution used to generate some variation. The goal is a more realistic generation of load on the web site.
4. Click the Next button to continue on to the Load Pattern definition screen.
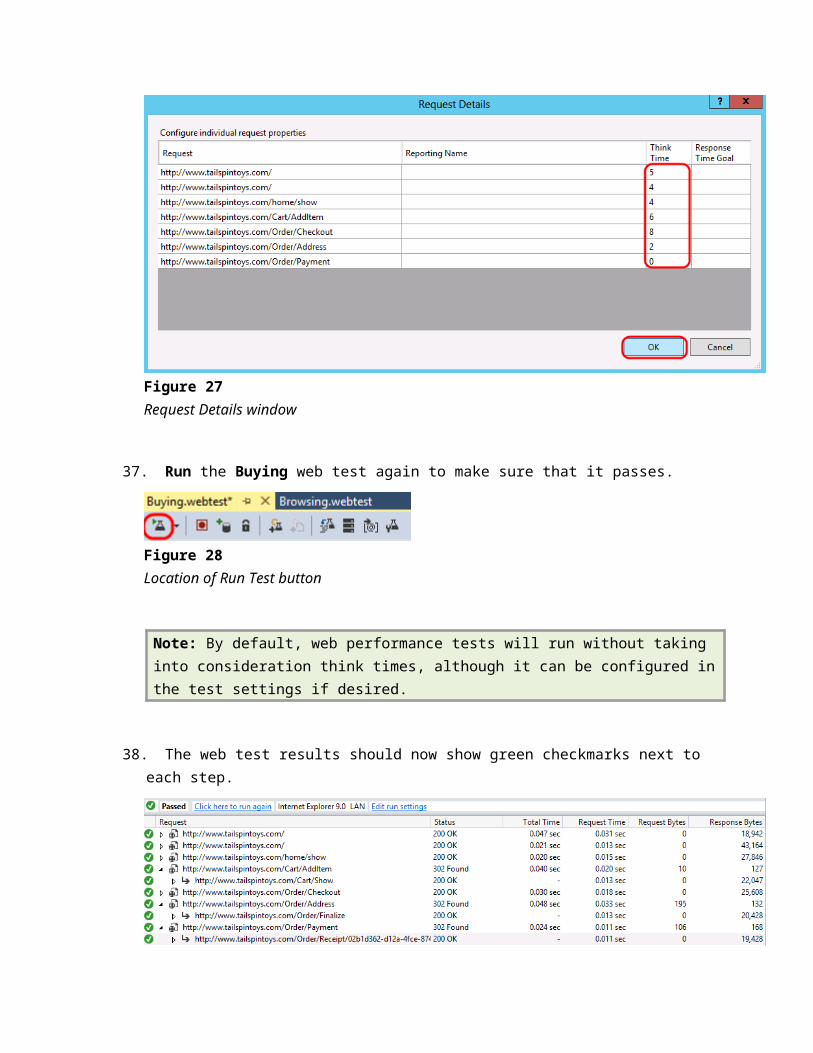
Figure 31Starting to add scenario definition for load test
5. Use the Constant load option (the default) for this load test, but change the User Count to 5 users since we are operating within a virtual machine. It is important to keep the simulated user count low enough such that the machine has enough resources to properly run IIS and the load test on the same machine. Depending upon the web site under test, using a step load to ramp up usage of the web site may be more realistic, but it also requires longer test runs.
Note: The limit on the number of virtual users that you can use in your load tests was removed in Visual Studio Ultimate 2012 (and above). You no longer have to purchase virtual user licenses to increase the number of virtual users that you can use in your load tests. The Visual Studio Ultimate Trial license, however, does limit you to 25 virtual users and only allows local tests.
6. Select the Next button to continue on to the Test Mix Model definition screen.
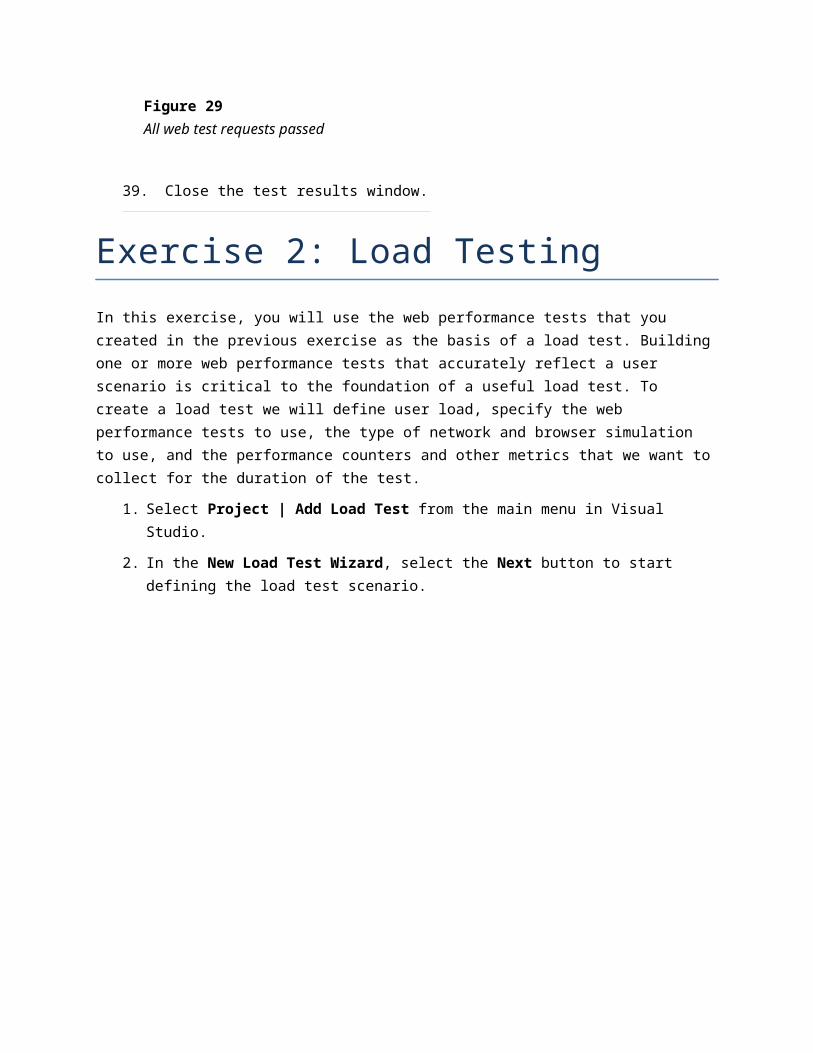
Figure 32Setting up a constant virtual user load to run for duration of load test
7. Read the description of each test mix model by clicking on it and viewing the description that appears on the right-hand side.
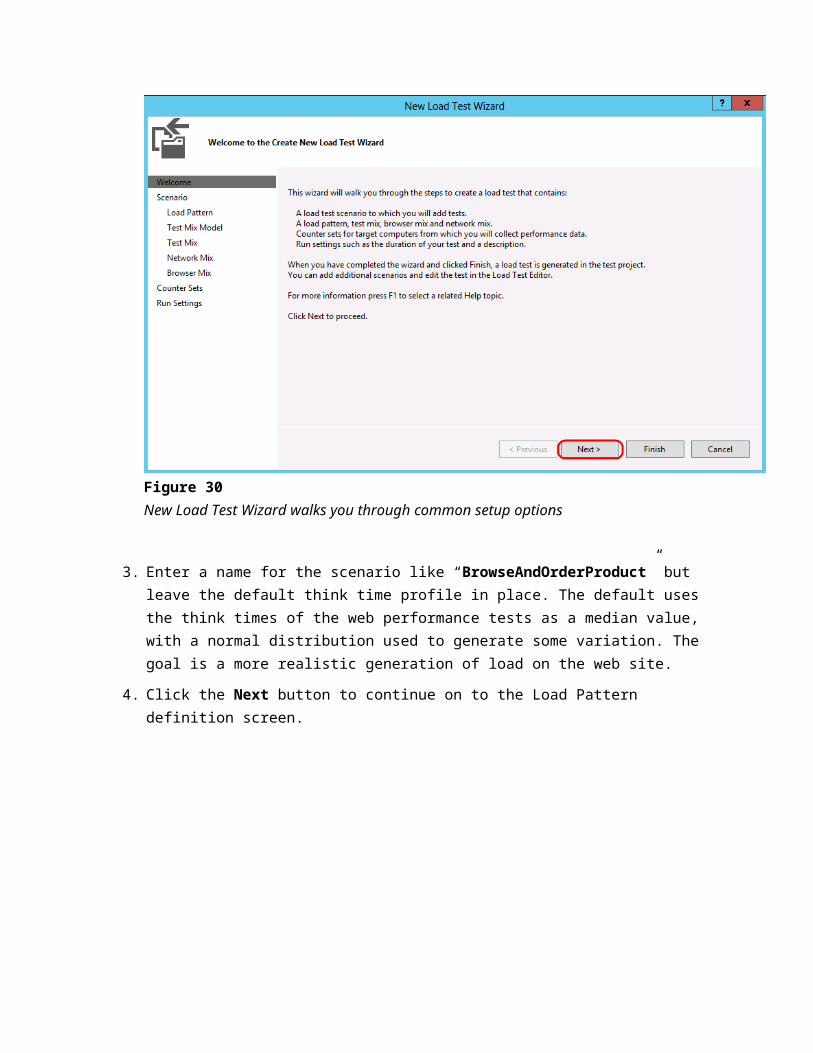
Figure 33Defining test mix model
8. Let’s say that our current production site give us some indication of the percentage of browsing users that end up making purchases. Select the first option that models the test mix based on the total number of tests and then select the Next button to continue on to the Test Mix screen.
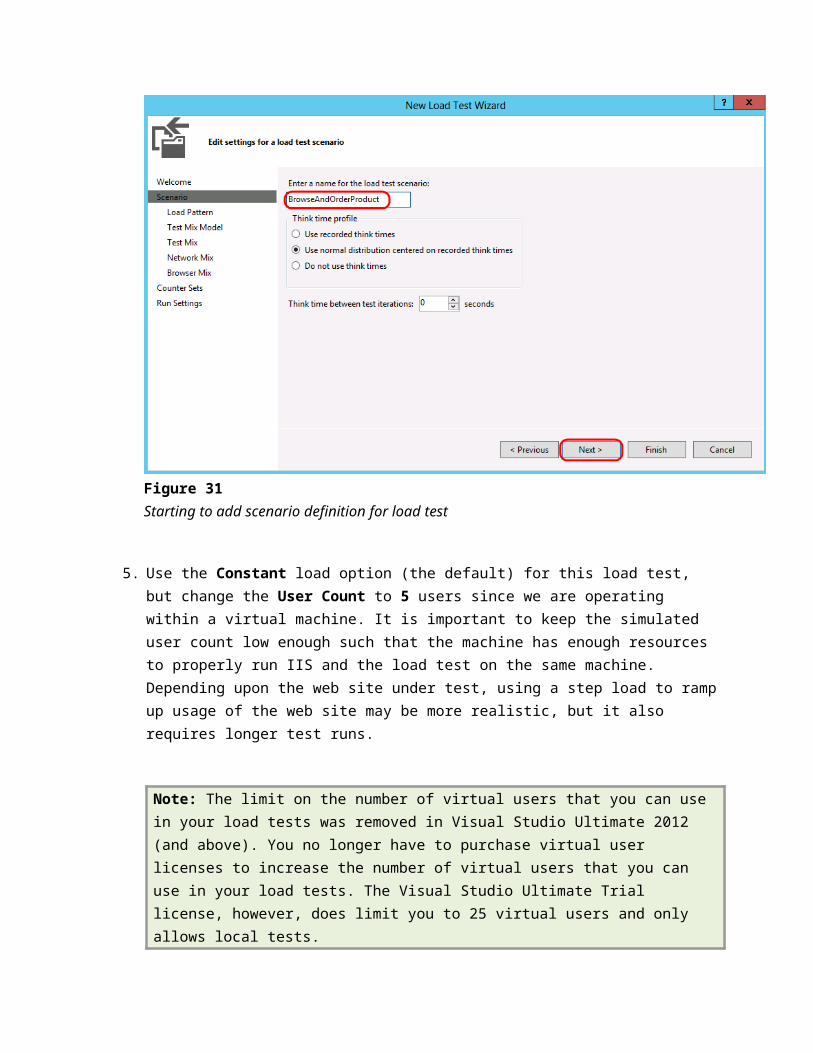
Figure 34Defining test mix model
9. Select the Add button to load the Add Test window.
Figure 35Adding tests to the mix
10. Select both tests, add them to the test mix, and then select OK.
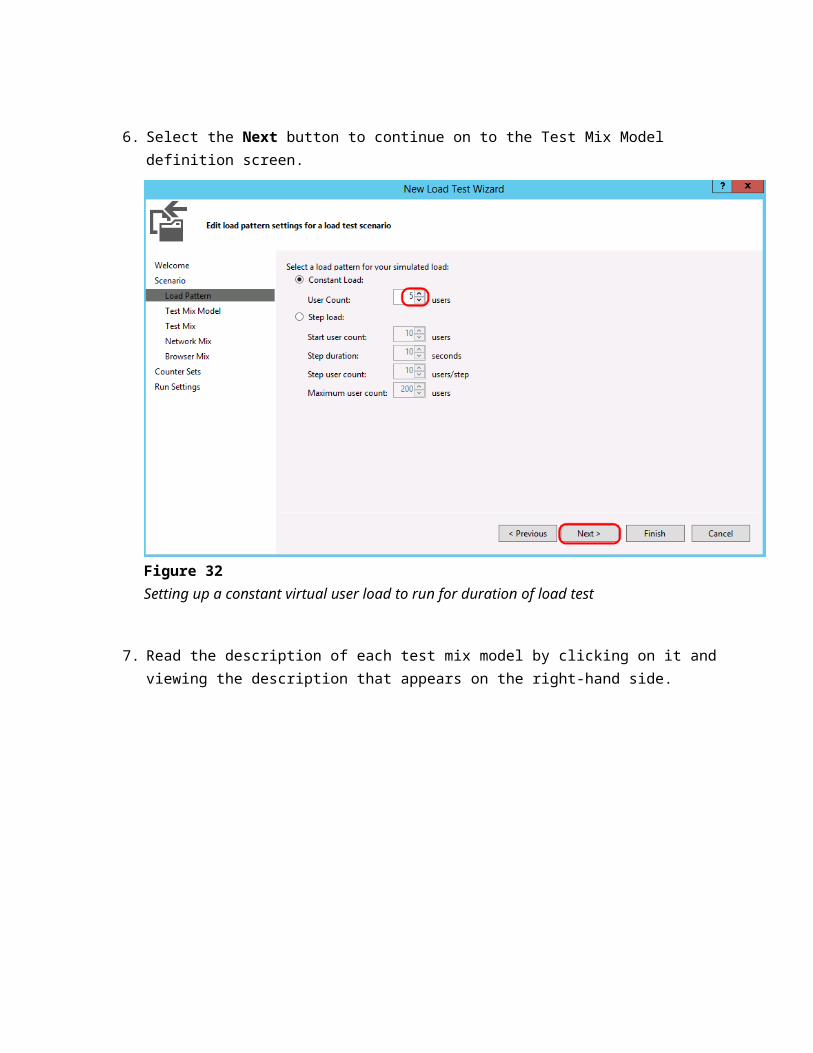
Figure 36Adding tests to the mix
Note: Load tests can include a mix of coded UI tests, web performance tests, and even other test types such as unit tests. It is important to note that for coded UI tests, you need one virtual or physical machine per user that you are simulating since it assumes that it has control over the entire user interface.
11. Let’s say that our production logs tell us that 25% of users browsing the site end up buying something. Change the Distribution to reflect this knowledge and then select the Next button to continue on to the Network Mix screen.
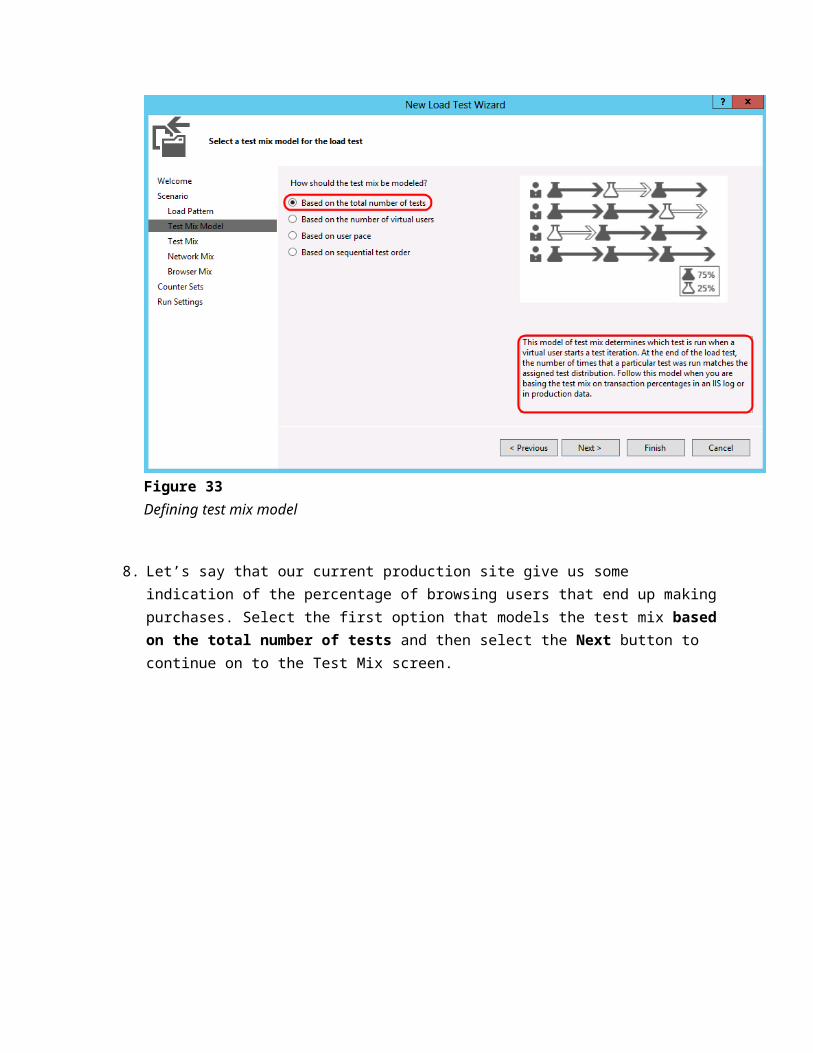
Figure 37Defining test mix
12. The Network Mix screen allows you to choose one or more network types and specify the distribution of those types across the tests to be executed by the virtual users. Select the Network Type dropdown to see the available options.
Figure 38Network Type options
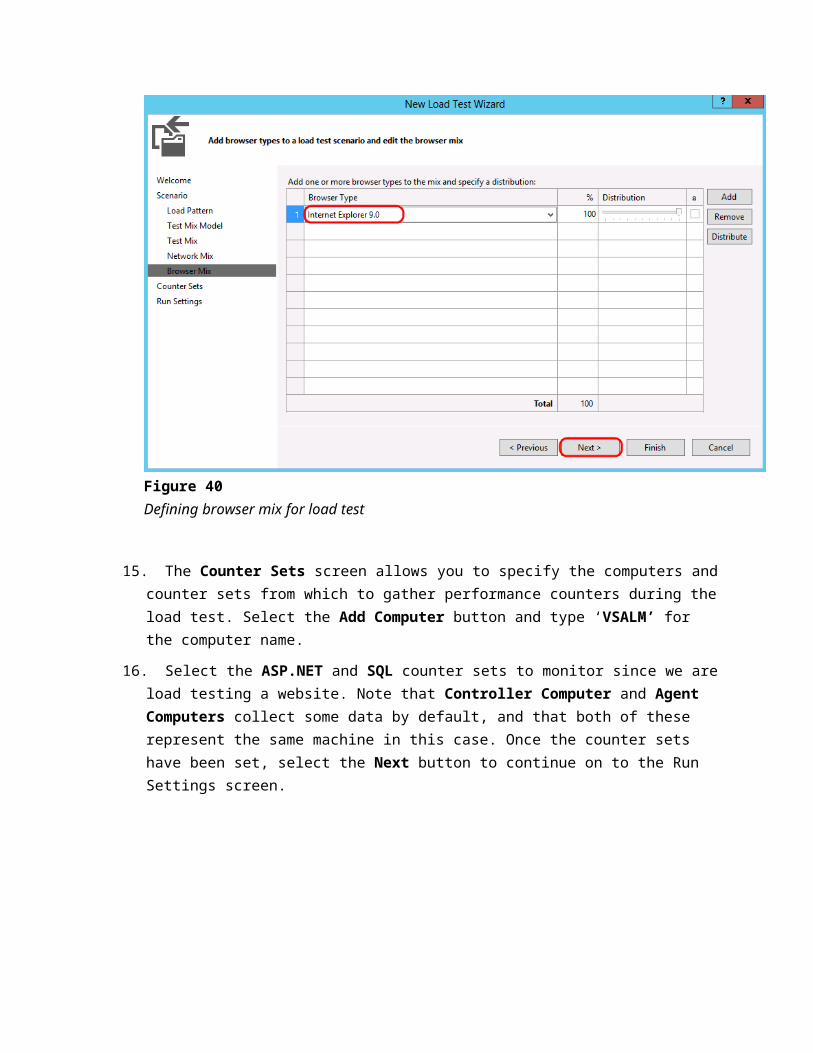
13. For the purpose of this lab, leave the default Network Type of LAN in place and select the Next button to continue on to the Browser Mix screen.
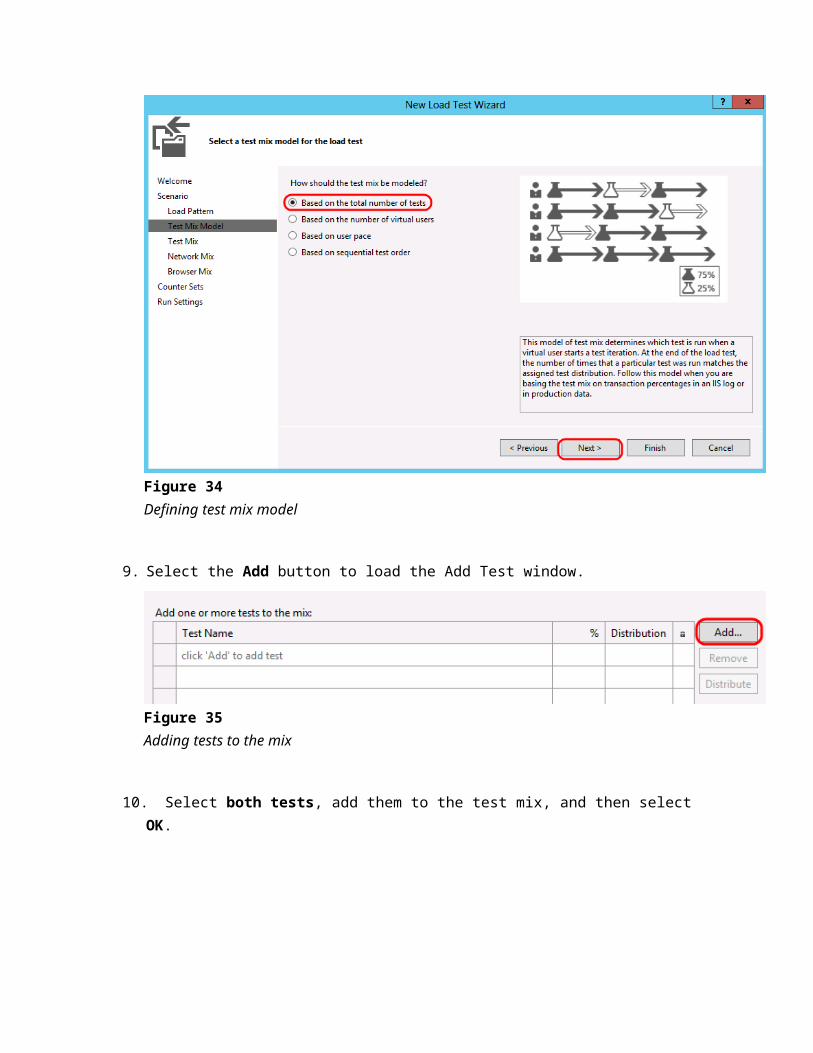
Figure 39Defining network mix for load test
Note: Network emulation will not work when operating within this virtual machine environment because the URL under test loops back to localhost.
14. The Browser Mix screen allows you to specify one or more browser types and specify the distribution of those types across the tests to be executed by the virtual users. Just like the network mix, this allows us to more realistically model how the users interact with the web site. For the purpose of this exercise, leave the default at 100% Internet Explorer 9.0 and select the Next button to continue on to the Counter Sets screen.
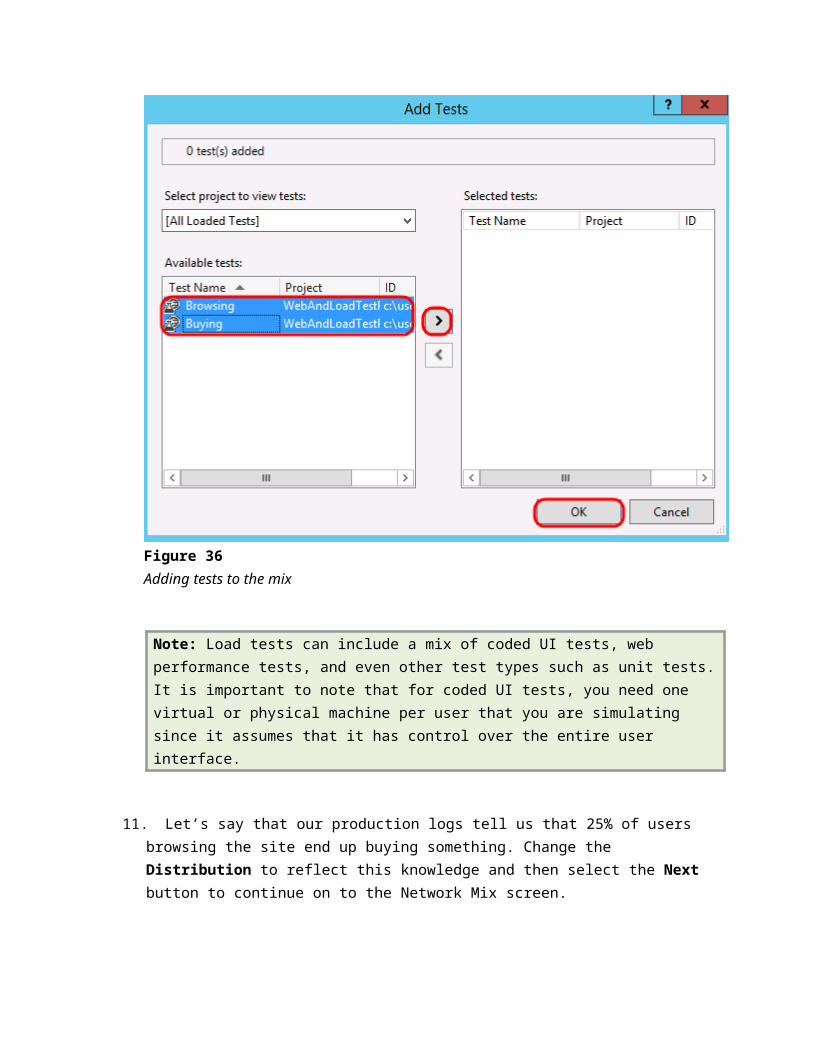
Figure 40Defining browser mix for load test
15. The Counter Sets screen allows you to specify the computers and counter sets from which to gather performance counters during the load test. Select the Add Computer button and type ‘VSALM’ for the computer name.
16. Select the ASP.NET and SQL counter sets to monitor since we are load testing a website. Note that Controller Computer and Agent Computers collect some data by default, and that both of these represent the same machine in this case. Once the counter sets have been set, select the Next button to continue on to the Run Settings screen.
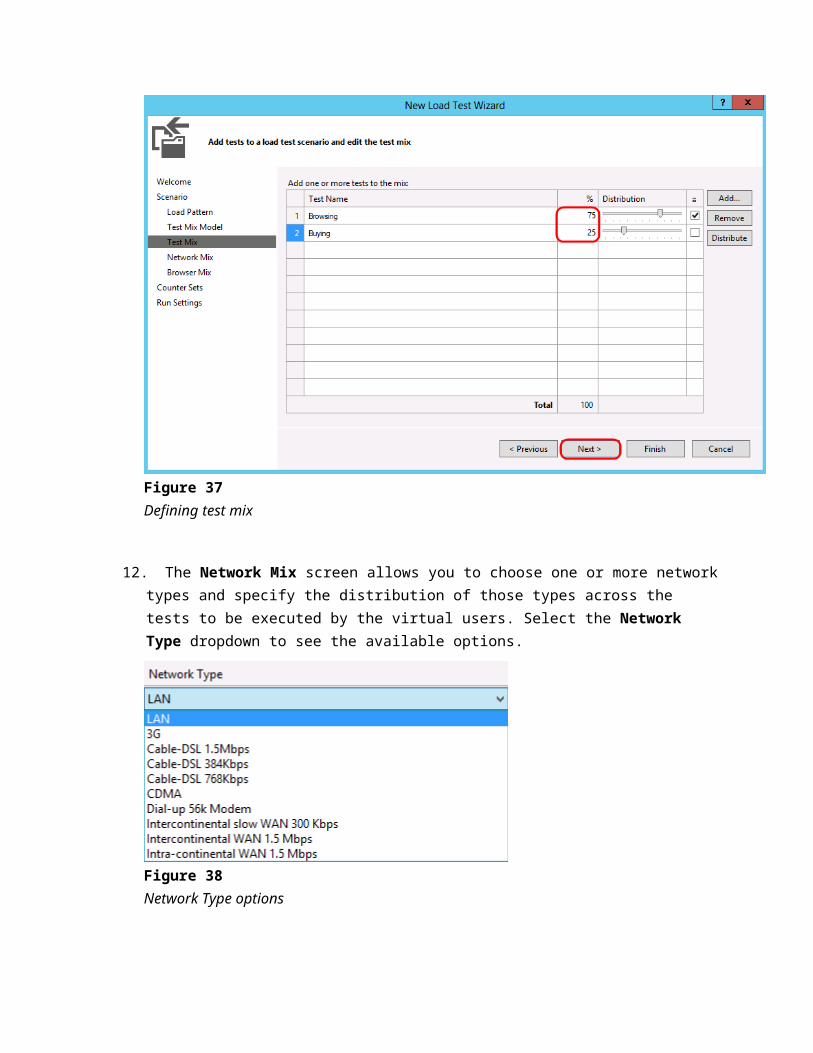
Figure 41Defining performance counter data to collect
Note: It is possible to modify or add counter sets to be used during load tests by working directly with the .CounterSet XML files located in the %programfiles(x86)\Microsoft Visual Studio 12.0\Common7\IDE\Templates\LoadTest\CounterSets directory. The LoadTest directory also contains network and browser definitions.
17. The Run Settings for a load test allow you to specify how long the test should run using either time duration or a specific number of test iterations. We will use a time duration, but change it from 10 minutes to 1 minute for demonstration purposes. The default sampling rate of 5 seconds is fine here, and it is a good choice in general for shorter test runs. If you want to run longer tests, consider sampling less often as it will generate a lot less data to store in the load test database.
18. Select the Finish button to save the load test configuration.
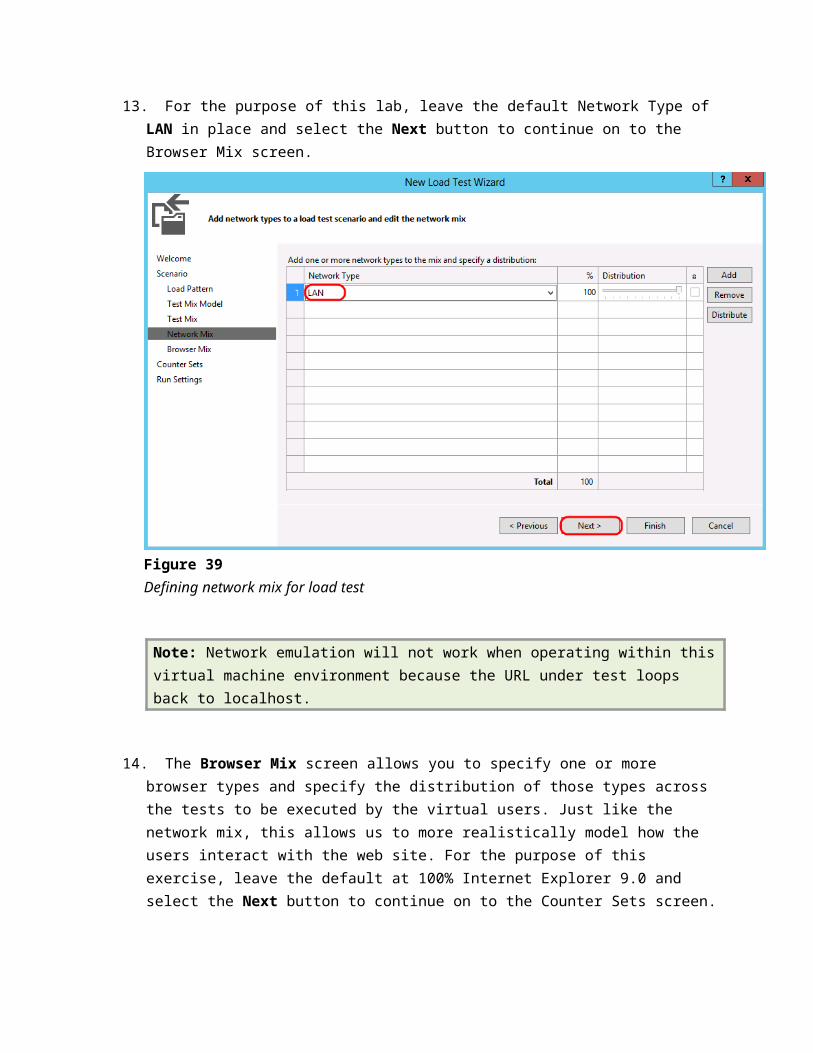
Figure 42Defining load test run settings
19. Let’s take a quick look at the test settings file. In Solution Explorer, double-click on the Local.testsettings file.
Figure 43Loading test settings
20. Note that the test settings are currently configured to run locally, but starting with Visual Studio 2013 Ultimate you can also perform test runs using Visual Studio Online.
Figure 44Load testing using Visual Studio Online
21. For this purposes of this lab we will run the test locally.
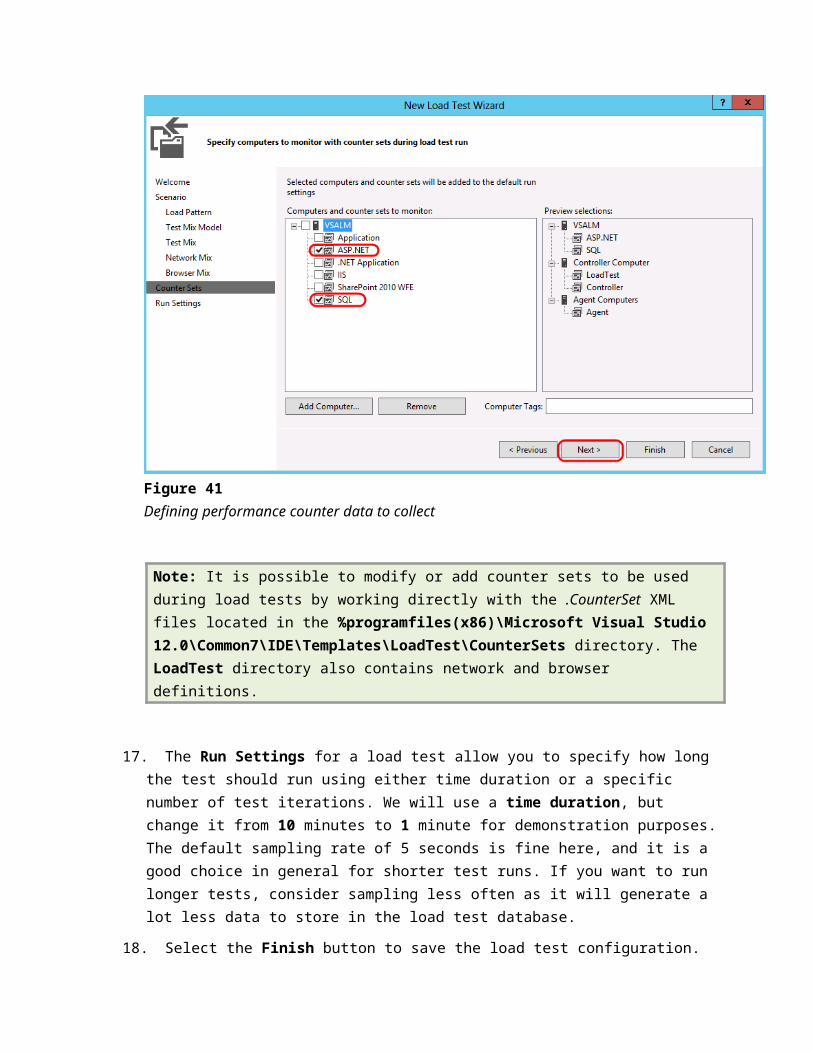
Figure 45Load testing locally
22. In the Test Settings window, select the Data and Diagnostics option to see the available adapters. Options include an ASP.NET Profiler, Event Log, IntelliTrace, Network Emulation, and more. No adapters are selected by default, in part because many of them have a significant impact on the machines under test and can generate a large amount of data to be stored over the course of long load tests.
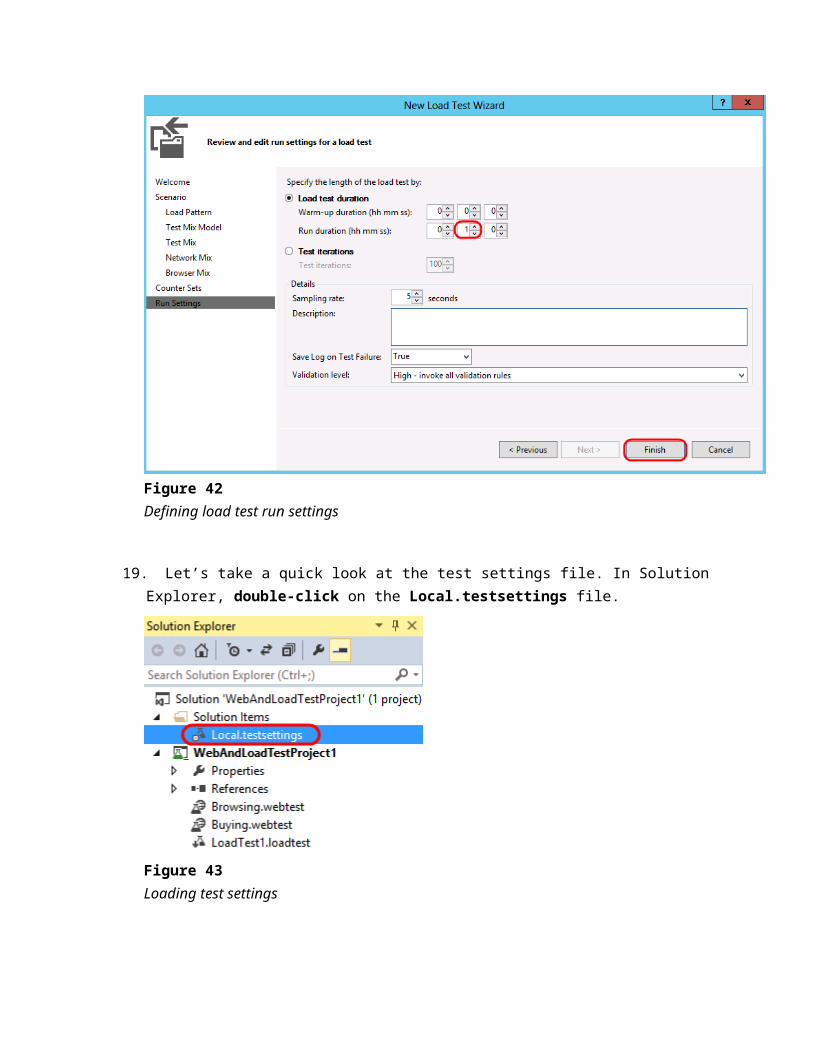
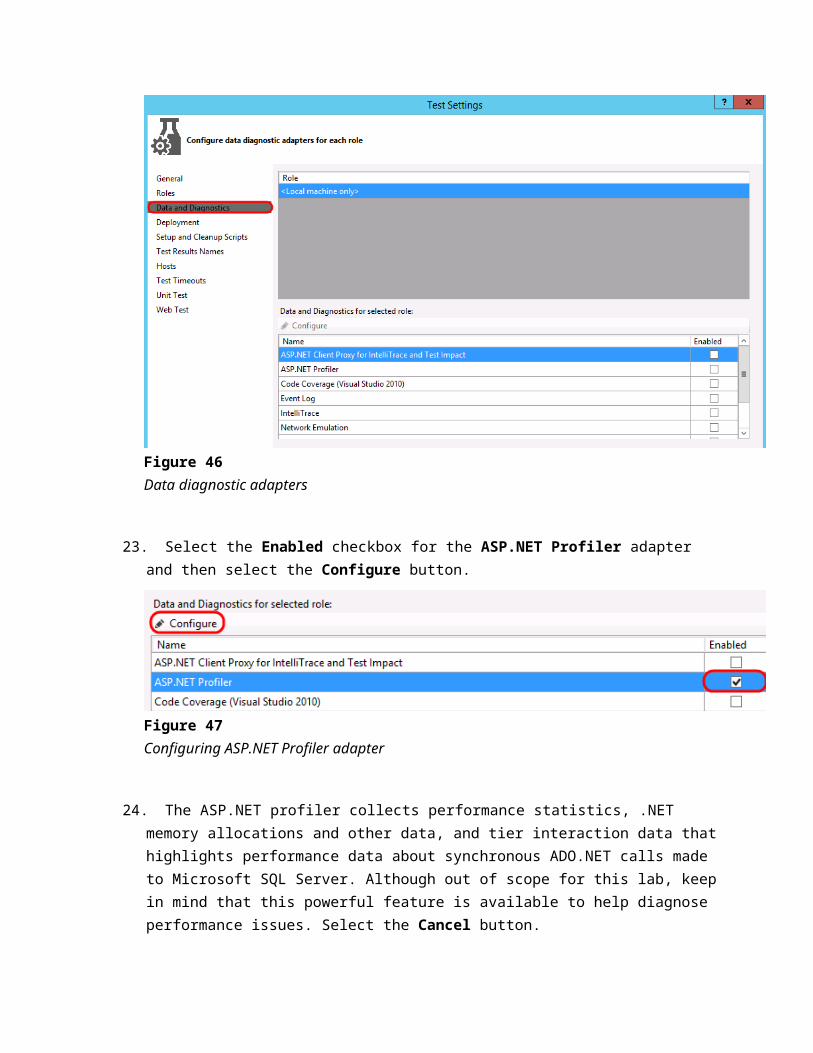
Figure 46Data diagnostic adapters
23. Select the Enabled checkbox for the ASP.NET Profiler adapter and then select the Configure button.
Figure 47Configuring ASP.NET Profiler adapter
24. The ASP.NET profiler collects performance statistics, .NET memory allocations and other data, and tier interaction data that highlights performance data about synchronous ADO.NET calls made to Microsoft SQL Server. Although out of scope for this lab, keep in mind that this powerful feature is available to help diagnose performance issues. Select the Cancel button.
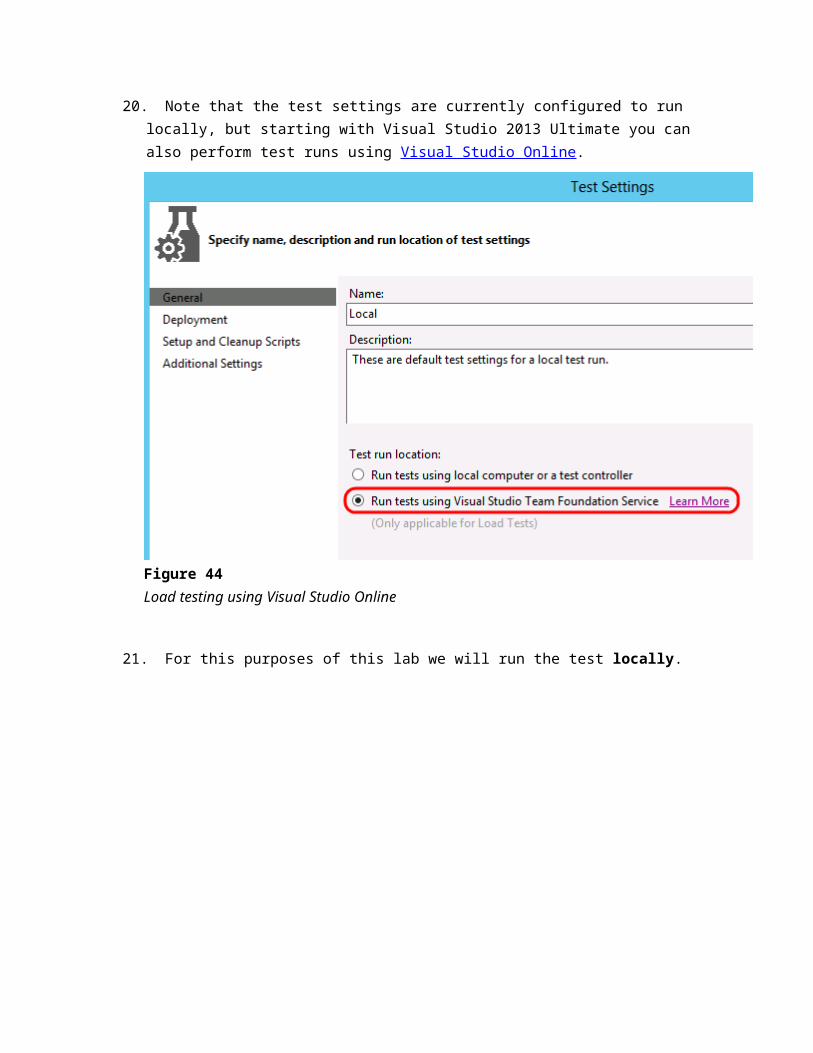
Figure 48ASP.NET Profiler defaults
Note: To learn more about the ASP.NET Profiler, see the documentation at:
http://msdn.microsoft.com/en-us/library/dd504817.aspx
25. Close the Test Settings window without saving changes to the settings.
Exercise 3: Executing & Analyzing Load Tests
In this exercise, you will execute the load test that you defined in the previous exercise and analyze the results.

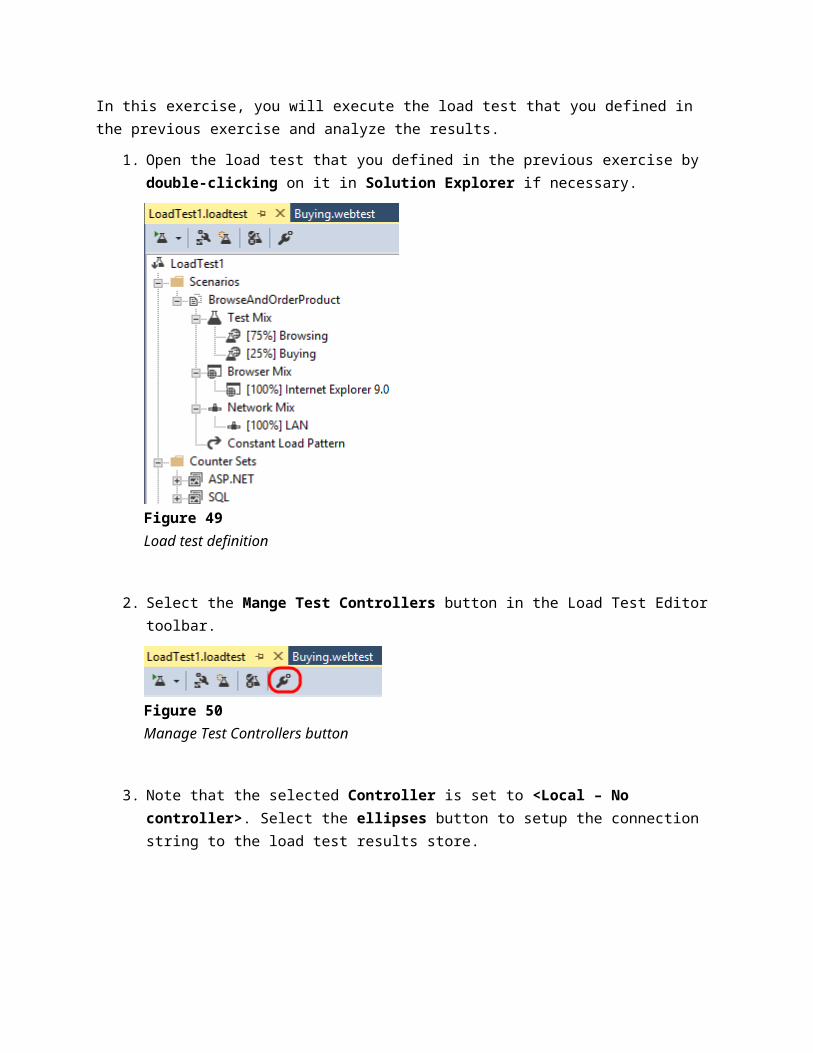
1. Open the load test that you defined in the previous exercise by double-clicking on it in Solution Explorer if necessary.
Figure 49Load test definition
2. Select the Mange Test Controllers button in the Load Test Editor toolbar.
Figure 50Manage Test Controllers button
3. Note that the selected Controller is set to <Local – No controller>. Select the ellipses button to setup the connection string to the load test results store.
Figure 51Manage Test Controller window
4. In the Connection Properties window use a Server Name of VSALM, use Windows Authentication, and use the default database name. Once you have the database connection properties in place, select the OK button to save.
Figure 52Setting connection properties to load test database for test controller
5. Select the Close button to exit out of the Manage Test Controller window.
6. Start the load test by selecting the Run Test button from the toolbar.
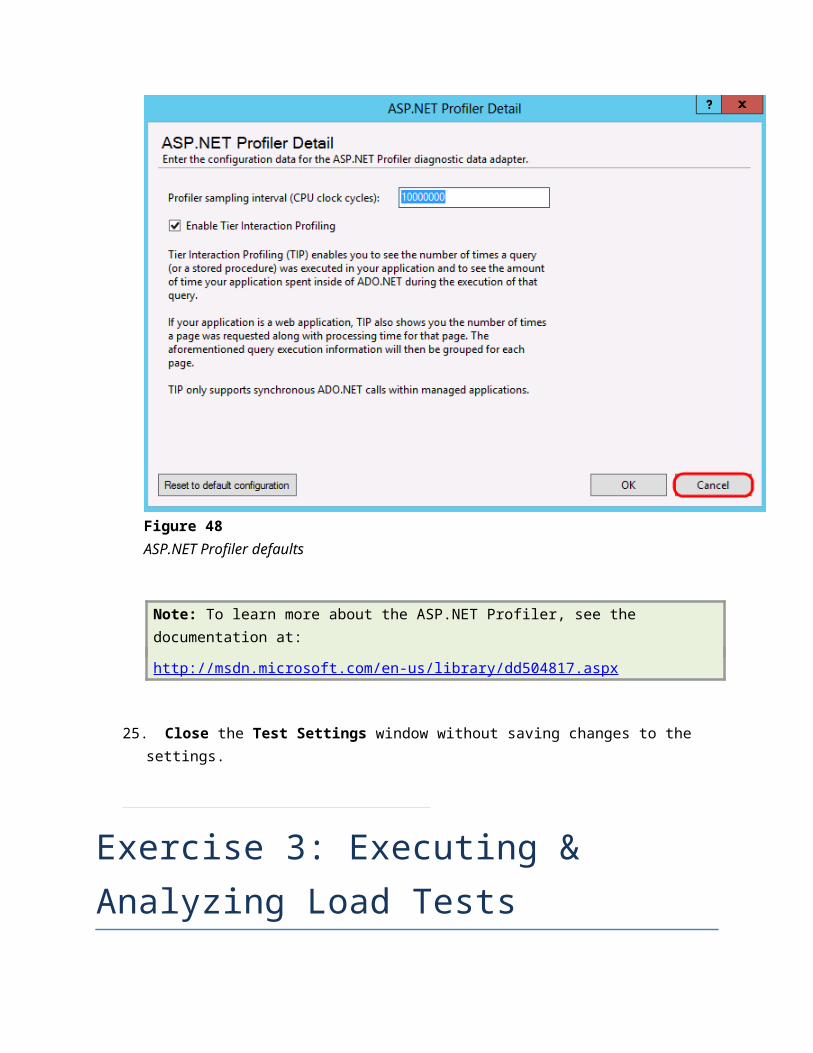
Figure 53Location of Run Test button
7. Once the load test initializes and starts its 1-minute run, the load test results window will load with the Graphs view visible. By default, you should see four panels showing some key statistics, with some key performance counters listed below that. Data is sampled every 5 seconds by default, but that can be changed in the load test settings.
Figure 54Load test results window showing KPIs during load test run
Note: Screenshots showing statistics and graphs may vary widely from those that you see during your walkthrough of this lab. This is due primarily to the different hardware that you are running this virtual machine on. In addition, you may see some threshold violations that result from the VM being busy during test. In a real world situation, and especially one in which you want to drive more virtual users, you would probably best be served by using multiple machines during test, not only to generate the load but also for each component of your system as it will be deployed in production.
8. After the load test run finishes, it will automatically switch to the Summary view. The Summary view shows overall aggregate values and other key information about the test. Note that the hyperlinks to specific pages open up even more details in the Tables view.
Figure 55Summary view for load test results
9. Switch to the Graphs view by clicking on the Graphs button in the toolbar.
Figure 56Graphs button
10. Note that you can manipulate the graphs that you view. Select the panels drop down control in the toolbar and select the Two Horizontal Panels option.
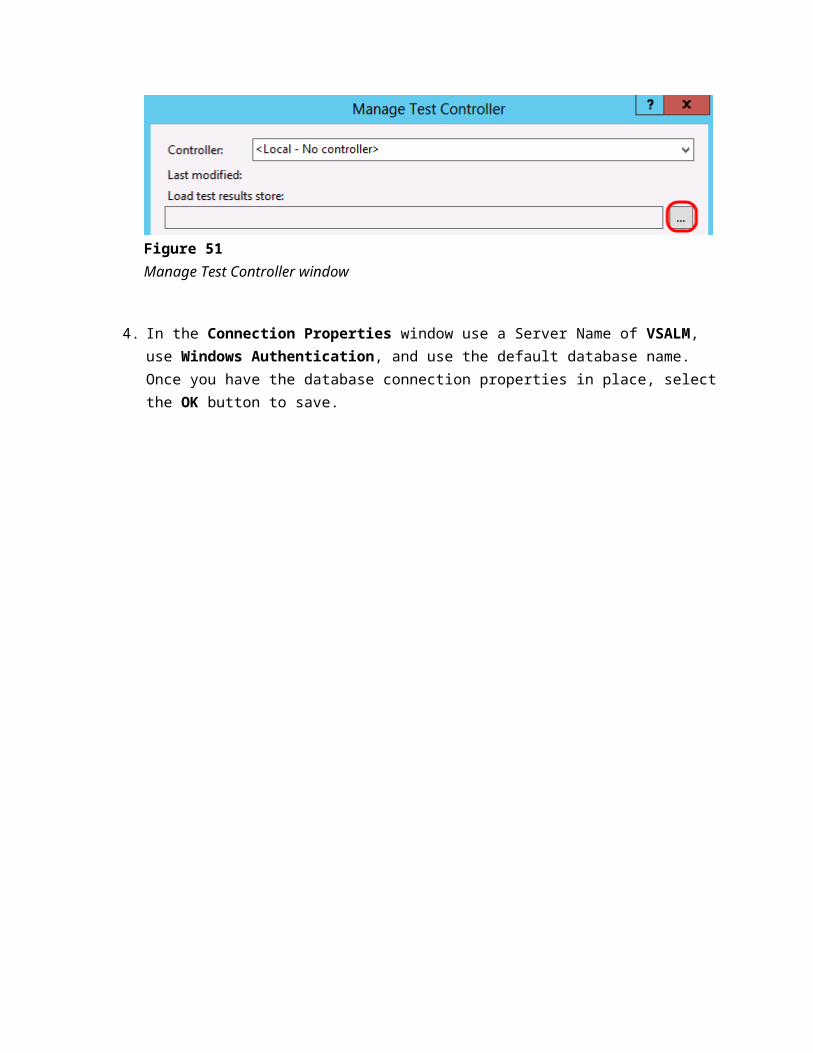
Figure 57Customizing the graph view
11. By default the top graph will show Key Indicators and the bottom graph will show Page Response Time, two very important sets of data to a web application.
Figure 58Graphs showing Key Indicators and Page Response Time
12. Click on one of the Key Indicator graph lines or data points so select it. This will also highlight the counter that it is associated with below the graphs. The red line from the screenshot below represents the User Load at different points during the load test. It is always equal to 5 as we configured it to be.
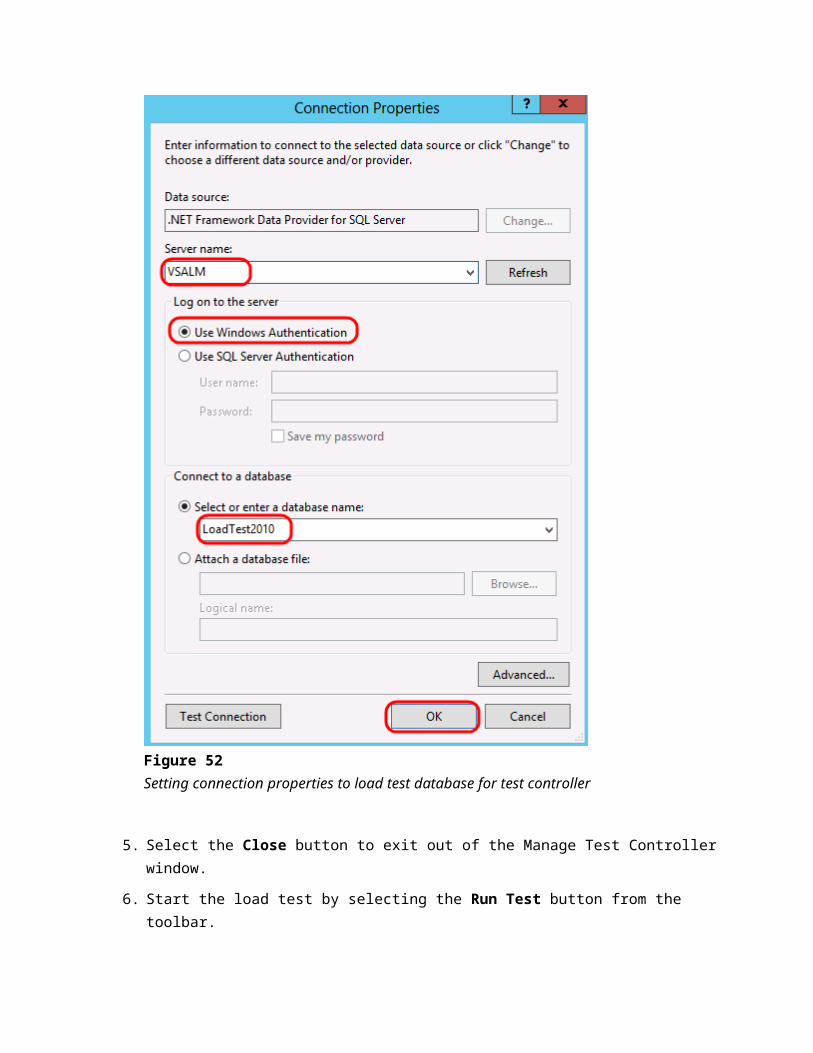
Figure 59User Load data selected
13. Click on the Pages/Sec row from the Key Indicators section of the counter grid to highlight it in the graph. In the screenshot shown below, we can see that the average number of pages per second over the duration of the test was 1.38.
Figure 60Viewing counter data
14. Even though the initial load test may result in some numbers that don’t seem to provide a wealth of information, it does provide a good baseline and allows us to make relative measures between test runs to help measure performance impacts of code changes. For example, if we had seen a relatively high level of batch requests per second during our initial load tests, perhaps that could be addressed by adding in some additional caching, and then re-testing to make sure that the request per second goes down.
15. Run the load test one more time so that we have at least two test results to work with, so we can see how to perform some trend analysis.
16. When the second load test is complete, select the Create Excel Report button from the toolbar to load Excel.
Figure 61Create Excel Report button
17. In the Generate a Load Test Report window within Excel, make sure that the Create a report option is selected and then select the Next button to continue.
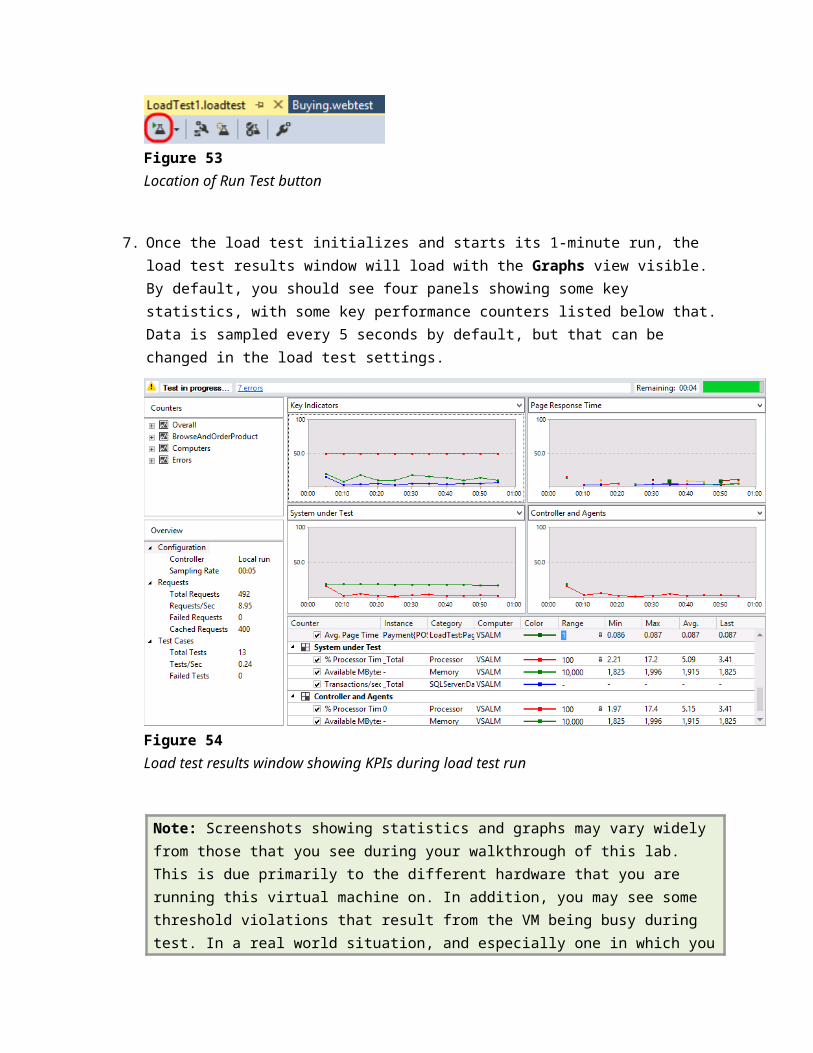
Figure 62Creating a new load test report
18. When prompted for the type of report to generate, select Trend followed by the Next button.
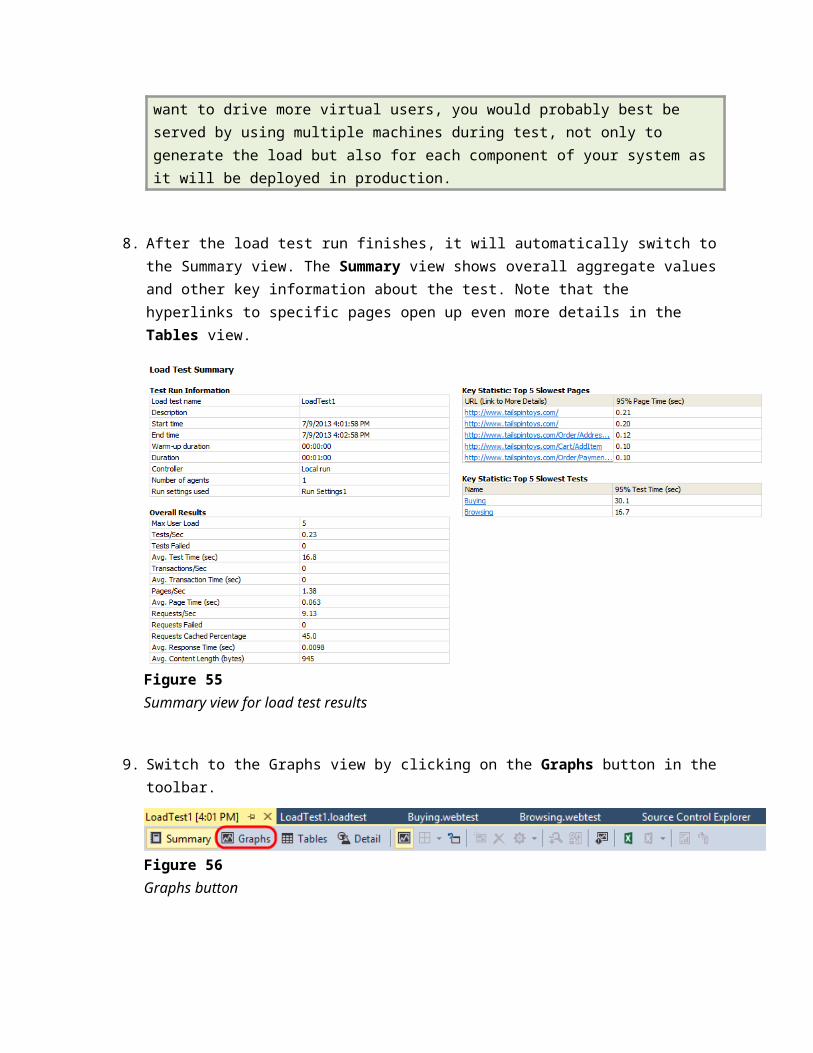
Figure 63Selecting the Trend report type
19. For Report Name, enter “LoadTestTrend” and select the Next button to continue.
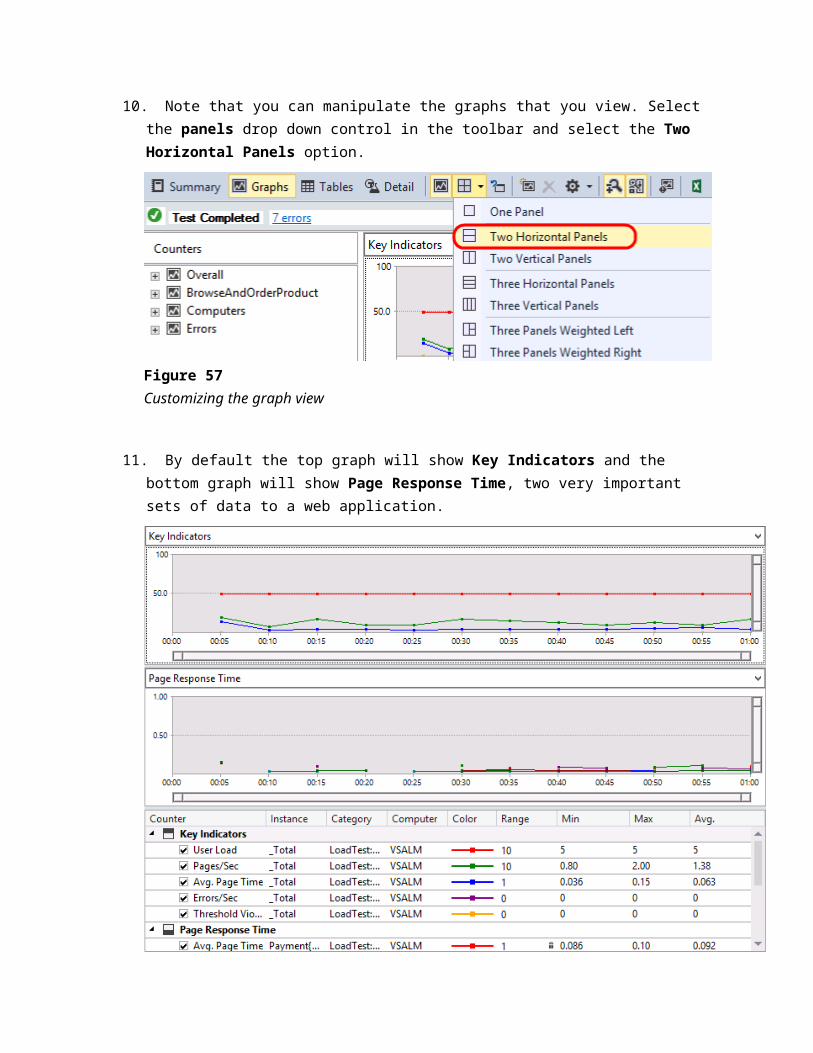
Figure 64Naming the Trend report
20. Select at least two load test runs to generate the trend report and then select the Next button to continue.
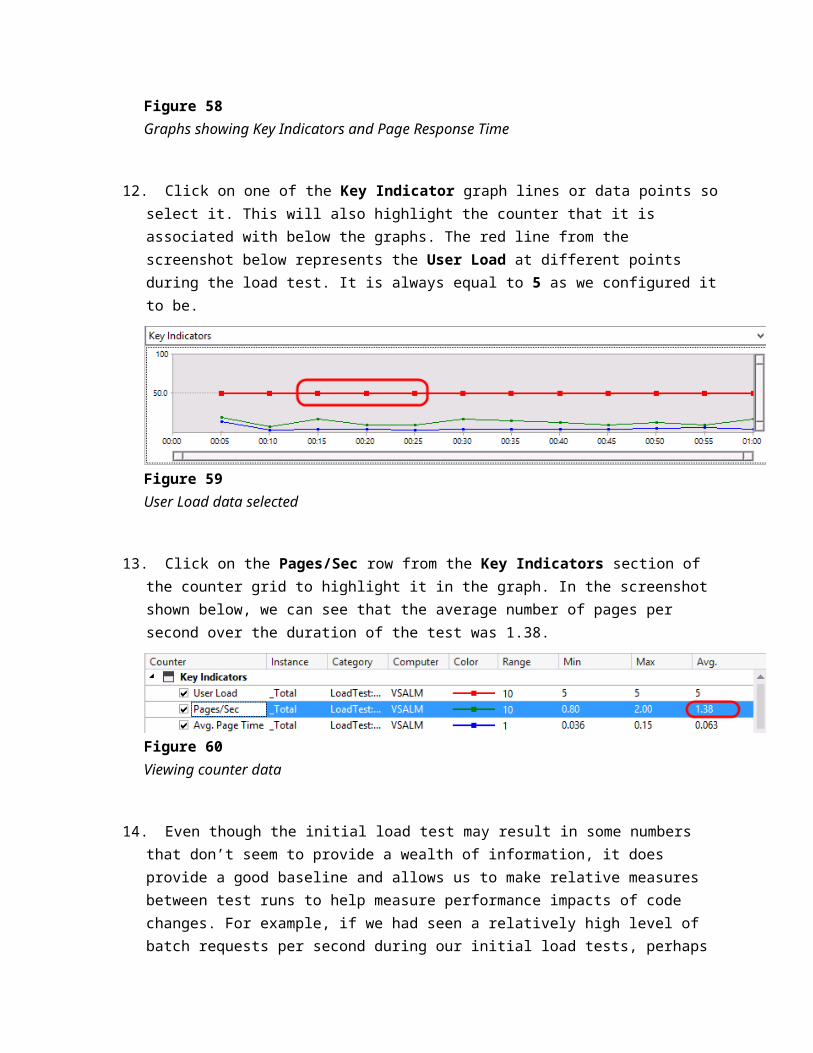
Figure 65Selecting test runs to generate trend report
21. When prompted for counters to add to the report, note that there will be a number of pre-selected defaults. Leave those defaults in place and select the Finish button to generate the report.
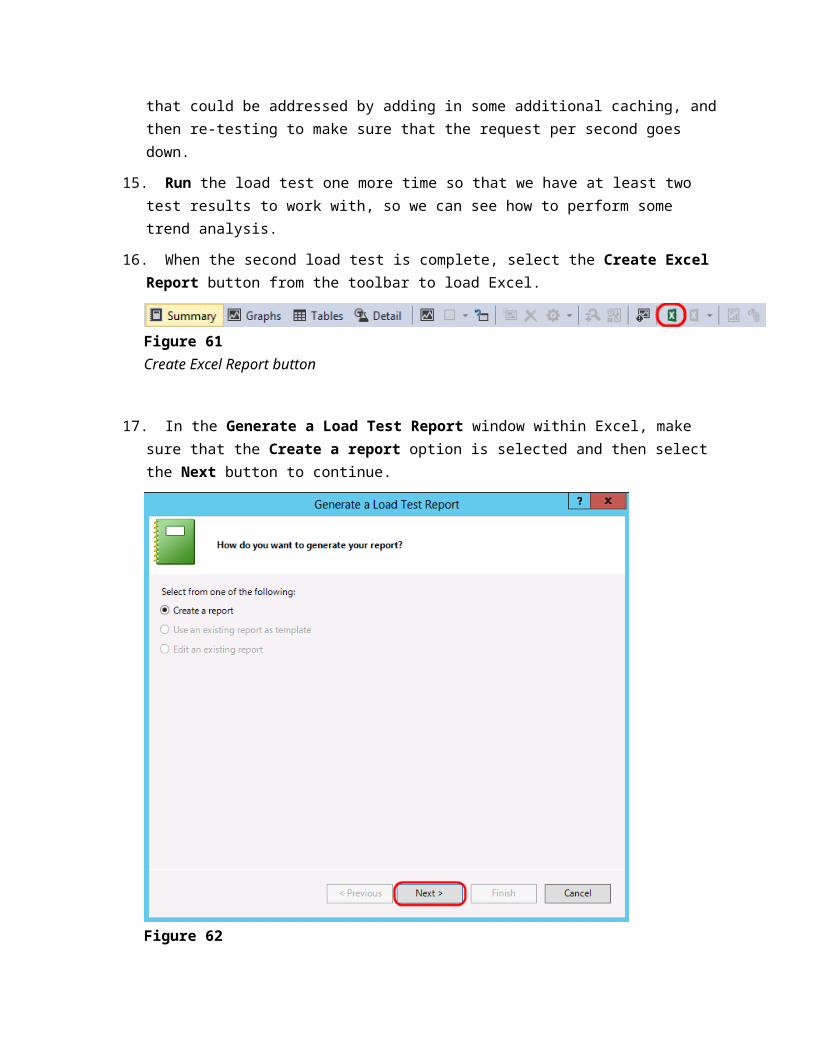
Figure 66Selecting performance counters
22. After the report is generated, a table of contents will be displayed that provides hyperlinks to specific report sheets. Select the Avg. Page Time link.
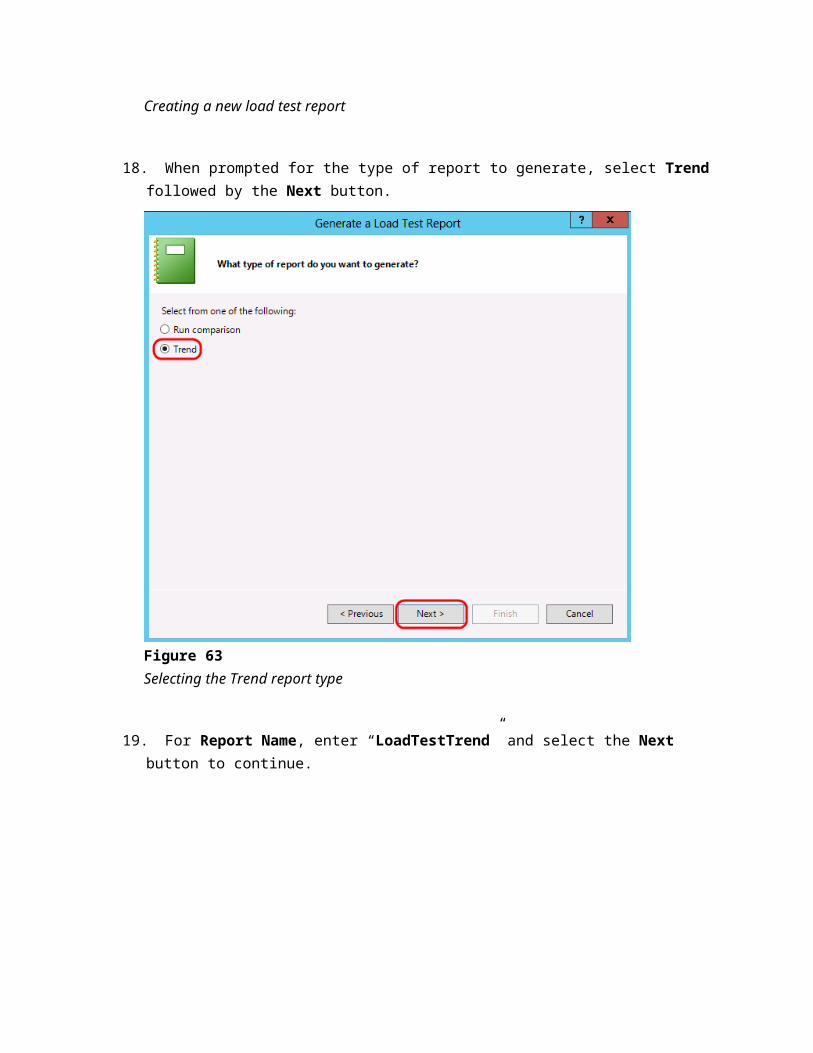
Figure 67Table of contents for generated trend report
23. The Avg. Page Time graph shows the average page time taken over the entire load test, for each test run that you selected for trend analysis. The page time is a measure that includes all requests that were made for a web page, so it is a useful performance indicator to measure. Since we did not make any modifications to the application under test, we do not expect to see significant differences between the test runs.
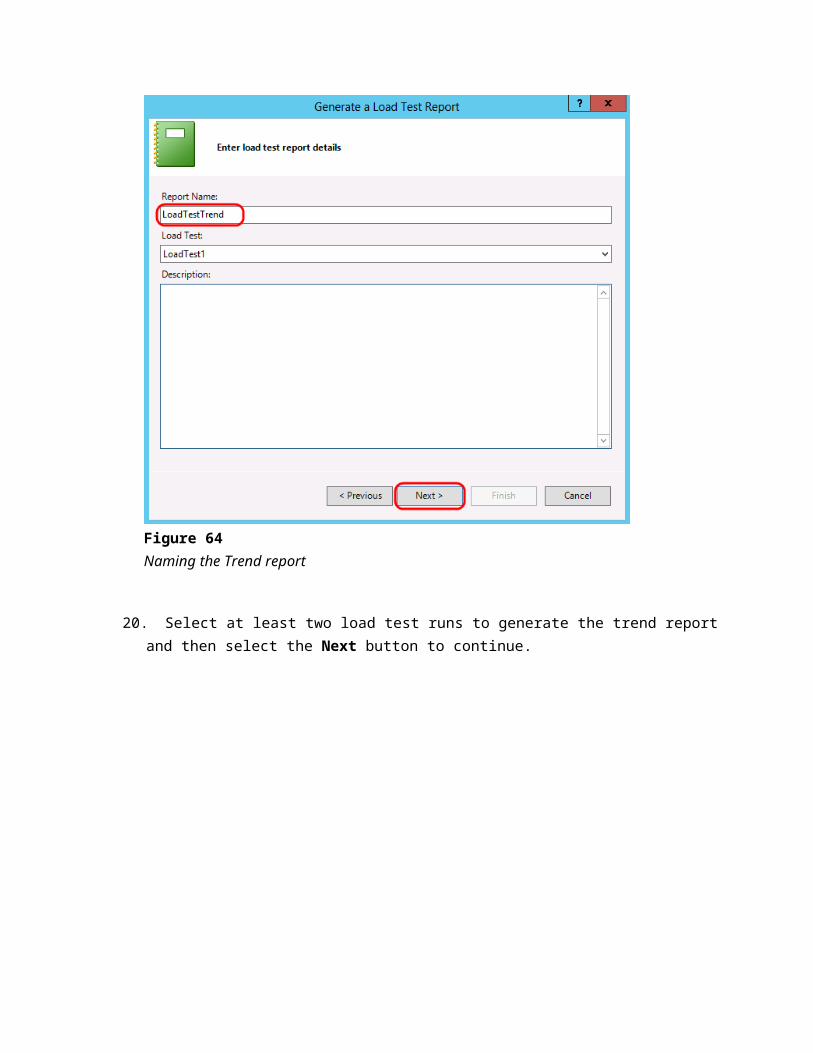
Figure 68Avg. Page Time graph
To give feedback please write to [email protected]
Copyright © 2023 by Microsoft Corporation. All rights reserved.