Embed Size (px)
Citation preview

Introduction to
Value-Added Data
Dr Robert Clark

Theory and Stats bits…
20
40
60
80
100
120
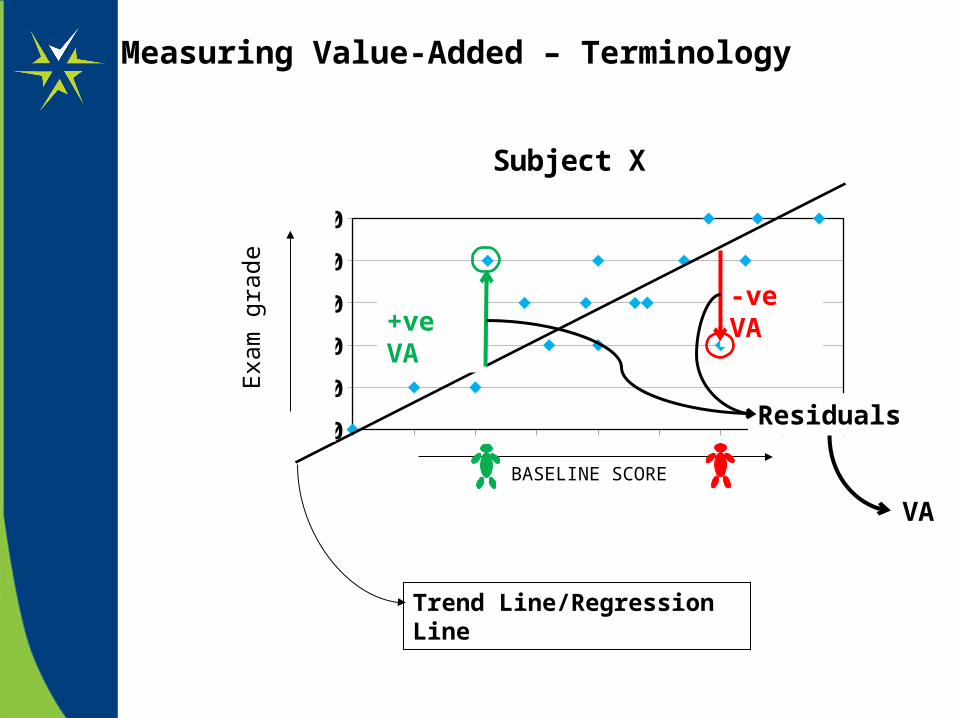
Subject X
Out
com
e
.
Trend Line/Regression Line
Measuring Value-Added – Terminology
BASELINE SCORE
-ve VA+ve VA
Residuals
VA
Exa
m g
rade

Measuring Value-Added – An Example
Low Ability Average Ability High Ability
Baseline Score
A*
U
B
C
D
E
F
G
Res
ult
Aldwulf Beowulf
Cuthbert+ve (+ 2 grades)
-ve (- 2 grades)
National Trend
‘Average’ Student
The position of the national trend line is of critical importance
Subject A
Subject B

5 6 7 840
60
80
100
120
140
Photography
Sociology
English Lit
Psychology
Maths
Physics
Latin
Average GCSE
Gra
de
Some Subjects are More Equal than Others….
A-Level
>1 grade
A*ABC
A
A*
B
C
D
E
Burning Question :
What is my Value-Added Score ?
Better Question :
Is it Important ?
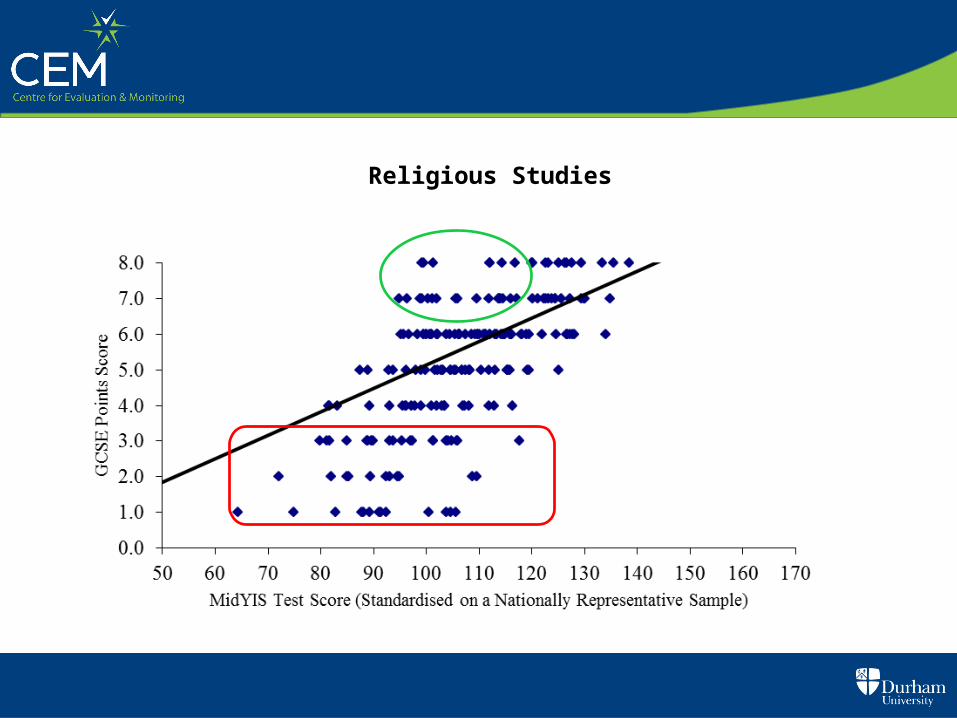
Value Added ChartsPre 16

Performance inline with expectation
VA Score
Performance below expectationProblem with Teaching & Learning ?
Performance above expectationGood Practice to Share ?

Which Subjects Cause Most Concern ?
Danger of Relying on Raw Residuals Without Confidence Limits

Additional A
pplied Science
Additional S
cience
Art &
Design
Biology
Business S
tudies
Chem
istry
Design &
Technology
Dram
a
English
English Literature
French
Geography
Germ
an
History
Mathem
atics
Music
Physical E
ducation
Physics
Religious S
tudies
Science
Spanish
Short C
ourse Religious S
tudies
-4
-3
-2
-1
0
1
2
3
4
0.00.8 0.5
-0.3
1.1
-0.4
1.00.2 0.4 0.1 0.1
0.0
0.0 0.1
0.0
0.0
-0.3
0.2 0.5
-0.3
0.70.2
-2.9
0.0
Average Standardised Residuals by Subject
Ave
rag
e S
tan
dar
dis
ed R
esid
ual
Which subjects now cause most concern ?

Business Studies

Religious Studies
Value Added ChartsPost 16

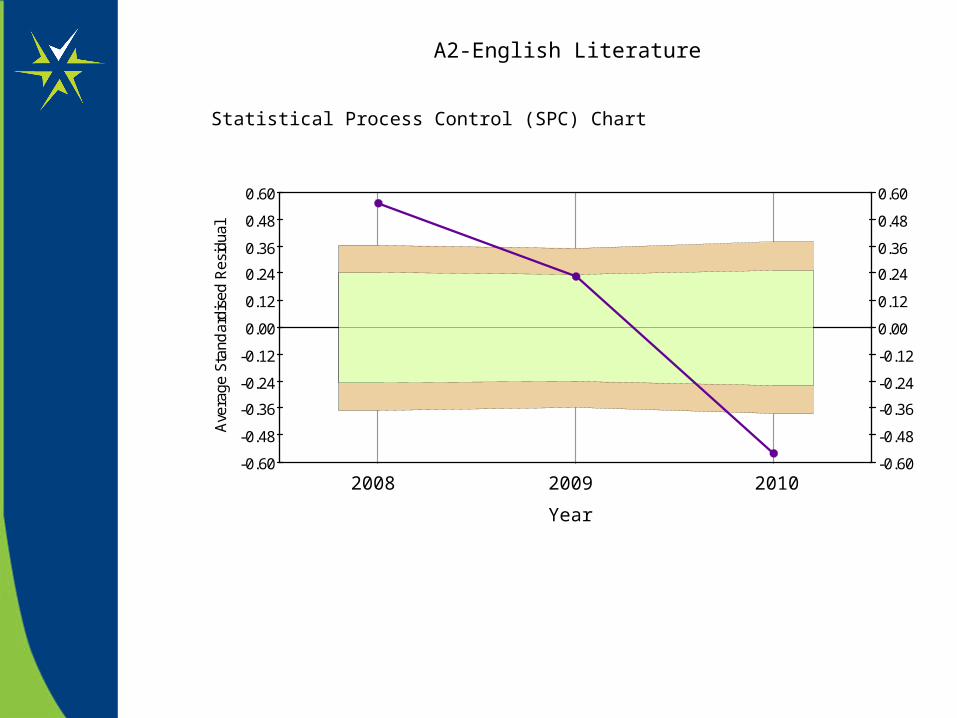
SPC Chart
2000 2001 2002 2003 2004 2005 2006 2007 2008 2009 2010
Year
Performance inline with expectation
VA Score
Performance below expectationProblem with Teaching & Learning ?
Performance above expectationGood Practice to Share ?

Subject Summary - 3 Year Average
Subject Summary - Current Year
-0.60
-0.48
-0.36
-0.24
-0.12
0.00
0.12
0.24
0.36
0.48
0.60
2002 2003 2004
Ave
rage
Sta
ndar
dise
d Res
idua
l
Year
-0.60
-0.48
-0.36
-0.24
-0.12
0.00
0.12
0.24
0.36
0.48
0.60
A2-English Literature
Statistical Process Control (SPC) Chart
2008 2009 2010
Year
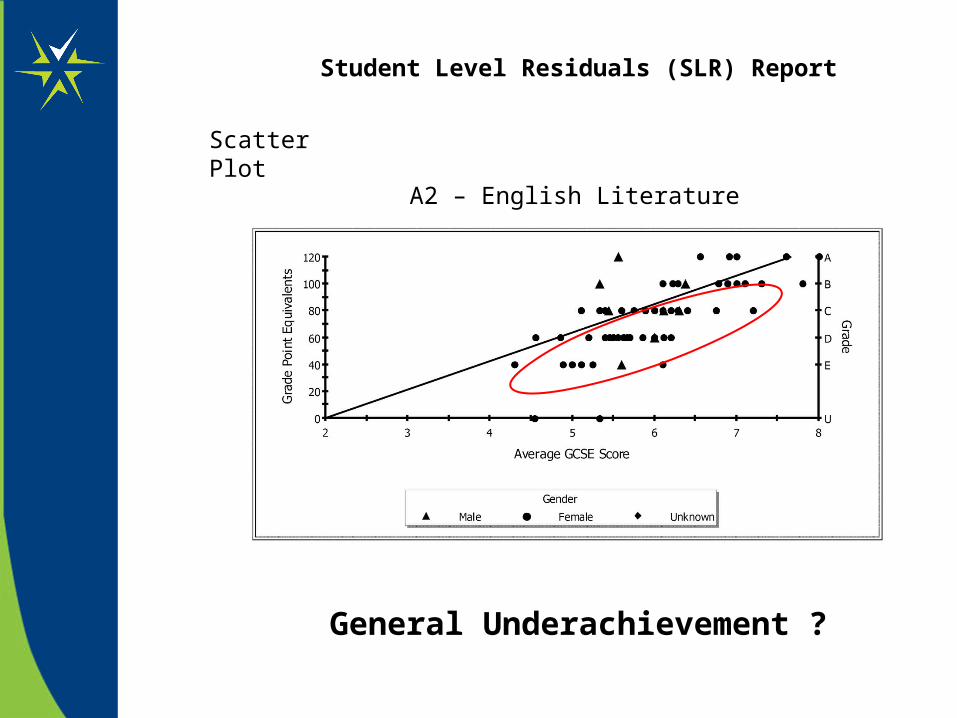
Student Level Residuals (SLR) Report
Scatter Plot
A2 – English Literature
General Underachievement ?

Student Level Residuals (SLR) Report
Scatter Plot
A2 – English Literature
Too many U’s ?

Other things to look for…
Why did these students do so badly ?
Why did this student do so well ?
How did they do in their other subjects ?

Summary of Process
• Examine Subject Summary• Determine ‘interesting’ (i.e. statistically significant) subjects• Look at 3 year average as well as single year if available• Look at trends in ‘Interesting Subjects’• Examine student data –Scatter graphs• Identify students over / under achieving (student list or Paris)• Any known issues ?• Don’t forget to look at over achieving subjects as well as under
achieving• Phone / Email CEM when you need help understanding /
interpreting the data / statistics !
Baseline Choice
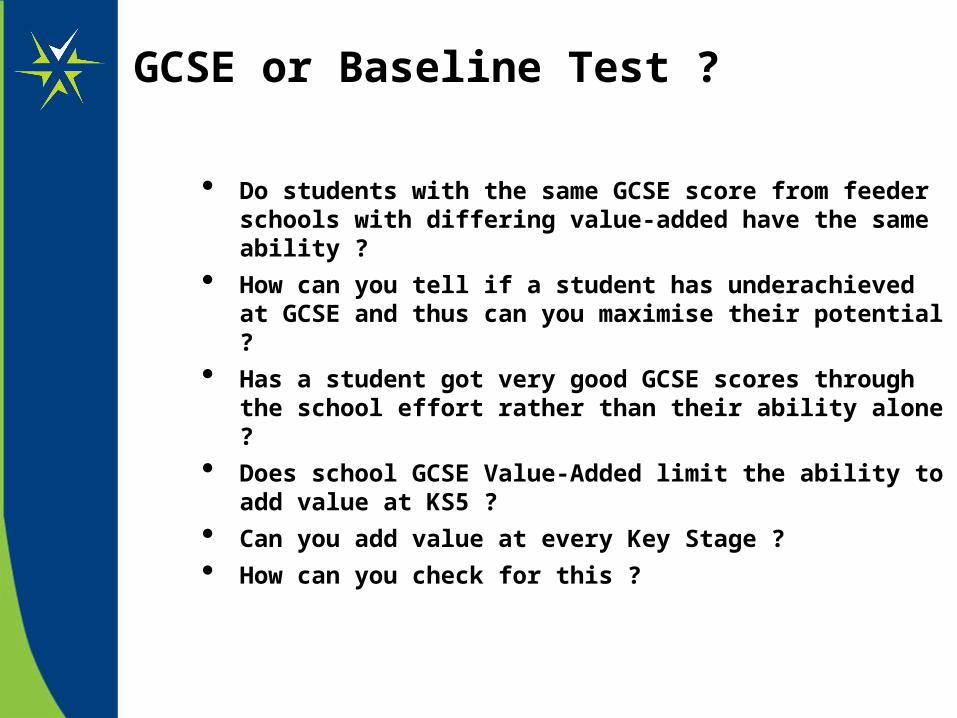
• Do students with the same GCSE score from feeder schools with differing value-added have the same ability ?
• How can you tell if a student has underachieved at GCSE and thus can you maximise their potential ?
• Has a student got very good GCSE scores through the school effort rather than their ability alone ?
• Does school GCSE Value-Added limit the ability to add value at KS5 ?
• Can you add value at every Key Stage ?
• How can you check for this ?
GCSE or Baseline Test ?

The Effect of Prior Value Added
Beyond Expectation
+ve Value-Added
In line with Expectation
0 Value-Added
Below Expectation
-ve Value-Added
Average GCSE = 6 Average GCSE = 6 Average GCSE = 6
Do these 3 students all have the same ability ?

Same School - Spot the Difference ?
GCSE as
Baseline
Test as
Baseline

National or School Type Specific ?
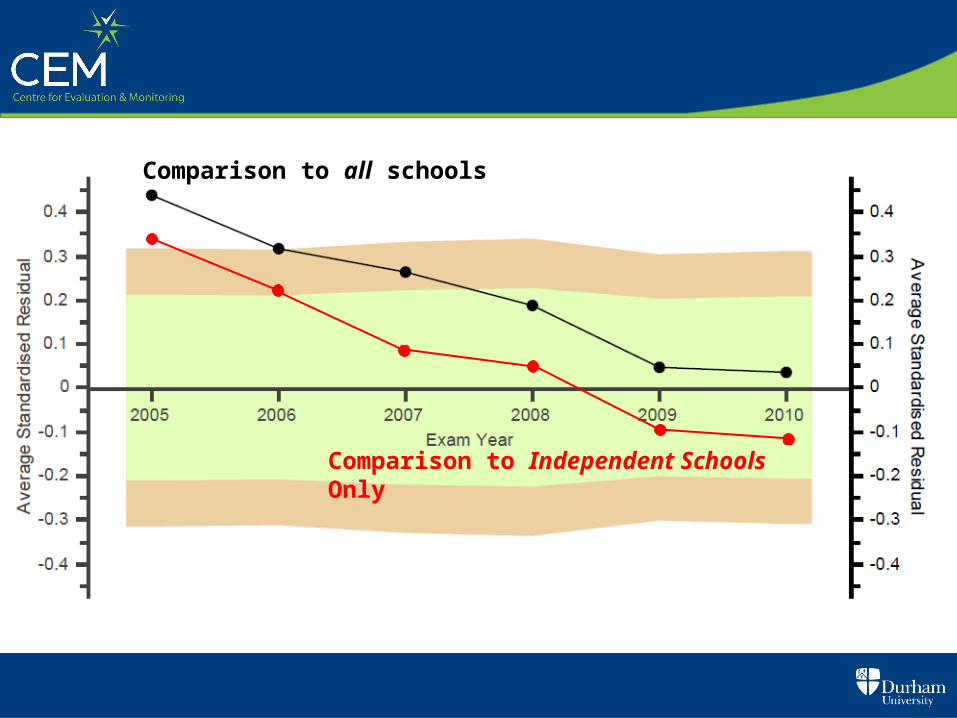
Comparison to all schools
Comparison to Independent Schools Only

Comparison to all schools
Comparison to FE Colleges Only

Questions:
→ How does the unit of comparison used affect the Value-Added data and what implications does this have on your understanding of performance ?
→ Does this have implications for Self Evaluation ?
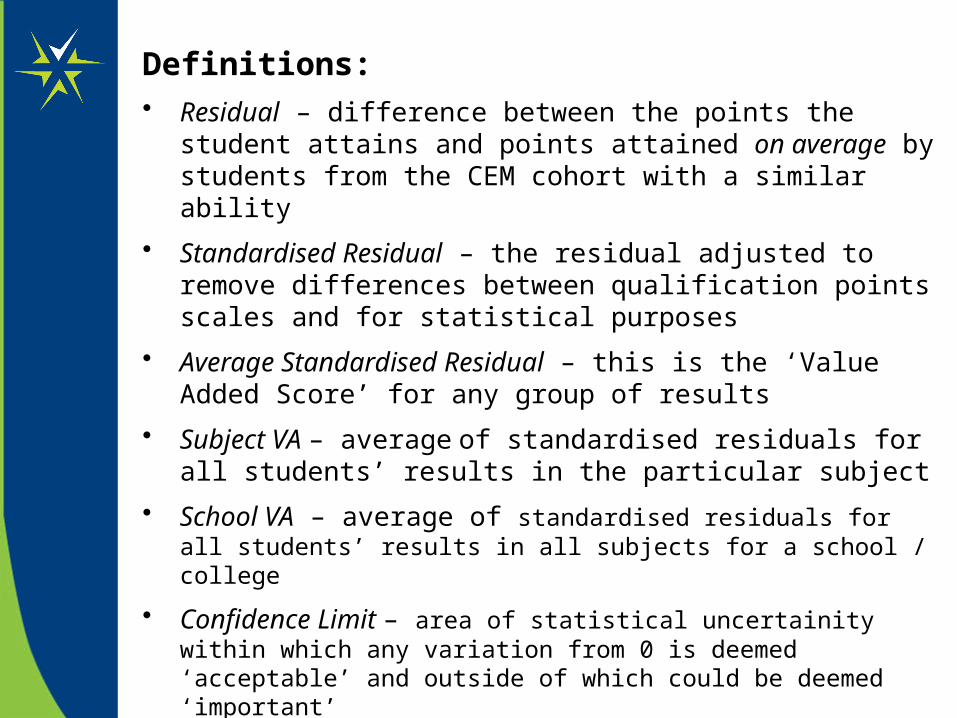
Definitions:• Residual – difference between the points the student attains and
points attained on average by students from the CEM cohort with a similar ability
• Standardised Residual – the residual adjusted to remove differences between qualification points scales and for statistical purposes
• Average Standardised Residual – this is the ‘Value Added Score’ for any group of results
• Subject VA – average of standardised residuals for all students’ results in the particular subject
• School VA – average of standardised residuals for all students’ results in all subjects for a school / college
• Confidence Limit – area of statistical uncertainity within which any variation from 0 is deemed ‘acceptable’ and outside of which could be deemed ‘important’