Embed Size (px)
Citation preview
Introduction to
TotalView Debugger
Why a Debugger?
• Developers need a way to understand the runtime behavior of their programs
– When writing new code, porting code, adding features, scaling, tuning or optimizing
– When troubleshooting bugs, code correctness, and memory analysis
• The solution Rogue Wave has to this is TotalView – TotalView is a source code debugger for Linux, Unix and Mac which gives
users visibility into and control over runtime execution – TotalView is especially compelling for users dealing with complex code,
concurrency (multi-core or clusters), and computational accelerators
• With this solution Rogue Wave offers companies lower development costs, lower risk, and higher quality
– We offer developers the ability to code confidently
Benefits of a Debugger
• When writing new code, porting code, adding features, scaling, tuning or optimizing
• Code Correctness, Bug troubleshooting, Memory Analysis – Difficulty Varies
• Sometimes it is obvious once the developer has a clear reproducer
• Sometimes it can take weeks
– Techniques include • Logging, print statements, interactive debugging tools
• Bugs are costly (time, reputation, customer satisfaction, impediment to sales) and the pressure is high
Developers need a way to understand the runtime behavior of their programs
Benefits of a Debugger
• Code correctness
– How does a developer know that any bit of code is correct?
• Sometimes it is obvious once the developer has a clear reproducer
• Sometimes it can take weeks
– Techniques include • Logging, print statements, interactive debugging tools
• Bugs are costly (time, reputation, customer satisfaction, impediment to sales) and the pressure is high
Developers need a way to understand the runtime behavior of their programs
TotalView Introduction
Key Features of TotalView
• Interactive Debugging
• Interactive Memory Debugging
• Reverse Debugging
• Unattended Debugging
Serial and Parallel applications
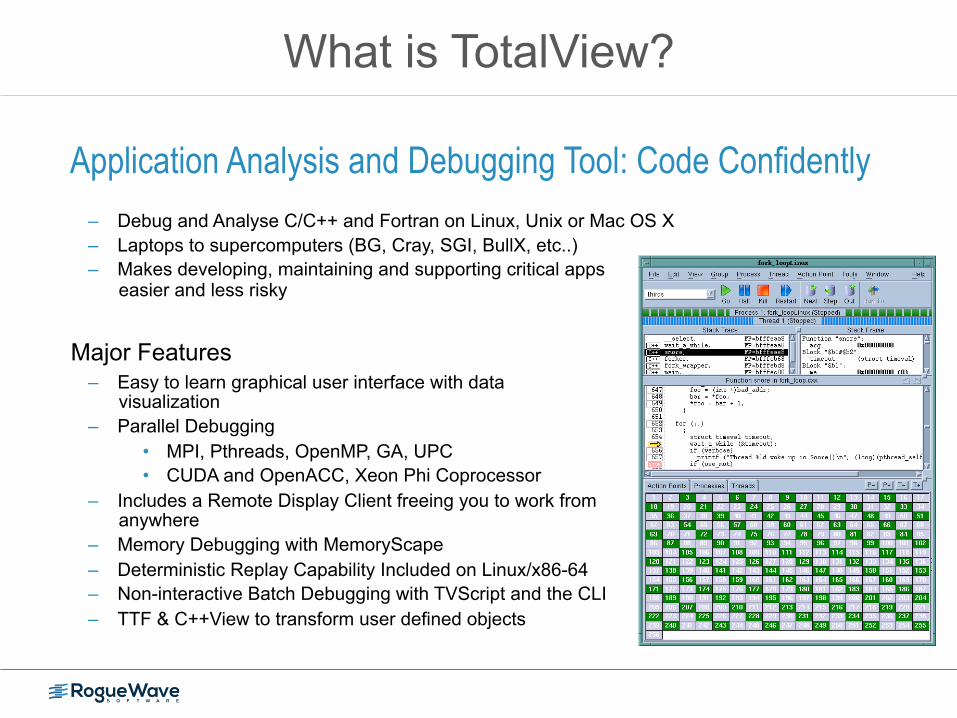
What is TotalView?
– Debug and Analyse C/C++ and Fortran on Linux, Unix or Mac OS X – Laptops to supercomputers (BG, Cray, SGI, BullX, etc..) – Makes developing, maintaining and supporting critical apps
easier and less risky
Major Features – Easy to learn graphical user interface with data
visualization – Parallel Debugging
• MPI, Pthreads, OpenMP, GA, UPC • CUDA and OpenACC, Xeon Phi Coprocessor
– Includes a Remote Display Client freeing you to work from anywhere
– Memory Debugging with MemoryScape – Deterministic Replay Capability Included on Linux/x86-64 – Non-interactive Batch Debugging with TVScript and the CLI – TTF & C++View to transform user defined objects
Application Analysis and Debugging Tool: Code Confidently
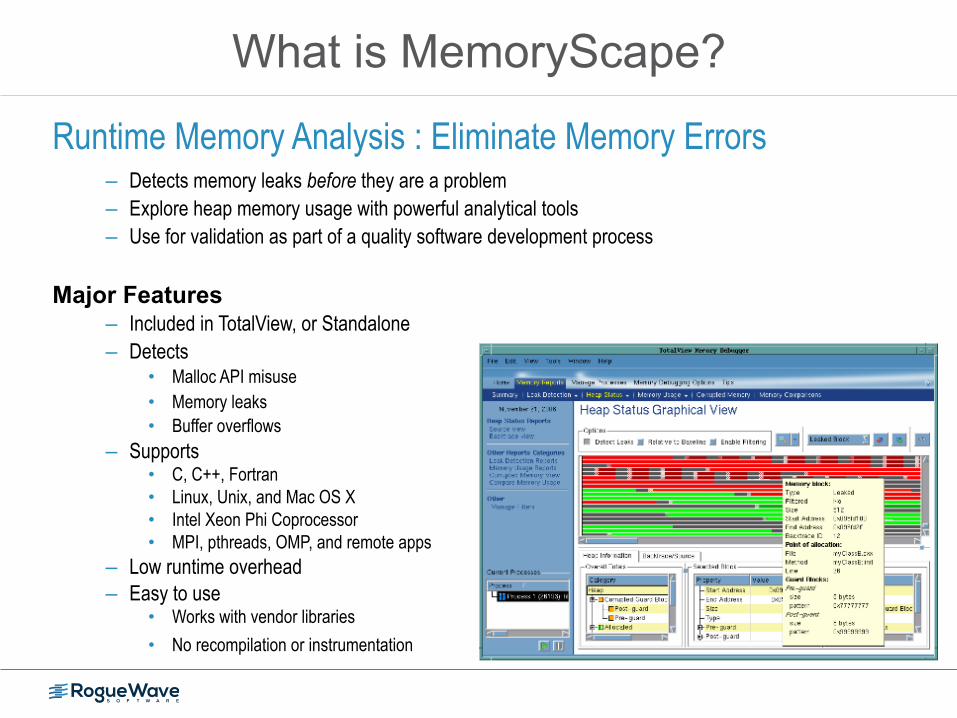
What is MemoryScape?
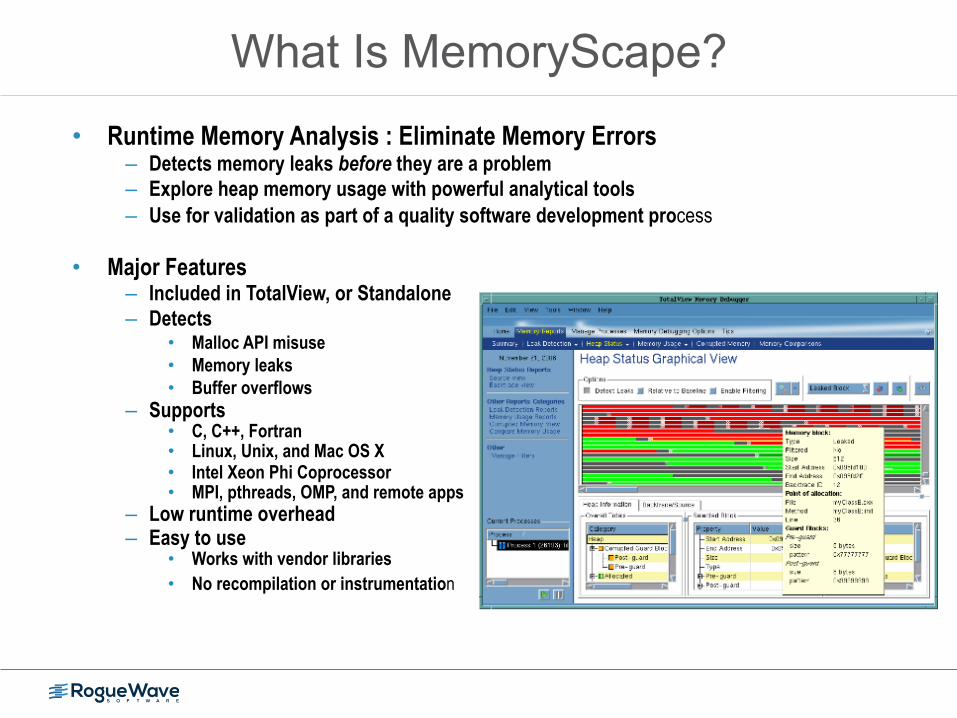
Runtime Memory Analysis : Eliminate Memory Errors – Detects memory leaks before they are a problem – Explore heap memory usage with powerful analytical tools – Use for validation as part of a quality software development process
Major Features – Included in TotalView, or Standalone – Detects
• Malloc API misuse • Memory leaks • Buffer overflows
– Supports • C, C++, Fortran • Linux, Unix, and Mac OS X • Intel Xeon Phi Coprocessor • MPI, pthreads, OMP, and remote apps
– Low runtime overhead – Easy to use
• Works with vendor libraries
• No recompilation or instrumentation
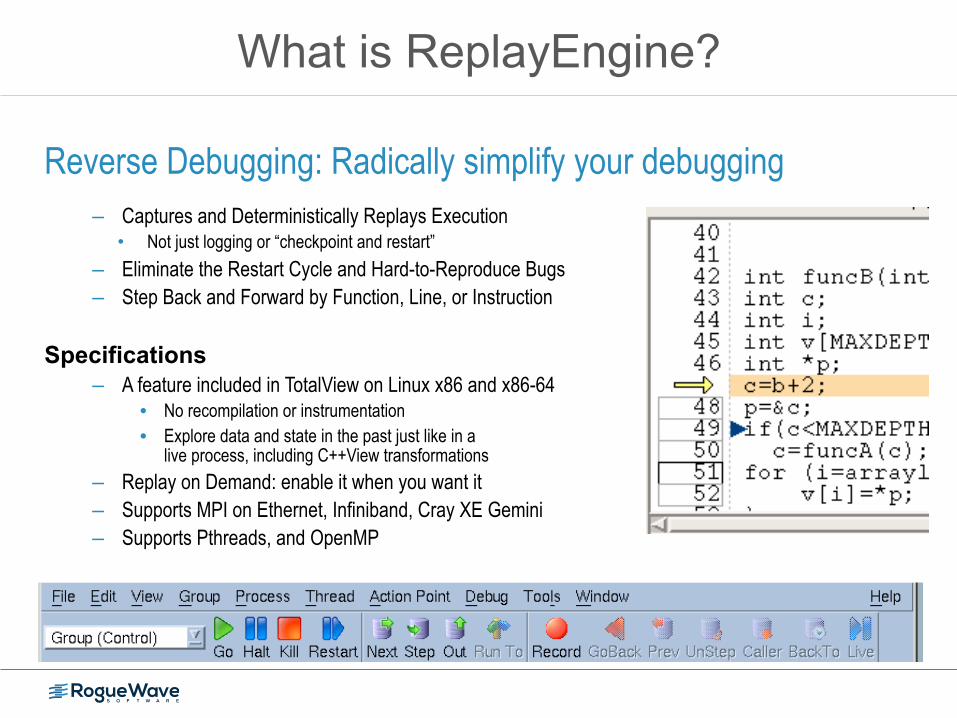
What is ReplayEngine?
Reverse Debugging: Radically simplify your debugging – Captures and Deterministically Replays Execution
• Not just logging or “checkpoint and restart”
– Eliminate the Restart Cycle and Hard-to-Reproduce Bugs – Step Back and Forward by Function, Line, or Instruction
Specifications – A feature included in TotalView on Linux x86 and x86-64
• No recompilation or instrumentation • Explore data and state in the past just like in a
live process, including C++View transformations
– Replay on Demand: enable it when you want it – Supports MPI on Ethernet, Infiniband, Cray XE Gemini – Supports Pthreads, and OpenMP
TVScript Overview
• Gives you non-interactive access to TotalView’s capabilities • Useful for
– Debugging in batch environments – Watching for intermittent faults – Parametric studies – Automated testing and validation
• TVScript is a script (not a scripting language) – It runs your program to completion and performs debugger actions
on it as you request – Results are written to an output file – No GUI – No interactive command line prompt
TVScript Overview
• Gives you non-interactive access to TotalView’s capabilities • Useful for
– Debugging in batch environments – Watching for intermittent faults – Automated testing and validation
• TVScript is a script (not a scripting language) – It runs your program to completion and performs debugger actions
on it as you request – Results are written to an output file – No GUI – No interactive command line prompt
TVScript Syntax
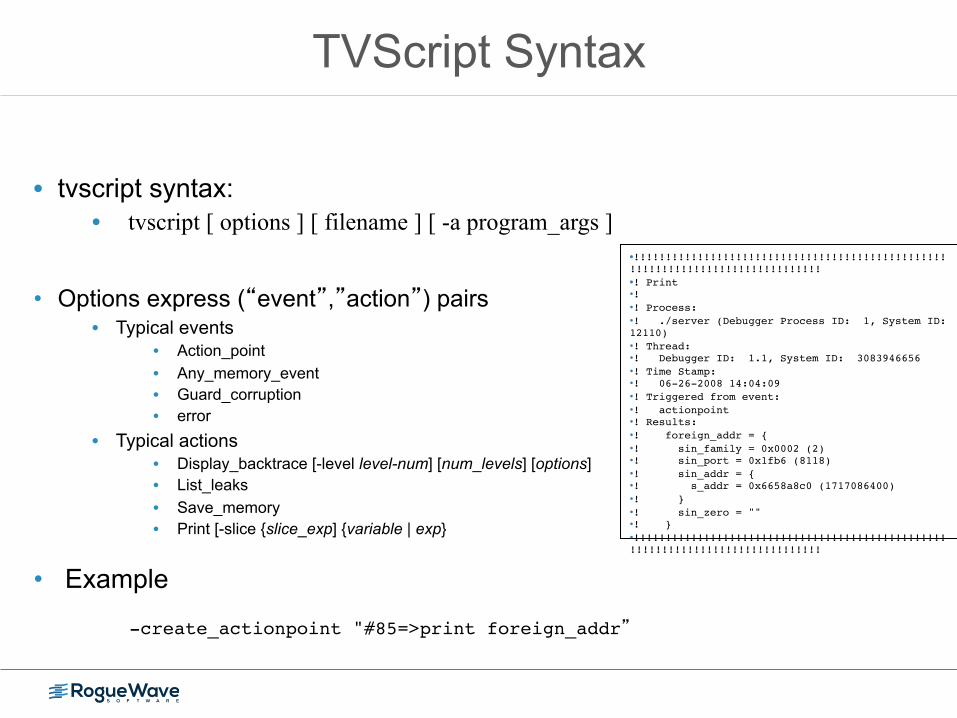
• tvscript syntax: • tvscript [ options ] [ filename ] [ -a program_args ]
• Options express (“event”,”action”) pairs • Typical events
• Action_point • Any_memory_event • Guard_corruption • error
• Typical actions • Display_backtrace [-level level-num] [num_levels] [options] • List_leaks • Save_memory • Print [-slice {slice_exp] {variable | exp}
• Example
-create_actionpoint "#85=>print foreign_addr”
• !!!!!!!!!!!!!!!!!!!!!!!!!!!!!!!!!!!!!!!!!!!!!!!!!!!!!!!!!!!!!!!!!!!!!!!!!!!!!!!• ! Print• !• ! Process:• ! ./server (Debugger Process ID: 1, System ID: 12110)• ! Thread:• ! Debugger ID: 1.1, System ID: 3083946656• ! Time Stamp:• ! 06-26-2008 14:04:09• ! Triggered from event:• ! actionpoint• ! Results:• ! foreign_addr = {• ! sin_family = 0x0002 (2)• ! sin_port = 0x1fb6 (8118)• ! sin_addr = {• ! s_addr = 0x6658a8c0 (1717086400)• ! }• ! sin_zero = ""• ! } • !!!!!!!!!!!!!!!!!!!!!!!!!!!!!!!!!!!!!!!!!!!!!!!!!!!!!!!!!!!!!!!!!!!!!!!!!!!!!!!
Why TotalView?
• TotalView includes MemoryScape (all platforms) and ReplayEngine (linux only) – CUDA debugging – Parallel debugging – Batch debugging
• Benefits for Management – Higher developer productivity – Lower development project schedule risk – Higher product quality – Lower cost to resolve bugs both in development and production – Lowers the cost of adopting new technologies (threads, MPI, CUDA, etc..)
• Benefits for Developers – Easier debugging, analysis and troubleshooting – Makes working with threads, MPI and accelerators easier and less frustrating – Makes more ambitious development possible – Especially helpful for really frustrating bugs – Features that replace tedious troubleshooting techniques
Demonstrate Debugging a Parallel Non-
Deterministic code with Minimum Effort
MergeSort Example
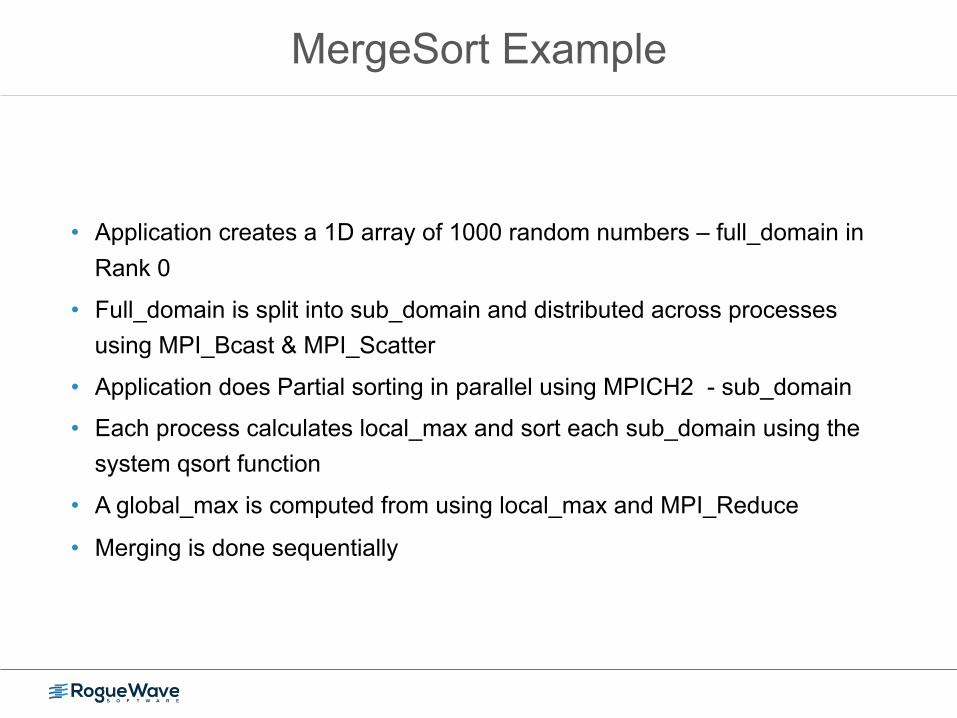
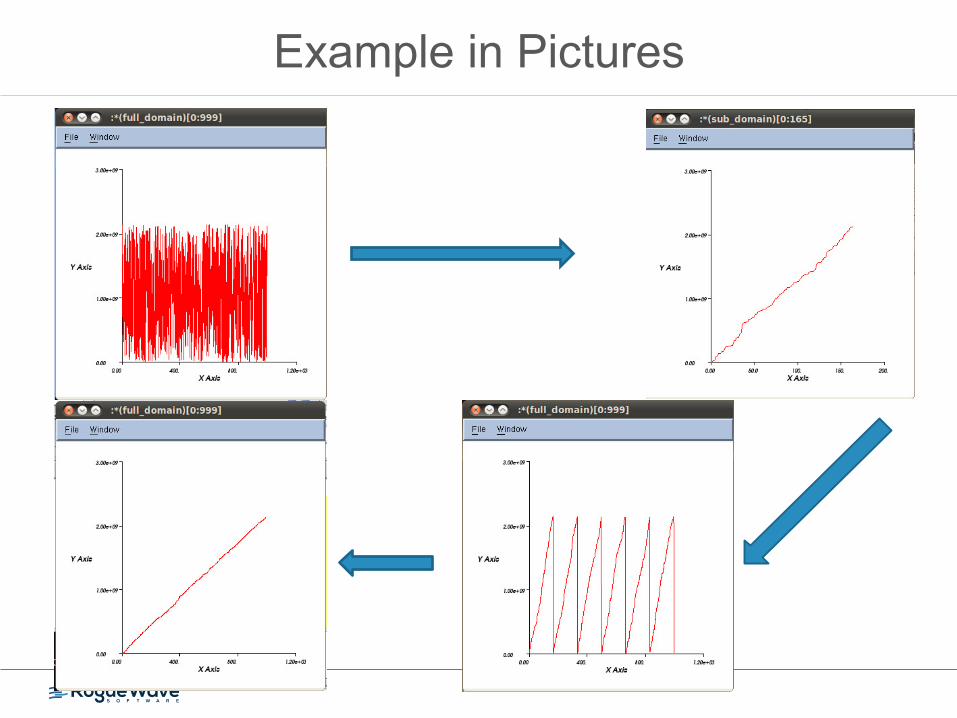
• Application creates a 1D array of 1000 random numbers – full_domain in Rank 0
• Full_domain is split into sub_domain and distributed across processes using MPI_Bcast & MPI_Scatter
• Application does Partial sorting in parallel using MPICH2 - sub_domain
• Each process calculates local_max and sort each sub_domain using the system qsort function
• A global_max is computed from using local_max and MPI_Reduce
• Merging is done sequentially
Example in Pictures
DEMO
Memory Scape Introduction
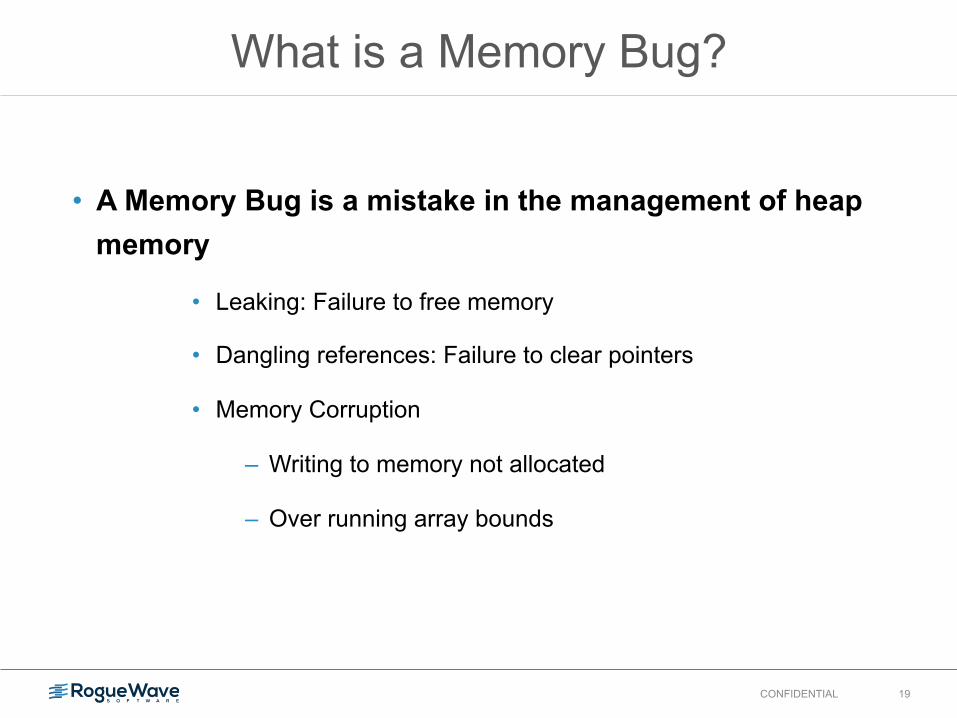
What is a Memory Bug?
• A Memory Bug is a mistake in the management of heap memory
• Leaking: Failure to free memory
• Dangling references: Failure to clear pointers
• Memory Corruption
– Writing to memory not allocated
– Over running array bounds
CONFIDENTIAL 19
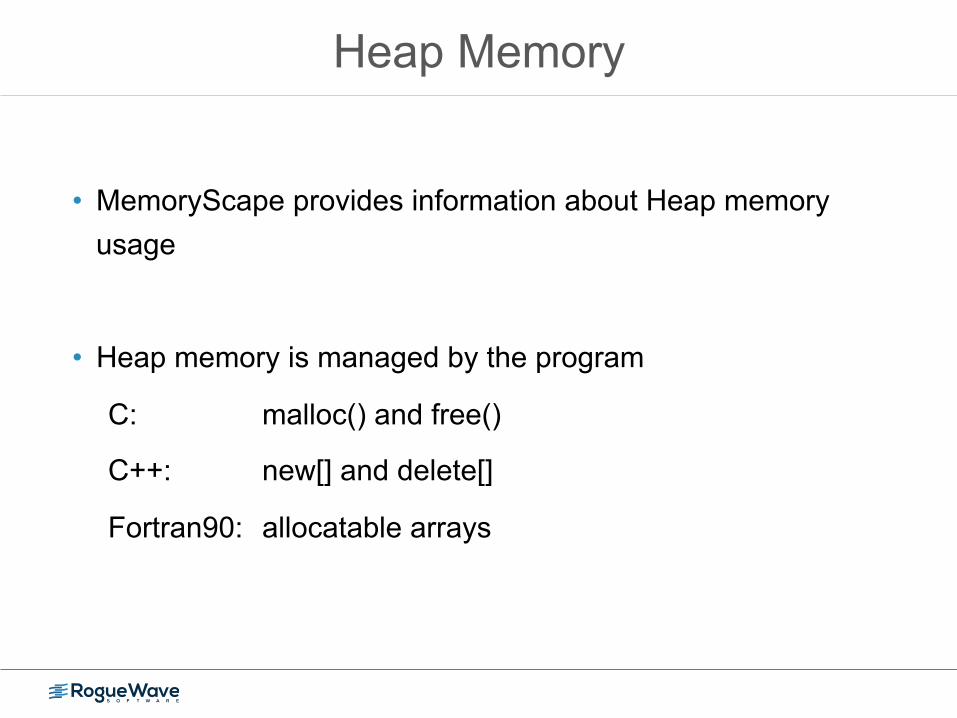
Heap Memory
• MemoryScape provides information about Heap memory usage
• Heap memory is managed by the program
C: malloc() and free()
C++: new[] and delete[]
Fortran90: allocatable arrays
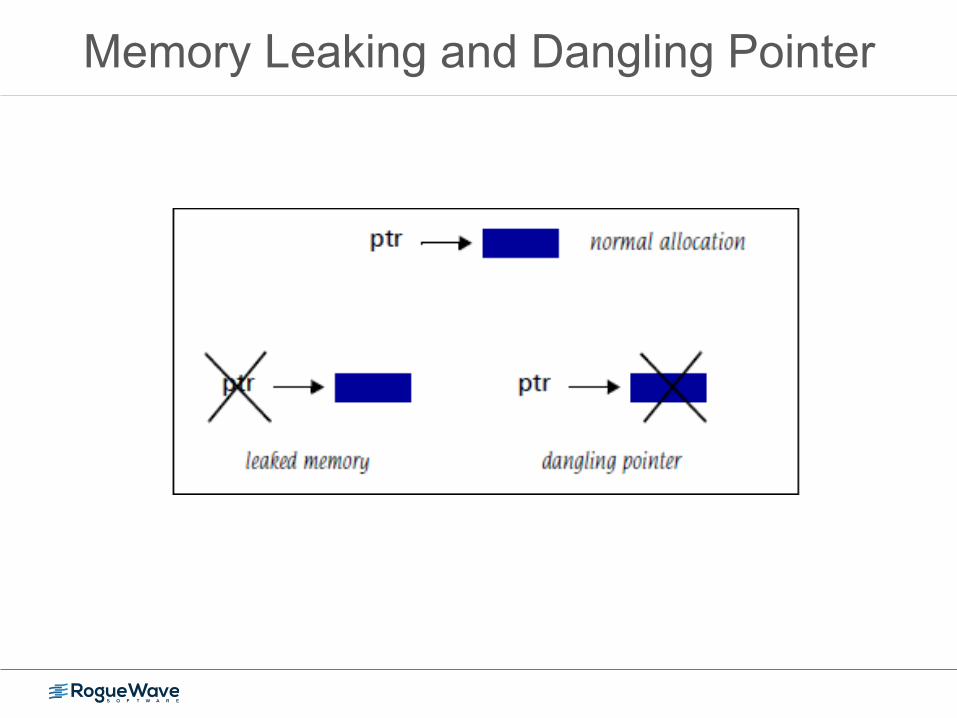
Memory Leaking and Dangling Pointer
MemoryScape
What Is MemoryScape? • Runtime Memory Analysis : Eliminate Memory Errors
– Detects memory leaks before they are a problem – Explore heap memory usage with powerful analytical tools – Use for validation as part of a quality software development process
• Major Features – Included in TotalView, or Standalone – Detects
• Malloc API misuse • Memory leaks • Buffer overflows
– Supports • C, C++, Fortran • Linux, Unix, and Mac OS X • Intel Xeon Phi Coprocessor • MPI, pthreads, OMP, and remote apps
– Low runtime overhead – Easy to use
• Works with vendor libraries • No recompilation or instrumentation
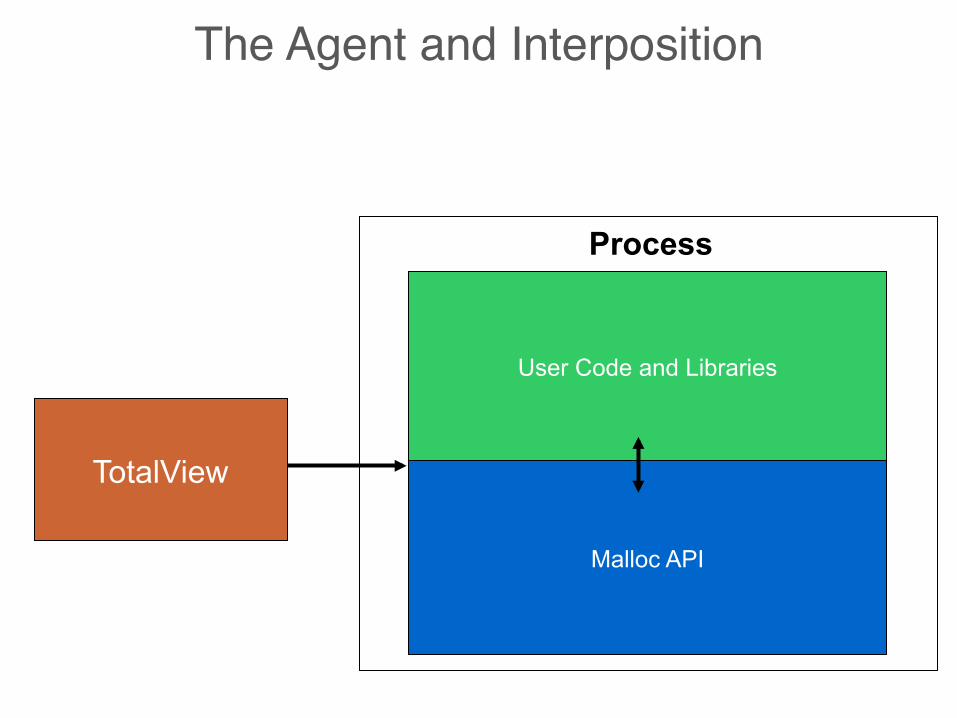
The Agent and Interposition
Process
TotalView
Malloc API
User Code and Libraries
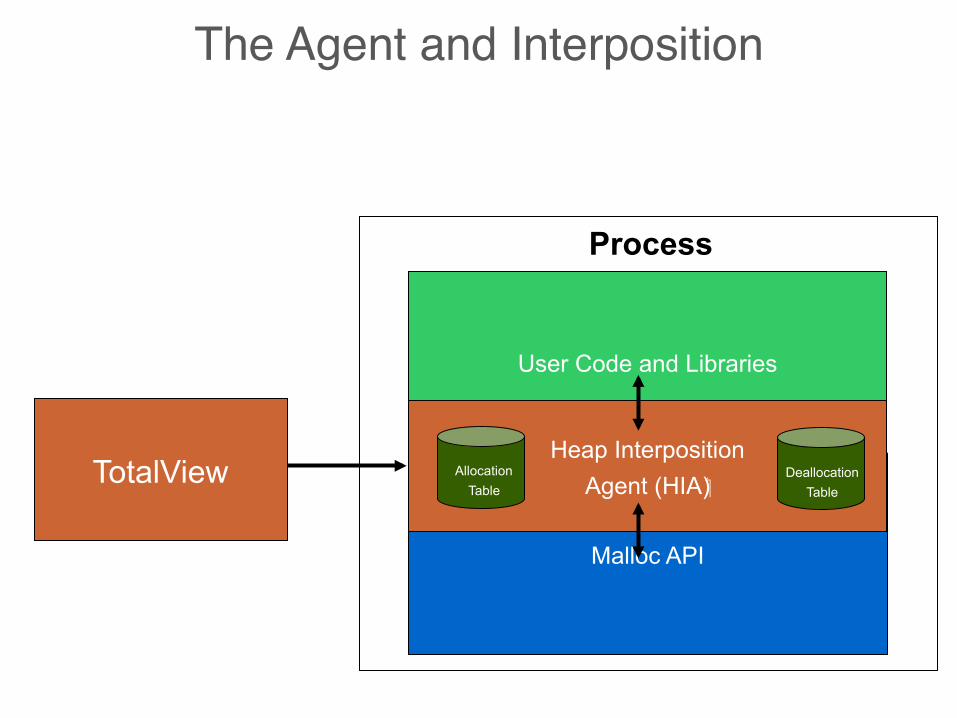
The Agent and Interposition
Malloc API
User Code and Libraries
Process
TotalView Heap Interposition
Agent (HIA) Allocation
Table Deallocation
Table
TotalView HIA Technology
• Advantages of TotalView HIA Technology
• Use it with your existing builds • No Source Code or Binary Instrumentation
• Programs run nearly full speed • Low performance overhead
• Low memory overhead • Efficient memory usage
MemoryScape Features
• Memory Corruption Detection • Guard Blocks & Red Zones
• Leak detection
• Dangling pointer detection
• View the heap
• Memory Hoarding
• Memory Comparisons between processes
Using MemoryScape on Edison and Harper
• load module totalview
• There is a catch……
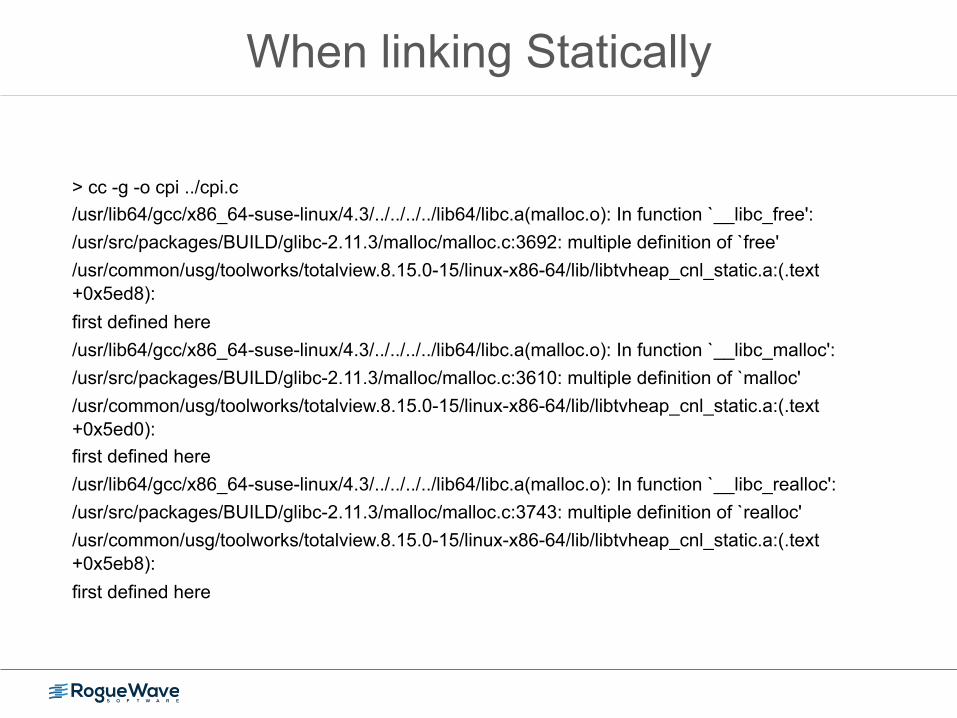
When linking Statically
> cc -g -o cpi ../cpi.c /usr/lib64/gcc/x86_64-suse-linux/4.3/../../../../lib64/libc.a(malloc.o): In function `__libc_free': /usr/src/packages/BUILD/glibc-2.11.3/malloc/malloc.c:3692: multiple definition of `free' /usr/common/usg/toolworks/totalview.8.15.0-15/linux-x86-64/lib/libtvheap_cnl_static.a:(.text+0x5ed8): first defined here /usr/lib64/gcc/x86_64-suse-linux/4.3/../../../../lib64/libc.a(malloc.o): In function `__libc_malloc': /usr/src/packages/BUILD/glibc-2.11.3/malloc/malloc.c:3610: multiple definition of `malloc' /usr/common/usg/toolworks/totalview.8.15.0-15/linux-x86-64/lib/libtvheap_cnl_static.a:(.text+0x5ed0): first defined here /usr/lib64/gcc/x86_64-suse-linux/4.3/../../../../lib64/libc.a(malloc.o): In function `__libc_realloc': /usr/src/packages/BUILD/glibc-2.11.3/malloc/malloc.c:3743: multiple definition of `realloc' /usr/common/usg/toolworks/totalview.8.15.0-15/linux-x86-64/lib/libtvheap_cnl_static.a:(.text+0x5eb8): first defined here
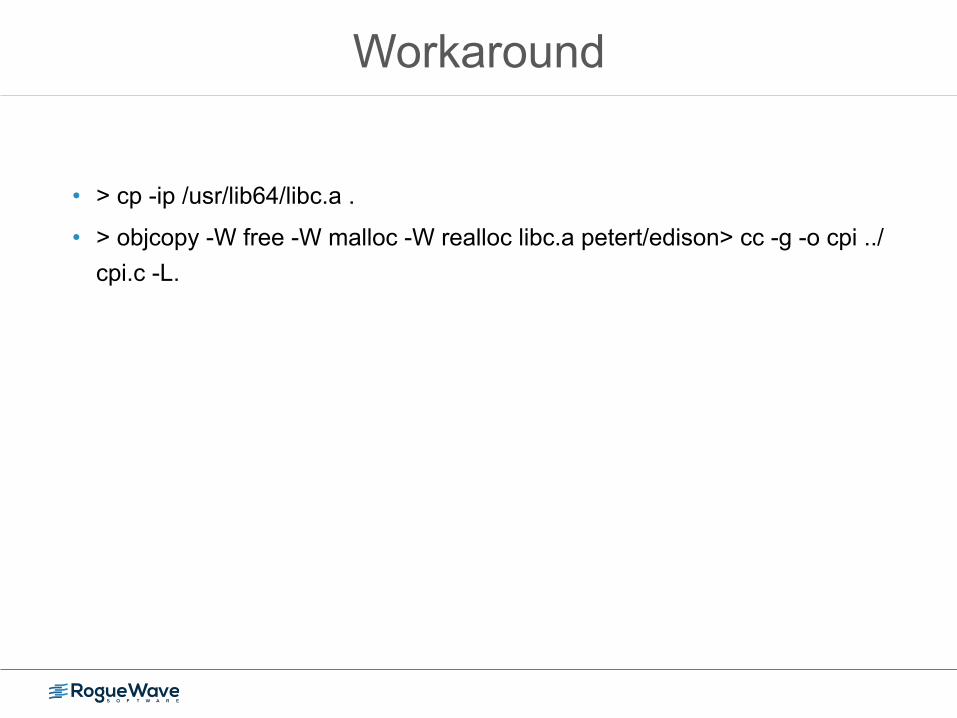
Workaround
• > cp -ip /usr/lib64/libc.a .
• > objcopy -W free -W malloc -W realloc libc.a petert/edison> cc -g -o cpi ../cpi.c -L.
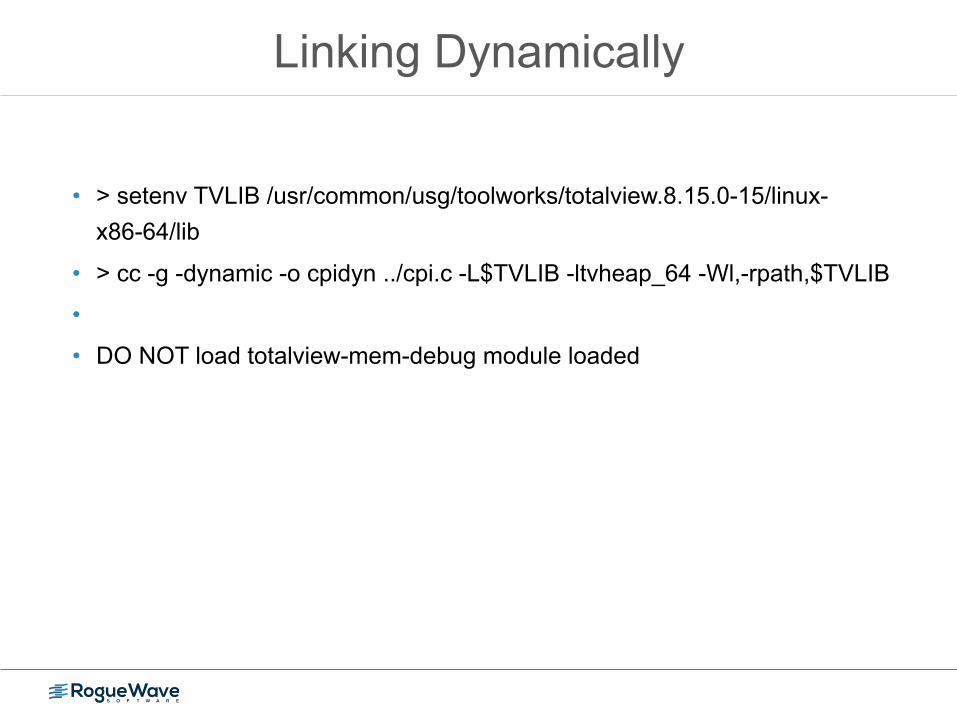
Linking Dynamically
• > setenv TVLIB /usr/common/usg/toolworks/totalview.8.15.0-15/linux-x86-64/lib
• > cc -g -dynamic -o cpidyn ../cpi.c -L$TVLIB -ltvheap_64 -Wl,-rpath,$TVLIB
•
• DO NOT load totalview-mem-debug module loaded
Summary
• C, C++ and Fortran developers need a way to understand the runtime behavior of their programs
– When troubleshooting, when porting code, adding features, scaling, tuning or optimizing
• The solution Rogue Wave has to this is TotalView – TotalView is a source code debugger for Linux Unix and Mac which gives
users visibility into and control over runtime execution – TotalView is especially compelling for users dealing with complex code,
concurrency (multi-core or clusters), and computational accelerators
• With this solution Rogue Wave offers companies lower development costs, lower risk, and higher quality
– We offer developers the ability to code confidently
Demonstration