Embed Size (px)
Citation preview

Introduction to the QuanX

Energy-Dispersive X-ray Fluorescence Spectrometry
TheoryIntroduction
Overview: Theory Presentation
EDS overviewBasic overviewHistory of X-ray spectrometryAtomic Structure and XRFProperties of X-raysSource – sample interactionEDXRF instrumentationX-ray detection processAnalysis considerationsReview of statistics

EDXRF Basic Overview

X-Ray Fluorescence
Source - Sample Interaction
An Incoming x-ray photon strikes an electron, the electron breaks free and leaves the atom.
An electron from a higher energy replaces the electron, the electron releases energy (fluoresces) as it drops in the form of an x-ray photon.
x-ray photon

EDXRF Basic Overview
Atoms within the sample are excited by a stream of x-rays.Excited atoms return to ground state by emitting x-rays.The detector and multi-channel analyzer collect x-ray energy pulses as counts in a spectrum.Elements from Na to U on the Periodic Table can be detected.Peak intensities are related to element concentration.
What happens in XRF analysis?

Properties of X-Rays
E is the Energy of the radiation
F is the Frequency of the radiationc is the speed of light 3 x 1010 cm/second
λ is the Wavelength of the radiation
h is Planck’s constant 4.135 x 10⁻¹⁵ eV-sec = 6.625 x 10⁻²⁷ erg-sec
The relationship between Energy, Frequency, and Wavelength may be expressed by one formula:

EDXRF Spectrum
Note that the EDXRF spectrum is plotted on an energy scale that is reversed compared to a WDXRF spectrum

EDXRF Instrumentation
Schematic overview

X-Ray excitation sourcesIsotopes
Clean radiation source.Monochromatic, low background, easier quantitation.
X-Ray tubesMore versatile than isotopes.Higher flux.No decay.Produce less background than direct electron sources.Better signal to noise ratio.1% of energy is converted into x-rays; the remaining 99% is converted to heat.
Typical x-ray tube
EDXRF Instrumentation

Tube Voltage:
Tube Current:
Tube Voltage (kV) = Energy Max (keV)
Intensity proportional to mA
Set higher than highest absorption edge energy
Adjust to 50% Deadtime
Intensity proportional to KV 2
EDXRF Instrumentation
Tube Voltage Parameters

Rh CharacteristicL lines (2.696 keV)
Energy (keV)
Bremsstrahlung(continuum)
X-rayCounts
0 2 4 8 106
Rhodium X-ray TubeTube Voltage: 10 kVNo FilterPolyester Sample
X-ray Tube Output Spectrum
EDXRF Instrumentation

Rh L line from X-ray Tube Cellulose
Filter
Na - S Cl - Sc
10 kVRh TubePolyester
2 40 6 8 10 keVTi - Cu detected
No Filter
No Filter vs. Cellulose Filter
EDXRF Instrumentation

Use of primary beam filter to reduce scatter tube continuum
EDXRF Instrumentation

SemiconductorElectric potentialAbsorbed x-rays result in charge which results in pulse FET (field effect transistor) collects charge, integrates to derive
voltage pulseLiquid Nitrogen or Peltier cooling is used to reduce thermal noisePeaks are approximately GaussianResolution increases with energy
EDS detector characteristics
EDXRF Instrumentation

EDXRF Instrumentation
Detector specifications: resolution
Detectors are evaluated on spectral resolution.
Full width half maximum(FWHM) at Mn is the industry standard.

Intrinsic semiconductors will not conduct current in an applied
electric field unless it absorbs energy causing electrons to be promoted to the conductance
band.
Pell (1960) added Li at elevated temperatures at reverse bias and created
the Si(Li) crystal
Lithium drifted Silicon detector
EDXRF Instrumentation

X-ray Detection Process

X-Ray Detection Process
X-Ray conversion

X-Ray Detection Process
Pulse pile up rejectionLeading edge pile up occurs when two pulses arrive in the
processor at the same time and the event peaks are too close to each other chronologically to be distinguished.
Trailing edge pile up occurs when event peaks are separated sufficiently to allow the second event to be rejected.

Fe (6.403 keV)
Crystal
12.8 keV
Sum Peak = Fe + Fe
Iron sum peak example:
Fe (6.403 keV)
Spectral artifacts: sum peaksArise when 2 or more x-
rays enter the detector crystal at exactly the same time.
Made up of integer multiples of the parent peak.
Can be reduced by keeping count rates low, generally lower than 30% deadtime.
X-Ray Detection Process
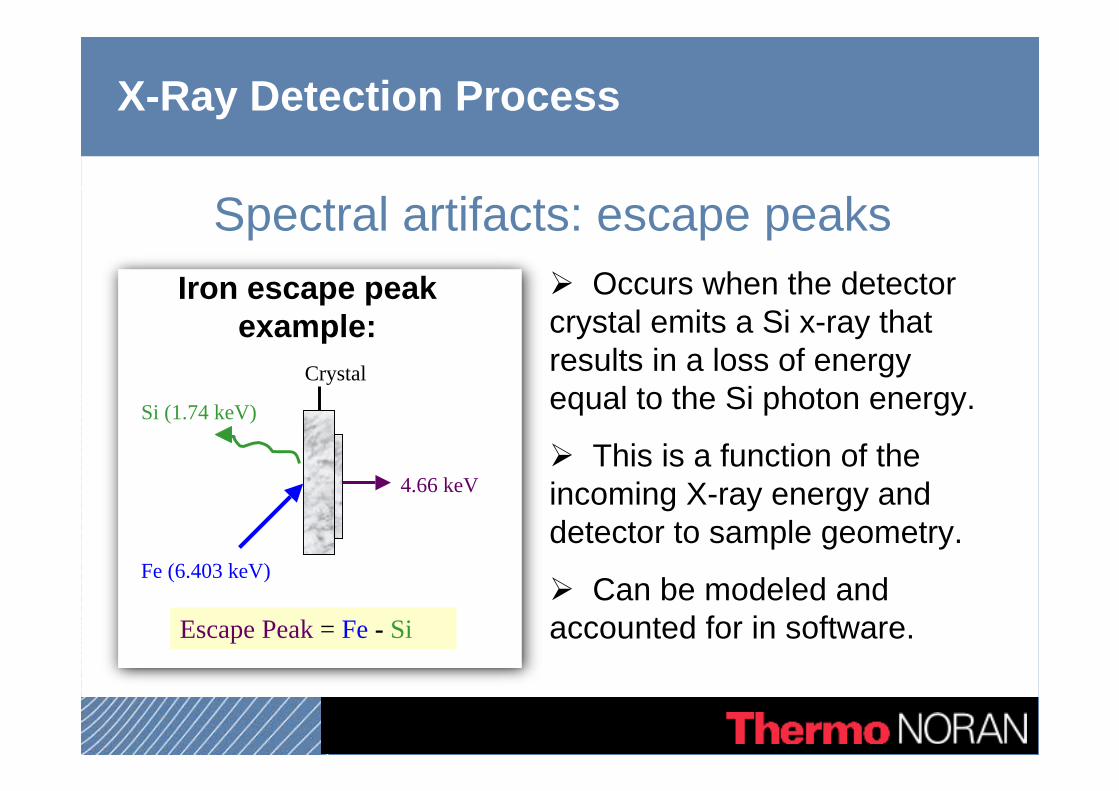
Fe (6.403 keV)
Crystal
4.66 keV
Si (1.74 keV)
Escape Peak = Fe - Si
Spectral artifacts: escape peaksIron escape peak
example:Occurs when the detector
crystal emits a Si x-ray that results in a loss of energy equal to the Si photon energy.
This is a function of the incoming X-ray energy and detector to sample geometry.
Can be modeled and accounted for in software.
X-Ray Detection Process

X-Ray Detection Process
Spectrum artifactsEscape peaks at 1.74 KeV below parent peakSum peaks at double the value of major peak or at combined
values of any large peaksArgon peaks (eliminated by vacuum)Compton and Rayleigh Scatter peaks from from tube characteristic
lines Scatter from tube, e.g.: trace of Cu (eliminated by filters)

X-Ray Detection Process
Causes of Dead Time include: Peak pile-up rejection circuitry.The FET reset process.The signal conversion process.The ADC / MCS analysis process
time.
Influenced by incoming count rate and pulse processor rate
(time constant).Livetime + Deadtime = Total Acquisition Time
DeadtimeA measure of the period of
time in which the system is unable to accept another signal for processing
X-Ray Detection Process
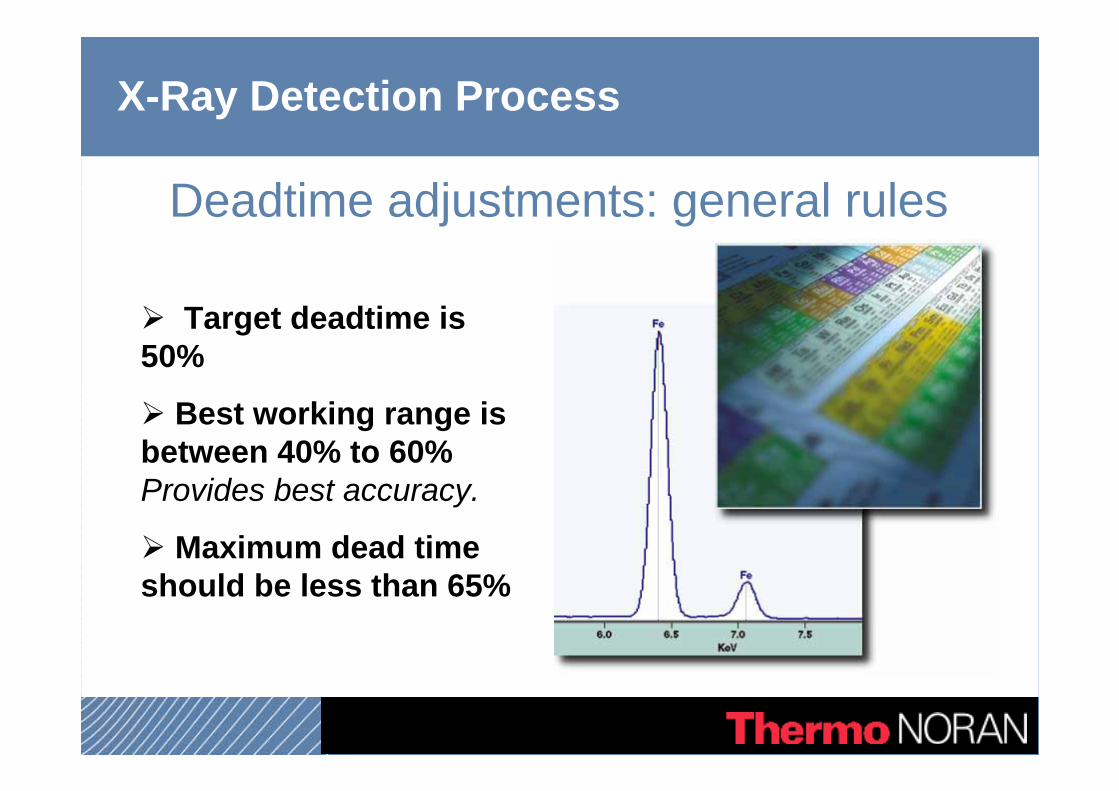
Deadtime adjustments: general rules
Target deadtime is 50%
Best working range is between 40% to 60% Provides best accuracy.
Maximum dead time should be less than 65%
Analysis Considerations
Analysis Considerations
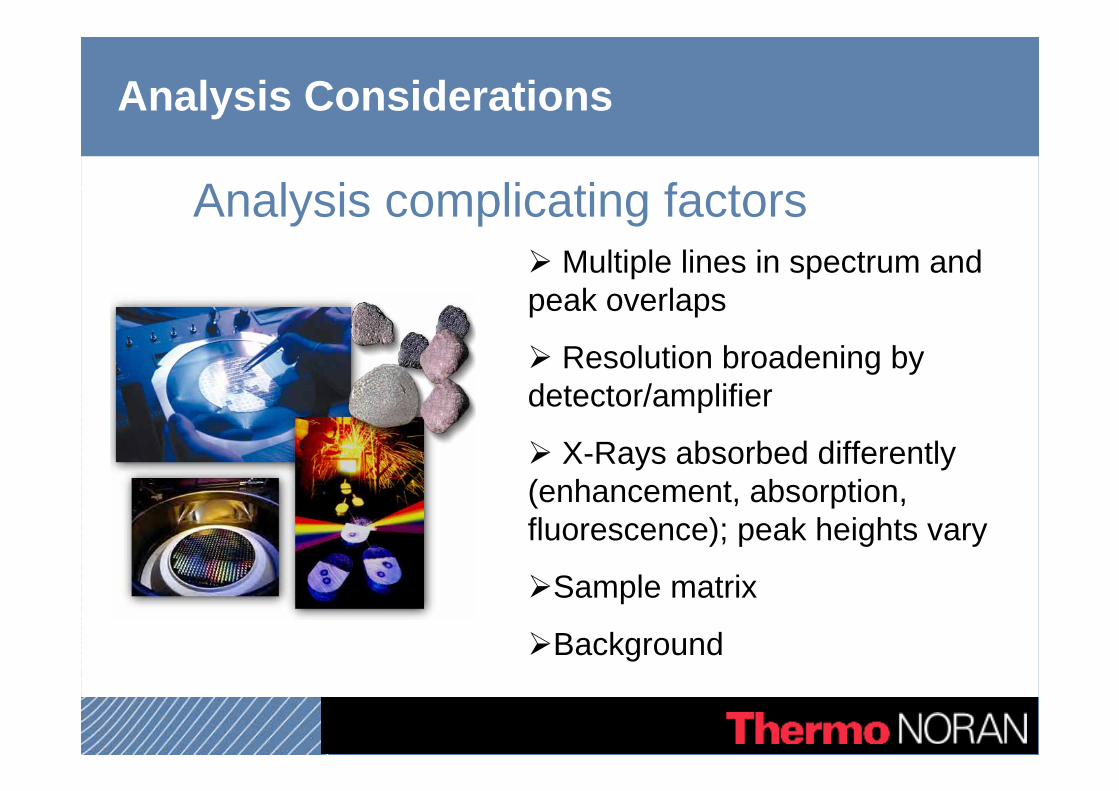
Analysis complicating factorsMultiple lines in spectrum and
peak overlaps
Resolution broadening by detector/amplifier
X-Rays absorbed differently (enhancement, absorption, fluorescence); peak heights vary
Sample matrix
Background

Analysis Considerations
Common peak overlapsElement
Ti KbV KbCr KbMn KbFe Kb
Pb MaPb LaSi KaBa LaBr La
OverlapV KaCr KaMn KaFe KaCo Ka
S Ka, Mo LaAs Ka
W, Ta MaTi KaAl Ka

Analysis Considerations
Peak overlaps

Analysis Considerations
Vacuum, air, helium flushAtomic number 20 and greater
Analyze in air to reduce light element sensitivityArgon peak may be present
Atomic number 20 and lowerAnalyze in vacuum; reduces air scattering and significantly improves light element sensitivityRemoves Argon peak
Liquid Samples Atomic number 20 and lowerNever use vacuumUse helium flush for elements below atomic number 22 and to remove argon peaksWill cause scatter of light elements, especially Al
Powder samplesMay use vacuum if special sample cup or film is used

Review of Statistics
The standard deviation of a Poisson distribution is:
The relative standard deviation for a Poisson distributions is:
where = number of counts
Relative error can also be expressed at higher levels of confidence by substituting 2σ or 3σ for σ in the equation
for relative standard deviation.
Evaluating intensity: counting errorThe confidence in the accuracy of our estimate can be no
greater than the width of the Poisson distribution.

Review of Statistics
• For 99% (3σ) confidence level, a peak count of 100 yields + 30% error.•For 99% (3σ) confidence level, a peak count of 10,000 yields + 3% error.
Evaluating PrecisionIf we have a peak comprising of 100 individual x-ray counts, the counting error is expected to be:
If we have a peak comprising of 10,000 individual x-ray counts, the counting error is expected to be:

Review of Statistics
Minimum detection limitsIn EDXRF, we are often asked to determine the MDL
o(or LLD - Lower Limit of Detection). This parameter is concerned with the intensity of the X-ray signal above the background signal. This value is calculated using the formula:
( ) ( )tPBCMDL 13 ⋅⋅⋅=

Detection Limits
Detection Limits ExampleThe LLDs for EDXRF are sometimes limited high count rate of scatter or elements that are not of interest.
Use of the High count rate setting can sometimes improve LLDs
Ni LLDLow CRR 0.75High CRR 0.64