Embed Size (px)
Citation preview
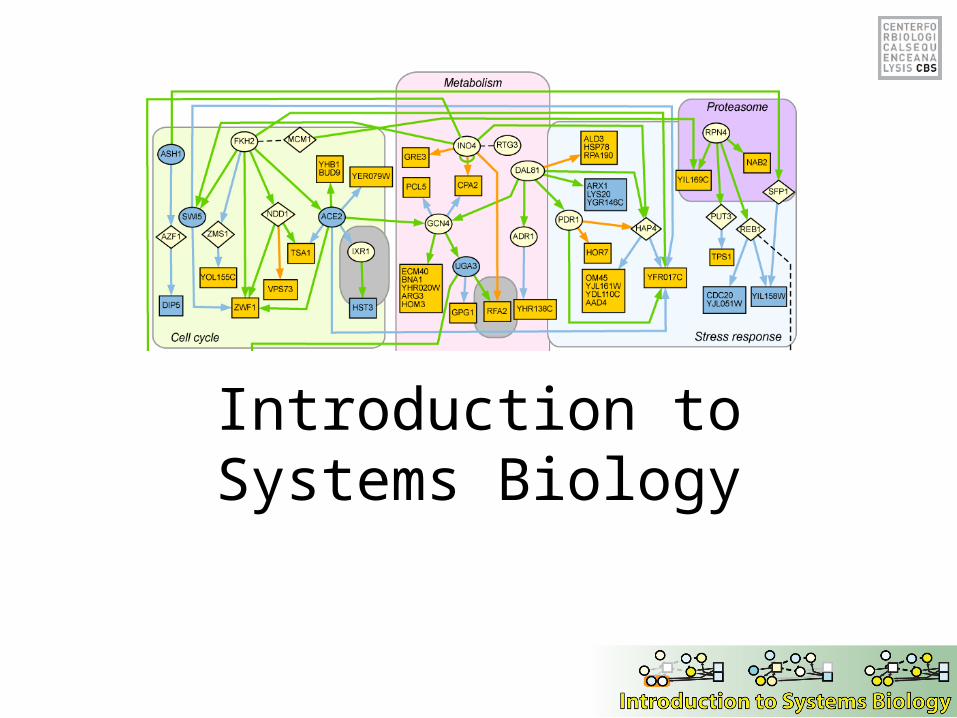
Introduction to Systems Biology
Overview of the day
• Background & Introduction
• Network analysis methods
• Case studies
• Exercises
Why Systems Biology?
…and why now?
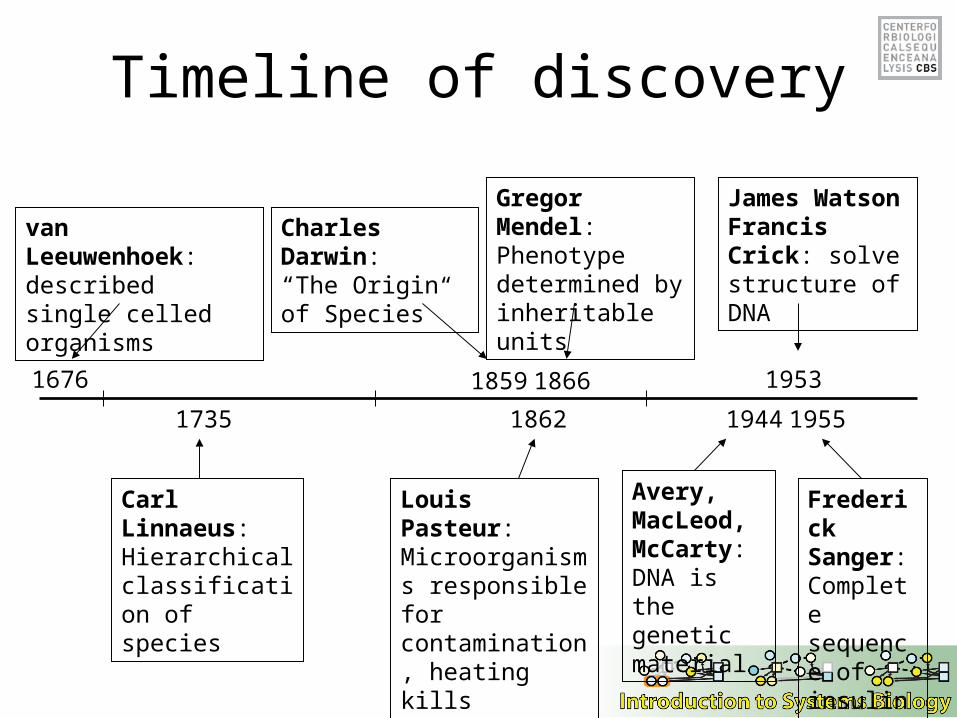
Timeline of discovery
1862
Louis Pasteur:Microorganisms responsible for contamination, heating kills microorganisms
van Leeuwenhoek: described single celled organisms
1676 1866
Gregor Mendel:Phenotype determined by inheritable units
1735
Carl Linnaeus:Hierarchical classification of species
1859
Charles Darwin:“The Origin of Species”
1944
Avery, MacLeod, McCarty: DNA is the genetic material
1953
James Watson Francis Crick: solve structure of DNA
Frederick Sanger: Complete sequence of insulin
1955
Frederick Sanger
In 1975, he developed the chain termination method of DNA sequencing, also known as the Dideoxy termination method or the Sanger method. Two years later he used his technique to successfully sequence the genome of the Phage Φ-X174; the first fully sequenced genome. This earned him a Nobel Prize in Chemistry (1980) (his second)
– Sanger earned his first Nobel prize in Chemistry (1958) for determining the complete amino acid sequence of insulin in 1955. Concluded that insulin had a precise amino acid sequence.
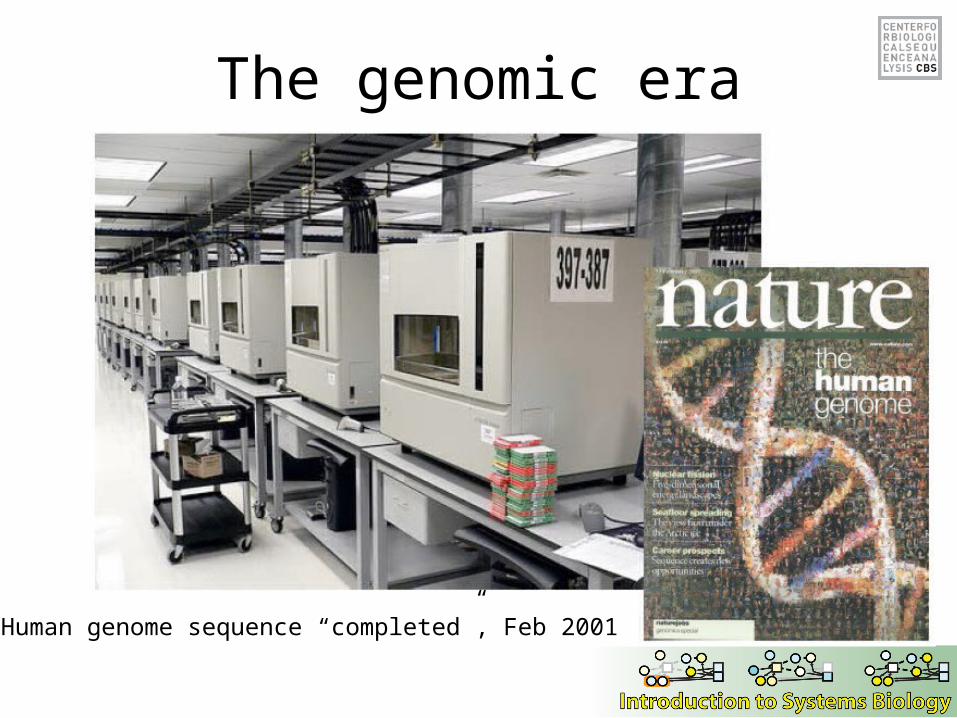
The genomic era
Human genome sequence “completed”, Feb 2001
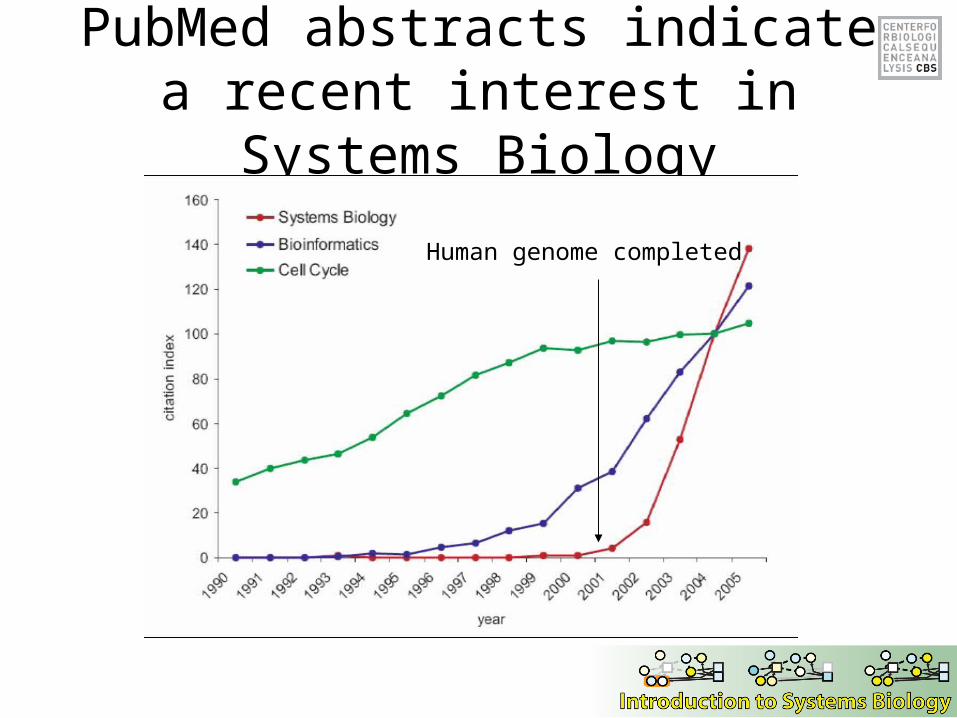
PubMed abstracts indicate a recent interest in Systems Biology
Human genome completed
High-throughput sequencing
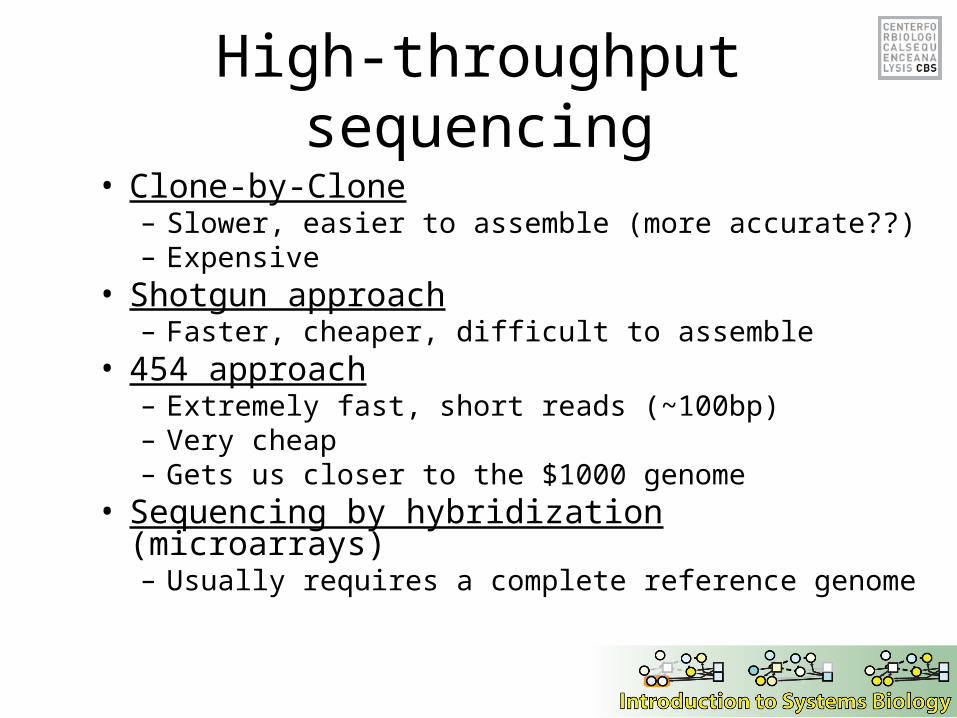
• Clone-by-Clone– Slower, easier to assemble (more accurate??)– Expensive
• Shotgun approach– Faster, cheaper, difficult to assemble
• 454 approach– Extremely fast, short reads (~100bp)– Very cheap – Gets us closer to the $1000 genome
• Sequencing by hybridization (microarrays)– Usually requires a complete reference genome
Functional genomics
• Study of Genomes is called “Genomics”
• Genomics led to Functional Genomics which aims to characterize and determine the function of biomolecules (mainly proteins), often by the use of high-throughput technologies.
• Today, people talk about:– Genomics– Transcriptomics– Proteomics– Metabolomics– [Anything]omics
DNA microarray overview
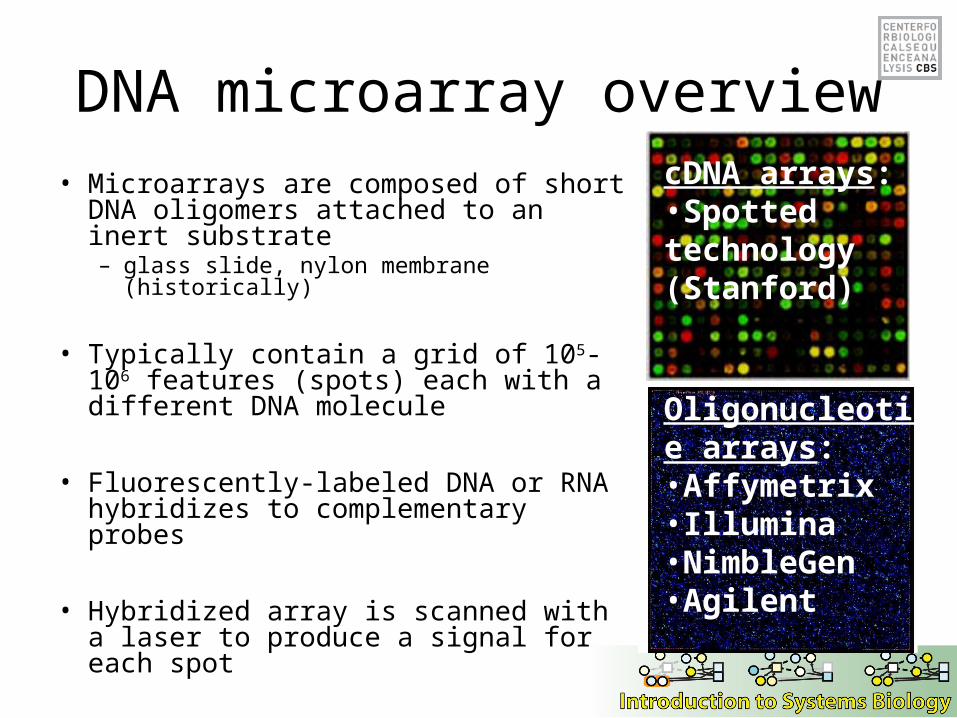
• Microarrays are composed of short DNA oligomers attached to an inert substrate– glass slide, nylon membrane (historically)
• Typically contain a grid of 105-106 features (spots) each with a different DNA molecule
• Fluorescently-labeled DNA or RNA hybridizes to complementary probes
• Hybridized array is scanned with a laser to produce a signal for each spot
cDNA arrays:•Spotted technology (Stanford)
Oligonucleotide arrays:•Affymetrix•Illumina•NimbleGen •Agilent
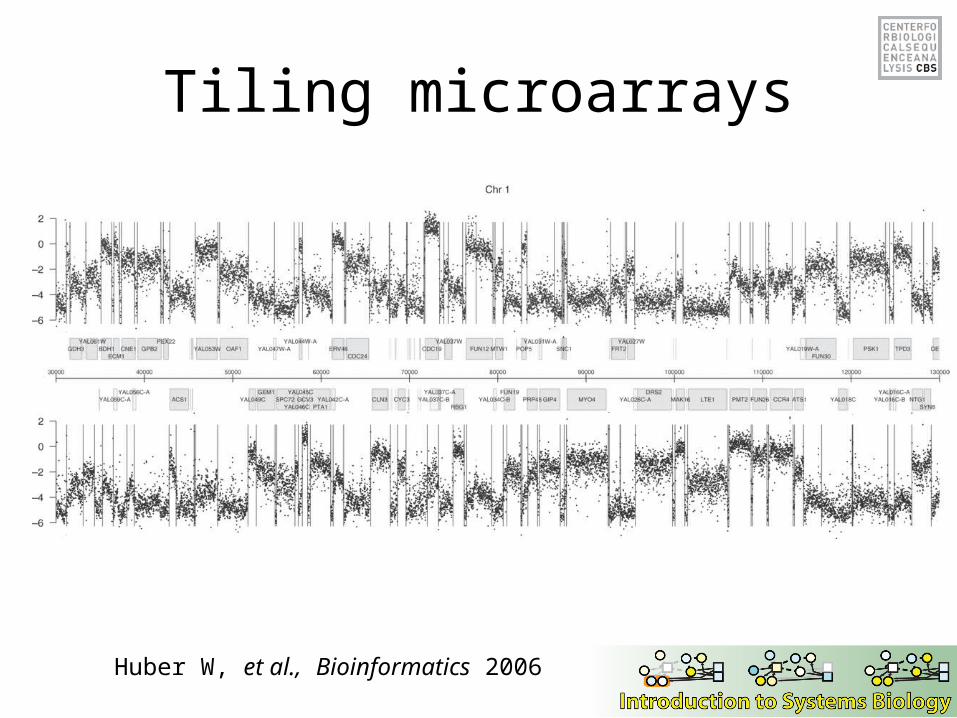
Tiling microarrays
Huber W, et al., Bioinformatics 2006
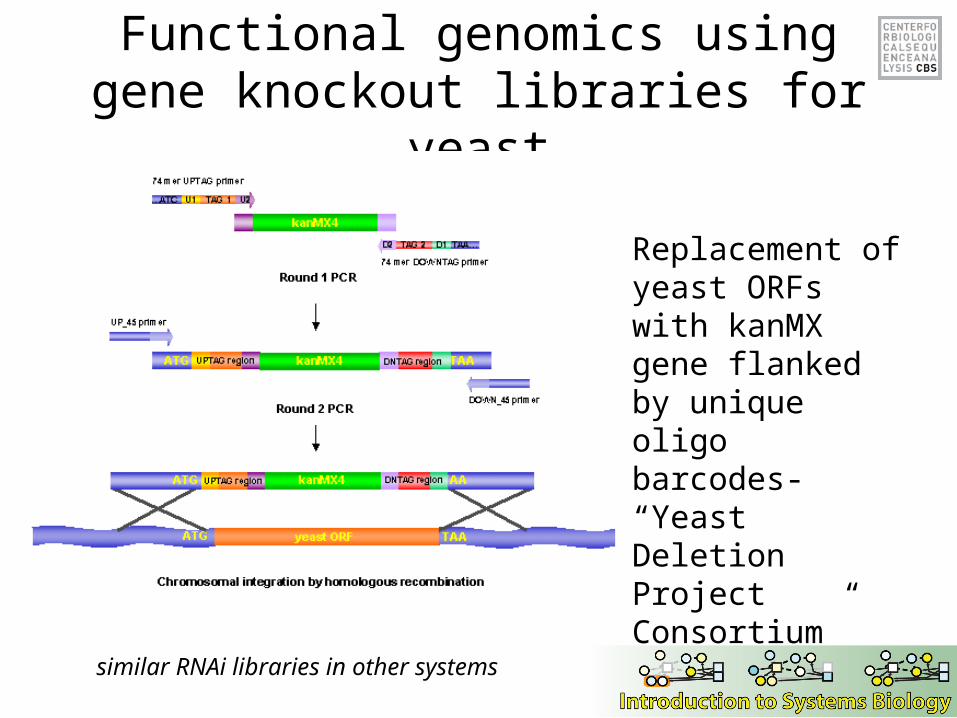
Functional genomics using gene knockout libraries for yeast
similar RNAi libraries in other systems
Replacement of yeast ORFs with kanMX gene flanked by unique oligo barcodes- “Yeast Deletion Project Consortium”
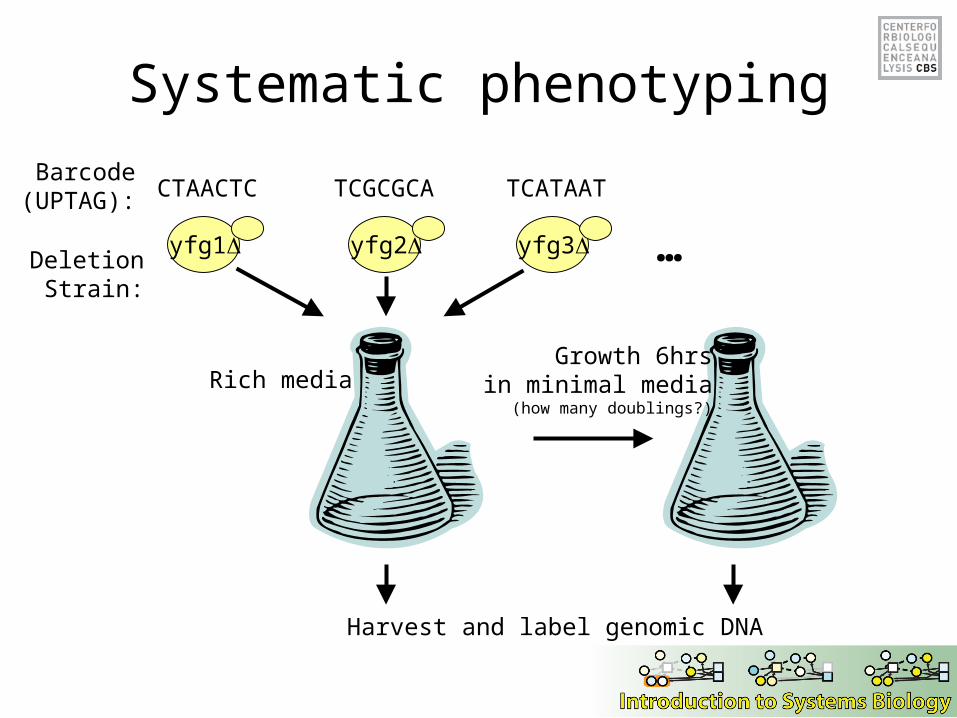
Systematic phenotyping
yfg1 yfg2 yfg3
CTAACTC TCGCGCA TCATAATBarcode
(UPTAG):
DeletionStrain:
Growth 6hrsin minimal media
(how many doublings?)
Rich media
…
Harvest and label genomic DNA
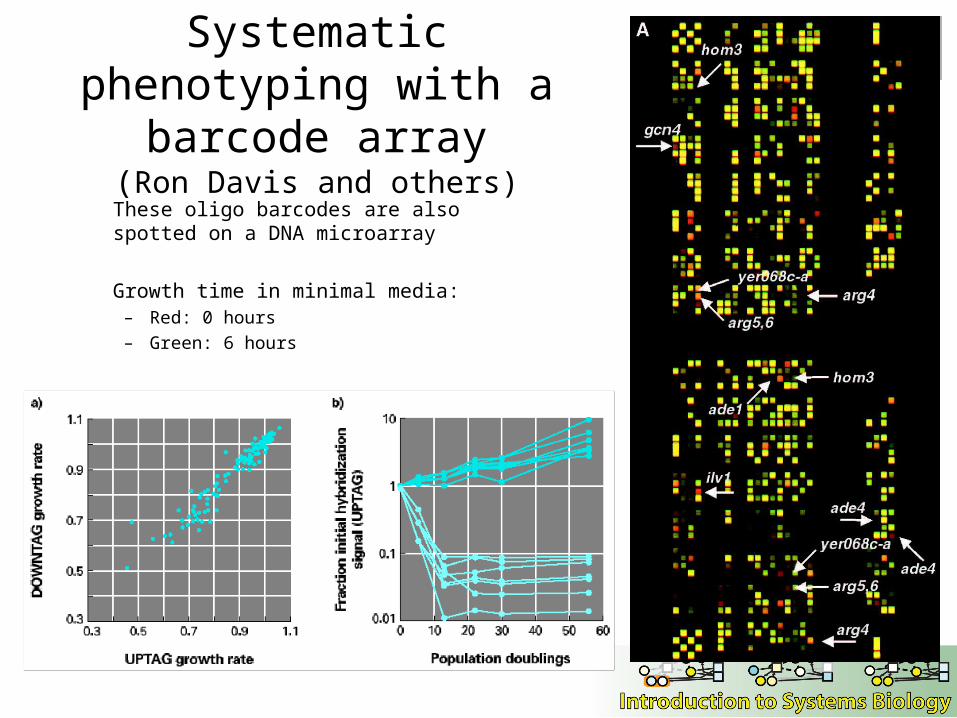
Systematic phenotyping with a barcode array
(Ron Davis and others)
These oligo barcodes are also spotted on a DNA microarray
Growth time in minimal media:– Red: 0 hours– Green: 6 hours
High-throughput applications of microarrays
• Gene expression• De novo DNA sequencing (short)• DNA re-sequencing (relative to reference)• SNP analysis• Competitive growth assays• chIP-chip (interaction data)
• Array CGH• Whole genome tiling arrays
Mass spectrometry
• Peptide identification
• Relative peptide levels
• Protein-protein interactions (complexes)
• Many many technologies
MudPIT (Multidimensional Protein Identification Technology)
• MudPIT describes the process of digesting, separating, and identifying the components of samples consisting of thousands of proteins.
• Separates peptides by 2D liquid chromatography (cation-exchange followed by reversed phase liquid chromotography)
• LC interfaced directly with the ion source (microelectrospray) of a mass spectrometer
John Yates labhttp://fields.scripps.edu/mudpit/index.html
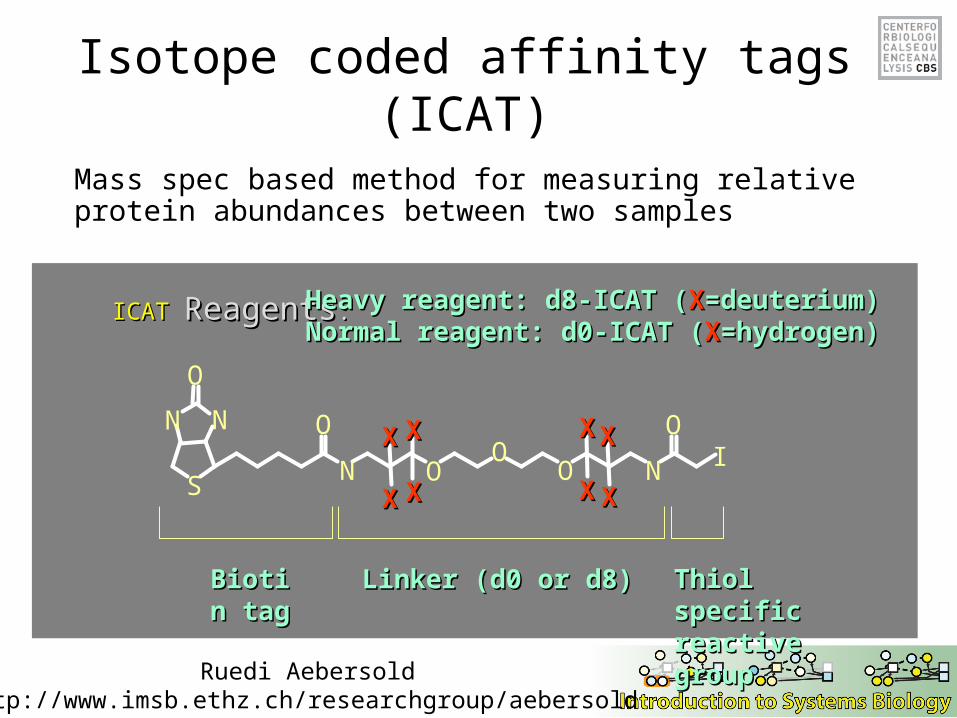
Isotope coded affinity tags (ICAT)
Biotin Biotin tagtag
Linker (d0 or d8)Linker (d0 or d8) Thiol specific Thiol specific reactive groupreactive group
ICATICAT ReagentsReagents:: Heavy reagent: d8-ICATHeavy reagent: d8-ICAT ((XX=deuterium)=deuterium)Normal reagent: d0-ICAT (Normal reagent: d0-ICAT (XX=hydrogen)=hydrogen)
S
N N
O
N OO
O N IO OXX
XX
XX
XX
XX
XX
XX
XX
Mass spec based method for measuring relative protein abundances between two samples
Ruedi Aebersoldhttp://www.imsb.ethz.ch/researchgroup/aebersold
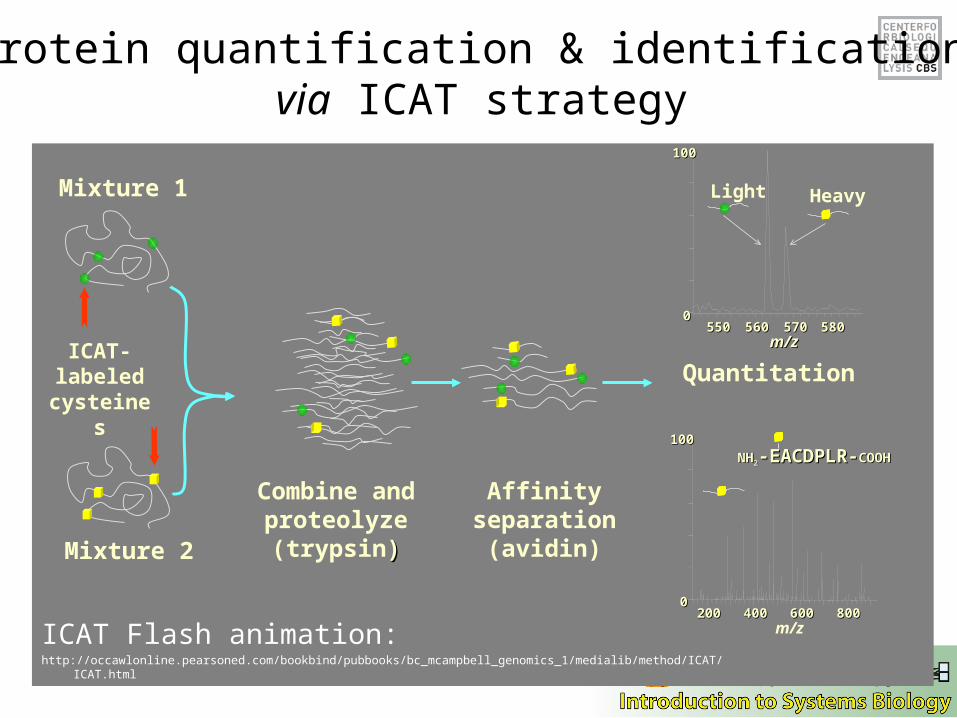
Combine and proteolyze(trypsin))
Affinity separation
(avidin)
ICAT-labeled
cysteines
550550 560560 570570 580580m/zm/z
00
100100
200200 400400 600600 800800m/z
00
100100
NHNH22-EACDPLR--EACDPLR-COOHCOOH
Light Heavy
Mixture 2
Mixture 1
Protein quantification & identification via ICAT strategy
Quantitation
ICAT Flash animation:http://occawlonline.pearsoned.com/bookbind/pubbooks/bc_mcampbell_genomics_1/medialib/method/ICAT/ICAT.html
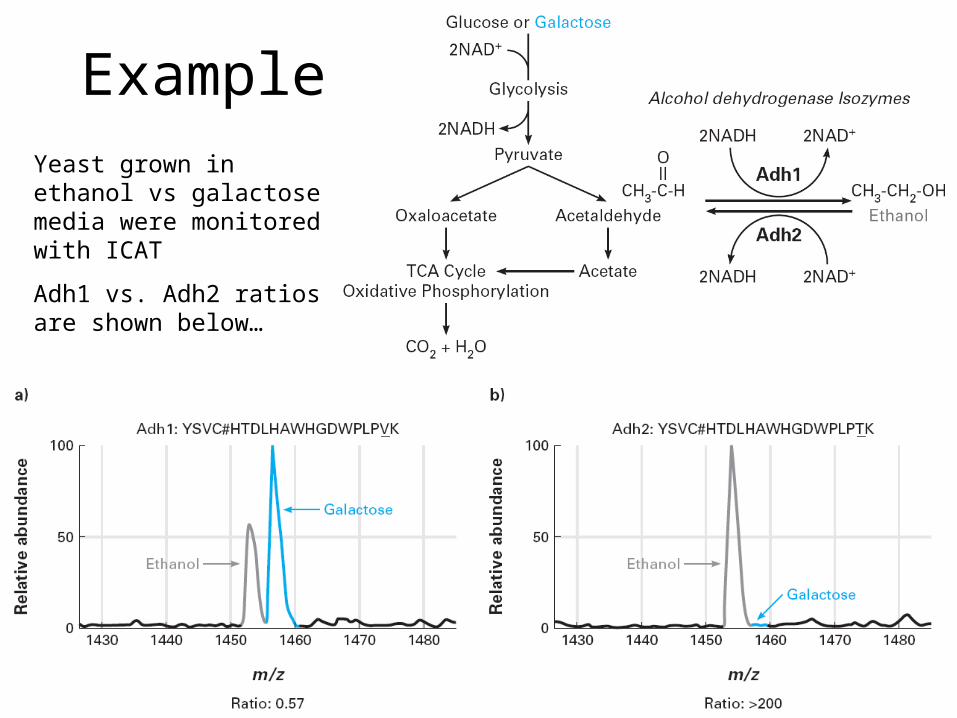
ExampleYeast grown in ethanol vs galactose media were monitored with ICAT
Adh1 vs. Adh2 ratios are shown below…
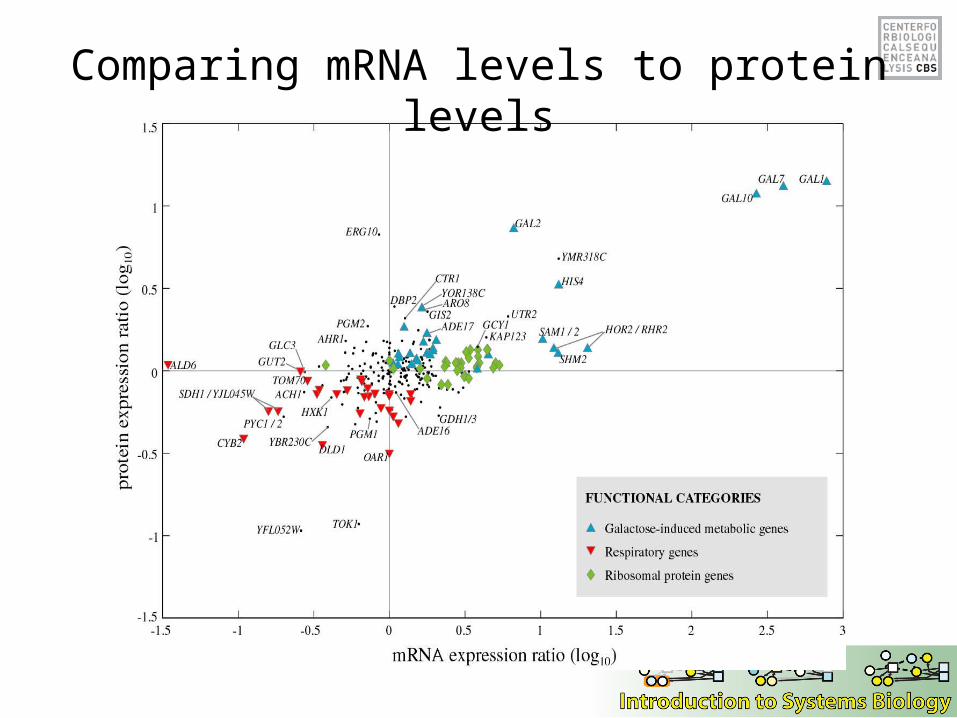
Comparing mRNA levels to protein levels
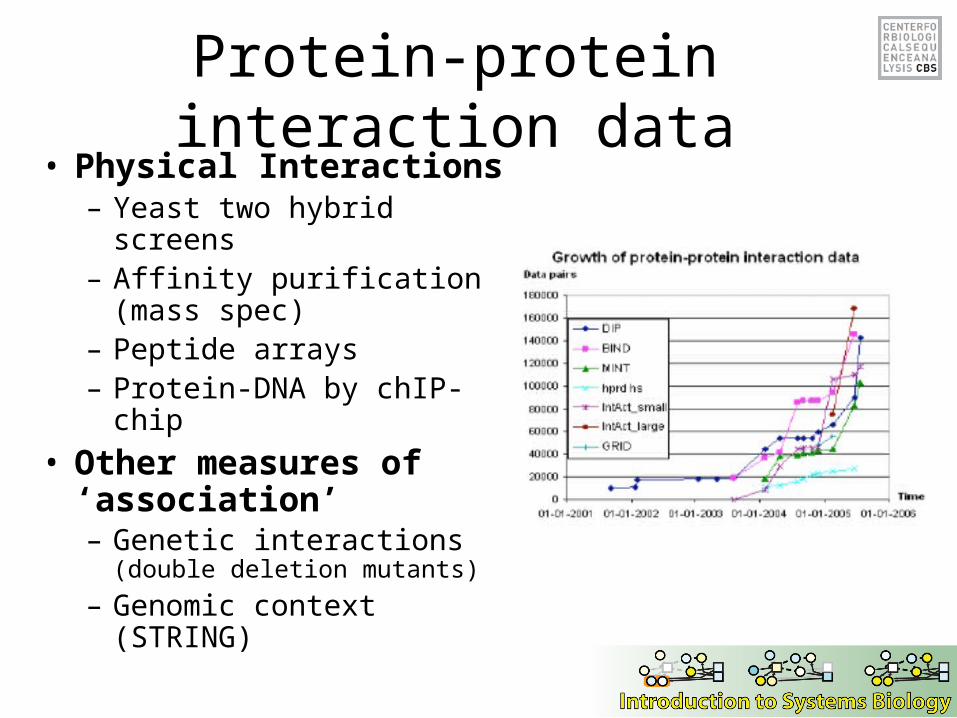
Protein-protein interaction data• Physical Interactions
– Yeast two hybrid screens– Affinity purification (mass
spec)– Peptide arrays– Protein-DNA by chIP-chip
• Other measures of ‘association’– Genetic interactions (double
deletion mutants)
– Genomic context (STRING)
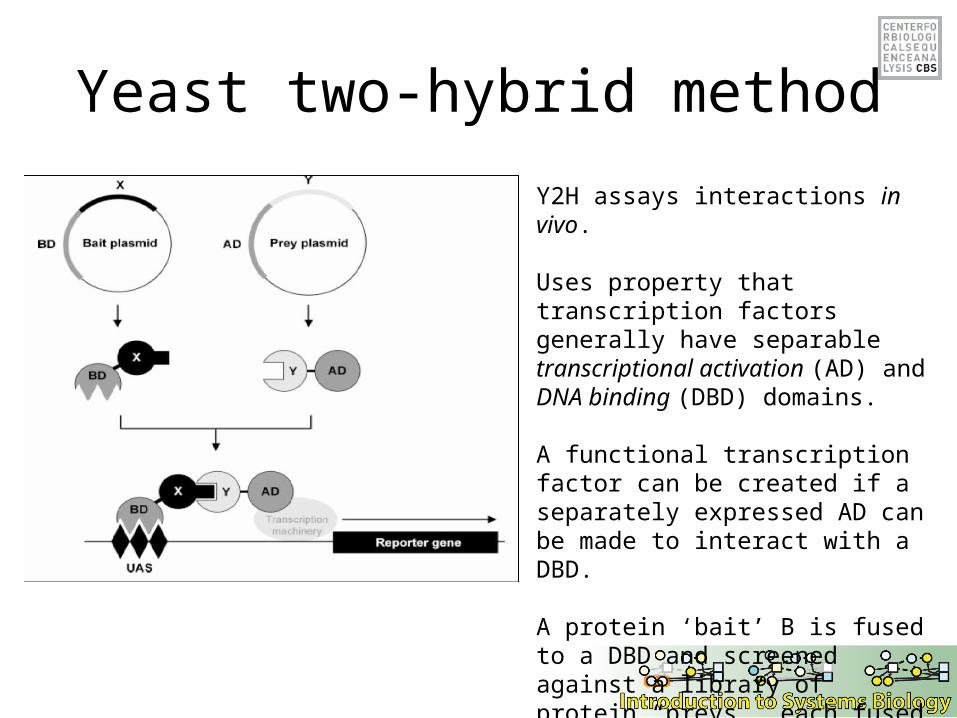
Yeast two-hybrid method
Y2H assays interactions in vivo.
Uses property that transcription factors generally have separable transcriptional activation (AD) and DNA binding (DBD) domains.
A functional transcription factor can be created if a separately expressed AD can be made to interact with a DBD.
A protein ‘bait’ B is fused to a DBD and screened against a library of protein “preys”, each fused to a AD.
Issues with Y2H
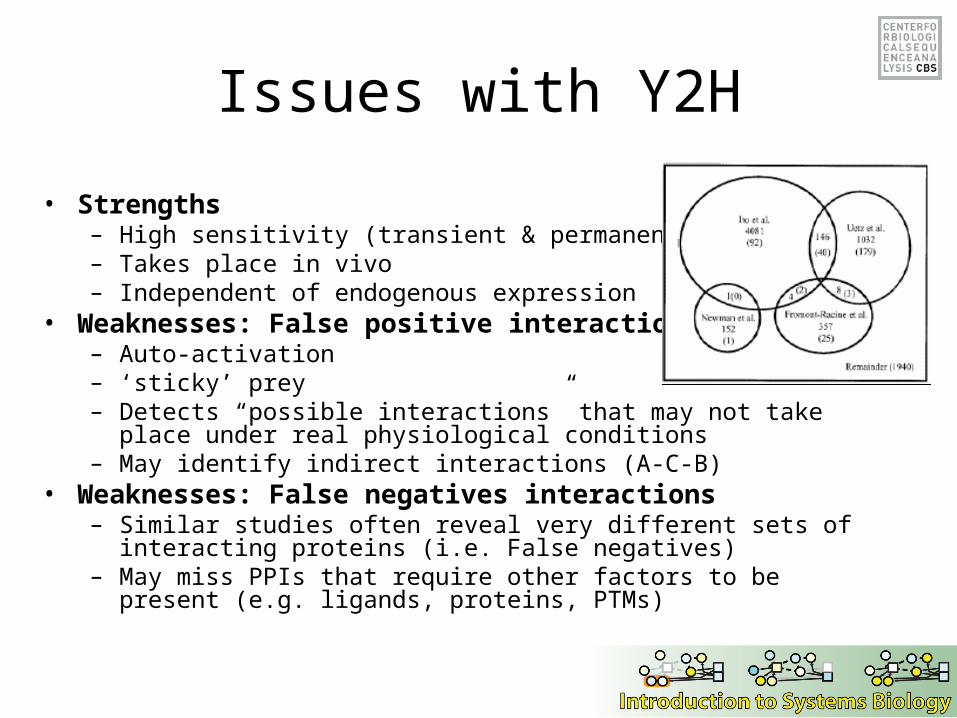
• Strengths– High sensitivity (transient & permanent PPIs)– Takes place in vivo– Independent of endogenous expression
• Weaknesses: False positive interactions– Auto-activation– ‘sticky’ prey– Detects “possible interactions” that may not take place under real
physiological conditions– May identify indirect interactions (A-C-B)
• Weaknesses: False negatives interactions– Similar studies often reveal very different sets of interacting proteins (i.e.
False negatives)– May miss PPIs that require other factors to be present (e.g. ligands,
proteins, PTMs)
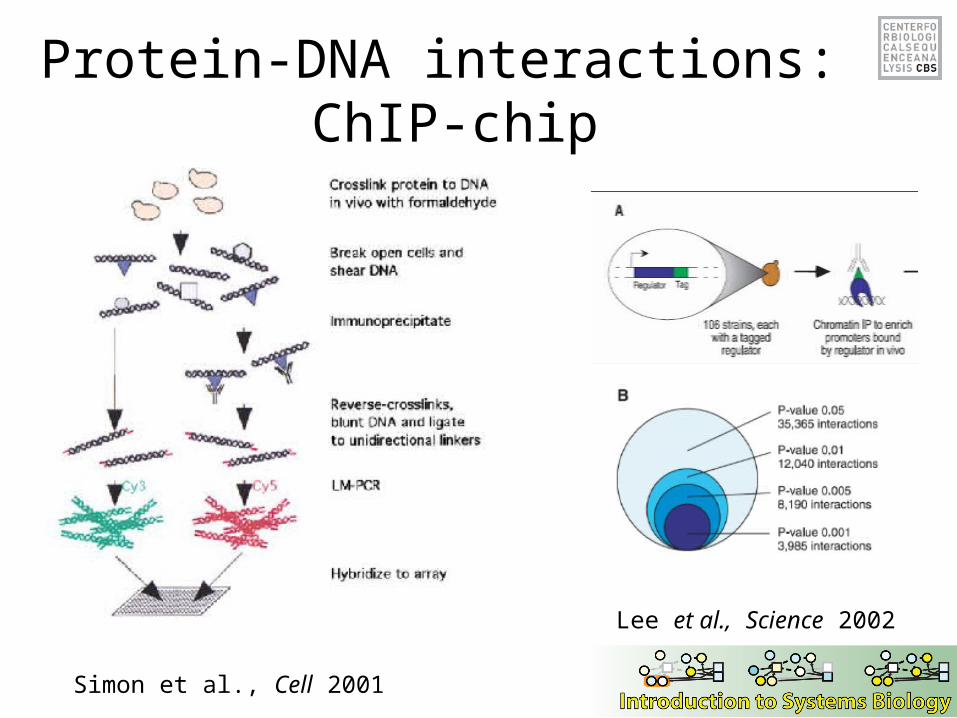
Protein-DNA interactions: ChIP-chip
Simon et al., Cell 2001
Lee et al., Science 2002
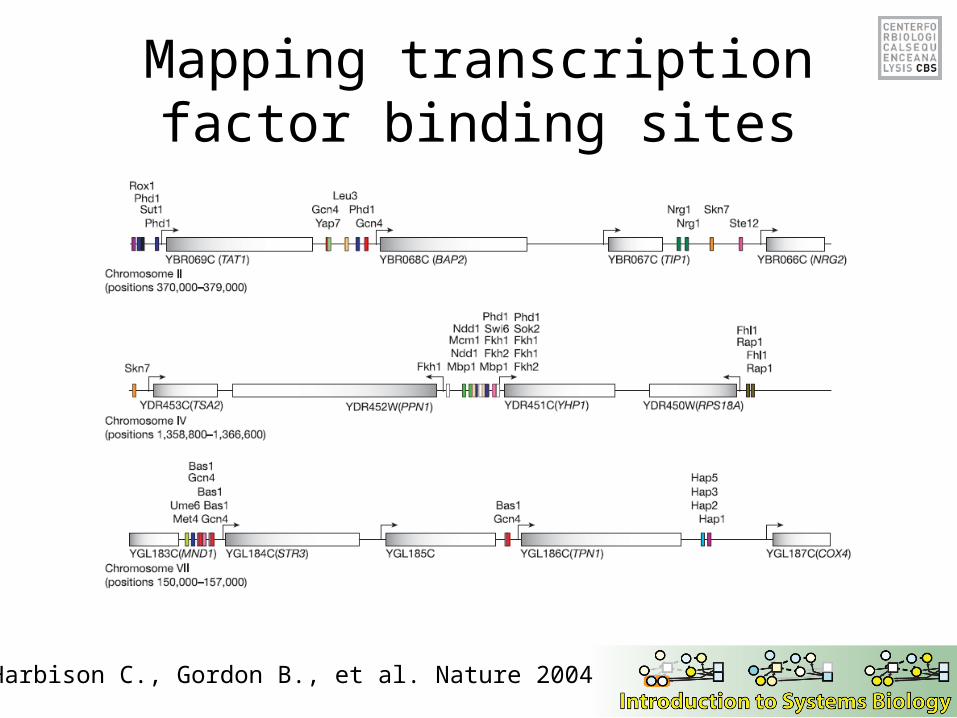
Mapping transcription factor binding sites
Harbison C., Gordon B., et al. Nature 2004
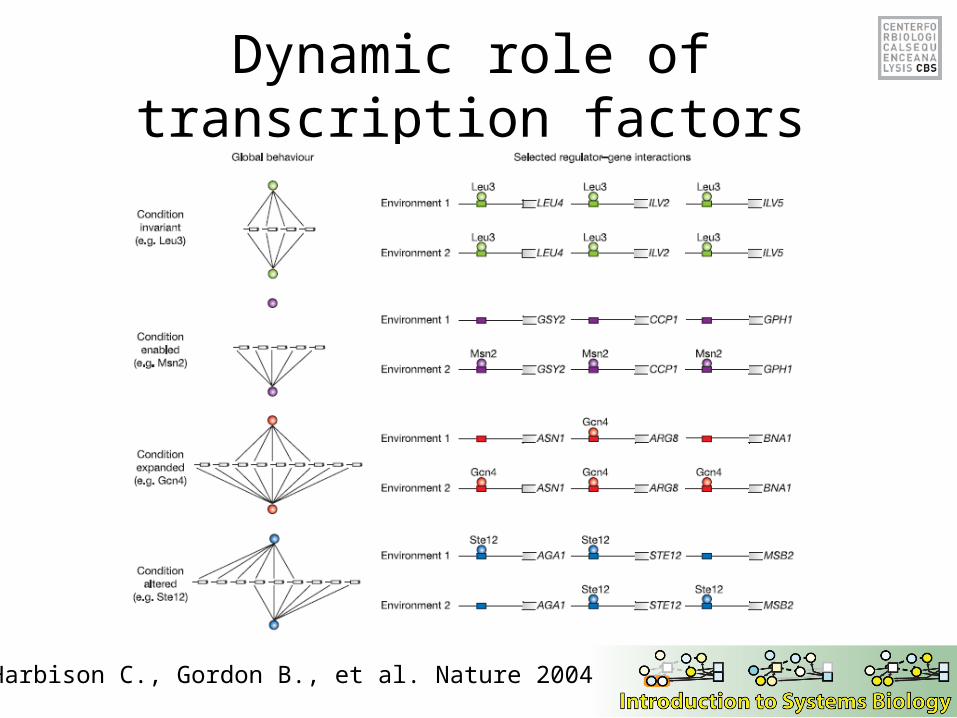
Dynamic role of transcription factors
Harbison C., Gordon B., et al. Nature 2004
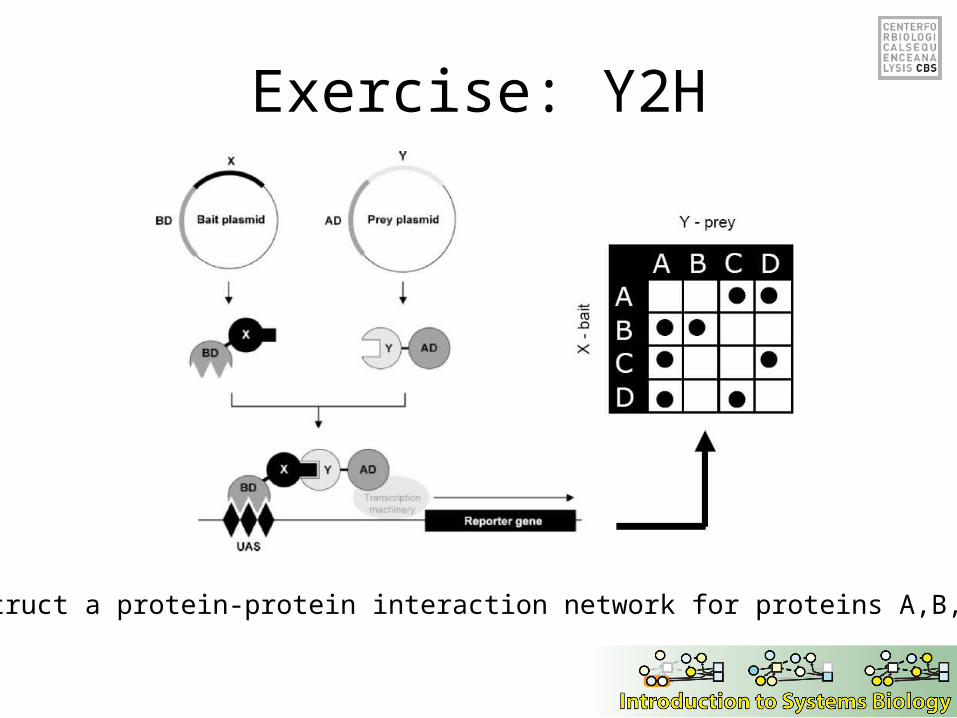
Exercise: Y2H
Construct a protein-protein interaction network for proteins A,B,C,D
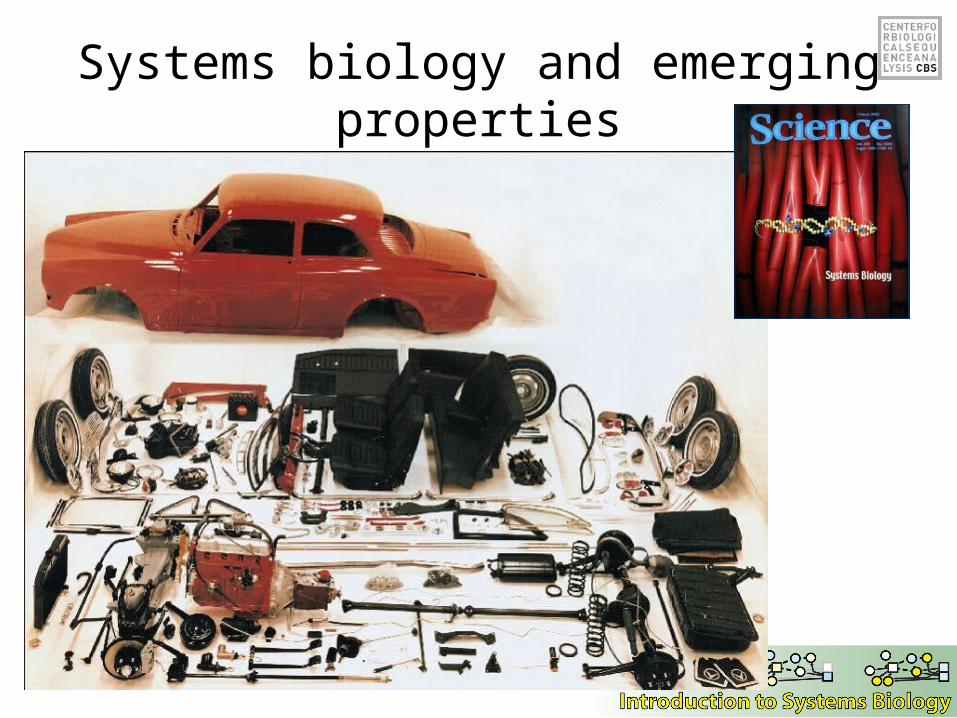
Systems biology and emerging properties
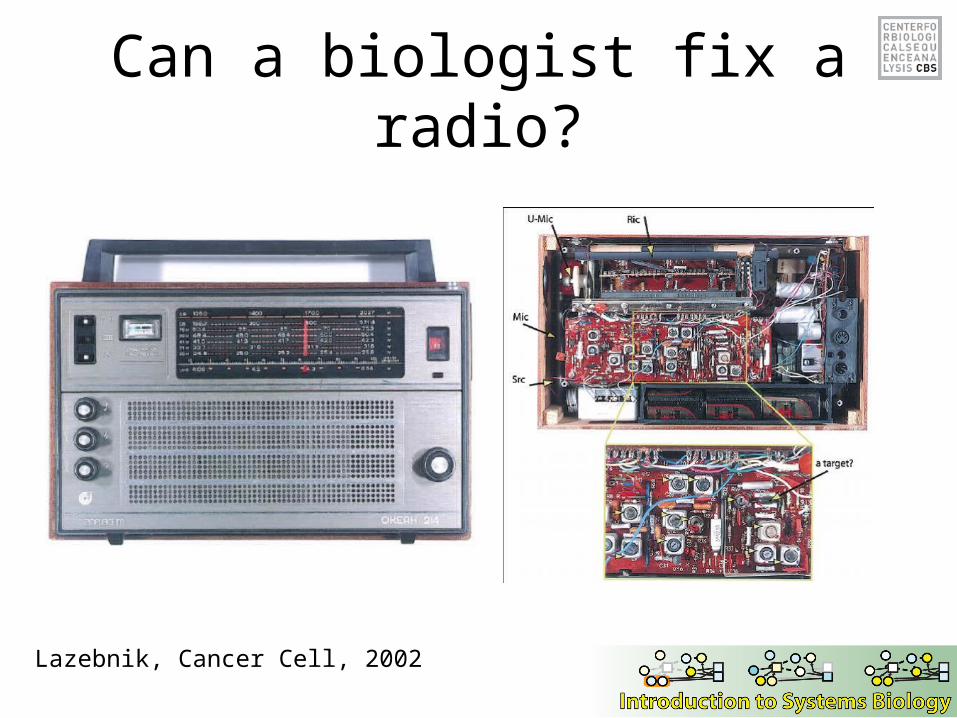
Can a biologist fix a radio?
Lazebnik, Cancer Cell, 2002
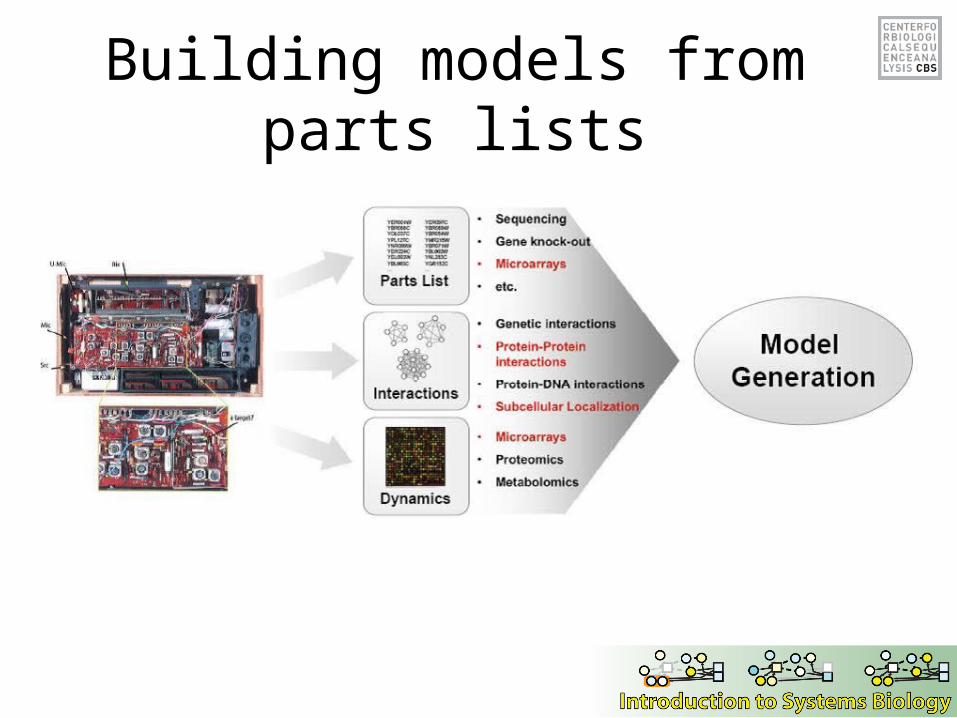
Building models from parts lists
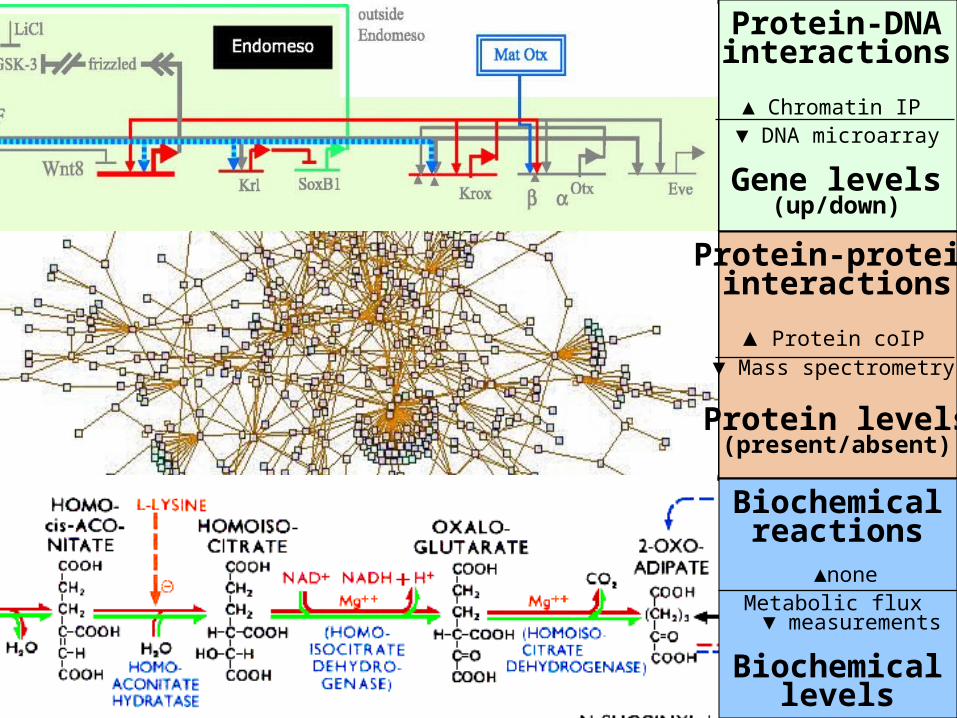
Protein-DNAinteractions
Gene levels(up/down)
Protein-proteininteractions
Protein levels(present/absent)
Biochemicalreactions
Biochemicallevels
▲ Chromatin IP ▼ DNA microarray
▲ Protein coIP▼ Mass spectrometry
▲noneMetabolic flux ▼
measurements
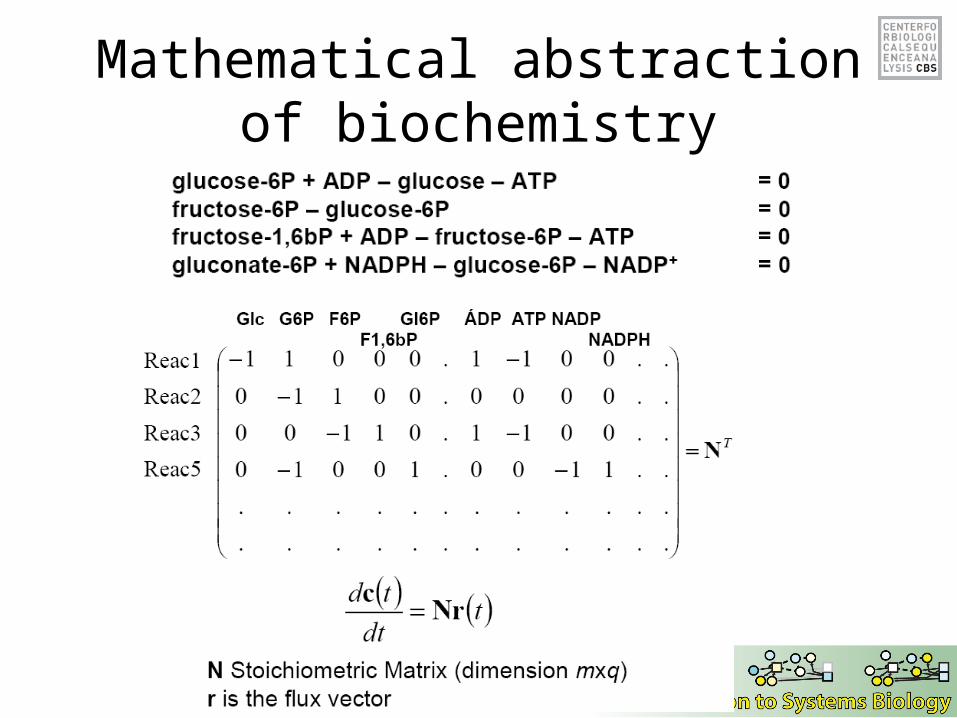
Mathematical abstraction of biochemistry
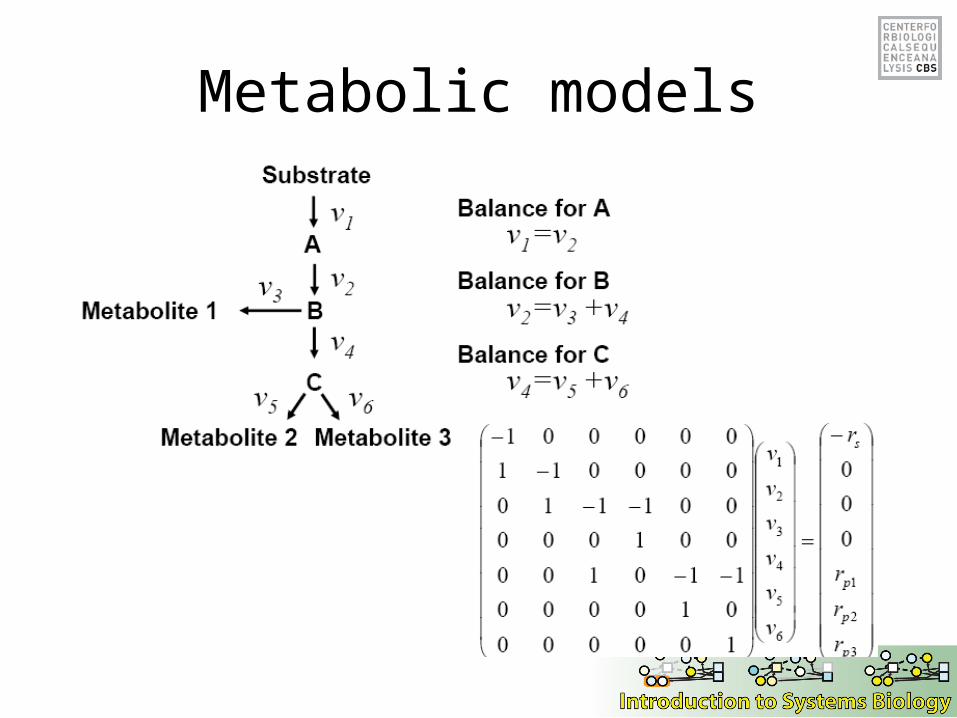
Metabolic models
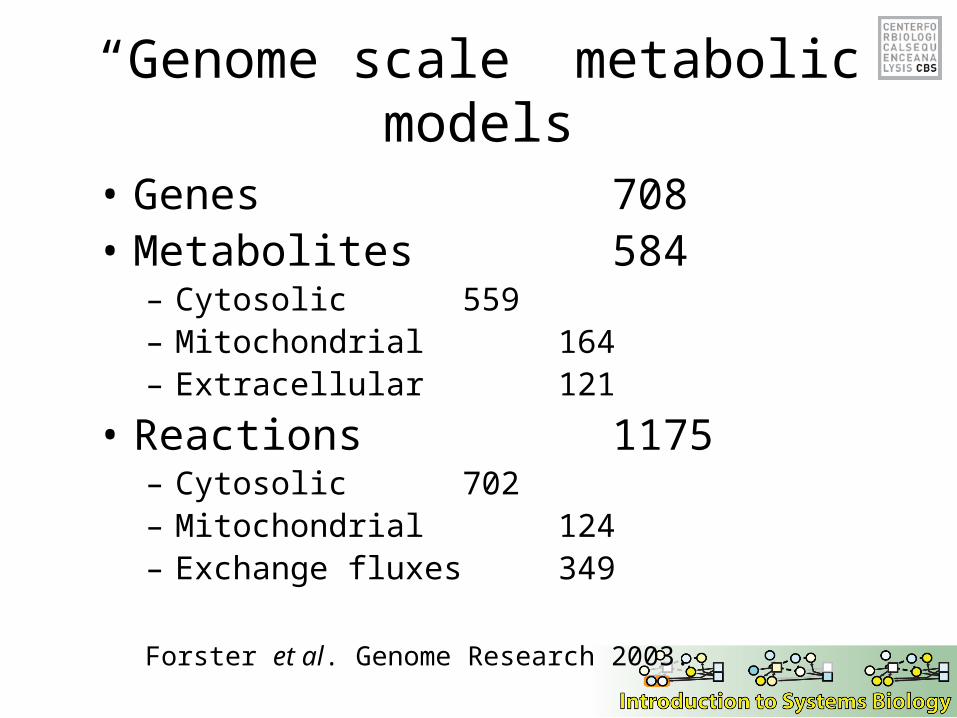
“Genome scale” metabolic models
• Genes 708• Metabolites 584
– Cytosolic 559– Mitochondrial 164– Extracellular 121
• Reactions 1175– Cytosolic 702– Mitochondrial 124– Exchange fluxes 349
Forster et al. Genome Research 2003.
One framework for Systems Biology
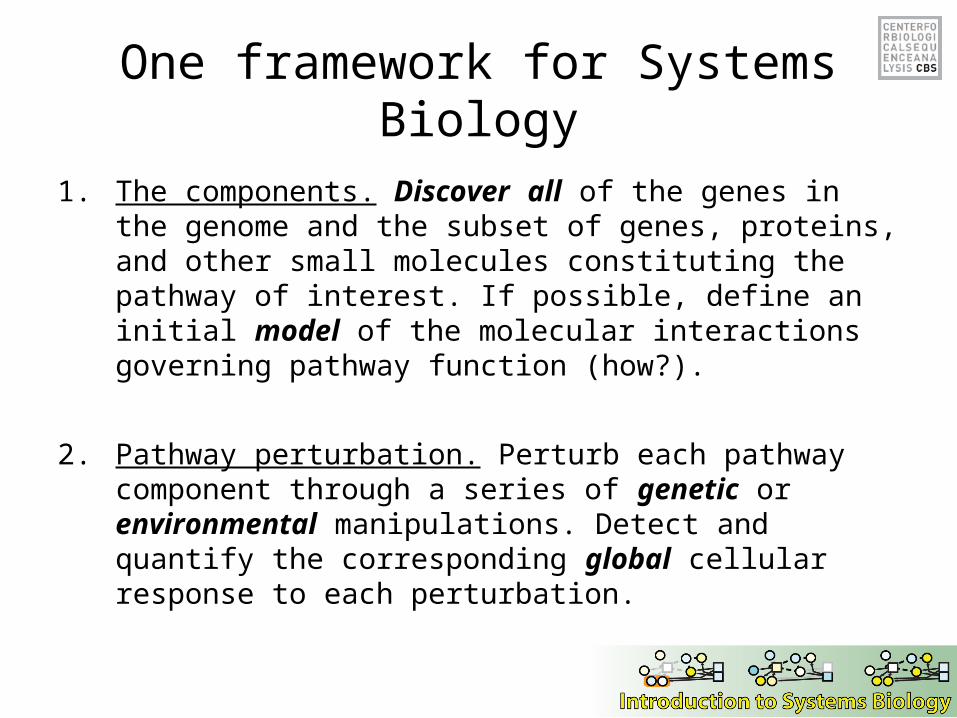
1. The components. Discover all of the genes in the genome and the subset of genes, proteins, and other small molecules constituting the pathway of interest. If possible, define an initial model of the molecular interactions governing pathway function (how?).
2. Pathway perturbation. Perturb each pathway component through a series of genetic or environmental manipulations. Detect and quantify the corresponding global cellular response to each perturbation.
One framework for Systems Biology
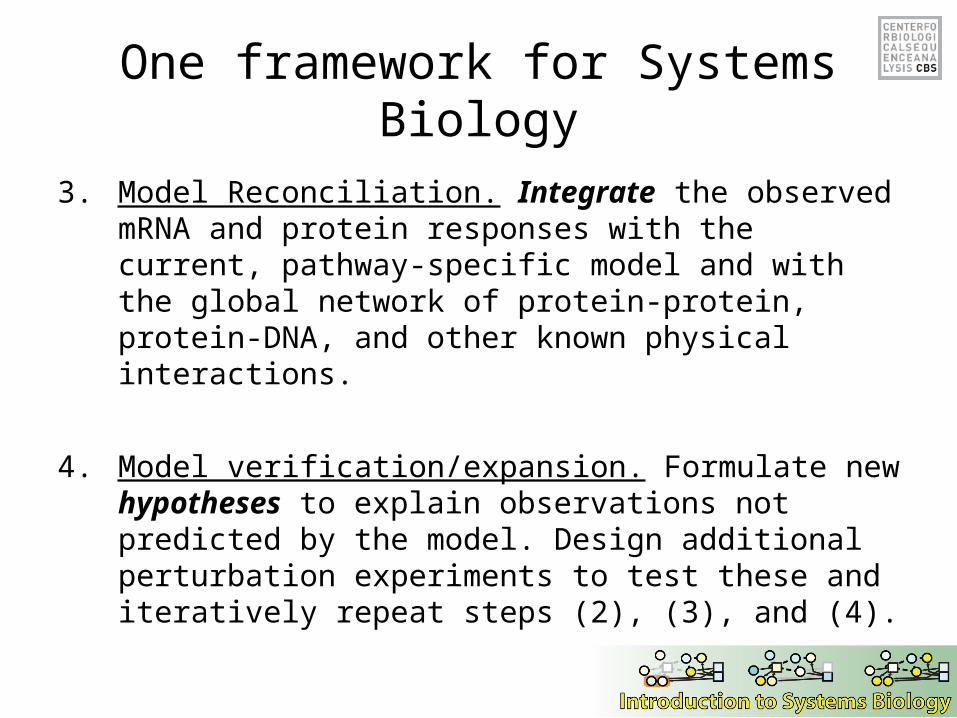
3. Model Reconciliation. Integrate the observed mRNA and protein responses with the current, pathway-specific model and with the global network of protein-protein, protein-DNA, and other known physical interactions.
4. Model verification/expansion. Formulate new hypotheses to explain observations not predicted by the model. Design additional perturbation experiments to test these and iteratively repeat steps (2), (3), and (4).
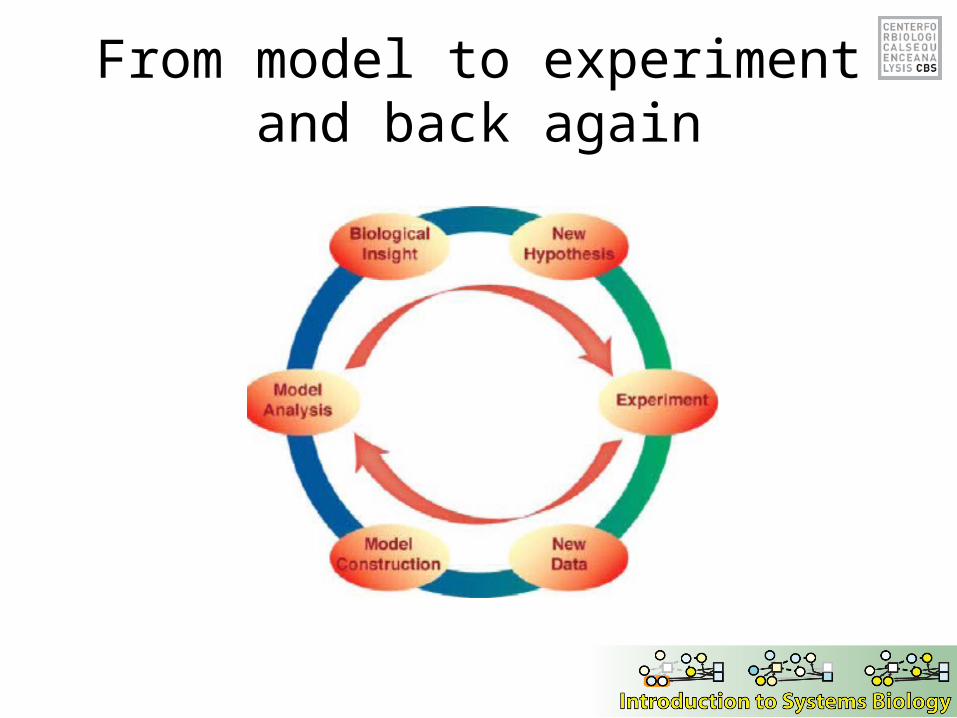
From model to experiment and back again
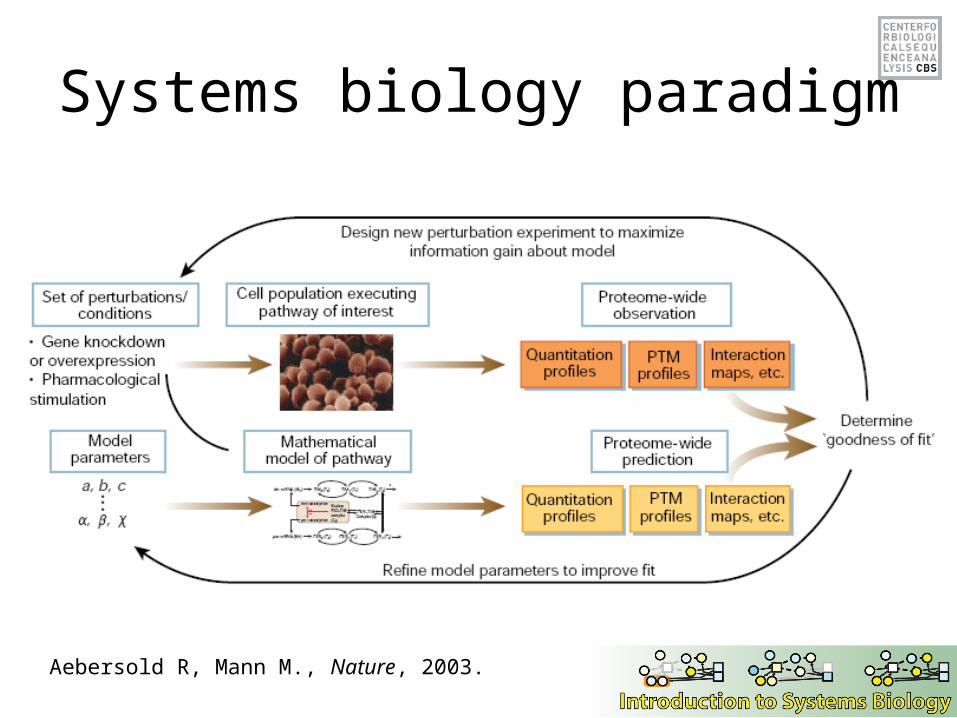
Systems biology paradigm
Aebersold R, Mann M., Nature, 2003.
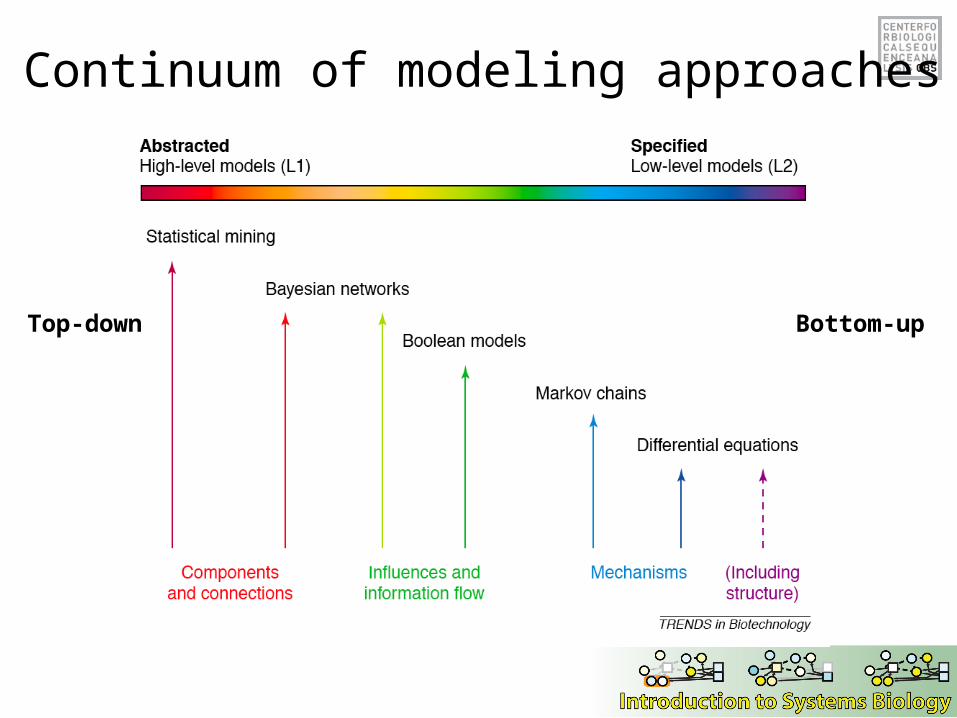
Continuum of modeling approaches
Top-down Bottom-up
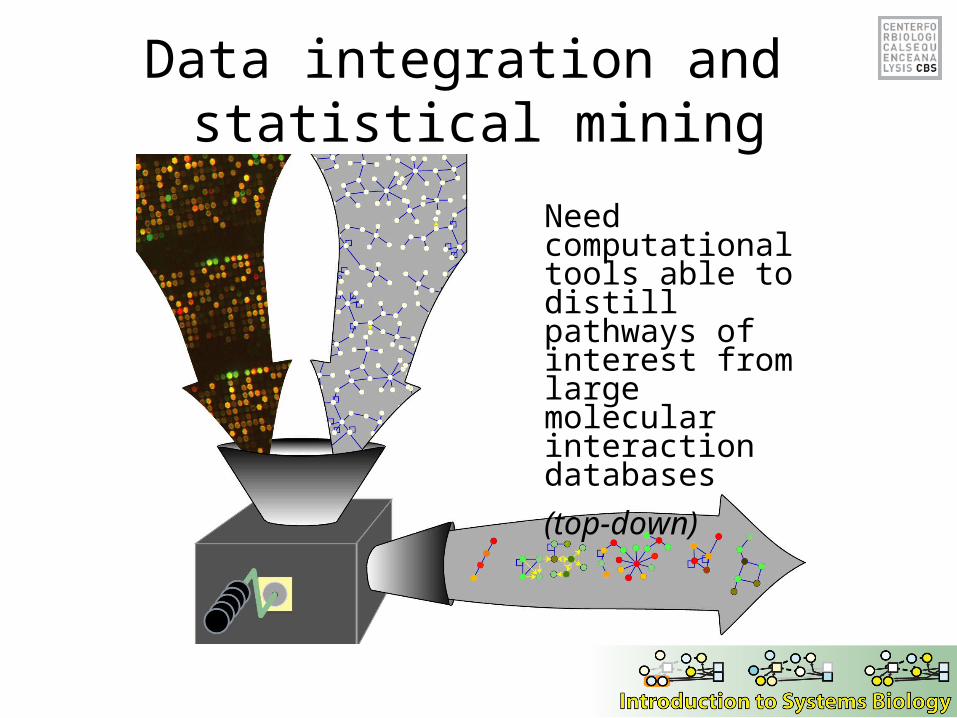
Need computational tools able to distill pathways of interest from large molecular interaction databases
(top-down)
Data integration and statistical mining
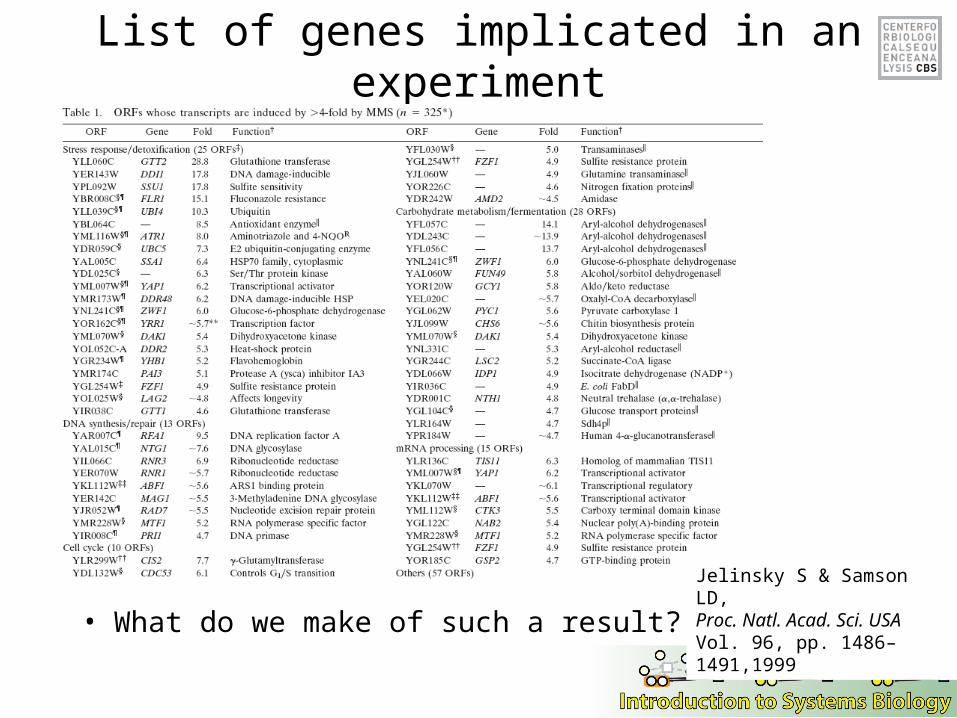
List of genes implicated in an experiment
• What do we make of such a result?
Jelinsky S & Samson LD,Proc. Natl. Acad. Sci. USAVol. 96, pp. 1486–1491,1999
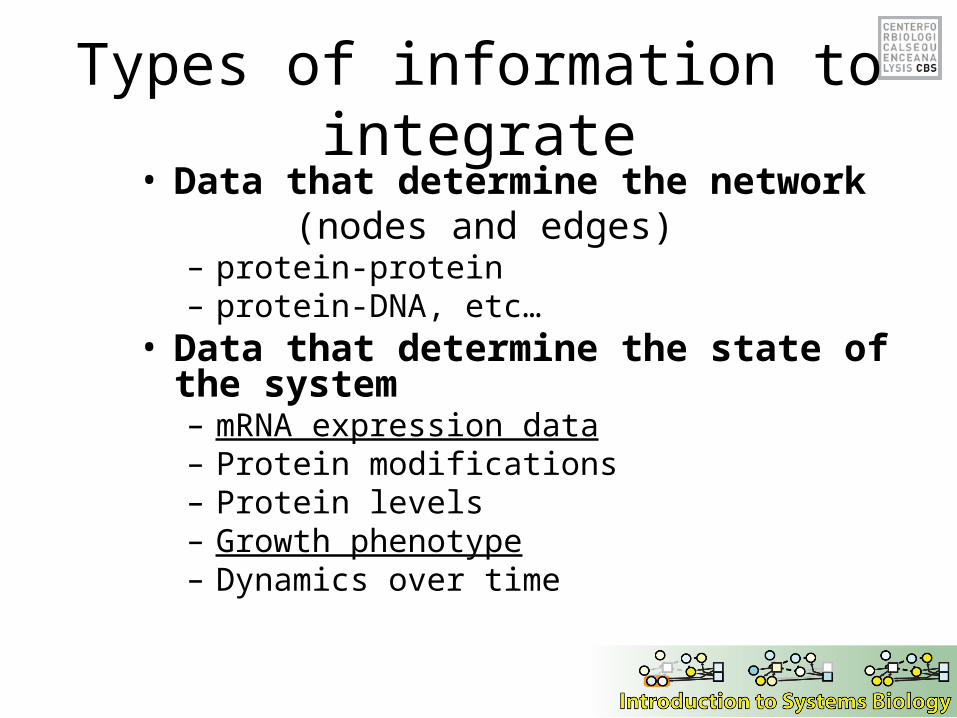
Types of information to integrate• Data that determine the network (nodes and edges)
– protein-protein– protein-DNA, etc…
• Data that determine the state of the system– mRNA expression data– Protein modifications– Protein levels– Growth phenotype– Dynamics over time
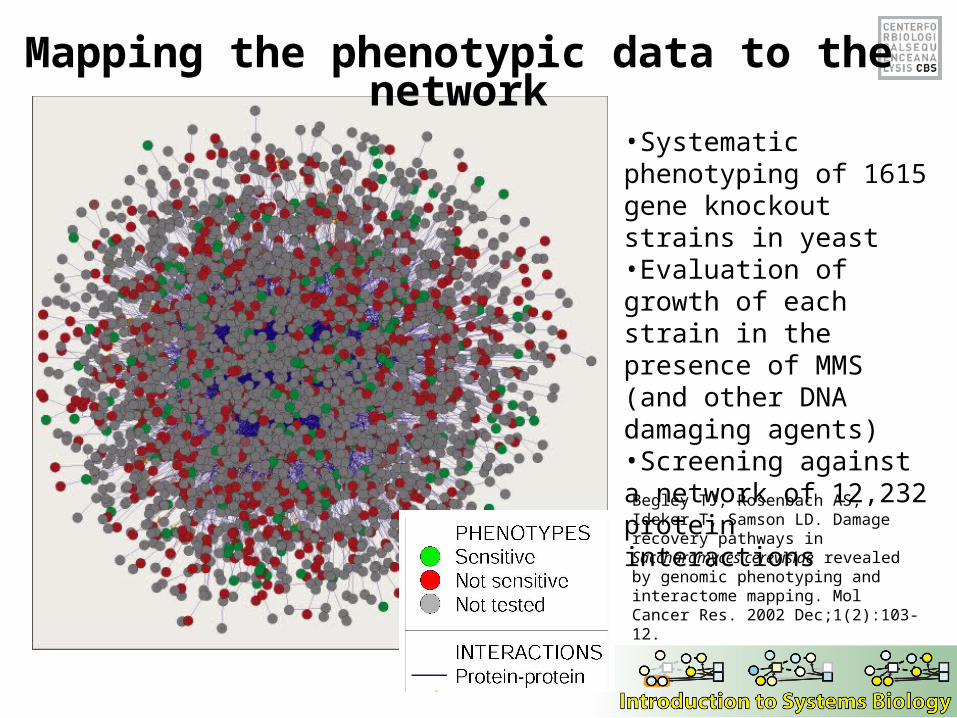
Mapping the phenotypic data to the network
Begley TJ, Rosenbach AS, Ideker T, Samson LD. Damage recovery pathways in Saccharomyces cerevisiae revealed by genomic phenotyping and interactome mapping. Mol Cancer Res. 2002 Dec;1(2):103-12.
•Systematic phenotyping of 1615 gene knockout strains in yeast•Evaluation of growth of each strain in the presence of MMS (and other DNA damaging agents)•Screening against a network of 12,232 protein interactions
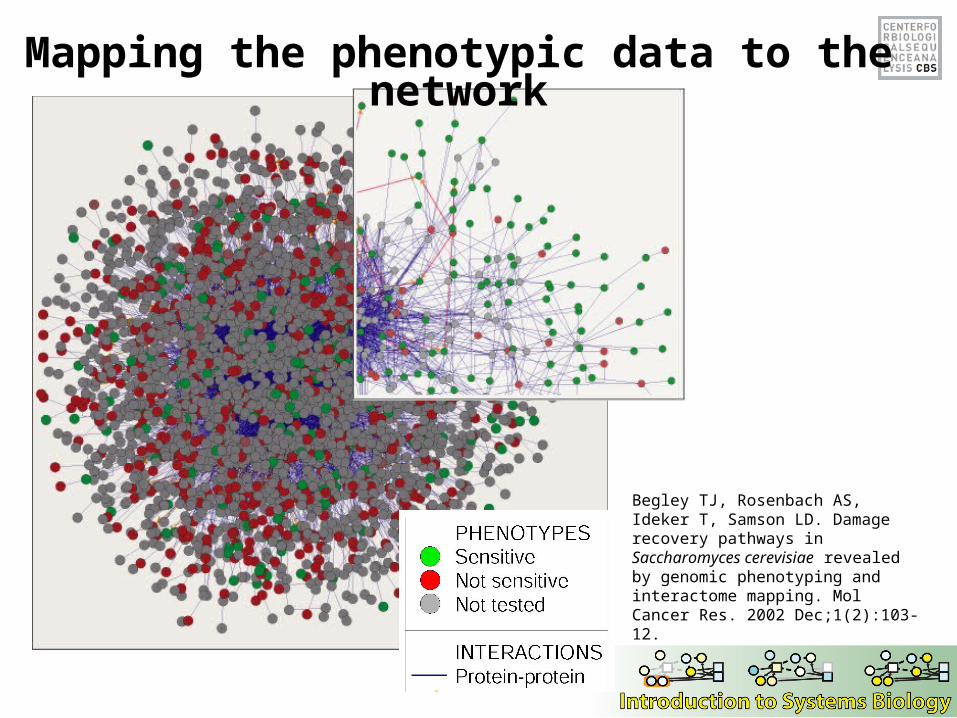
Mapping the phenotypic data to the network
Begley TJ, Rosenbach AS, Ideker T, Samson LD. Damage recovery pathways in Saccharomyces cerevisiae revealed by genomic phenotyping and interactome mapping. Mol Cancer Res. 2002 Dec;1(2):103-12.
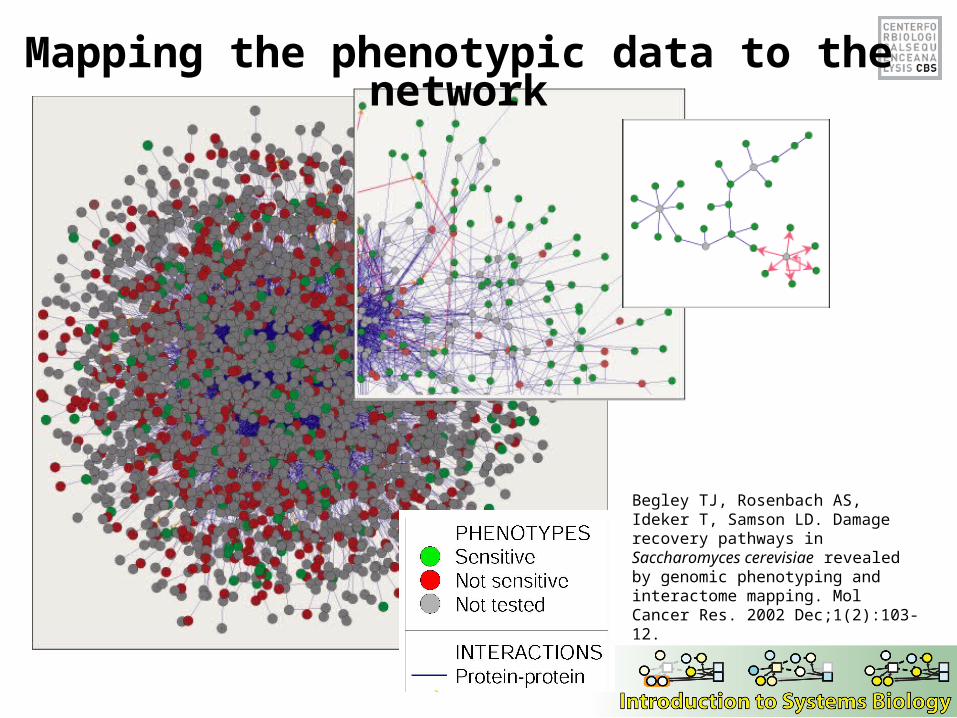
Mapping the phenotypic data to the network
Begley TJ, Rosenbach AS, Ideker T, Samson LD. Damage recovery pathways in Saccharomyces cerevisiae revealed by genomic phenotyping and interactome mapping. Mol Cancer Res. 2002 Dec;1(2):103-12.
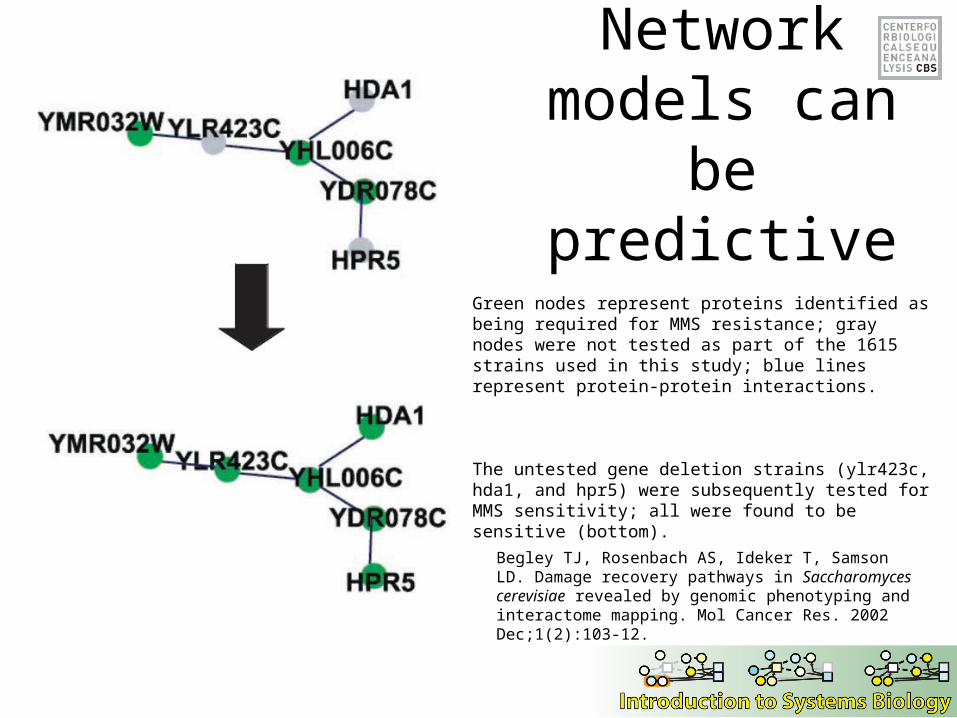
Network models can be
predictive
Green nodes represent proteins identified as being required for MMS resistance; gray nodes were not tested as part of the 1615 strains used in this study; blue lines represent protein-protein interactions.
The untested gene deletion strains (ylr423c, hda1, and hpr5) were subsequently tested for MMS sensitivity; all were found to be sensitive (bottom).
Begley TJ, Rosenbach AS, Ideker T, Samson LD. Damage recovery pathways in Saccharomyces cerevisiae revealed by genomic phenotyping and interactome mapping. Mol Cancer Res. 2002 Dec;1(2):103-12.
Summary
• Systems biology can be either top-down or bottom-up
• We are now in the post genomic era (don’t ignore that)
• Systematic measurements of all transcripts, proteins, and protein interactions enable top-down modeling
• Metabolic models, built bottom-up, are being refined with genomic information
• Data – Model – Predictions – Data: cycle as a Systems Biology theme
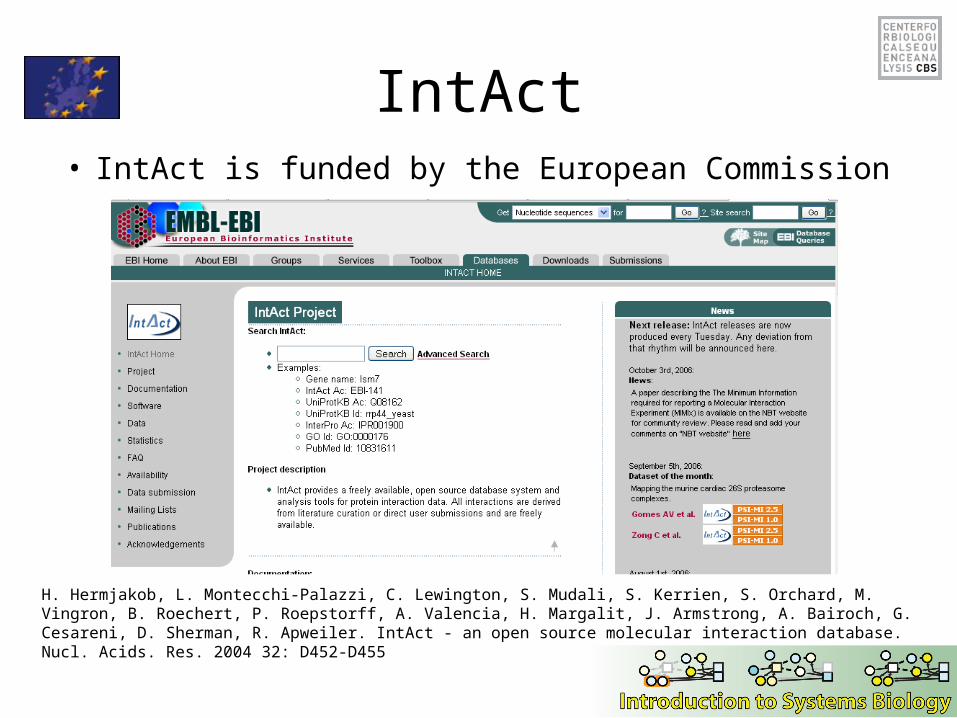
IntAct• IntAct is funded by the European Commission
H. Hermjakob, L. Montecchi-Palazzi, C. Lewington, S. Mudali, S. Kerrien, S. Orchard, M. Vingron, B. Roechert, P. Roepstorff, A. Valencia, H. Margalit, J. Armstrong, A. Bairoch, G. Cesareni, D. Sherman, R. Apweiler. IntAct - an open source molecular interaction database. Nucl. Acids. Res. 2004 32: D452-D455
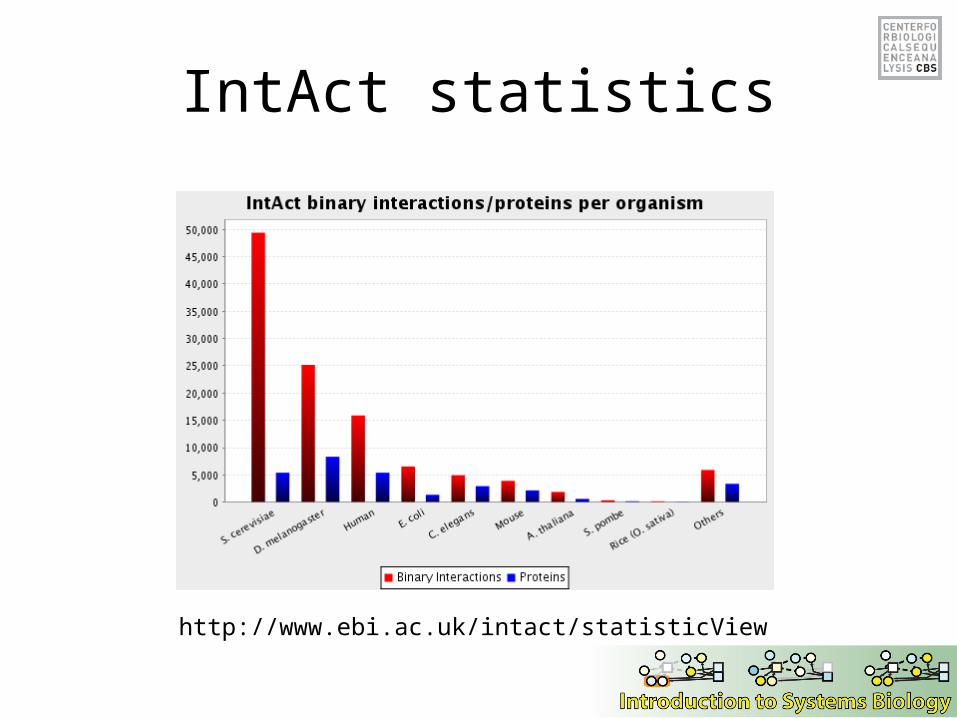
IntAct statistics
http://www.ebi.ac.uk/intact/statisticView
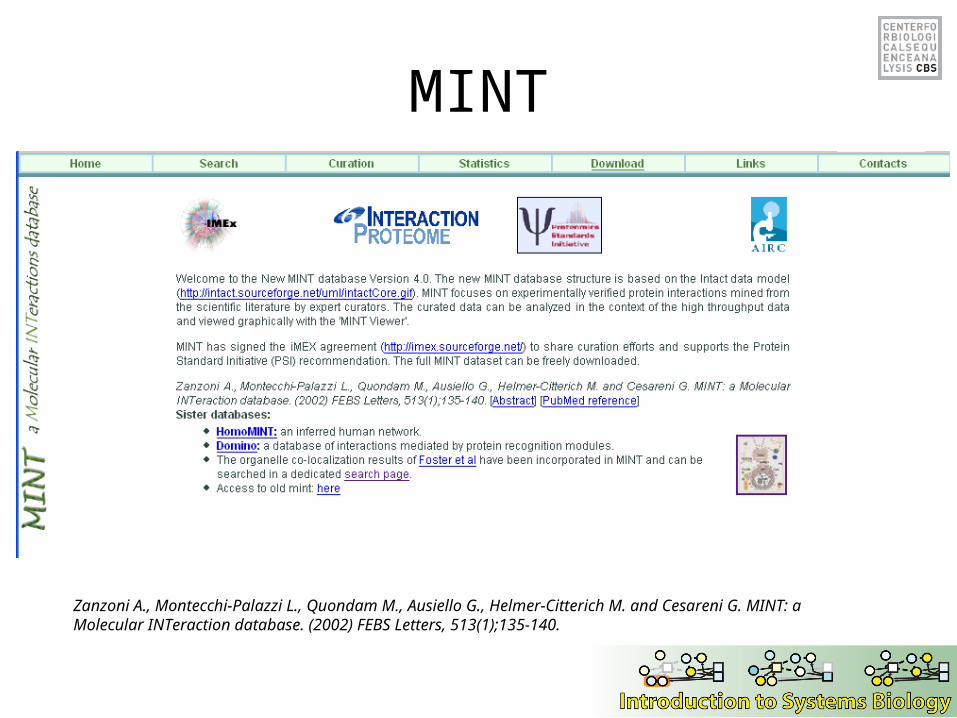
MINT
Zanzoni A., Montecchi-Palazzi L., Quondam M., Ausiello G., Helmer-Citterich M. and Cesareni G. MINT: a Molecular INTeraction database. (2002) FEBS Letters, 513(1);135-140.
Metabolic network databases
• KEGG, Kyoto Encyclopedia of Genes and Genomes– Metabolic pathway database– Much of it based on E. coli
• Reactome– Cold Spring Harbor Laboratory, The European
Bioinformatics Institute, and The Gene Ontology Consortium
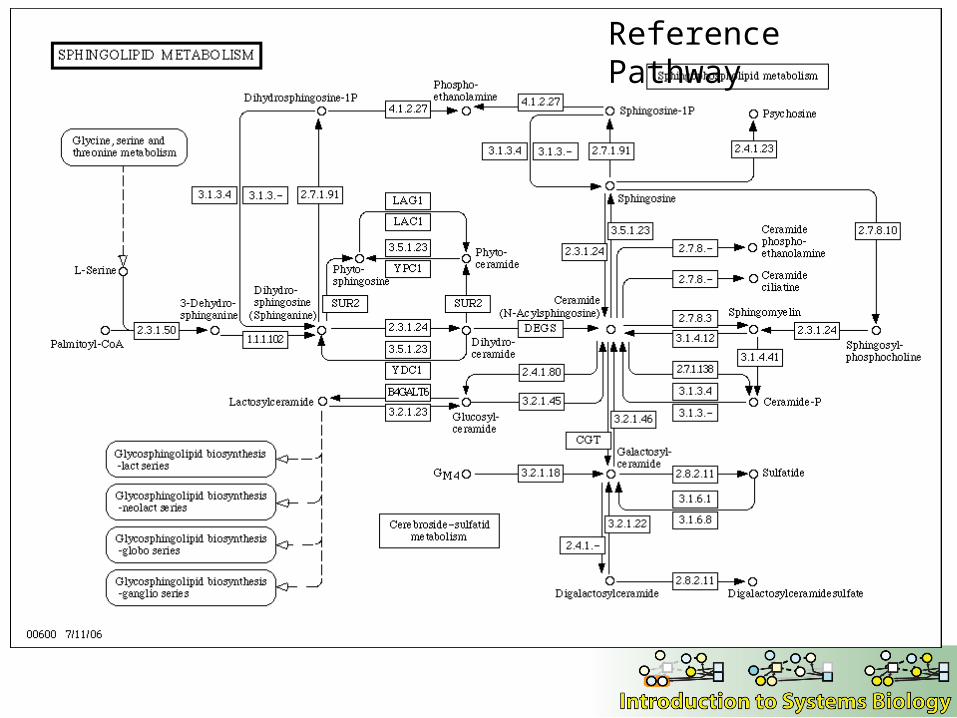
Reference Pathway
Reactome
• Curated resource of core pathways and reactions in human biology
• Database is authored by biological researchers with expertise in their fields, maintained by the Reactome editorial staff, and cross-referenced with other sequence databases (NCBI, Ensembl, etc)
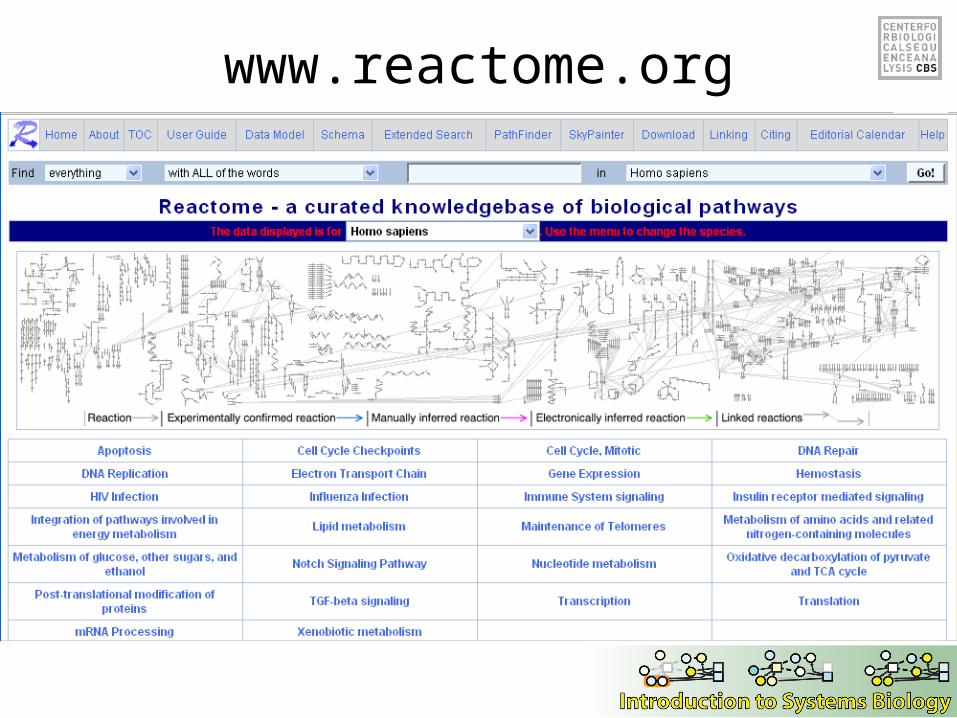
www.reactome.org
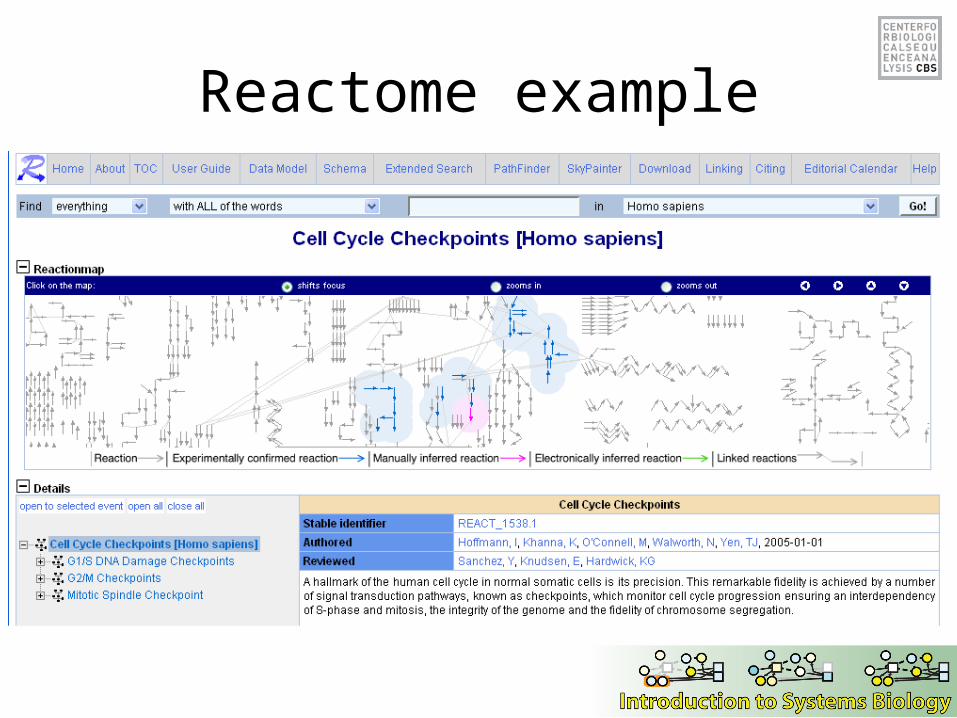
Reactome example
Relevance networks
• STRING: a database of predicted functional associations between proteins– Per Bork, EMBL Heidelberg
• Probabilistic gene network, Functional or relevence network– Edward Marcotte, University of Texas
• Literature networks (there are many methods…)
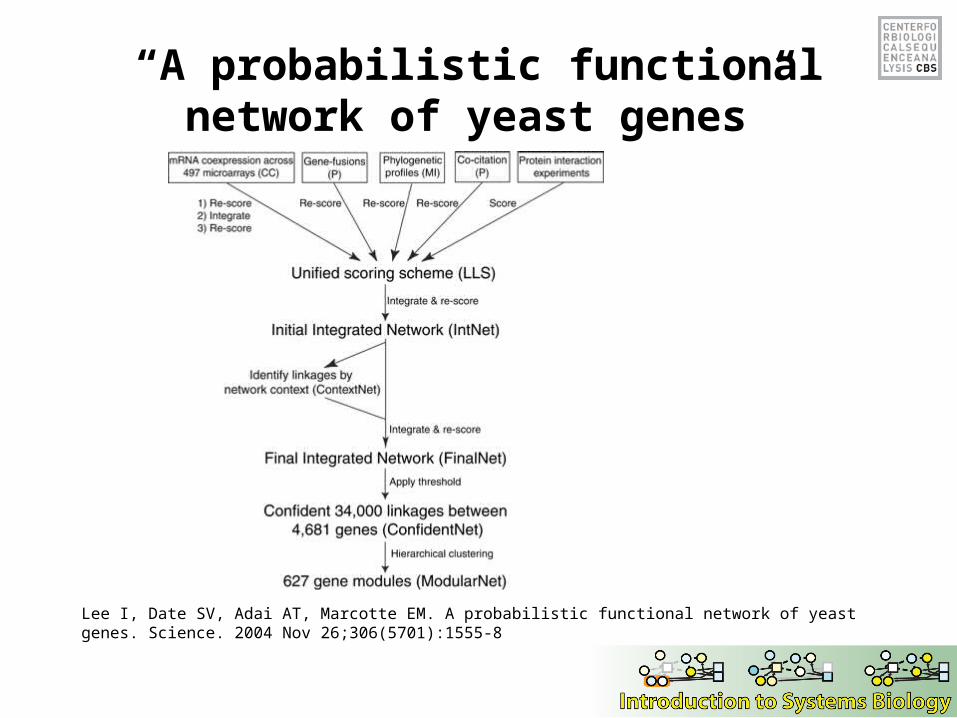
Probabilistic functional network
• Each experiment is evaluated for its ability to reconstruct known gene pathways and systems by measuring the likelihood that pairs of genes are functionally linked conditioned on the evidence
• Bayesian statistics, log likelihood scores (LLS)
Lee I, Date SV, Adai AT, Marcotte EM. A probabilistic functional network of yeast genes. Science. 2004 Nov 26;306(5701):1555-8
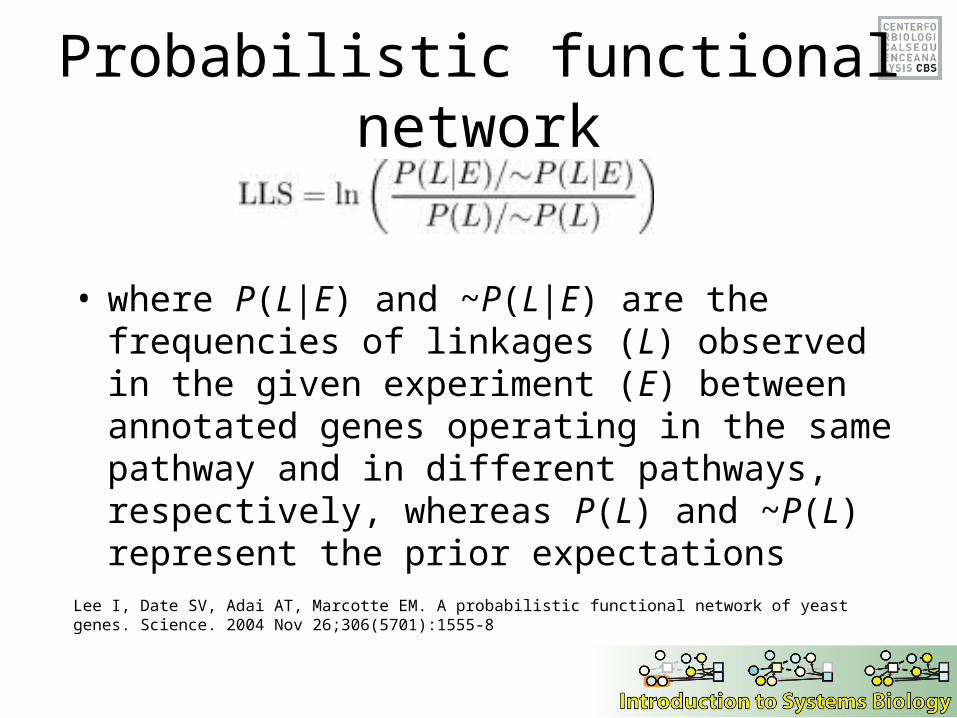
Probabilistic functional network
• where P(L|E) and ~P(L|E) are the frequencies of linkages (L) observed in the given experiment (E) between annotated genes operating in the same pathway and in different pathways, respectively, whereas P(L) and ~P(L) represent the prior expectations
Lee I, Date SV, Adai AT, Marcotte EM. A probabilistic functional network of yeast genes. Science. 2004 Nov 26;306(5701):1555-8
“A probabilistic functional network of yeast genes”
Lee I, Date SV, Adai AT, Marcotte EM. A probabilistic functional network of yeast genes. Science. 2004 Nov 26;306(5701):1555-8
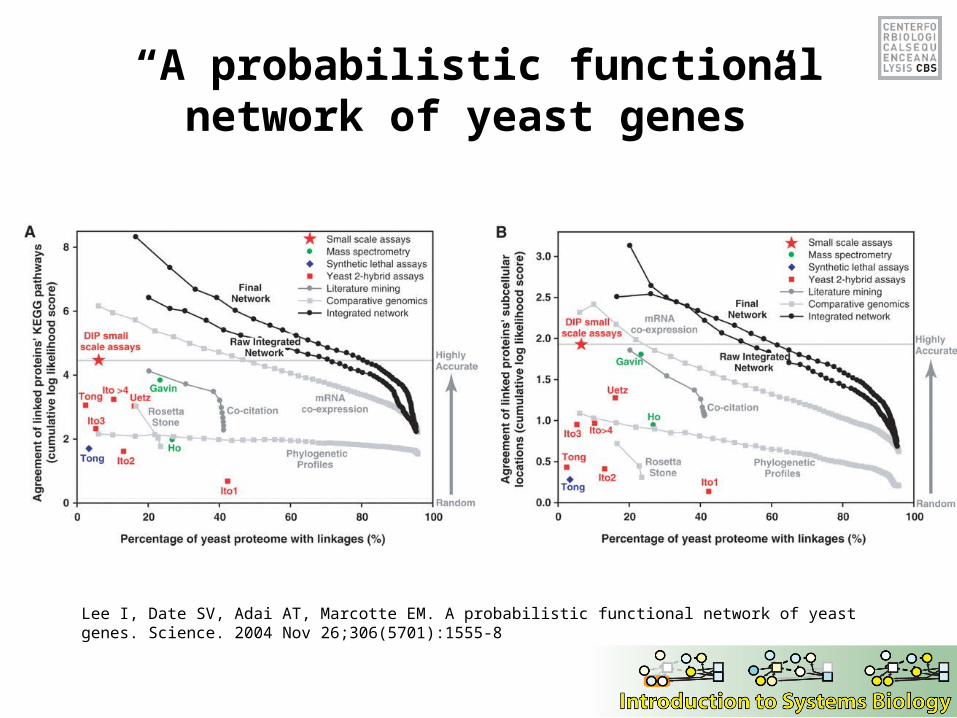
“A probabilistic functional network of yeast genes”
Lee I, Date SV, Adai AT, Marcotte EM. A probabilistic functional network of yeast genes. Science. 2004 Nov 26;306(5701):1555-8
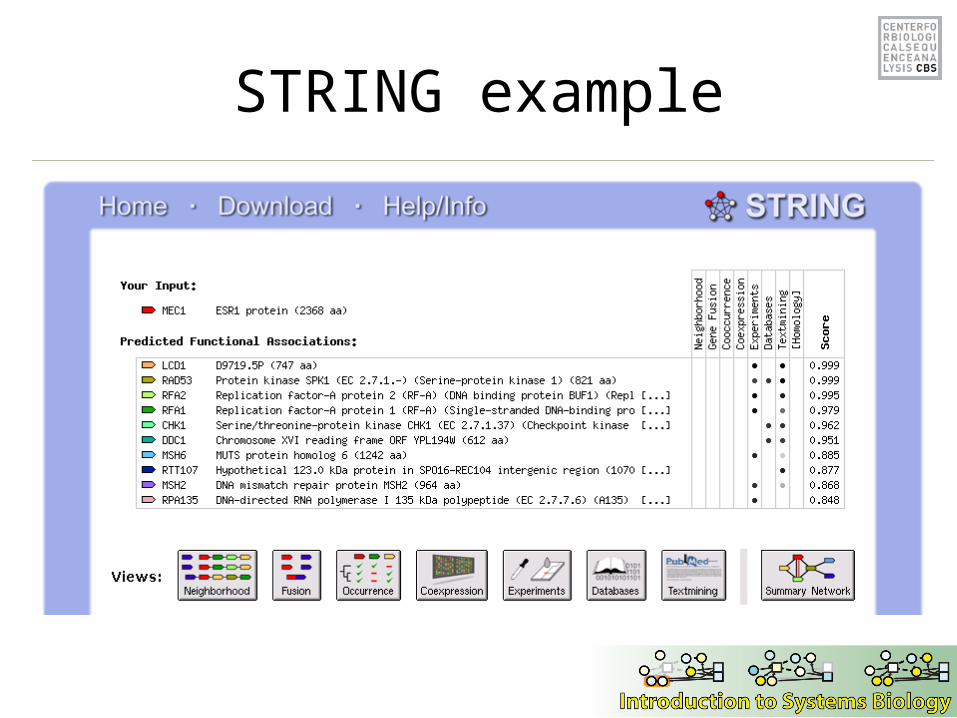
STRING example
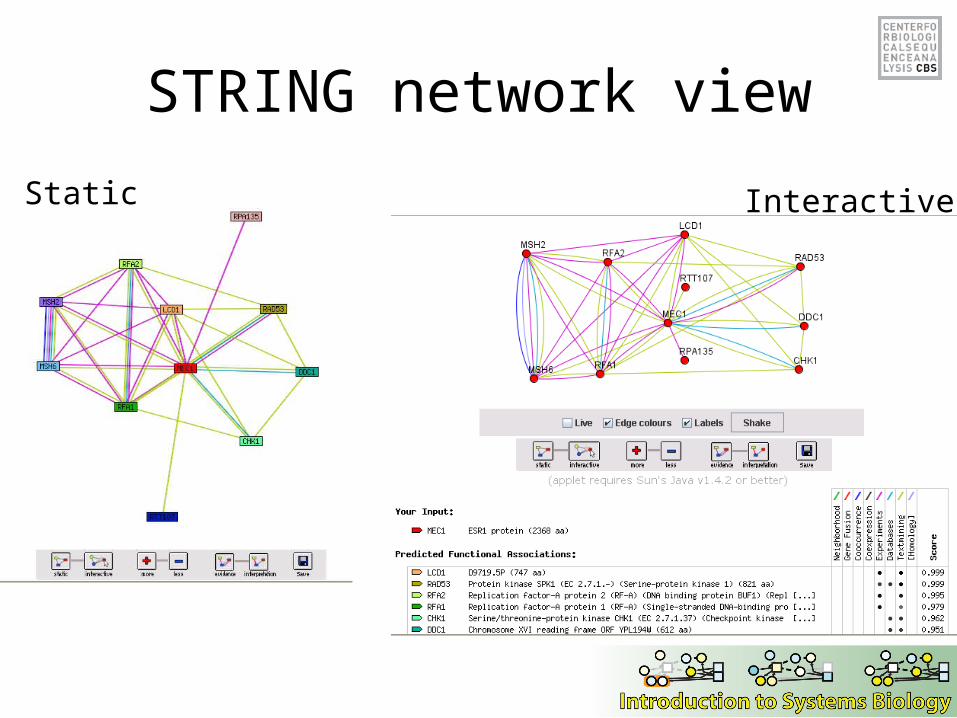
STRING network view
Static Interactive
Ontologies
• MIPS Functional Catalogue “Funcat”– http://mips.gsf.de/proj/funcatDB/
• The Gene Ontology (GO)– http://www.geneontology.org/– The Gene Ontology Consortium
GO is
• An effort to address the need for consistent descriptions of gene products in different databases via structured controlled vocabularies (ontologies)
• “Open source”• Has three separate ontologies:
– Molecular Function– Biological Process– Cellular Component
• Hierarchical (in nature)
GO is NOT
• Components that are unique to mutants or diseases
• Attributes of sequence such as introns or exons • Protein domains or structural features• Protein-protein interactions• Environment, evolution and expression• Histological features above the level of cellular
components
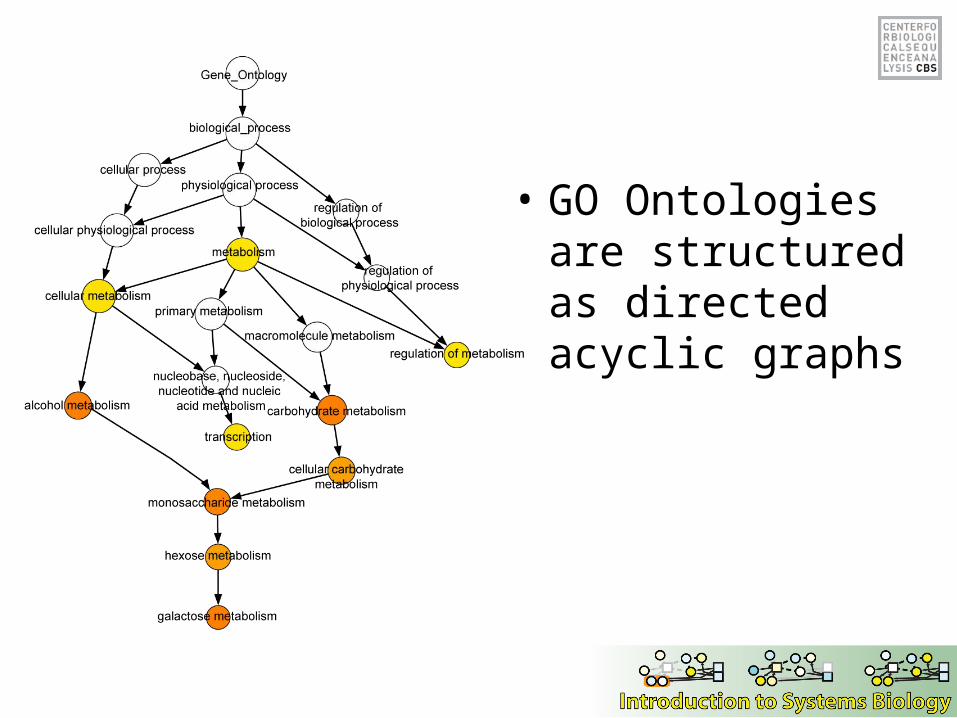
• GO Ontologies are structured as directed acyclic graphs
Fisher’s exact test
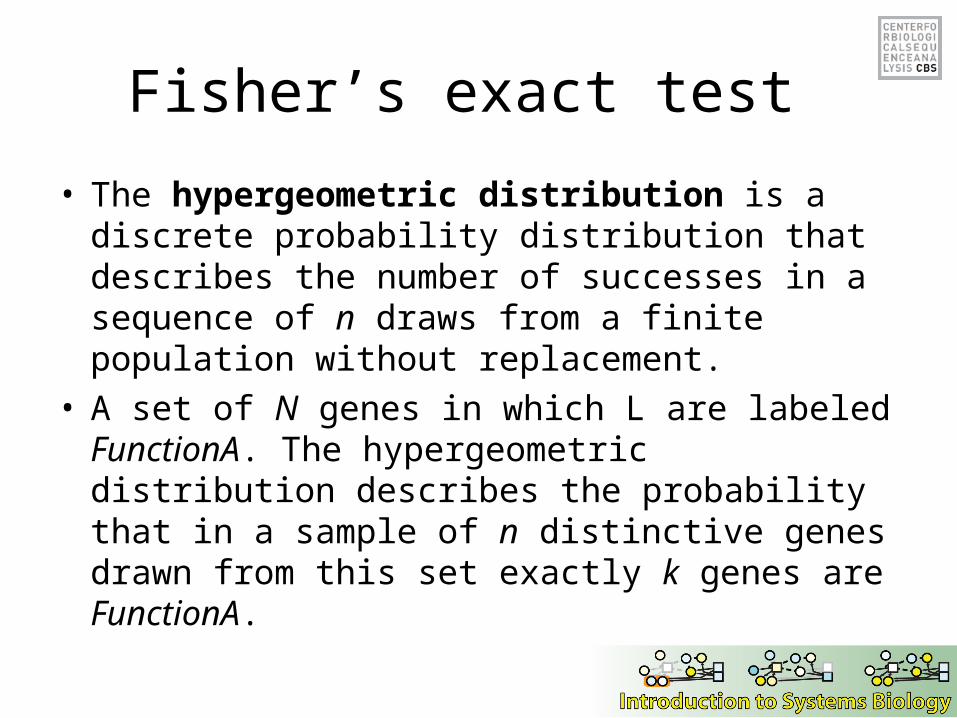
• The hypergeometric distribution is a discrete probability distribution that describes the number of successes in a sequence of n draws from a finite population without replacement.
• A set of N genes in which L are labeled FunctionA. The hypergeometric distribution describes the probability that in a sample of n distinctive genes drawn from this set exactly k genes are FunctionA.
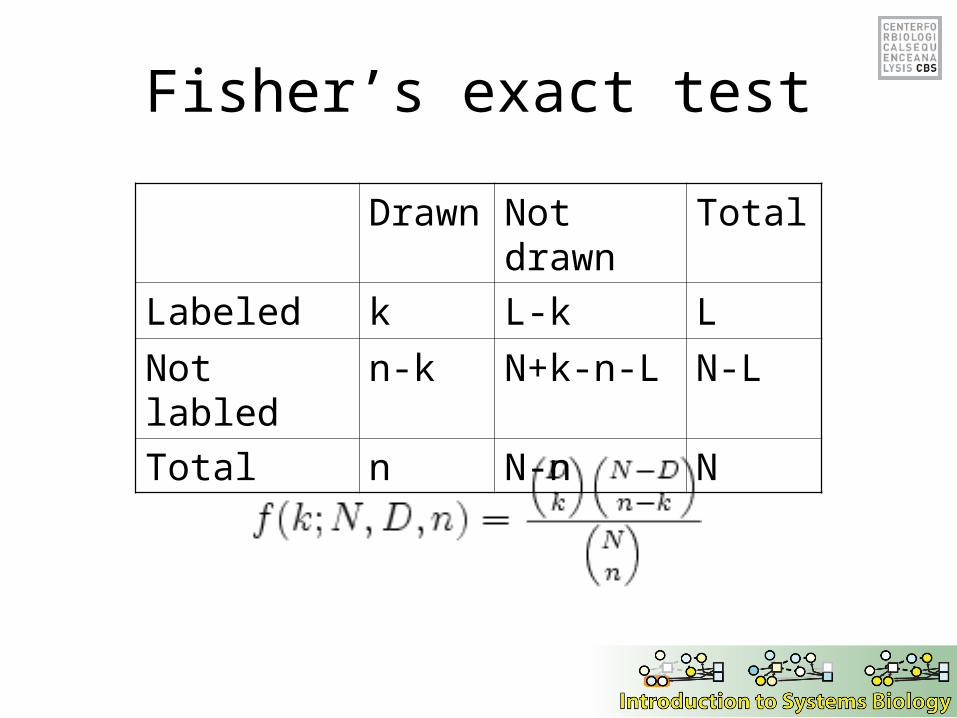
Fisher’s exact test
Drawn Not drawn Total
Labeled k L-k L
Not labled n-k N+k-n-L N-L
Total n N-n N