Embed Size (px)
Citation preview

Introduction to Simulations and Experimental ProbabilityChapter 4.1 – An Introduction to Probability
Mathematics of Data Management (Nelson)
MDM 4U

Conditions fora “fair game” a game is fair if…
all players have an equal chance of winning
each player can expect to win or lose the same number of times in the long run
each player's expected payoff is zero
http://www.math.psu.edu/dlittle/java/probability/plinko/index.htmlhttp://probability.ca/jeff/java/utday/

Important vocabulary Trial: one repetition of an experiment
e.g., flip a coin; roll a die; flip a coin and spin a spinner
Random variable: a variable whose value corresponds to the outcome of a random event

More Vocabulary Expected value: the value to which the
average of a random variable’s values tends after many repetitions; also called the average value or mean value
Event: a set of possible outcomes of an experiment
Simulation: an experiment that models an actual event

A Definition of Probability A measure of the likelihood of an event
Based on how often a particular event occurs in comparison with the total number of trials.
Probabilities derived from experiments are known as experimental probabilities.

Experimental Probability is the observed probability (also known as the
relative frequency) of an event, A, in an experiment.
is found using the following formula:
P(A) = number of times A occurs
total number of trials
Note: probability is a number between 0 and 1 inclusive.
It can be written as a fraction or decimal.

Simulations A simulation is an experiment that has the
same probability as an actual event. Flip a fair coin½ Roll a fair die 1/6, 2/6, 3/6, 4/6, 5/6 Draw a card from a standard deck (52) ½, ¼ 1/13, 1/52 Hold a draw any Spin a spinner any (realistically 12 or fewer)

Simulation Examples Describe a simulation that models: a) A hockey player who scores on 17% of the shots he
takes b) A baseball player’s batting average is 0.300 getting a hit c) A randomly chosen student has a birthday during the
school year
a) Roll a die. Let 1 represent a goal. b) Put 3 red balls and 7 blue balls in a garbage can.
Drawing a red ball represents a hit. c) Roll a die. Let 1=Sep-Oct, 2= Nov-Dec, 3=Jan-Feb,
4=Mar-Apr, 5=May-Jun, 6=Jul-Aug

Class activity
Play “The Coffee Game” (Investigation 1) on p. 203 including Discussion Questions on p. 204.
HINT: If you do not have pennies, or want to use technology, visit the wiki at LIEFF.WIKISPACES.COM/MDM4U and use the online coin simulator to simulate tossing 5 coins at a time!

MS Excel Formulas to generate random integers Random 0 or 1 (coin toss, predict gender of a baby)
=ROUND(RAND()*(1),0)
Random H or T (0 or 1)
=IF(ROUND(RAND()*(1),0)=0,"H","T")
Random integer between 1 and 5 (football kicker p. 211 #10)
=ROUND(RAND()*(4)+1,0)
Random integer between 1 and n
=ROUND(RAND()*(n-1)+1,0)
Type a formula into a cell, then copy and paste to a group of cells to simulate multiple trials e.g., 4.1 random numbers.xls
Press F9 instead of ENTER to generate a random number
MSIP / Homework
Read through Example 2 -- solution 1, p. 207 Complete pp. 209-212 #1, 5, 8, 9-10, 12-13

Warm up
Former Toronto Blue Jays third baseman Scott Rolen has a lifetime 0.286 batting average. This means that the probability that he gets a hit in any at-bat is 0.286. Describe a simulation to determine whether he gets a hit in the next game (4 at bats).

Solution
1. To simulate one at-bat, we need an experiment where an event has a 286/1000 (or 2/7) probability. This could be any ONE of the following:
Put 1 000 numbered balls in a drum. Choose a ball. Balls from 1 to 286 represent a hit. Replace the ball.
Generate a random number from 1 to 1 000 (or 1 to 7). Any number from 1 to 286 (or 1-2) represents a hit.
Roll a 7-sided die – 1 or 2 is a hit Spin a spinner divided into 7 segments of 360°÷7 = 51.43°. Colour
two green – those sections represent a hit. Remove all cards 8 or higher from a deck (aces low). Draw a card
from the cards that remain. An A or 2 represents a hit. Replace the card.
2. Repeat 3 times to simulate 3 more at-bats.

Theoretical Probability
Chapter 4.2 – An Introduction to ProbabilityMathematics of Data Management (Nelson)MDM 4U

Gerolamo Cardano Born: 1501, Pavia, Italy Died: 1571 in Rome (on
the date he predicted astrologically)
Physician, inventor, mathematician, chess player, gambler
Invented combination lock, Cardan shaft
Published solutions to cubic and quartic equations

Games of Chance
Most historians agree that the modern study of probability began with Gerolamo Cardano’s analysis of “Games of Chance” in the 1500s.
http://encyclopedia.thefreedictionary.com /Gerolamo Cardano
http://www-gap.dcs.st-and.ac.uk/~history /Mathematicians/Cardan.html

A few terms…
simple event: an event that consists of exactly one outcome (e.g., rolling a 3)
sample space: the collection of all possible outcomes of the experiment (e.g., {1,2,3,4,5,6})
event space: the collection of all outcomes of an experiment that correspond to a particular event (e.g. {2,4,6} are the even rolls of a die)

General Definition of Probability assuming that all outcomes are equally likely,
the probability of event A is:
P(A) = n(A) n(S)
where n(A) is the number of elements in the event space and n(S) is the number of elements in the sample space.

Example #1a When rolling a single die, what is the
probability of…
a) rolling a 2?
A = {2}, S = {1,2,3,4,5,6}
P(A) = n(A) = 1 = 0.17n(S) 6

Example #1b
When rolling a single die, what is the probability of…
b) rolling an even number?
A = {2,4,6}, S = {1,2,3,4,5,6}
P(A) = n(A) = 3 = 1n(S) 6 2

Example #1c
When rolling a single die, what is the probability of…
c) rolling a number less than 5?
A = {1,2,3,4}, S = {1,2,3,4,5,6}
P(A) = n(A) = 4 = 2n(S) 6 3
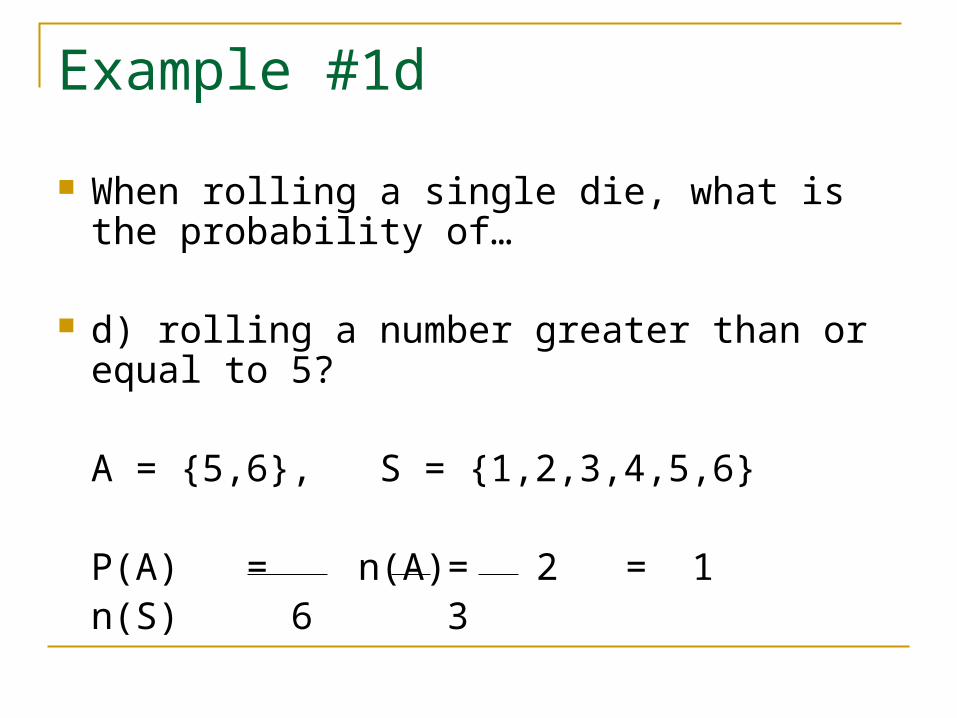
Example #1d
When rolling a single die, what is the probability of…
d) rolling a number greater than or equal to 5?
A = {5,6}, S = {1,2,3,4,5,6}
P(A) = n(A) = 2 = 1n(S) 6 3

The Complement of a Set
The complement of a set A, written A’ (read A complement or A prime), consists of all outcomes in the sample space that are not in the set A.
If A is an event in a sample space, the probability of the complementary event, A’, is given by:
P(A’) = 1 – P(A)

Example #2a When selecting a single card from a standard
deck (no Jokers), what is the probability you will pick…
a) the 7 of Diamonds?
P(A) = n(A) = 1
n(S) 52

Example #2b When selecting a single card from a standard
deck, what is the probability you will pick…
b) a Queen?
P(A) = n(A) = 4 = 1
n(S) 52 13

Example #2c When selecting a single card from a standard
deck, what is the probability you will pick…
c) a face card (J, Q or K)?
P(A) = n(A) = 12 = 3
n(S) 52 13

Example #2d When selecting a single card from a standard
deck, what is the probability you will pick…
d) a card that is not a face card?
P(A) = n(A) = 40 = 10
n(S) 52 13

Example #2d (cont’d) Another way of looking at P(not a face card)…
we know: P(face card) = 3
13 and, we know: P(A’) = 1 - P(A)
So… P(not a face card) = 1 - P(face card)
P(not a face card) = 1 - 3 = 10
13 13

Example #2e When selecting a single card from a standard
deck, what is the probability you will pick…
e) a red card?
P(A) = n(A) = 26 = 1
n(S) 52 2

MSIP / Homework
pp. 218-219 # 4-7, 9, 10, 12
Next class: A look at Venn Diagrams