Embed Size (px)
Citation preview

1
Introduction to population PKPDIntroduction to population PKPD modellingmodellinginin paediatricpaediatric clinical pharmacologyclinical pharmacology
Catherijne KnibbeCatherijne Knibbe, Oscar, Oscar Della PasquaDella Pasqua,, Meindert DanhofMeindert Danhof
Leiden/AmsterdamCenter for Drug Research
Division of Pharmacology

2
What is the problem?What is the problem?
• Drugs dosing in children is largely empirical
• Frequent under-and overdosing problems
• Efficacy and safety of drugs, in particular in (premature) newborns is largely unknown
Body weight is used for dose adjustment instead of the PKPD relationships

3
PKPD MODELLING: What is it?PKPD MODELLING: What is it?

4
• How to identify a safe and effective dosing regimen in children in different age groups? – First time in kids (early drug development)
– Change in indication or age group, including neonates (clinical practice)
• Which factor(s) should be used to adjust the dose for the individual child in different age groups?
– dosing recommendation in the label
Clinical QuestionsClinical Questions

5
PaediatricPaediatric Research IssuesResearch Issues
Unbalanced vs balanced designs:– 100 observations for subject A
– 1 observation for subject B
Sparse vs. serial data:– 2 measurements per subject

0
20
40
60
80
100
120
0 6 12 18 24
Population approachPopulation approach
Simultaneous analysis of all available data:
PK and/or PD parameters are simultaneously estimated taking into account differences between patients
1. POPULATION PK and/or PD parameters (fixed effects)
2. Inter-individual variability
3. Residual error

0
20
40
60
80
100
120
0 6 12 18 24
Con
cent
ratio
n (m
g/L)
TIme (hr)
Predicted
Observed
0
20
40
60
80
100
120
0 6 12 18 24
ID=1 (pred)ID=1 (obs)ID=2 (pred)ID=2 (obs)ID=3 (pred)ID=3 (obs)
7
Population PKPDPopulation PKPD modelling modelling
Inter-individual variability
Residual error
88
• Applicable to sparse and unbalanced data sets (neonates, children, etc)
••• Scientific basis for study/trial simulations, Scientific basis for study/trial simulations, Scientific basis for study/trial simulations, dose adjustment or labeling extensions in dose adjustment or labeling extensions in dose adjustment or labeling extensions in other populations other populations other populations (intra and interspecies)(intra and interspecies)(intra and interspecies)
••• Covariate analysis for identification of Covariate analysis for identification of Covariate analysis for identification of predictors of variability in PK and PD predictors of variability in PK and PD predictors of variability in PK and PD (genetics, body weight, age, interactions etc)(genetics, body weight, age, interactions etc)(genetics, body weight, age, interactions etc)
Population PK/PDPopulation PK/PD modelling modelling

9
Prop
ofol
con
cent
ratio
n (m
g/l)
0
1
2
0 200 400 600
0
1
2
0 200 400 6000
1
2
0 200 400 600
0
1
2
0 200 400 600
0
1
2
0 200 400 6000
1
2
0 200 400 600
Best
Worst
Median
Ventilated childrenVentilated children (1(1--55 yrsyrs)) following following cardiac surgerycardiac surgery in the ICUin the ICU
Children Adults
Cl (l/min)
(ml/kg/min) 35*
2.3
28*
V1 (l)
(l/kg)
12
0.78*
21
0.26*
Q (l/min)
(l/kg/min)
0.35
23
1.4
18
V2 (l)
(l/kg)
24
1.54
139
1.88
Knibbe et al., Br J Clin Pharmacol 2002
6 samples of 2506 samples of 250 ulul per childper child6 children6 children

1010
• Applicable to sparse and unbalanced data sets (neonates, children, etc)
• Scientific basis for study/trial simulations, dose adjustment or labeling extensions in other populations (intra and interspecies)
••• Covariate analysis for identification of Covariate analysis for identification of Covariate analysis for identification of predictors of variability in PK and PD predictors of variability in PK and PD predictors of variability in PK and PD (genetics, body weight, age, interactions etc)(genetics, body weight, age, interactions etc)(genetics, body weight, age, interactions etc)
Population PKPDPopulation PKPD modelling modelling

11
PropofolPropofol in nonin non--ventilated childrenventilated children
0 200 400 600 800 1000 1200 time (min)
0.0
0.5
1.0
1.5
2.0Pr
opof
ol c
once
ntra
tion
(mg/
l)Knibbeobserved concRigby-JonesSchuttlercurrent study
Peeters MYM et al., Anesthesiology 2006 ; 104(3):466-474

12
PropofolPropofol inin nonventilatednonventilated childrenchildren
0 200 400 600 800 1000 1200 time (min)
0.0
0.5
1.0
1.5
2.0Pr
opof
ol c
once
ntra
tion
(mg/
l)Knibbeobserved concRigby-JonesSchuttlercurrent study
Peeters MYM et al., Anesthesiology 2006 Mar; 104(3):466-474

13
COMFORT-B6 behaviour items• alertness
• Calmness/agitation
• Respiratory response / crying
• Physical movement
• Muscle tone
• Facial tension

14
NonNon--agitated childrenagitated children
0 200 400 600 800 1000 1200 1400time (min)
6
12
18
24
30C
OM
FOR
T-B
0
0.2
0.8
0.6
0.4
Prop
ofol
con
cent
ratio
n (m
g/l)non-agitated, median performance
no propofol
1.0
20.00 h 07.00 h
Peeters et al., Anesthesiology, March 2006

15
0 200 400 600 800 1000 1200 1400time (min)
6
12
18
24
30
CO
MFO
RT-
B
0
0.2
0.8
0.6
0.4
Prop
ofol
con
cent
ratio
n (m
g/l)B) agitated, median performance
start propofol 18 mg/h
8.6 kg
24 mg/h
1.0
Peeters et al., Anesthesiology, March 2006
propofolpropofol
Agitated childrenAgitated children

16
Model based advisedModel based advised propofolpropofol dose dose 30 mg/h for a postoperative child of 10 kg30 mg/h for a postoperative child of 10 kg
0 200 400 600 800 1000 1200 1400time (min)
6
10
14
18
22C
OM
FOR
T-B
0.0
0.2
0.4
0.6
0.8
1.0
Pro
pofo
l con
cent
ratio
n (m
g/l)
Peeters et al., Anesthesiology, March 2006

1717
• Applicable to sparse and unbalanced data sets (neonates, children, etc)
• Scientific basis for study/trial simulations, dose adjustment or labeling extensions in other populations (intra and interspecies)
• Covariate analysis for identification of predictors of variability in PK and PD (genetics, body weight, age, interactions etc)
Population PKPDPopulation PKPD modelling modelling

18
Body weight or age?Body weight or age?
0 400 800 1200PCA
0
5000
10000
15000
BWS
ageage
1919
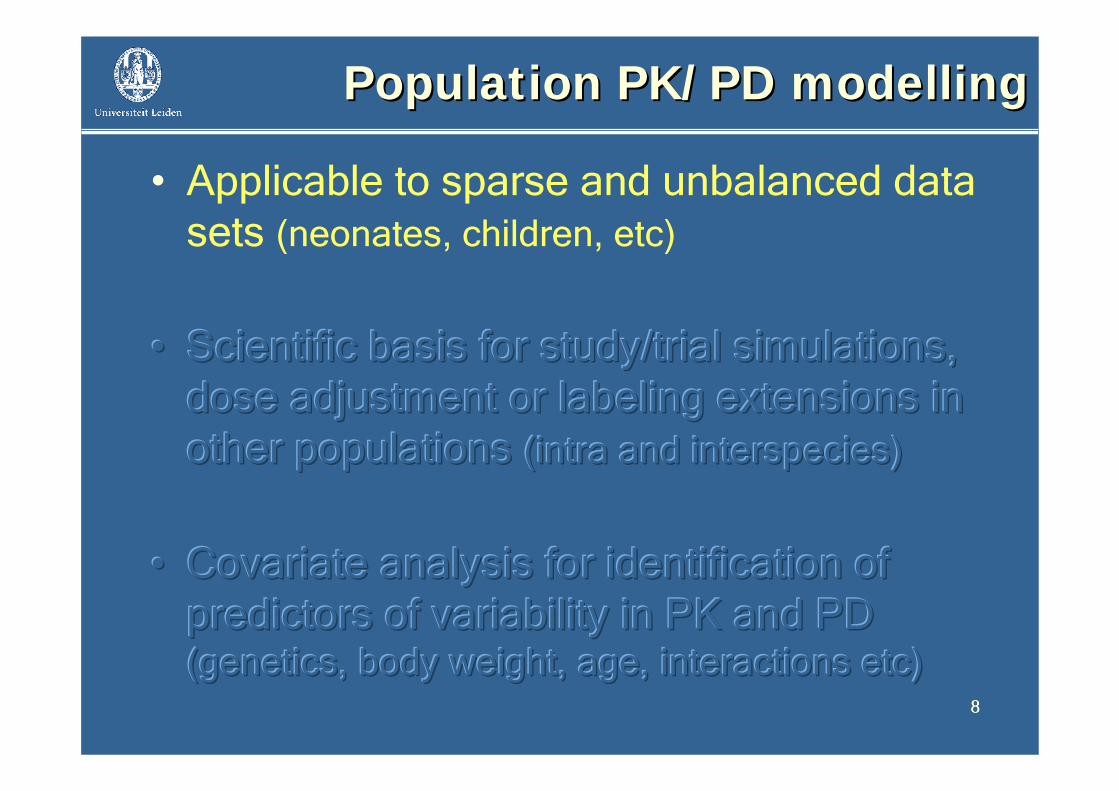
Identification of potential covariates (body weight, gender, age, renal function, PGx etc).
Graphical evaluation of each covariate versus• The individual post-hoc PK or PD parameter estimate
• the weighted residuals
Statistical evaluation using standard techniques1. Change in objective function 2. Standard error of the additional parameter3. Improvement of individual fits4. Diagnostics: B) observed versus model-predicted
Covariate analysisCovariate analysis
Krekels et al, Expert Opin. Pharmacother. (2007) 8(12):1787-1800Peeters MY et al., Anesthesiology, March 2006 and Dec 2006, CP&T March 2008
2020
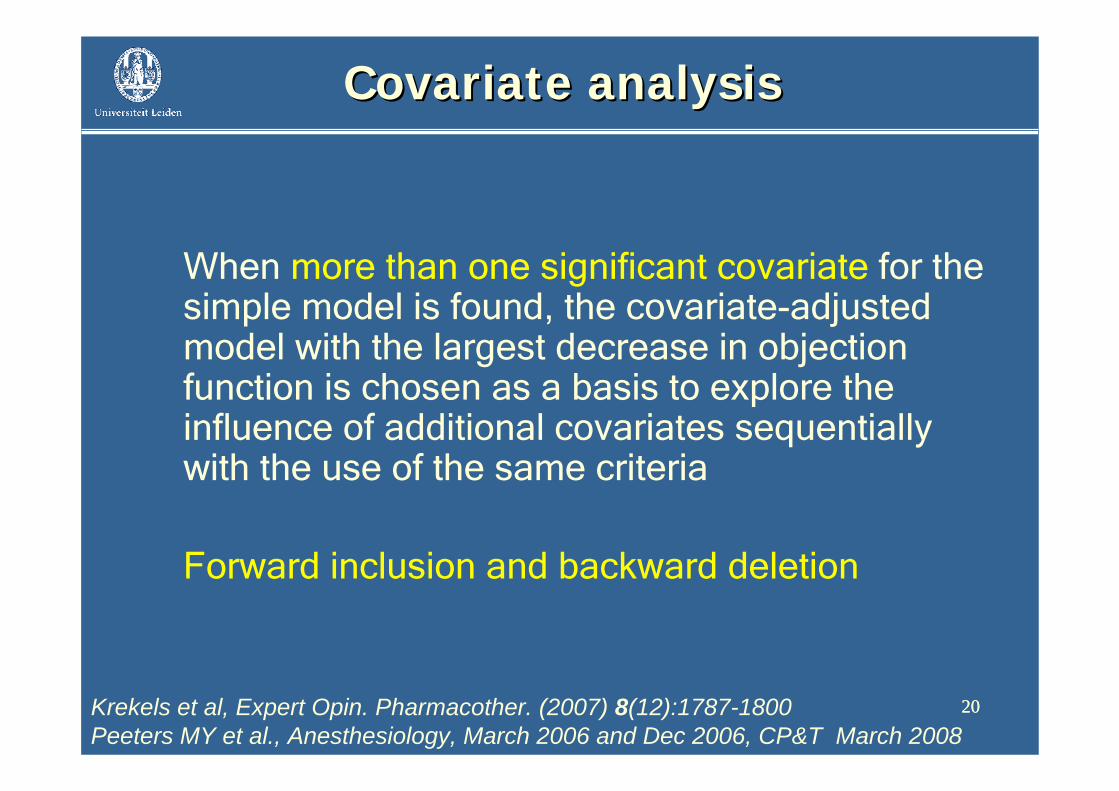
When more than one significant covariate for the simple model is found, the covariate-adjusted model with the largest decrease in objection function is chosen as a basis to explore the influence of additional covariates sequentially with the use of the same criteria
Forward inclusion and backward deletion
Covariate analysisCovariate analysis
Krekels et al, Expert Opin. Pharmacother. (2007) 8(12):1787-1800Peeters MY et al., Anesthesiology, March 2006 and Dec 2006, CP&T March 2008

2121
Nature of the influence of the covariate – preferably non-empirical (mechanism/physiologically
based)– Consider the possibility of potential extrapolation or
interpolation
Validation confirms the influence of thecovariates
Covariate analysisCovariate analysis
Krekels et al, Expert Opin. Pharmacother. (2007) 8(12):1787-1800Peeters MY et al., Anesthesiology, March 2006 and Dec 2006, CP&T March 2008
22
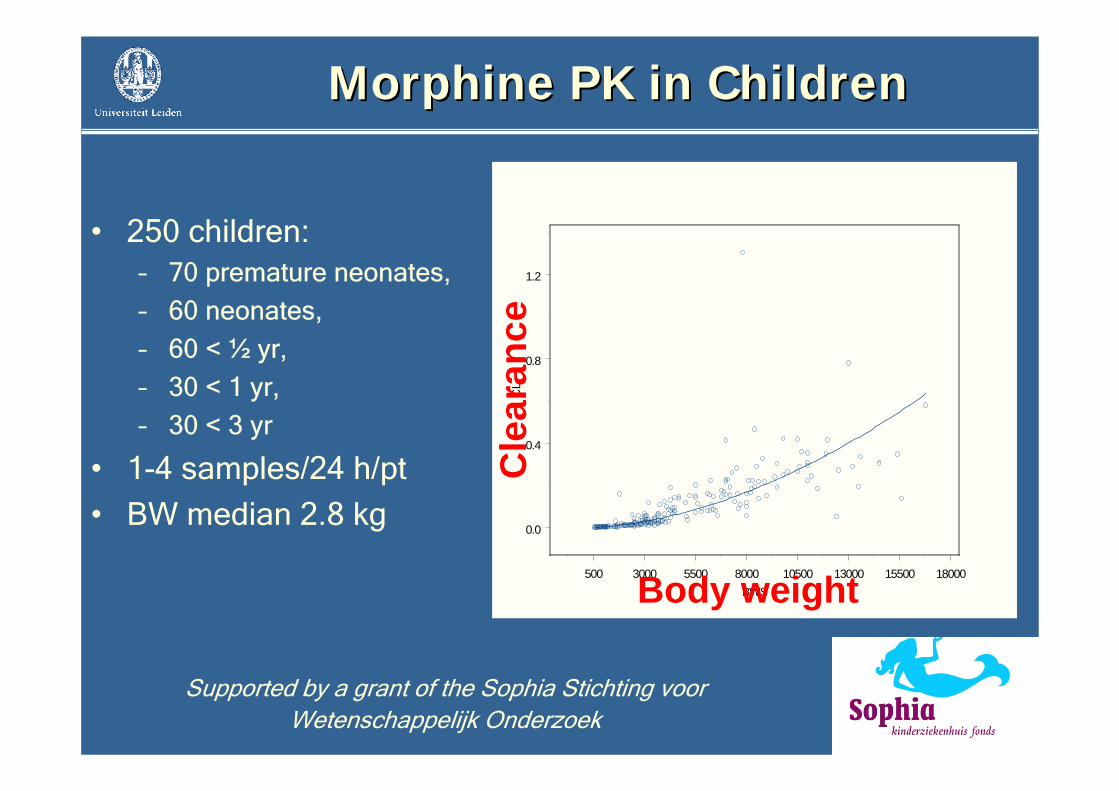
MorphineMorphine PK inPK in ChildrenChildren
Supported by a grant of the Sophia Stichting voorWetenschappelijk Onderzoek
500 3000 5500 8000 10500 13000 15500 18000BWS
0.0
0.4
0.8
1.2
CL
Body weight
Cle
aran
ce
• 250 children:– 70 premature neonates,
– 60 neonates,
– 60 < ½ yr,
– 30 < 1 yr,
– 30 < 3 yr
• 1-4 samples/24 h/pt
• BW median 2.8 kg

2310-1.0 100.0 101.0 102.0 103.02 3 4 5 6 2 3 4 5 6 2 3 4 5 6 2 3 4 5 6 2 3
PNA
-1.0
-0.5
0.0
0.5
ET1
Influence of post natal age >/< 10 dInfluence of post natal age >/< 10 d
Independent of gestational time or body weight at birth

24
Formation clearance to M3glucuronideFormation clearance to M3glucuronideobserved versus modelobserved versus model--predictedpredicted
Post natal age < 10 dPost natal age < 10 d Post natal age > 10 dPost natal age > 10 d
0 2500 5000 7500 10000 12500 15000 17500BWS
0.0
0.1
0.2
0.3
0.4
0.5
0.6
PNA > 10 days
0 1000 2000 3000 4000BWS
0.00
0.02
0.04
0.06

25
Validation of sparse data studiesValidation of sparse data studies
• Diagnostics(e.g. observed versus model-predicted)

26
Validation of sparse data studiesValidation of sparse data studies
• Diagnostics (e.g. observed versus model-predicted)
• Bootstrap resampling– repeated random sampling to produce another data set
(same size but different combination of individuals)– Compare parameters (250 times) with estimates from the original
data set
• Visual predictive check – Simulation with final estimates and compare the distribution of the
observations with the simulated distribution– Plot of the time course of the observations and prediction interval for
the simulated values

27
Validation of sparse data studiesValidation of sparse data studies
• Diagnostics (e.g. observed versus model-predicted)
• Bootstrap re-sampling – repeated random sampling to produce another data set
(same size but different combination of individuals)– Compare parameters (250 times) with estimates from the original
data set
• Visual predictive check – Simulation with final estimates and compare the distribution of the
observations with the simulated distribution– Plot of the time course of the observations and prediction interval for
the simulated values
• Normalised Prediction Discrepancy Errors (NPDE)
1) Brendel et al. Pharm. Res. 23(9); 2036-49 (2006)

Points to considerPoints to consider
• Use of the population approach (nonlinearmixed effects modelling) in all phases of the investigation
• Validation of population PKPD models
• Infrastructure for data sharing
• Neonates deserve further attention
28
29
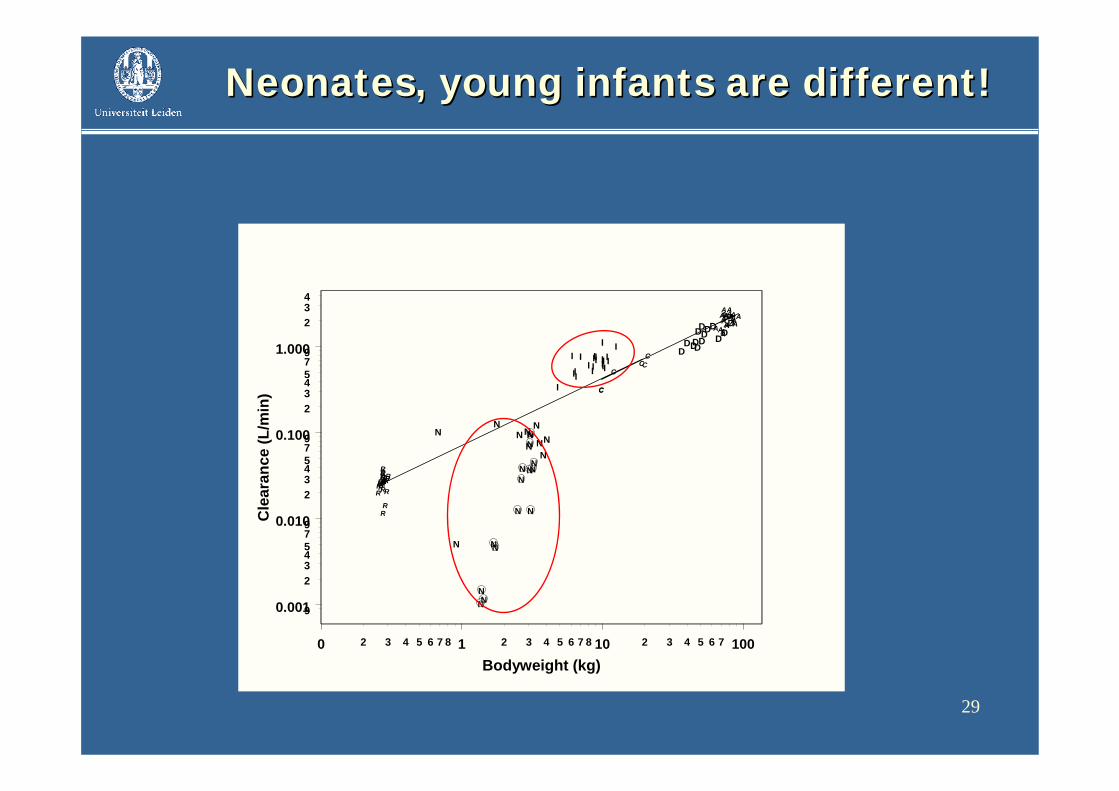
NeonatesNeonates,, young infantsyoung infants are different!are different!
0 1 10 1002 3 4 5 6 7 8 2 3 4 5 6 7 8 2 3 4 5 6 7
Bodyweight (kg)
0.001
0.010
0.100
1.000
9
234579
234579
234579
234
Cle
aran
ce (L
/min
)
R
RRRRRR
R
RR
R
RRR
RR
RRRR
RRRR
CC
C
CC
C
AA
A
A
AA
A
A
AAA
AAA
AAA AAA AA
A
A
N
NN
NN
NNN N
NN
DDD
D DDD D
DDDD
D DI I II IIII I
III
II
I II II
II
I
N
N
N
N
N
N
NN
N
N
NNNN

30
• Population PK-PD modelling (or non linear mixed effects modelling) should be the PRIMARY ANALYSIS METHOD in paediatric drug development and dosing studies
• Population PK-PD models can be also be developed based on data from PREVIOUS CLINICAL STUDIES (retrospective studies/meta analyses)
• Dosing regimen based on VALIDATED POPULATION PK-PD MODELS should be included in the LABEL of drugs
ConclusionsConclusions

• University-Industry consortium with 6 industrial partners(Eli Lilly, GSK, Johnson & Johnson, Organon, Nycomed, Pfizer)
• Unique infrastructure for data management, data analysis and reporting: sharing of data, models and biological system specific information
• Emphasis on key factors in drug discovery and development– Translational pharmacology (efficacy and safety)– Developmental pharmacology (pediatrics, elderly)– Disease system analysis
Mechanism-based PK-PD modeling platform

32
MultidisciplinaryMultidisciplinary,, multicentremulticentre researchresearch
Dr. M. vanDr. M. van DijkDijkDr. R.N. vanDr. R.N. van SchaikSchaikProf. dr. J.N. van denProf. dr. J.N. van den AnkerAnkerProf. dr. D.Prof. dr. D. TibboelTibboel
E.E. KrekelsKrekelsDr. J. DeDr. J. De JonghJonghDr. O. DellaDr. O. Della PasquaPasquaProf. Dr. M.Prof. Dr. M. DanhofDanhof
Dr. M.Y.M.Dr. M.Y.M. PeetersPeetersDr. C.A.J.Dr. C.A.J. KnibbeKnibbeSupported by NWO/Supported by NWO/VeniVeni
Leiden/AmsterdamCenter for Drug Research
Division of Pharmacology


![A PKPD Model-Based Meta-Analysis of Subcutaneously ......SC Clamp CL TOTAL =CL NS + CL MAX 1+ [INS]IC 50 A PKPD Model-Based Meta-Analysis of Subcutaneously Administered Insulins in](https://img.dokumen.tips/doc/110x75/60b0fba093c271142f613138/a-pkpd-model-based-meta-analysis-of-subcutaneously-sc-clamp-cl-total-cl.jpg)