Embed Size (px)
Citation preview

Introduction National accounts The goods market The financial market The IS-LM model
Introduction to Macroeconomics
Robert M. [email protected]
University of Vienna
and
Institute for Advanced Studies Vienna
February 23, 2010
Introduction to Macroeconomics University of Vienna and Institute for Advanced Studies Vienna

Introduction National accounts The goods market The financial market The IS-LM model
Outline
Introduction
National accounts
The goods market
The financial market
The IS-LM model
Introduction to Macroeconomics University of Vienna and Institute for Advanced Studies Vienna

Introduction National accounts The goods market The financial market The IS-LM model
Introduction: a tour of this course
1. Introductory issues
2. National accounts (Literature: Lecture notes byAnia-Martinez)
3. The goods market (Literature: Blanchard Ch. 3)
4. The financial market (Literature: Blanchard Ch. 4)
5. The IS-LM model (Literature: Blanchard Ch. 5)
6. The labor market (Literature: Blanchard Ch. 6)
7. The AS-AD model (Literature: Blanchard Ch. 7)
8. Phillips curve, Okun’s Law, and a small dynamic model:Blanchard Ch. 8–9
9. The open economy: Blanchard Ch. 18–20
Introduction to Macroeconomics University of Vienna and Institute for Advanced Studies Vienna

Introduction National accounts The goods market The financial market The IS-LM model
The structure of the sections 3–7
Goods market Financial market Labor market
Section 3 Section 4 Section 6
IS-LM model
Section 5
AS-AD model
Section 7
��
��
��
��
���
��
���
AAAAU
AAAU
Introduction to Macroeconomics University of Vienna and Institute for Advanced Studies Vienna

Introduction National accounts The goods market The financial market The IS-LM model
Introduction: a tour of the world
This section uses material from the original slides to accompanythe 5th edition of Blanchard Macroeconomics
Introduction to Macroeconomics University of Vienna and Institute for Advanced Studies Vienna
Introduction National accounts The goods market The financial market The IS-LM model
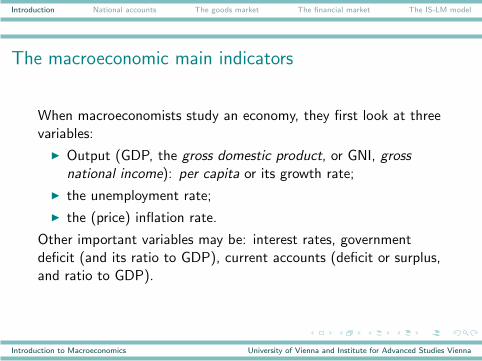
The macroeconomic main indicators
When macroeconomists study an economy, they first look at threevariables:
◮ Output (GDP, the gross domestic product, or GNI, gross
national income): per capita or its growth rate;
◮ the unemployment rate;
◮ the (price) inflation rate.
Other important variables may be: interest rates, governmentdeficit (and its ratio to GDP), current accounts (deficit or surplus,and ratio to GDP).
Introduction to Macroeconomics University of Vienna and Institute for Advanced Studies Vienna

Introduction National accounts The goods market The financial market The IS-LM model
GDP per capita across the world
Introduction to Macroeconomics University of Vienna and Institute for Advanced Studies Vienna

Introduction National accounts The goods market The financial market The IS-LM model
The Newman world map of GDP
Introduction to Macroeconomics University of Vienna and Institute for Advanced Studies Vienna

Introduction National accounts The goods market The financial market The IS-LM model
Output is not uniformly distributed
World output is concentrated in three major regions:
◮ The United States
◮ Europe
◮ East Asia
In a longer-run perspective, European (and maybe U.S.) shares inglobal output are in decline, and the Asian share increases. Europegrows slower than Asia. Growth in the developing countries isheterogeneous. Global convergence is doubtful.
Introduction to Macroeconomics University of Vienna and Institute for Advanced Studies Vienna

Introduction National accounts The goods market The financial market The IS-LM model
The United States
1970-2006 1996-2006 2006 2007 2008
output growth 3.1% 3.4% 3.3% 2.1% 2.5%unemployment rate 6.2 5.0 4.6 4.6 4.8
inflation rate 4.0 2.0 2.9 2.6 2.2
Before the global recession of 2009, output grew above 2% p.a.,unemployment was tolerable, and inflation was satisfactory.
Introduction to Macroeconomics University of Vienna and Institute for Advanced Studies Vienna

Introduction National accounts The goods market The financial market The IS-LM model
U.S. current accounts balance as % of GDP
1960 1970 1980 1990 2000
−6−5
−4−3
−2−1
01
The U.S. ‘imports’ more from abroad than it ‘exports’ (includesservices and transfers).
Introduction to Macroeconomics University of Vienna and Institute for Advanced Studies Vienna

Introduction National accounts The goods market The financial market The IS-LM model
Europe
1970-2006 1996-2006 2006 2007 2008
output growth 2.3% 2.0% 2.7% 2.6% 2.2%unemployment rate 7.4 8.7 7.6 7.0 6.7
inflation rate 5.4 1.8 1.7 1.8 2.2
Before the global recession of 2009, the core European countriesgrew more slowly than the U.S., unemployment was an issue ofconcern, while inflation was low.
Introduction to Macroeconomics University of Vienna and Institute for Advanced Studies Vienna

Introduction National accounts The goods market The financial market The IS-LM model
GDP per capita across Europe
Introduction to Macroeconomics University of Vienna and Institute for Advanced Studies Vienna
Introduction National accounts The goods market The financial market The IS-LM model
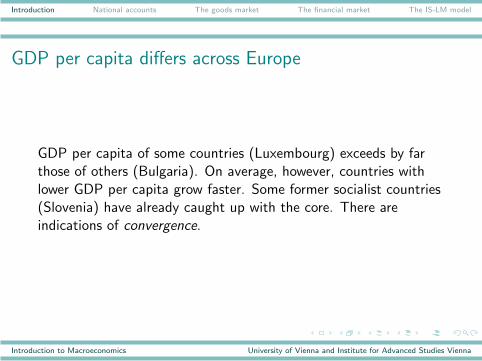
GDP per capita differs across Europe
GDP per capita of some countries (Luxembourg) exceeds by farthose of others (Bulgaria). On average, however, countries withlower GDP per capita grow faster. Some former socialist countries(Slovenia) have already caught up with the core. There areindications of convergence.
Introduction to Macroeconomics University of Vienna and Institute for Advanced Studies Vienna
Introduction National accounts The goods market The financial market The IS-LM model
Unemployment across Europe
Introduction to Macroeconomics University of Vienna and Institute for Advanced Studies Vienna

Introduction National accounts The goods market The financial market The IS-LM model
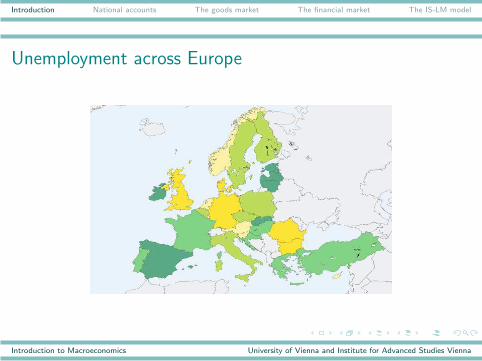
Unemployment is not homogeneous across Europe
The unemployment rate is low in Austria and the Netherlands, butexcessively high in Spain. In the aftermath of the global recession,unemployment is rising currently, and many countries have ratesabove 10%.
In the 1970s, the U.S. unemployment rate was above the Europeanrate, but this ordering has reversed in the 1980s.
Introduction to Macroeconomics University of Vienna and Institute for Advanced Studies Vienna

Introduction National accounts The goods market The financial market The IS-LM model
How can European unemployment be reduced?
There is still disagreement about the causes of high Europeanunemployment:
◮ Politicians often blame macroeconomic policy;
◮ Most economists believe, however, that the source of theproblem is labor market institutions;
◮ Some economists point to what they call labor marketrigidities;
◮ Other economists point to the fact that unemployment is nothigh everywhere in Europe.
Introduction to Macroeconomics University of Vienna and Institute for Advanced Studies Vienna

Introduction National accounts The goods market The financial market The IS-LM model
The common currency of Europe
Starting with a preliminary phase in the 1990s, many Europeancountries have adopted a common currency, the Euro. This stephas eliminated exchange-rate risk and likely boosted trade andgrowth. The instrument of independent monetary policy, however,has been lost. Was this responsible for the better performance ofPoland during the recent crisis as compared to Slovakia?
High budget deficits of member countries constitute a problem forthe remaining ones. Does this imply a common fiscal policy for theentire euro area?
Introduction to Macroeconomics University of Vienna and Institute for Advanced Studies Vienna

Introduction National accounts The goods market The financial market The IS-LM model
China
1980-2006 1996-2006 2006 2007 2008
Output growth rate 9.3% 8.8% 10.7% 10.0% 9.5%Inflation rate 5.4 3.3 1.5 2.5 2.2
Since 1980, Chinese output has grown at close to 10% per year,and the forecasts are for more of the same.
This is a truly astonishing number: Compare it to the 3.1%number achieved by the U.S. economy over the same period. Atthat rate, output doubles every 7 years.
Introduction to Macroeconomics University of Vienna and Institute for Advanced Studies Vienna

Introduction National accounts The goods market The financial market The IS-LM model
National accounts
For this section, see the lecture notes by Ana Ania-Martinez
Introduction to Macroeconomics University of Vienna and Institute for Advanced Studies Vienna

Introduction National accounts The goods market The financial market The IS-LM model
National accounts considers aggregates
Introduction to Macroeconomics University of Vienna and Institute for Advanced Studies Vienna

Introduction National accounts The goods market The financial market The IS-LM model
Macroeconomics and microeconomics: The ant-hillmetaphor
Macroeconomics sees the ant-hill as a whole. How much does itproduce, how fast will it be repaired after a shock?
Microeconomics sees the individual ants in the colony.
Can we describe mass action by analyzing individual ants?
Ants can be aggregated into sectors: queens, workers. There areanalogous sectors in the economy: households, firms.
Introduction to Macroeconomics University of Vienna and Institute for Advanced Studies Vienna

Introduction National accounts The goods market The financial market The IS-LM model
Ex-post and ex-ante
National accounts take stock of what has already happened: it isan ex-post system of bookkeeping.
Macroeconomic analysis wishes to know what will happen: it is anex-ante approach.
National accounts deliver the most important data formacroeconomic analysis. Understanding the past is a step towardknowing the future.
Introduction to Macroeconomics University of Vienna and Institute for Advanced Studies Vienna

Introduction National accounts The goods market The financial market The IS-LM model
The system of national accounts
Today’s national accounts follow international standardizations:the System of National Accounts 1993 (SNA93) and its Eurostatimplementation European System of Accounts 1995 (ESA95).
Apart from standardization, SNA93 and ESA95 also introducedsome new concepts and terminology. Older concepts and namesare met often in the media but they are now outdated.
Introduction to Macroeconomics University of Vienna and Institute for Advanced Studies Vienna

Introduction National accounts The goods market The financial market The IS-LM model
The main innovations of ESA95
1. Citizenship is no more crucial in describing economic agents orunits, the location of residence is decisive. An immigrant wholives and works in Vienna is an Austrian now. If he/shebecomes an Austrian citizen, this is irrelevant.
2. An economy (territory) produces, its aggregate production isthe domestic product. Its residents receive an aggregateincome not production, it is called national income. Theexpression national product is outdated.
3. Legality of production is irrelevant. Illegal drugs, illegalprostitution, the shadow economy all contribute to thedomestic product. These components must often beestimated (imputed).
4. Most non-corporate firms, farms, self-employed workplaces(lawyers, doctors) are now viewed as households.
Introduction to Macroeconomics University of Vienna and Institute for Advanced Studies Vienna

Introduction National accounts The goods market The financial market The IS-LM model
The institutional unit
In national accounts, the basic decision-making unit is theinstitutional unit—may correspond to the ‘economic agent’ ofeconomics—who is capable of owning assets, incurring liabilitiesand engaging in economic activities and transactions.
Typical economic units are households, firms, governmentalagencies (public households), etc.
Transactions between economic units generate income andproduction as measured by SNA. Transactions within a unit arenot measured. Value changes play a minor role.
Introduction to Macroeconomics University of Vienna and Institute for Advanced Studies Vienna

Introduction National accounts The goods market The financial market The IS-LM model
Stocks and flows
SNA focuses on flow variables that are defined over a time period.These may change stock variables that are measured at a timepoint.
The value of production, consumption, income over a year orquarter: all typical flow variables. GDP (gross domestic product) isthe most aggregated measure of all productive transactions, i.e. aflow variable.
Assets, such as money or wealth, and liabilities are stocks, as aree.g. population or unemployment.
Introduction to Macroeconomics University of Vienna and Institute for Advanced Studies Vienna

Introduction National accounts The goods market The financial market The IS-LM model
The metaphorical bathtub
A bathtub (or a water basin) has an inflow and an outflow of water.Inflow and outflow can only be measured over time, they are flows. Theamount of water in the basin is a stock.
The word ‘rich’ commonly refers to the wealth of a person, a stock. An
economy with a higher GDP per capita is regarded as ‘richer’ in the
media. Be careful! Great Britain may still be richer than Ireland, as her
stock of wealth (even per capita) far exceeds the Irish stock of wealth.
Introduction to Macroeconomics University of Vienna and Institute for Advanced Studies Vienna
Introduction National accounts The goods market The financial market The IS-LM model
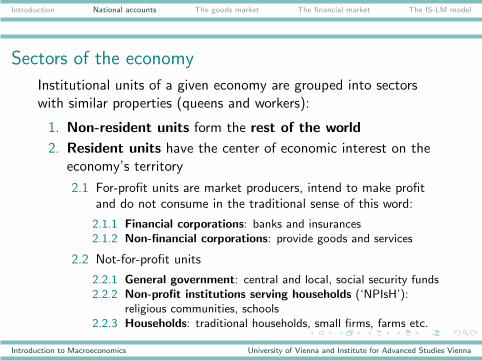
Sectors of the economy
Institutional units of a given economy are grouped into sectorswith similar properties (queens and workers):
1. Non-resident units form the rest of the world
2. Resident units have the center of economic interest on theeconomy’s territory
2.1 For-profit units are market producers, intend to make profitand do not consume in the traditional sense of this word:
2.1.1 Financial corporations: banks and insurances2.1.2 Non-financial corporations: provide goods and services
2.2 Not-for-profit units
2.2.1 General government: central and local, social security funds2.2.2 Non-profit institutions serving households (‘NPIsH’):
religious communities, schools2.2.3 Households: traditional households, small firms, farms etc.
Introduction to Macroeconomics University of Vienna and Institute for Advanced Studies Vienna

Introduction National accounts The goods market The financial market The IS-LM model
Market producers and public utilities
A general rule is that a market producer covers more than 50% ofits production costs by market sales. Most publicly owned firms(public transport, electricity) are classified as corporations.
The distinction is important for assessing the value of production.A non-market producer contributes by its production costs plusimputed taxes, a market producer by its true value added.
Introduction to Macroeconomics University of Vienna and Institute for Advanced Studies Vienna

Introduction National accounts The goods market The financial market The IS-LM model
The circular flow of income (simplified)
Households
Corporations
RoW Finance
Government
��
��
��
�+
consumptionprofits, wages
-trade deficit
importsexports
��
��
��
�3
?6
��
���
budget surplus
@@
@@R
income taxes
@@
@@Ipublic wages, benefits
CCCCCCCCCCCCW
private saving
-taxes-subsidies
HHHHHHHHHY
investment
HHHHHHHHHj
corp. saving
Introduction to Macroeconomics University of Vienna and Institute for Advanced Studies Vienna

Introduction National accounts The goods market The financial market The IS-LM model
Closed system
The economy represented in the diagram is a closed system, ateach node outflows equate inflows.
The diagram has been simplified in many ways. In the actualeconomy, households do import and export, for example. NPIsHhave been added to the household sector. The transformation ofsaving into investment does not necessarily move through thefinancial corporations. Households take loans etc.
We now analyze each of the nodes in detail.
Introduction to Macroeconomics University of Vienna and Institute for Advanced Studies Vienna

Introduction National accounts The goods market The financial market The IS-LM model
The household sector
Households receive distributed(!) profits from the corporations,wages from corporations and from the government. They pay(direct) taxes on income and profits to the government.
What remains after tax is called ‘disposable household income’.Out of that disposable income, households consume and purchasegoods and services mainly from corporations: private consumption.The household sector includes firms, so it also purchasesinvestment goods. What is not consumed, is called private saving.
Introduction to Macroeconomics University of Vienna and Institute for Advanced Studies Vienna
Introduction National accounts The goods market The financial market The IS-LM model
The corporations sector
Corporations produce goods and services and sell them tohouseholds (private consumption), to the government(intermediate goods for public consumption), and to abroad(exports). To this aim, they purchase goods and services fromother firms (intermediate consumption), partly from abroad(imports).
Corporations pay wages to households and diverse kinds of taxes tothe government: taxes on the wage bill, value added tax (these aretaxes on production or indirect taxes) and taxes on profits (directtaxes).
Introduction to Macroeconomics University of Vienna and Institute for Advanced Studies Vienna

Introduction National accounts The goods market The financial market The IS-LM model
More on the corporations sector
Corporations do not consume. What remains after paying taxes,wages, and dividends is all saved: corporate saving or undistributedearnings of corporations.
All saving flows to the corporations sector as investment. This isan important role of the corporations: SNA calls investmentcapital formation. Investment increases the production capacityand the stock of wealth of an economy.
Investment is the installation of new produced production facilities:machinery, transport machines (trucks, cars), buildings, livestock.The purchase of assets is not macroeconomic investment.
Introduction to Macroeconomics University of Vienna and Institute for Advanced Studies Vienna

Introduction National accounts The goods market The financial market The IS-LM model
The government sector
General government receives taxes from all other sectors.
The government sector (or public sector) pays wages to itsemployees and benefits to households, t.ex. unemploymentbenefits. It produces public goods and services. These non-marketgoods are consumed by itself (public consumption).
Subsidies are negative taxes, each category of taxes has itscorresponding subsidies. Many transactions that are called‘subsidies’ in the media are not subsidies but negative profits orpublic consumption.
Introduction to Macroeconomics University of Vienna and Institute for Advanced Studies Vienna

Introduction National accounts The goods market The financial market The IS-LM model
The finance node
The finance node of the flow chart does not really match thefinancial corporations sector. It serves to express the redistributionof saving as investment. At the end of the day, saving equals
investment.
Introduction to Macroeconomics University of Vienna and Institute for Advanced Studies Vienna

Introduction National accounts The goods market The financial market The IS-LM model
Types of saving
There are four types of saving:
1. Household saving: Austrian households consume less than90% of their disposable income, all the rest is ‘saved’ forfuture consumption;
2. Government saving: the balance of government revenues andexpenditure is often passive, so government saving does notcontribute much;
3. Corporate saving: firms may retain some of their profits;
4. Saving of the RoW: Investment can also be financed byrunning a trade deficit, this is what the U.S. have been doingfor a long time. Note: not the profits of exporting firms arethis saving, just to the contrary!
Introduction to Macroeconomics University of Vienna and Institute for Advanced Studies Vienna

Introduction National accounts The goods market The financial market The IS-LM model
The rest of the world
Non-residents communicate with residents via exports and imports.
Exports are goods and services produced in the economy and soldabroad. This includes tourism exports: foreigners visiting Austria.
Imports are goods and services produced abroad and used orconsumed in the economy. This includes tourism imports:Austrians travelling abroad.
The flow chart depicts flows of payments not goods. Thus, exportsare directed from the RoW to corporations, and vice versa forimports.
Introduction to Macroeconomics University of Vienna and Institute for Advanced Studies Vienna

Introduction National accounts The goods market The financial market The IS-LM model
Three views of gross domestic product
For didactic exposition, GDP is often seen as fulfilling threeequivalent definitions:
1. GDP as the sum of all expenditure on final products
2. GDP as the sum of all income
3. GDP as the sum of all value added in all production units
In fact, SNA has only one definition, the last one. The other twoare only approximately identical.
Introduction to Macroeconomics University of Vienna and Institute for Advanced Studies Vienna

Introduction National accounts The goods market The financial market The IS-LM model
Why the three ‘definitions’ differ
Goods may be produced in a time period but not sold before itsend. They add to the inventory. Part of the GDP but not of thefinal sales.
Goods may be taken from the existing inventory and sold. Onlythe value added in the retail sales adds to GDP, not the full valueof the product.
A company may be owned by foreigners who take out all profits.These profits are part of GDP but not of national income.
Introduction to Macroeconomics University of Vienna and Institute for Advanced Studies Vienna

Introduction National accounts The goods market The financial market The IS-LM model
The value added
����
����b b
Raw head
mining
Eyes factory-
����b b������
Mouth & ears
?
����bb������
Nose & finish
�aaaaaaaabbbaaaaaaaaRetail sale �
Introduction to Macroeconomics University of Vienna and Institute for Advanced Studies Vienna

Introduction National accounts The goods market The financial market The IS-LM model
Avoid double counting
Adding up the values of all intermediate stages of the productexaggerates the value of production. We may either
1. record the value at the retail seller only or
2. add up all value differences of output and input at allintermediate stages: values added.
Both ways lead to the same value, unless the product (head)remains unfinished at the end of the time interval of measurement.
Introduction to Macroeconomics University of Vienna and Institute for Advanced Studies Vienna

Introduction National accounts The goods market The financial market The IS-LM model
GDP I as aggregate final expenditure
This ‘GDP’ is the sum of all final domestic expenditure plusexports minus imports:
GDP =∑
net final sales = C + I + G + X − IM
C is private consumption, I is investment (capital formation), G isgovernment consumption, X is exports, and IM denotes imports.
Introduction to Macroeconomics University of Vienna and Institute for Advanced Studies Vienna

Introduction National accounts The goods market The financial market The IS-LM model
The macroeconomic accounting identity
The accounting identity GDP = C + I + G + X − IM (theaccount 0 of SNA) is correct if and only if
1. Investment I includes changes in inventories: inventory
investment. True investment is called fixed investment;
2. GDP and all expenditure components are measured at marketprices. Easy job for C and I but the market price ofnon-market G must be imputed: costs plus value added tax.
Introduction to Macroeconomics University of Vienna and Institute for Advanced Studies Vienna

Introduction National accounts The goods market The financial market The IS-LM model
Final consumption expenditure
SNA attempts to merge sales to households C and publicconsumption G as final consumption expenditure that is brokendown into:
1. Individual consumption expenditure includes C (householdsand NPIsH) and that part of G for which individuals could beidentified that consume it: education, health services;
2. Collective consumption expenditure is that part of G thatcannot be allotted to individual beneficiaries: street lighting,police, defense.
Introduction to Macroeconomics University of Vienna and Institute for Advanced Studies Vienna

Introduction National accounts The goods market The financial market The IS-LM model
A typical distribution of GDP among demand components
Introduction to Macroeconomics University of Vienna and Institute for Advanced Studies Vienna

Introduction National accounts The goods market The financial market The IS-LM model
GDP II as value added
By SNA definition, GDP is the sum of all values added inproduction processes for goods and services, i.e.
GDP =∑
gross value added,
where gross value added is the price of output minus the price ofinput that is ‘transformed or used up in the production process’.This input or intermediate consumption does not include wagesand the depreciation of machinery!
Introduction to Macroeconomics University of Vienna and Institute for Advanced Studies Vienna

Introduction National accounts The goods market The financial market The IS-LM model
Basic prices
All production and intermediate consumption is recorded at basic
prices, i.e. without product taxes such as tariffs and value addedtax (VAT). Because GDP must be at market prices, the taxes(minus subsidies, ‘net taxes’) must be added. Thus, we have
GDP =∑
total gross value added+product taxes−product subsidies
VAT is ‘deductible’: producers just pay for the value added, not forintermediate consumption. Only the final user must pay the fullprice. In SNA convention, producers pay VAT to government, notthe consumer who just pays the market price.
Introduction to Macroeconomics University of Vienna and Institute for Advanced Studies Vienna

Introduction National accounts The goods market The financial market The IS-LM model
GDP III as aggregate income
All income that is paid out of the value added in production(primary income) can be broken down into:
1. compensation of employees (salaries and wages);
2. operating surplus (‘profits’) and mixed income (of theself-employed);
3. property income;
4. taxes on production minus subsidies (‘indirect taxes’).
Thus, one may also write
GDP =∑
primary incomes
Introduction to Macroeconomics University of Vienna and Institute for Advanced Studies Vienna

Introduction National accounts The goods market The financial market The IS-LM model
Why is GDP called ‘gross’?
The word ‘gross’ often refers to the inclusion of some taxes. InSNA, ‘gross’ means ‘inclusive of capital depreciation’ orconsumption of fixed capital. A net domestic product can becalculated by subtracting the value of capital depreciation, whichoften has to be imputed (guessed). With non-market goods, thereis a reverse problem: costs plus taxes plus imputed depreciationyield the gross value added.
Similarly, gross value added minus depreciation yields ‘net valueadded’. Particularly: gross investment minus depreciation is net
investment.
Introduction to Macroeconomics University of Vienna and Institute for Advanced Studies Vienna
Introduction National accounts The goods market The financial market The IS-LM model
National income
GDP is the sum of all primary incomes generated on the territoryof an economy. It is not the aggregate income of the residents. Toobtain this gross national income (GNI), we must adjust GDP forthe flows of primary incomes across borders:
GNI = GDP − balance of primary incomes of the RoW
GNI is a better indicator of the standard of living in an economy.However, GDP and GNI are typically very similar: in mostindustrialized economies, border-crossing flows of profits nearlycancel out. Remittances are not primary incomes!
Introduction to Macroeconomics University of Vienna and Institute for Advanced Studies Vienna

Introduction National accounts The goods market The financial market The IS-LM model
National disposable income
In SNA, ‘disposable income’ is income minus income taxes andother transfers out plus possibly some transfers in. For the totaleconomy, transfers out are for example remittances and nettransfers to the EU. Thus, typically national disposable income
is less than GNI for developed economies.
For the household sector alone, personal disposable income is animportant determinant for consumption C . Roughly, it ishousehold income minus income taxes.
Transfer income is also called secondary income.
Introduction to Macroeconomics University of Vienna and Institute for Advanced Studies Vienna

Introduction National accounts The goods market The financial market The IS-LM model
What is a transfer?
Transactions may be classified into:
1. requited or bilateral transactions: goods are exchanged formoney, assets for other assets, such as money for shares,goods for goods;
2. unrequited or unilateral transactions are transfers: transfersof goods to support the poor (transfers in kind), voluntarytransfers (donations), and obligatory transfers (taxes).
Introduction to Macroeconomics University of Vienna and Institute for Advanced Studies Vienna

Introduction National accounts The goods market The financial market The IS-LM model
Summary of the aggregated measures
GDP – Balance of primary incomes of the RoW = gross nationalincome (GNI)
GNI – Balance of current transfers of the RoW = gross nationaldisposable income (GNDI)
GNDI – consumption of fixed capital = net national disposableincome (NNDI)
Introduction to Macroeconomics University of Vienna and Institute for Advanced Studies Vienna
Introduction National accounts The goods market The financial market The IS-LM model
The balance of payments
The balance of payments (BOP) is not really a part of the SNAbut it is related. It records an economy’s border-crossingtransactions in two main parts:
1. the current accounts (CA) keep track of all border-crossingflows of goods and services, primary incomes, and ‘current’transfers;
2. the capital accounts (KA) keep track of all border-crossingtransfers of assets and liabilities.
Here, the word ‘capital’ is used in a sense different from SNA. Nomachinery and buildings cross borders here, just the propertyrights.
Introduction to Macroeconomics University of Vienna and Institute for Advanced Studies Vienna

Introduction National accounts The goods market The financial market The IS-LM model
The current accounts
The CA part of BOP is composed of three sub-accounts:
1. The trade balance records all border-crossing flows of goodsand services, imports and exports. The usage of the word‘trade balance’ just for goods is inofficial now. Still, one maydivide the trade balance into balances for goods, for services,and for other products;
2. The balance of primary incomes records all flows of wages,salaries, profits across borders. It determines the discrepancybetween GDP and GNI;
3. The transfer balance records all transfer flows in and out,including remittances, EU transfers etc.
Introduction to Macroeconomics University of Vienna and Institute for Advanced Studies Vienna

Introduction National accounts The goods market The financial market The IS-LM model
CA and KA are mirror images
A country may have a deficit (or surplus) in the trade balance(trade deficit) or in the current accounts (current accounts deficit)but not in the BOP as a whole.
If an economy has a CA deficit, foreigners will acquire assets inthis economy. This is called capital inflow, although no physicalcapital flows. The CA balance and the KA balance will be identicalwith reversed signs, except for short-run positions of currency ormaybe reserves. Textbooks have CA+KA=0, but there are sizeablestatistical discrepancies.
Introduction to Macroeconomics University of Vienna and Institute for Advanced Studies Vienna

Introduction National accounts The goods market The financial market The IS-LM model
Economies may be borrowing or saving economies
In simplified terms, the account 0 of SNA
GDP = C + I + G + X − IM
yields, after correcting for flows of incomes and transfers
GNDI = C + I + G + CA.
Some manipulation yields (using GNDI = C + Sp + T )
(Sp − I ) + (T − G ) = CA,
where Sp is private saving (households and firms) and T are taxes.A CA deficit means that I exceeds total saving, while A CA surplusmeans that total domestic saving exceeds I .
Introduction to Macroeconomics University of Vienna and Institute for Advanced Studies Vienna
Introduction National accounts The goods market The financial market The IS-LM model
Real and nominal accounts
All positions in SNA are available at current prices, i.e. in nominalterms. Formally, one may envisage adding up weighted quantities:
Nominal GDP(t) =∑
j
PjtQ
jt ,
with Pjt the price for product (good or service) j at time t and Q
jt
the quantity of j produced.
For intertemporal comparisons, it is convenient to have access topositions in constant prices, i.e. in real terms. Such real aggregatesare available for all expenditure components, though not forincome components.
Introduction to Macroeconomics University of Vienna and Institute for Advanced Studies Vienna

Introduction National accounts The goods market The financial market The IS-LM model
GDP at constant prices
To determine real GDP, a suggestion would be to record prices forall goods in a base year t = 0:
Real GDP(t) =∑
j
Pj0Q
jt .
This idea corresponds to the so-called Paasche price index. It waspursued until around 2000. Note that real and nominal GDPcoincide in the base year.
Introduction to Macroeconomics University of Vienna and Institute for Advanced Studies Vienna

Introduction National accounts The goods market The financial market The IS-LM model
Price indexes
If there was only one product, its price increase Pt/Pt−1 wouldclearly indicate ‘inflation’ in the economy. If there are twoproducts, we could average prices:
P1t + P2
t
P1t−1 + P2
t−1
This may not be a good idea, if good 1 is far more important andits produced quantity is far larger than that of good 2. Theproduct prices must be weighted!
Introduction to Macroeconomics University of Vienna and Institute for Advanced Studies Vienna

Introduction National accounts The goods market The financial market The IS-LM model
The Paasche price index or deflator
A simple weighting scheme is to use the quantities correspondingto t:
P1t Q1
t + P2t Q2
t
P1t−1Q
1t + P2
t−1Q2t
or, for many products: ∑j P
jtQ
jt
∑j P
jt−1Q
jt
This answers the question: by how much has the price of thecurrently produced GDP (or any one of its components)increased/decreased?
Introduction to Macroeconomics University of Vienna and Institute for Advanced Studies Vienna

Introduction National accounts The goods market The financial market The IS-LM model
Properties of the Paasche deflator
1. If a product with a high price increase is consumed/producedless, only its current quantity enters. Thus, Paasche deflatorstend to under-estimate inflation.
2. If the base year is t − 1, the Paasche deflator corresponds tothe above suggestion of calculating GDP at constant prices:
GDPr (t) =∑
j
Pjt−1Q
jt =
∑j P
jtQ
jt
∑j P
jt−1Q
jt
∑j P
jtQ
jt
=GDPn(t)
Paasche(t − 1, t),
with GDPn and GDPr denoting nominal and real GDP.
Introduction to Macroeconomics University of Vienna and Institute for Advanced Studies Vienna

Introduction National accounts The goods market The financial market The IS-LM model
The Laspeyres index
An alternative to Paasche would be to weight individual prices withquantities of a base year:
∑j P
jtQ
j0∑
j Pjt−1Q
j0
This is a Laspeyres index. It answers the question: by how muchhas the price of the basic ‘basket’ tuned to year 0increased/decreased?The Laspeyres concept is often used to calculate basket indexes forspecific purposes: consumer price index (CPI), tourist index,pensioner’s price index etc.
Introduction to Macroeconomics University of Vienna and Institute for Advanced Studies Vienna

Introduction National accounts The goods market The financial market The IS-LM model
Properties of the Laspeyres index
1. High-inflation goods that are substituted out by consumersremain in the index with full basket weights. Laspeyresindexes tend to over-estimate price inflation.
2. New goods enter the market but they are not in the basket.Some goods change from year to year. Hedonic prices try toprice utility characteristics of goods (speed of computers)instead of good prices.
Introduction to Macroeconomics University of Vienna and Institute for Advanced Studies Vienna

Introduction National accounts The goods market The financial market The IS-LM model
How real GDP is calculated according to SNA
Since around 2000, real GDP is determined by dividing currentnominal GDP by a geometric average of a continually updatedPaasche and a Laspeyres index. The same is done for allexpenditure components (consumption, investment, exports).
The drawback of this Fisher index is that real GDP is no more thesum of its real components. Identities do not hold exactly, the yearis no more the sum of its quarters. Note that identities still holdfor nominal aggregates.
Introduction to Macroeconomics University of Vienna and Institute for Advanced Studies Vienna

Introduction National accounts The goods market The financial market The IS-LM model
GDP deflator versus consumer price index
The GDP deflator differs from the CPI in two aspects:
1. The GDP deflator records the price change in GDP not inprivate consumption. There is also a consumption deflatorthat differs from CPI.
2. The GDP deflator is a Paasche or Fisher index, the CPI isLaspeyres.
Introduction to Macroeconomics University of Vienna and Institute for Advanced Studies Vienna

Introduction National accounts The goods market The financial market The IS-LM model
1980 1985 1990 1995 2000 2005
12
34
56
7
%
Inflation according to three price indexes. Red: consumptiondeflator, green: CPI, blue: GDP deflator.
Introduction to Macroeconomics University of Vienna and Institute for Advanced Studies Vienna

Introduction National accounts The goods market The financial market The IS-LM model
Further reading on national accounts
◮ Haslinger, Franz Volkswirtschaftliche Gesamtrechnung,1995, Oldenbourg: gives a good German-language summaryof the old SNA;
◮ Jackson, Dudley The New National Accounts, 2000, EdwardElgar: an up-to-date introduction into all SNA details.
Introduction to Macroeconomics University of Vienna and Institute for Advanced Studies Vienna

Introduction National accounts The goods market The financial market The IS-LM model
Introduction to Macroeconomics University of Vienna and Institute for Advanced Studies Vienna

Introduction National accounts The goods market The financial market The IS-LM model
Introduction to Macroeconomics University of Vienna and Institute for Advanced Studies Vienna
![Wiener Zeitschrift für die Kunde des Morgenlandes 96, 2006 ...homepage.univie.ac.at/helmut.satzinger/Texte/RezBrowne.pdfGrammatik (Introduction to Old Nubian. [Meroitica 11.] Berlin](https://img.dokumen.tips/doc/110x75/612714ac6f16047a4234f729/wiener-zeitschrift-fr-die-kunde-des-morgenlandes-96-2006-grammatik-introduction.jpg)