Embed Size (px)
Citation preview

LimitsLearning objectives:
Notation: Piecewise graphs
One common function you’ve already seen that is a piece-wise function is the absolute value function. It can be described in function notation as:
Write in piece-wise notation:
Consider the following piece-wise function:
Sketch the graph and evaluate it at
using your TI-83 to graph a piecewise function (The TEST button):Plot the piecewise graph of:
1

Test Yourself:Graph the following piecewise function:
Meet the tangent problemhttp://webspace.ship.edu/msrenault/GeoGebraCalculus/derivative_at_a_point.html
Recall the slope formula:
What’s the problem with the tangent problem?What is a Limit?http://webspace.ship.edu/msrenault/GeoGebraCalculus/limit_intuitive.html
In simple terms…
How does it help us solve the tangent problem?
Notation: Left and Right sided limits
Strategies for Evaluating Limits
Strategy #1: Direct substitution2
3lim 2 1x
x x
2
0
sinlimx
xx
Strategy #2: Using a graph
2
ln ln 2lim2x
xx
Using your TI-83’s TRACE button To trace the values of a limit graphically, use the TRACE button You should use the ZOOM button to get smaller increments of x Another handy zoom is the ZBOX zoom
Hit enter at opposite corners of the “box” you want the graph to zoom to
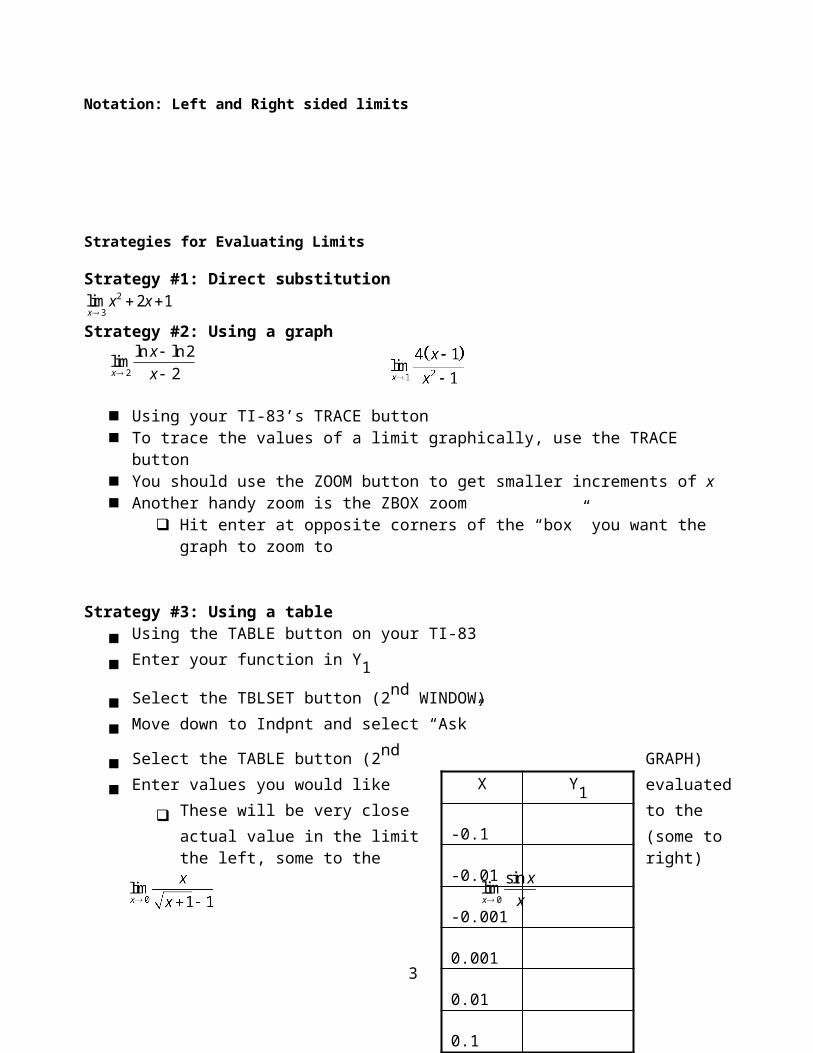
Strategy #3: Using a table Using the TABLE button on your TI-83 Enter your function in Y1
Select the TBLSET button (2nd WINDOW) Move down to Indpnt and select “Ask”
Select the TABLE button (2nd GRAPH) Enter values you would like evaluated
These will be very close to the actual value in the limit (some to the left, some to the right)
Explain when/why a limit does not existo Jump discontinuityo Infinite discontinuityo Oscillating discontinuity
3
X Y1
-0.1
-0.01
-0.001
0.001
0.01
0.1

An idea of where we’re headed: Graphically Algebraically
Evaluating a function vs. evaluating a limit
4
x=a Limit x a f(a)
1
3
4
5
7
9

Find the limit from the graph given:
Test yourself:
Using graphical and numerical methods, find
x f(x)
Find the value of the function and the limit as givenf(-1) f(2)
5

Evaluating Limits AnalyticallyLimit Laws
Suppose Sum Rule: Difference Rule:
Product Rule: Constant Multiple Rule:
Quotient Rule: Power Rule:
Take a look at the graphs of and
why do you think they are related? Can you
show it below?
Can you evaluate without using the graph or your calculator?
6

Indeterminate form of a limit (simple):
Strategy #1 – Factoring
Strategy #2 – RationalizingRecall the pattern of rationalizing by using the conjugate:
Evaluate:
Strategy #3 – Make a Common Denominator
7

What about: ?
Test yourself:
8

The squeeze theorem:
Prove:
Prove:
9

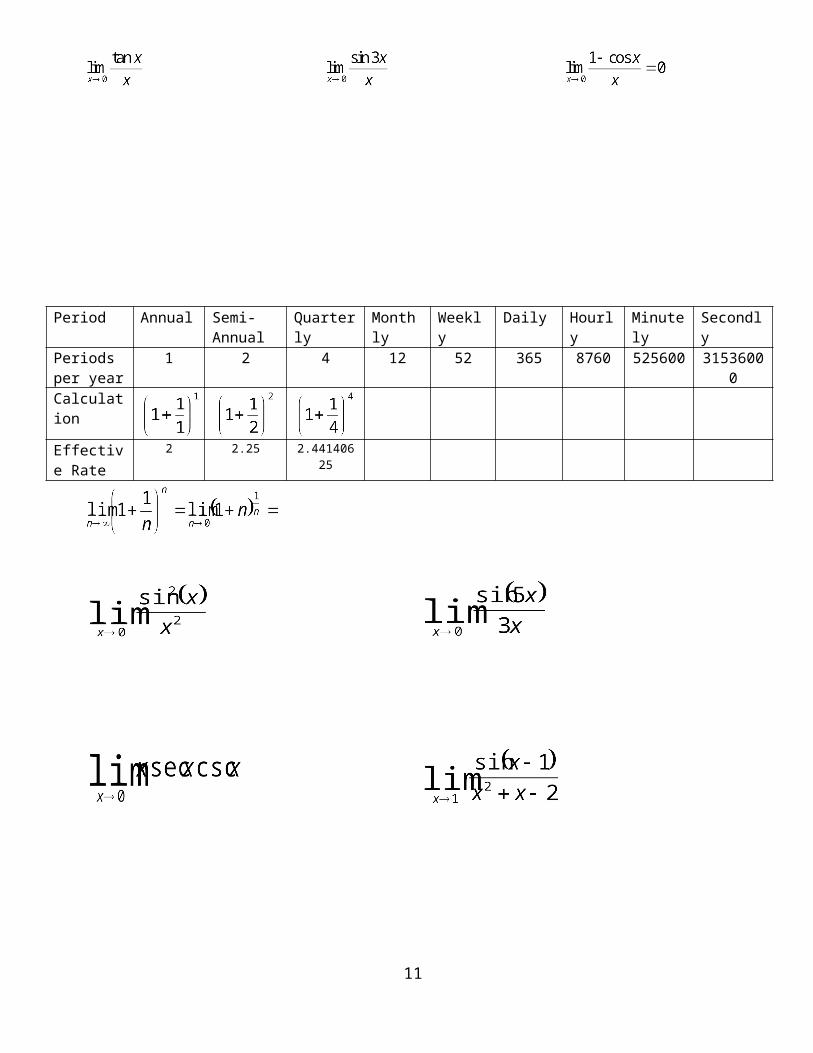
Other useful limits that follow from the one above:
Period Annual Semi-Annual
Quarterly Monthly Weekly Daily Hourly Minutely Secondly
Periods per year
1 2 4 12 52 365 8760 525600 31536000
Calculation
Effective Rate
2 2.25 2.44140625
10
Test yourself:
11

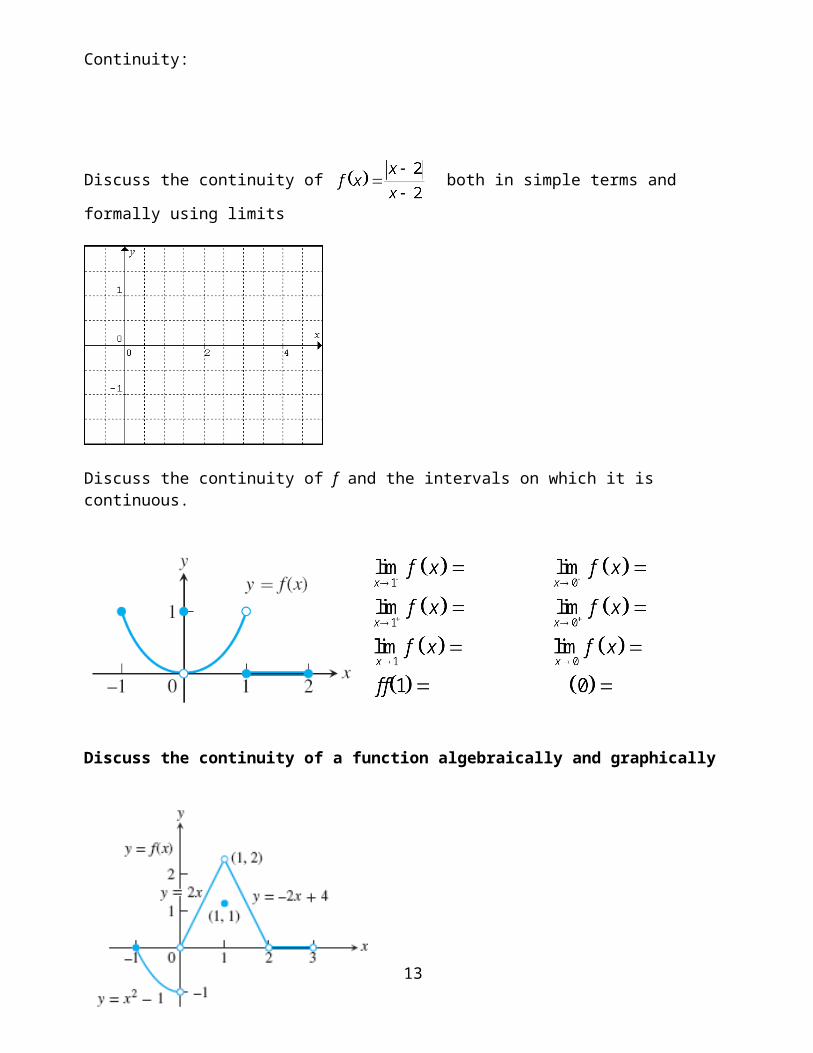
Continuity:
Discuss the continuity of both in simple terms and formally using limits
Discuss the continuity of f and the intervals on which it is continuous.
Discuss the continuity of a function algebraically and graphically
Removable Discontinuities:Removable Discontinuities:12
Nonremovable DiscontinuitiesNonremovable Discontinuities::
Discuss the continuity of the following graph, identify the type of discontinuities:
Discuss the continuity of the following functions algebraically and then graph them to illustrate your findings:
13
1 2 3 4
1
2

What value of a would make the following function continuous:
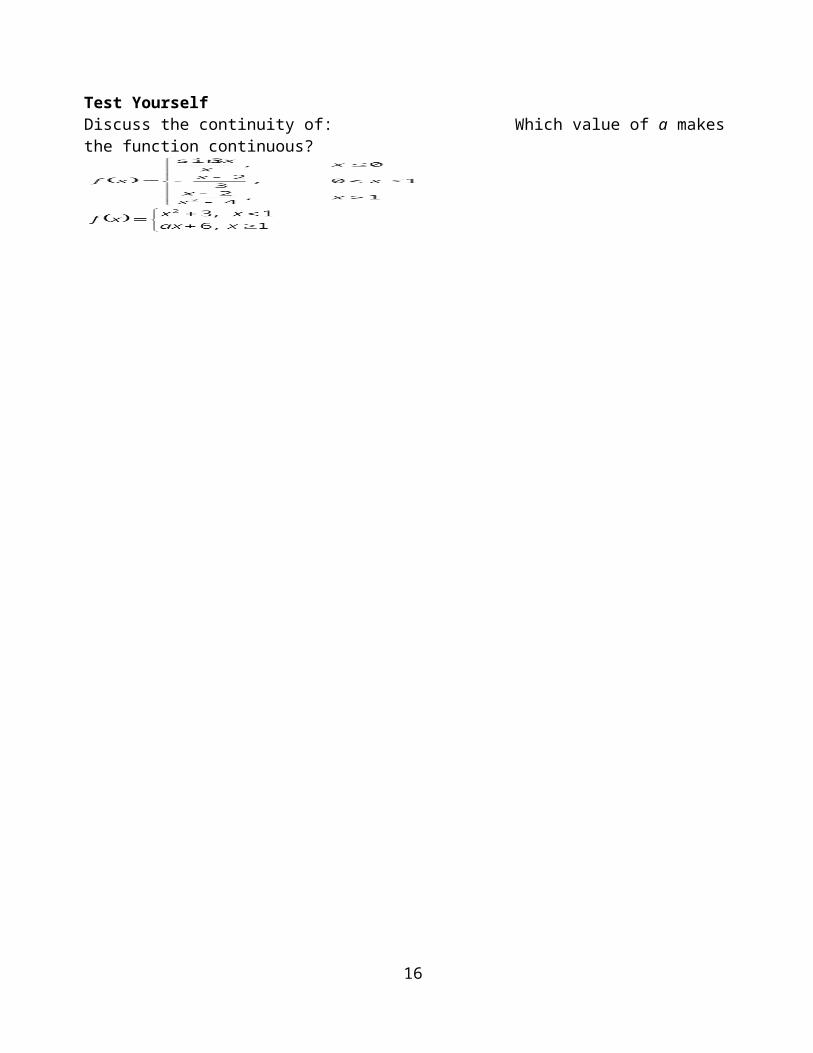
Test Yourself Discuss the continuity of: Which value of a makes the function continuous?
14

Intermediate Value Theorem:
Without graphing, show that the function has at least one zero on the interval given
Determine which intervals the IVT applies and explain why or why not:
(a) [−4, −2] (b) [−3,0] (c) [−1,1] (d) [1,4.5] (e) [2,7]
The velocity of a particle moving horizontally along the x-axis is given by the continuous function v(t), where t is measured in seconds and v(t) is measured in feet per second. Selected values of v(t) are given below.
t 0 2 4 5 7v(t) -3 0.5 2 -1 -3
What is the minimum number of times that the particle was at rest?
Test yourself:
15
b b
f a
f b
A car travels on a straight track. During the time interval seconds, the car’s velocity v, measured in feet per second, is a continuous function. The table above shows selected values of v(t).For 0 < t < 60, must there be a time t when ? Justify your answer.
The functions f and g are continuous for all real numbers. The table gives values of the functions at selected values of x. Given that , explain why there must be a value r, 1< r < 3 such that
*This portion was worth 2 points (AB3a – 2007) – average score 0.97/9
Find infinite limits when the limit is not defined
Let’s look at the graph of : Table of values near x = 2
Finding infinite limits will help us find vertical asymptotes in the graph.Vertical Asymptote Theorem 1.14:
16
1 6 22 9 33 10 44 -1 6
X Y1
1.9
1.99
1.999
2.001
2.01
2.1

How can you predict if the limit will be positive of negative infinity?Number Line Strategy:
Left and Right sided limit strategy:
Find the vertical asymptotes, the limit on either side, and verify with your graphing calculator:
What about ?
Find:
17

Test Yourself:Describe the continuity of the graphs given below and if the graph has asymptotes find the limits on either side:
Find:
Using your graphing calculator, evaluate:
18

Definition of a horizontal asymptote (using limits):
Limits at infinity theorem 3.10Suppose, r is a positive rational number, and c is any real number,
Evaluate the limit:
We’ve already discussed the intermediate form of a limit , now we’ll discuss strategies for
finding limits when the intermediate form is .
Use your graphing calculator to find the horizontal asymptote(s) of the graph .
Could you have predicted this algebraically?Strategy #1: Dividing out the highest power
Limits at of rational functions:Case 1: Highest exponents are the same
19

Case 2: Denominator has the highest exponent
Case 3: Numerator has the highest exponent
Limits at infinity of radical functions:
Prove Find:
What about ?
Test Yourself:
20

Sketch the inverse graph alongside the function below:
Can you restrict the domains so that the inverse graph is also a function (passes horizontal line test)?
Restricted Domain Range
Resulting consequences for their inversesDomain Range
Edit your sketch of the inverse graphs above to reflect the changes you made.find:
How are these answers different from:
What about
21

Test yourself:
22