Embed Size (px)
Citation preview
Introduction to Japan’sIntroduction to Japan s
“Smart Community”Smart Community
Tatsuya Shinkawa
Chief RepresentativeRepresentative Office in Washington, DC
New Energy and Industrial TechnologyDevelopment Organization (NEDO), Japan
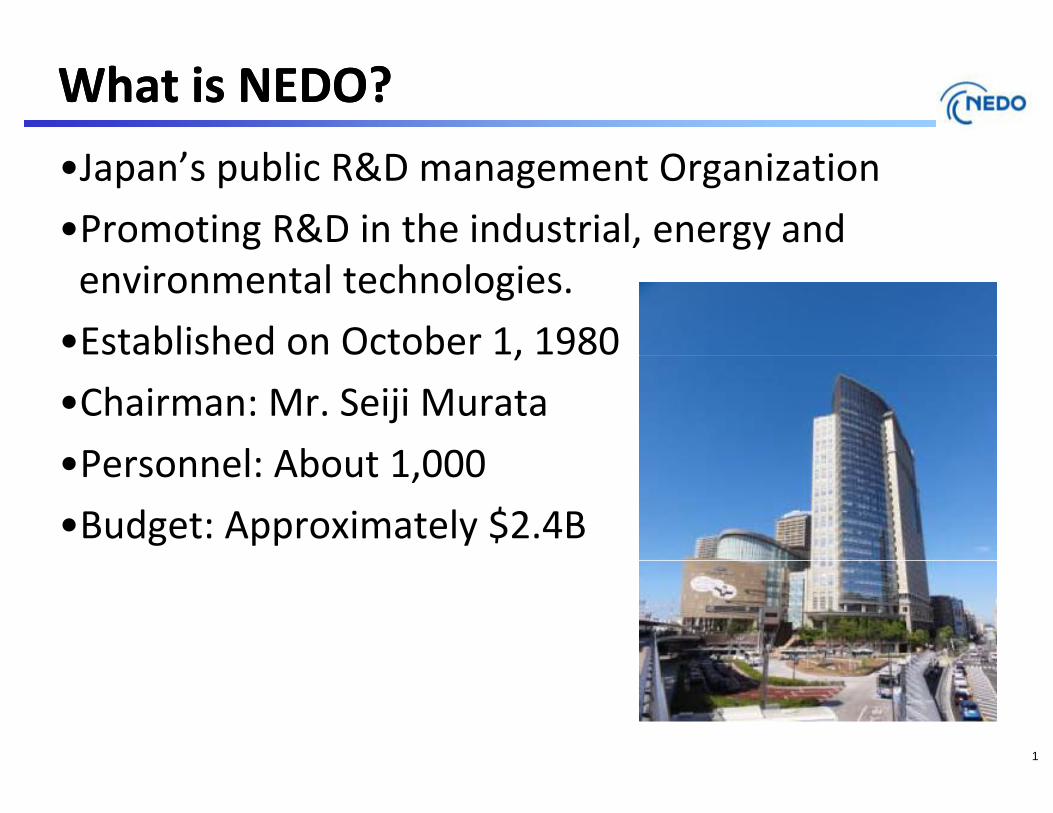
What is NEDO?What is NEDO?
•Japan’s public R&D management Organization
•Promoting R&D in the industrial, energy and environmental technologies.
•Established on October 1, 1980,
•Chairman: Mr. Seiji Murata
•Personnel: About 1 000•Personnel: About 1,000
•Budget: Approximately $2.4B
1
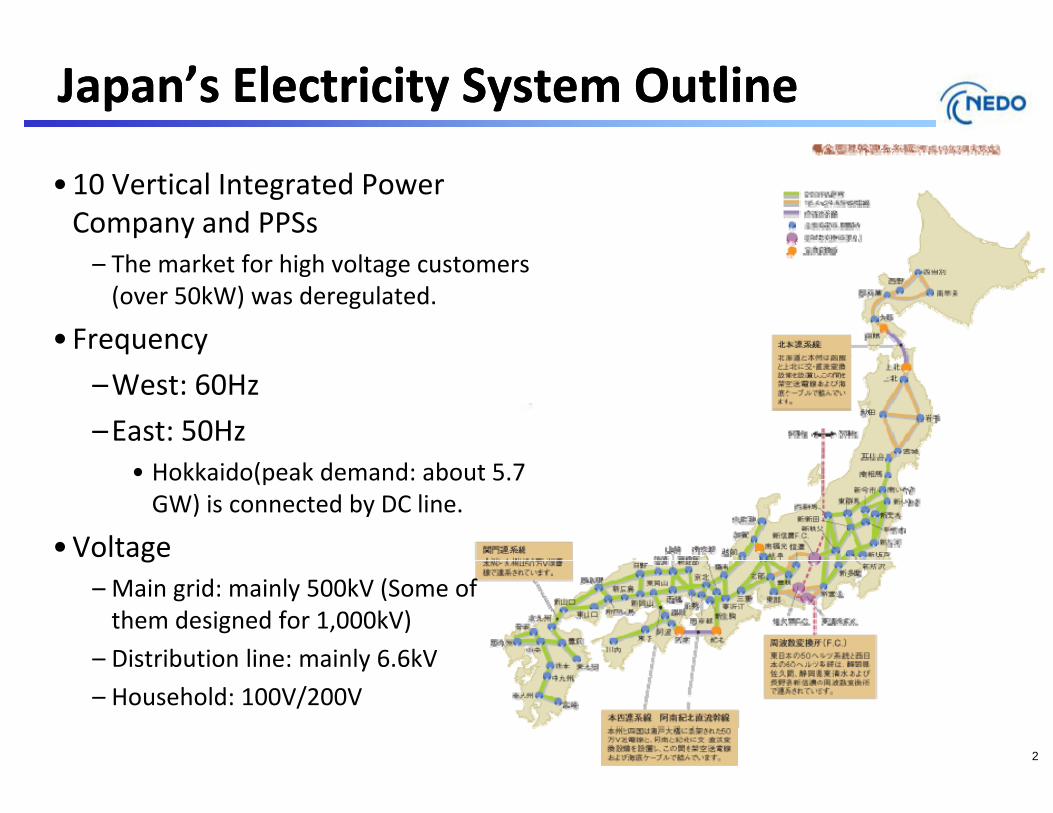
Japan’s Electricity System OutlineJapan’s Electricity System Outline
•10 Vertical Integrated Power Company and PPSs– The market for high voltage customers (over 50kW) was deregulated.
• Frequency
–West: 60Hz
–East: 50Hz• Hokkaido(peak demand: about 5.7 GW) is connected by DC line.
•Voltageg– Main grid: mainly 500kV (Some of them designed for 1,000kV)
– Distribution line: mainly 6 6kV
2
Distribution line: mainly 6.6kV
– Household: 100V/200V
Japan’s Current Electricity System 1Japan’s Current Electricity System 1
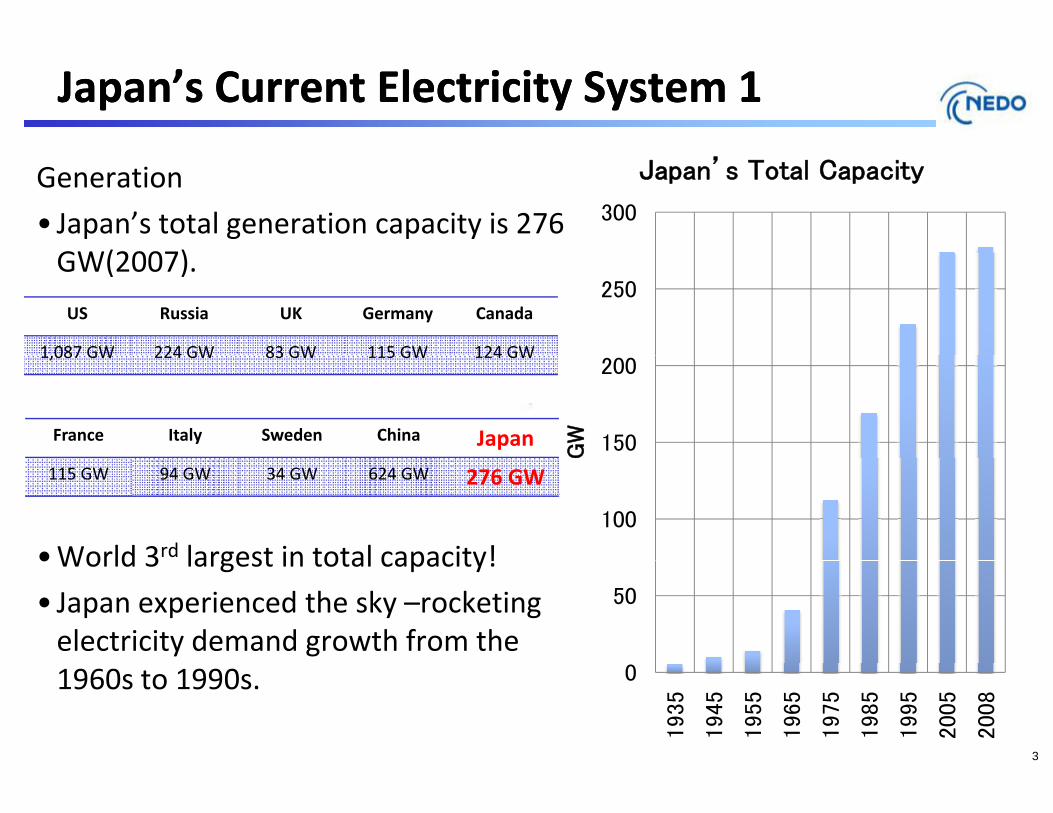
Generation
• Japan’s total generation capacity is 276 GW(2007)
300
Japan’s Total Capacity
GW(2007).
US Russia UK Germany Canada
1 087 GW 224 GW 83 GW 115 GW 124 GW
250
1,087 GW 224 GW 83 GW 115 GW 124 GW
France Italy Sweden China Japan 150
200
GW
•World 3rd largest in total capacity!
115 GW 94 GW 34 GW 624 GW 276 GW
100
•World 3 largest in total capacity!
• Japan experienced the sky –rocketing electricity demand growth from the
50
3
1960s to 1990s. 01935
1945
1955
1965
1975
1985
1995
2005
2008
Japan’s Current Electricity System 2Japan’s Current Electricity System 2
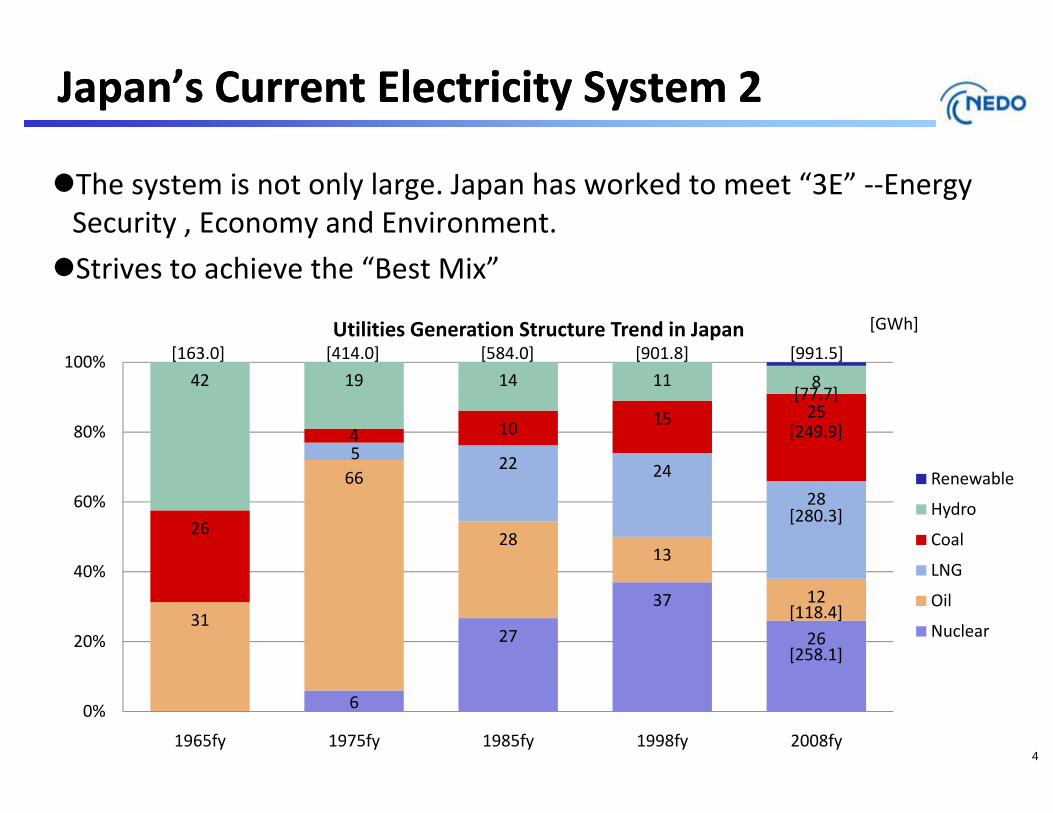
The system is not only large. Japan has worked to meet “3E” ‐‐Energy Security , Economy and Environment.
Strives to achieve the “Best Mix”
%
Utilities Generation Structure Trend in Japan[584 0][414 0] [901 8] [991 5][163 0]
[GWh]
5 22
4 10 15 25
42 19 14 11 8
80%
100% [584.0][414.0] [901.8] [991.5]
[249.9]
[163.0]
[77.7]
66
2813
5 22 24
28
26
60%Renewable
Hydro
Coal[280.3]
27
37
2631
3
12
20%
40% LNG
Oil
Nuclear[258.1]
[118.4]
4
60%
1965fy 1975fy 1985fy 1998fy 2008fy
[ ]
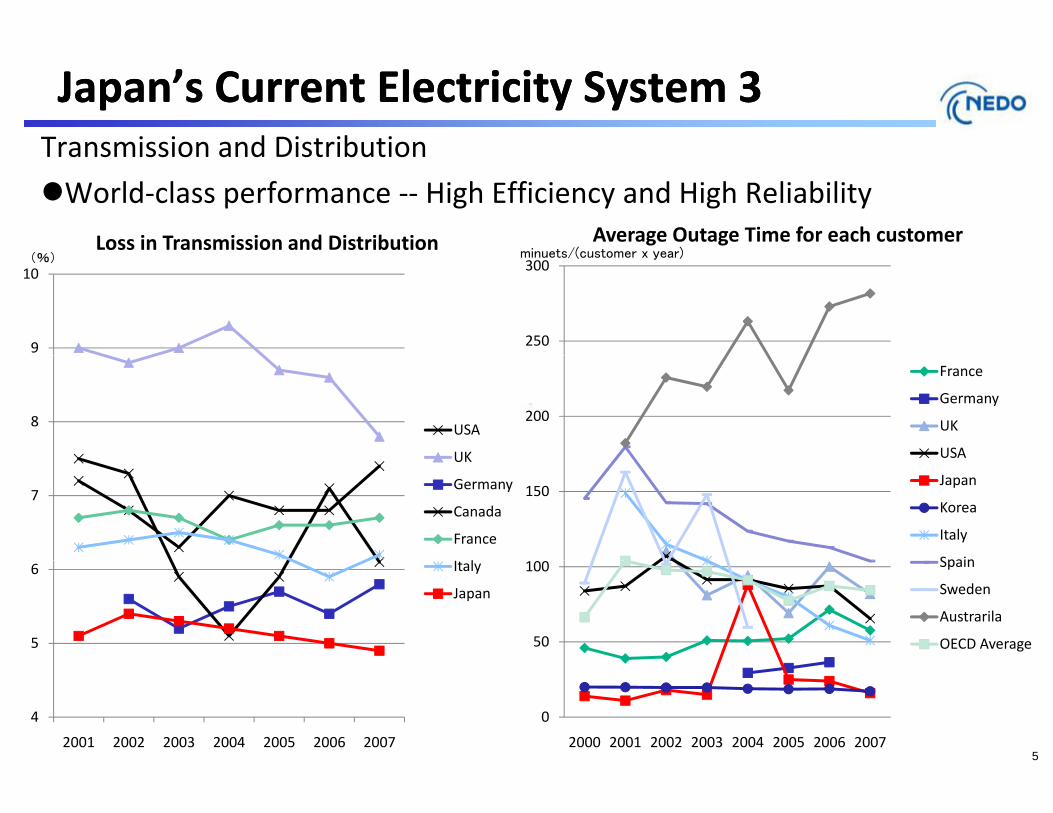
Transmission and Distribution
Japan’s Current Electricity System 3Japan’s Current Electricity System 3Transmission and Distribution
World‐class performance ‐‐ High Efficiency and High Reliability
Loss in Transmission and Distribution( )
Average Outage Time for each customerminuets/(customer x year)
9
10(%)
250
300minuets/(customer x year)
8 USA
UK
200
France
Germany
UK
USA
7
UK
Germany
Canada
France
l
150Japan
Korea
Italy
Spain
5
6 Italy
Japan
50
100 Spain
Sweden
Austrarila
OECD Average
5
4
2001 2002 2003 2004 2005 2006 2007
0
2000 2001 2002 2003 2004 2005 2006 2007
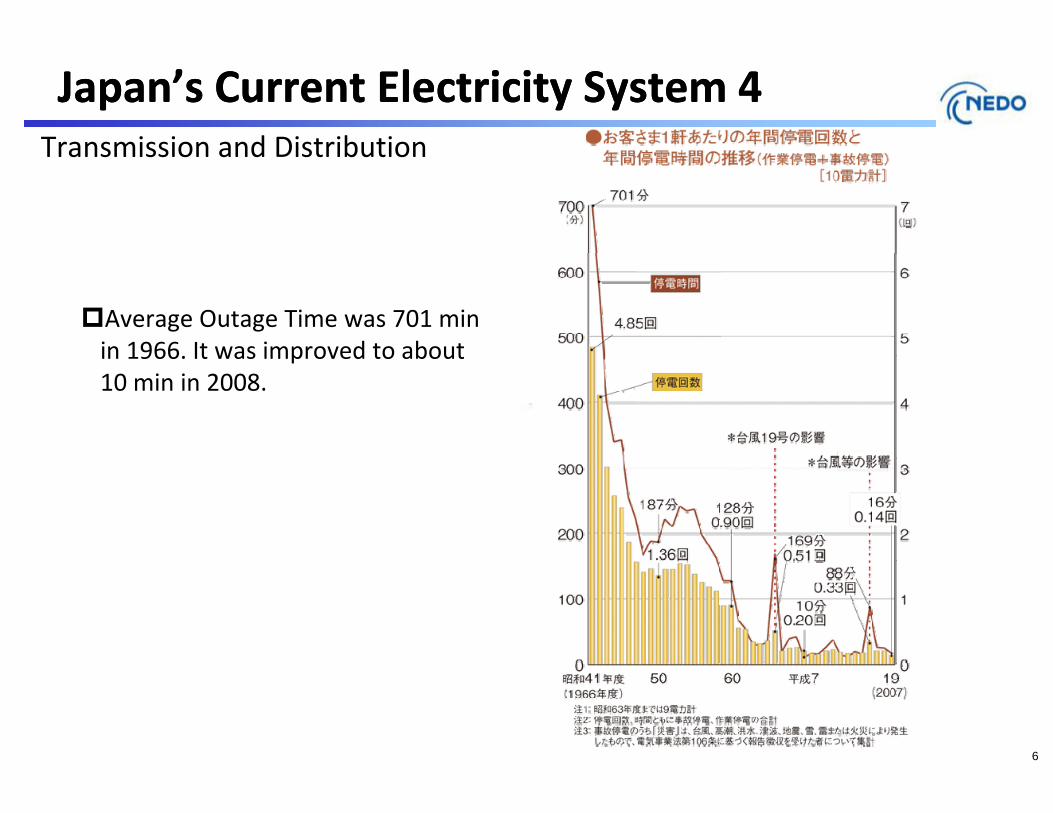
Transmission and Distribution
Japan’s Current Electricity System 4Japan’s Current Electricity System 4Transmission and Distribution
Average Outage Time was 701 min in 1966 It was improved to aboutin 1966. It was improved to about 10 min in 2008.
6
Next Step for Japan 1Next Step for Japan 1
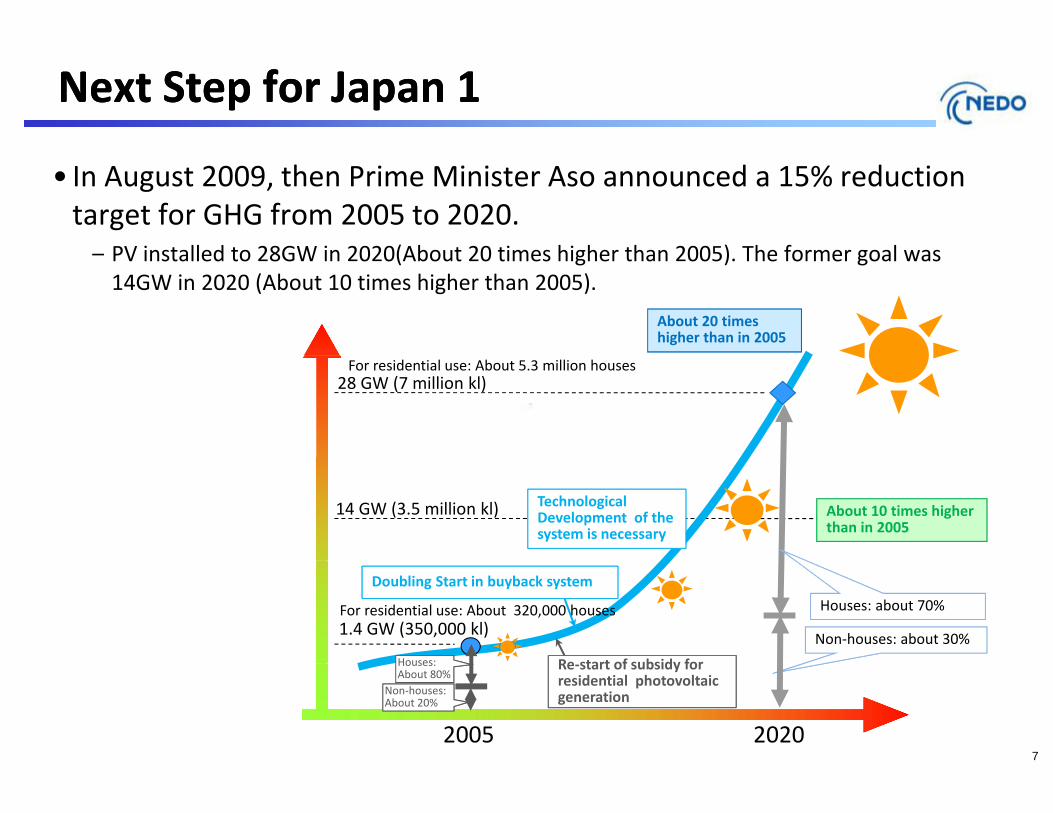
• In August 2009, then Prime Minister Aso announced a 15% reduction target for GHG from 2005 to 2020.
PV installed to 28GW in 2020(About 20 times higher than 2005) The former goal was– PV installed to 28GW in 2020(About 20 times higher than 2005). The former goal was 14GW in 2020 (About 10 times higher than 2005).
About 20 times higher than in 2005
For residential use: About 5.3 million houses28 GW (7 million kl)
14 GW (3.5 million kl) Technological Development of the system is necessary
About 10 times higher than in 2005
Houses:
Houses: about 70%
Non‐houses: about 30%1.4 GW (350,000 kl)
Re start of subsidy for
Doubling Start in buyback system
For residential use: About 320,000 houses
720202005
Houses: About 80%
Non‐houses: About 20%
Re‐start of subsidy for residential photovoltaic generation
Next Step for Japan 2Next Step for Japan 2
S b 2009 h i i i d• In September 2009, then Prime Minister Hatoyama announced a 25% reduction target for GHG from 1990 to 2030 (depending on widespread global acceptance). p g p
• In June 2010, the Strategic Energy Plan in Japan was revised.– Targets for 2030
( ) D bl h lf ffi i i i l d h lf(a) Double the energy self‐sufficiency ratio in energy supply and the self‐developed fossil fuel supply ratio, and as a result raise the energy independence ratio from current 38% to about 70%
(b) R i th i i t f t 34% t(b) Raise the zero‐emission power source percentage from current 34% to about 70%
(c) Cut by half the CO2 emissions from the residential sector
(d) Maintain and enhance energy efficiency in the industrial sector at the highest level in the world.
(e) Maintain or obtain a large share of global markets for energy‐related
8
products and systems
Next Step for Japan 3Next Step for Japan 3
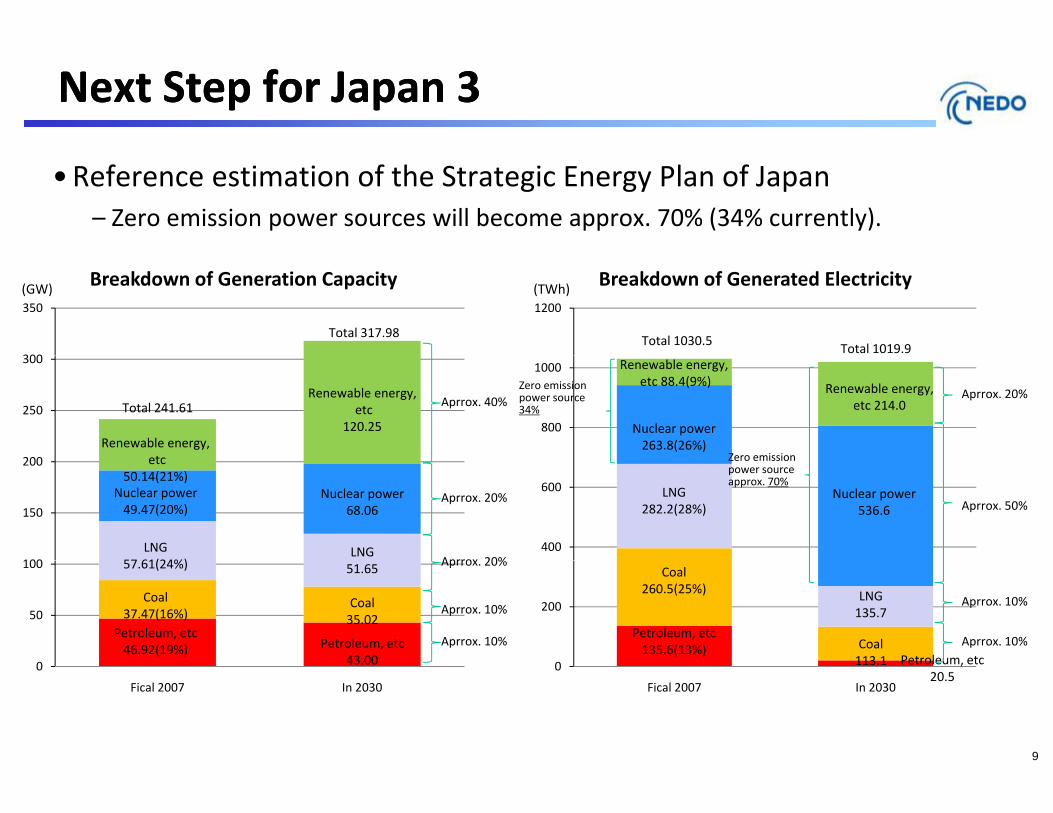
•Reference estimation of the Strategic Energy Plan of Japan– Zero emission power sources will become approx. 70% (34% currently).
300
350
Breakdown of Generation Capacity(GW)
Total 317.98
1200
Breakdown of Generated Electricity(TWh)
Total 1030.5 Total 1019.9
200
250
300
Renewable energy,etc
Renewable energy,etc
120.25Total 241.61 Aprrox. 40%
800
1000
Nuclear power263.8(26%)
Renewable energy,etc 88.4(9%) Renewable energy,
etc 214.0Aprrox. 20%
Zero emission
Zero emission power source 34%
100
150
200
LNG57 61(24%)
Nuclear power49.47(20%)
etc50.14(21%)
LNG
Nuclear power68.06
Aprrox. 20%
Aprrox 20%400
600 LNG282.2(28%)
Nuclear power536.6 Aprrox. 50%
Zero emission power source approx. 70%
0
50
100
Petroleum, etc46.92(19%)
Coal37.47(16%)
57.61(24%)
Petroleum, etc43.00
Coal35.02
51.65 Aprrox. 20%
Aprrox. 10%
Aprrox. 10%
0
200
Petroleum, etc135.6(13%)
Coal260.5(25%)
Petroleum, etcCoal113 1
LNG135.7
Aprrox. 10%
Aprrox. 10%
9
0
Fical 2007 In 2030
43.00 0
Fical 2007 In 2030
Petroleum, etc20.5
113.1
Renewable Energy Promotion PolicyRenewable Energy Promotion Policy
•Buyback program was started in 1992. (at 24‐25 yen/kWh)–Only for excess electricity from renewable.
•National RPS was started in 2003.
•Subsidy for residential PV was re‐started in 2009. (70,000 yen/kW)(70,000 yen/kW)
•Buyback program was doubled in November 2009 (48 yen/kWh)yen/kWh).
•Extension of the buyback program to all renewable l t i it i d id ti t METI
10
electricity is under consideration at METI.
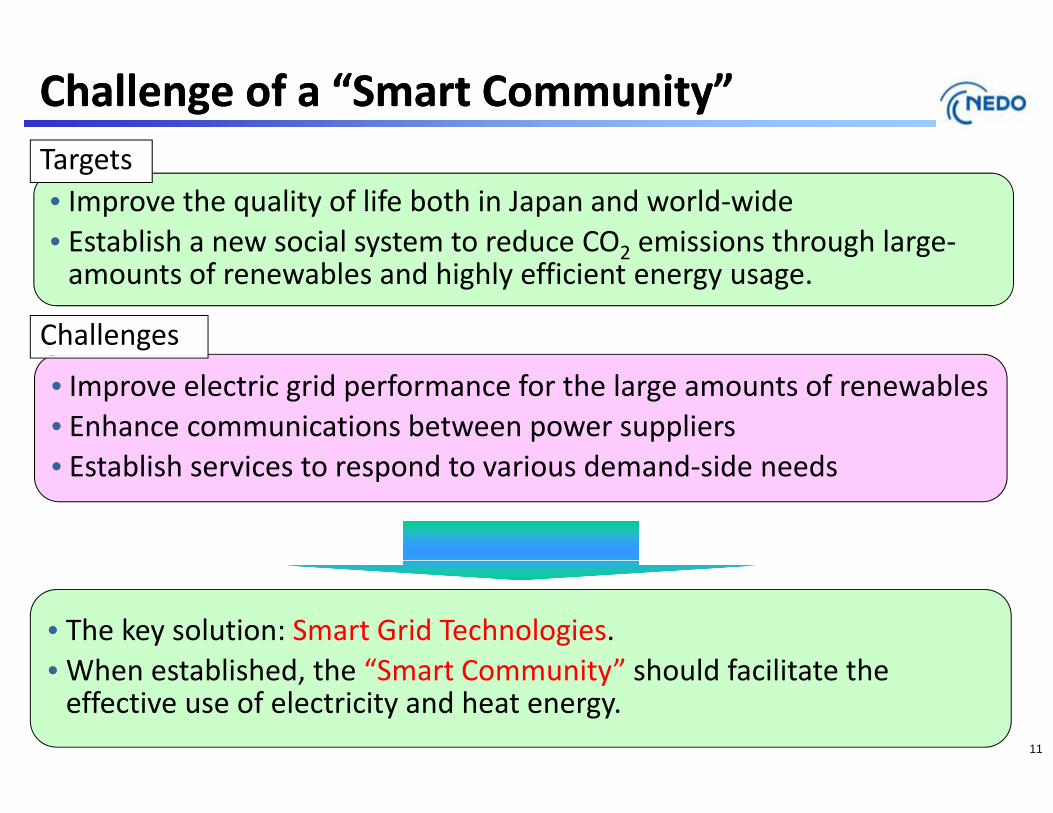
Challenge of a “Smart Community”Challenge of a “Smart Community”T• Improve the quality of life both in Japan and world‐wide• Establish a new social system to reduce CO2 emissions through large‐
Targets
y 2 g gamounts of renewables and highly efficient energy usage.
Challenges
• Improve electric grid performance for the large amounts of renewables• Enhance communications between power suppliersE t bli h i t d t i d d id d• Establish services to respond to various demand‐side needs
• The key solution: Smart Grid Technologies.Wh t bli h d th “S t C it ” h ld f ilit t th• When established, the “Smart Community” should facilitate the effective use of electricity and heat energy.
11
Smart Community of the Future Smart Community of the Future
• “Smart community” is a key to realizing a new social system world‐wide.
• It include not only electricity supply system, but also gas supply system, transportation system, water supply system, hot‐water supply system, etc.
• The benefits of the development of “Smart community” are: Introduce large‐amounts of renewable energy Introduce large‐amounts of renewable energy Facilitate greater energy conservation and improve life
conveniences E t bli h li bl i f ti t k Establish more reliable information networks Dissemination of EVs Creation of jobs and new servicesj
12
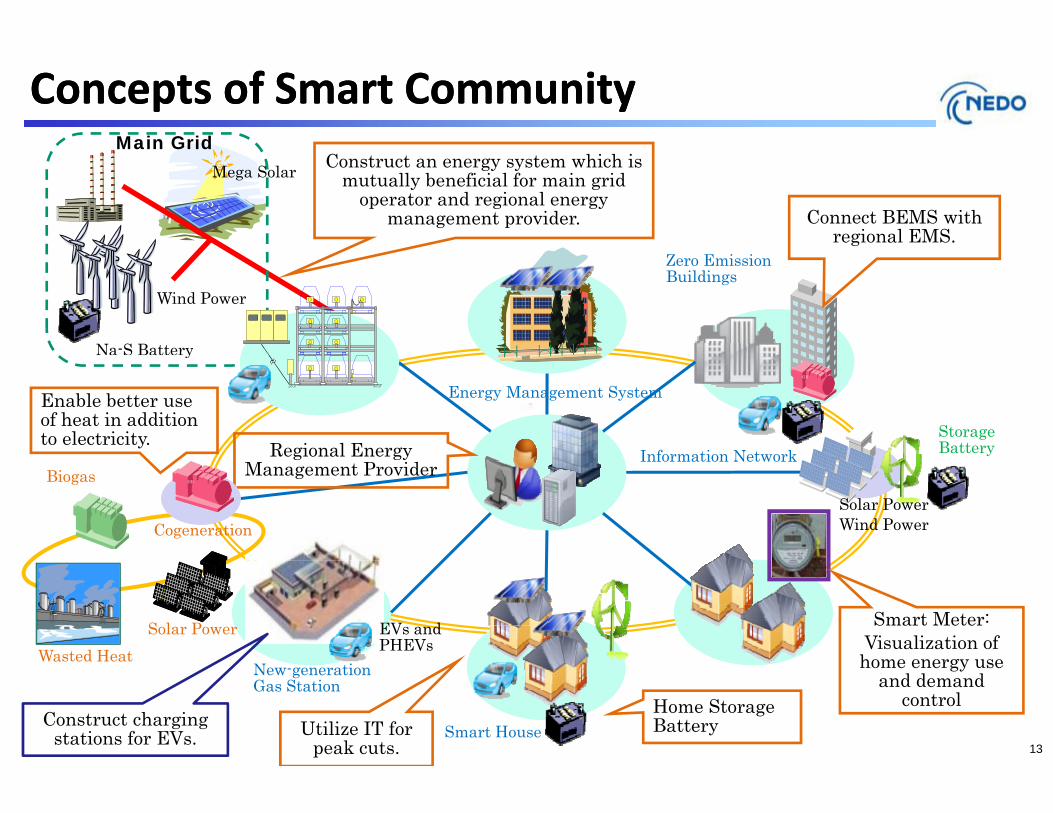
Concepts of Smart CommunityConcepts of Smart CommunityMain Grid
Mega Solar Construct an energy system which is mutually beneficial for main grid
operator and regional energy management provider. Connect BEMS with
regional EMS.Zero Emission Buildings
Wind Power
Na-S Battery
Energy Management SystemGEGE
Storage Battery
y
Enable better use of heat in addition to electricity. Regional Energy Information Network
Cogeneration
Biogasg gy
Management ProviderGEGE
Information Network
Solar PowerWind Power
Solar Power EVs and PHEVsWasted Heat
Smart Meter:Visualization of home energy useNew-generation
Gas Station
Smart HouseHome Storage BatteryUtilize IT for
peak cuts.Construct charging
stations for EVs.
home energy use and demand
control
13
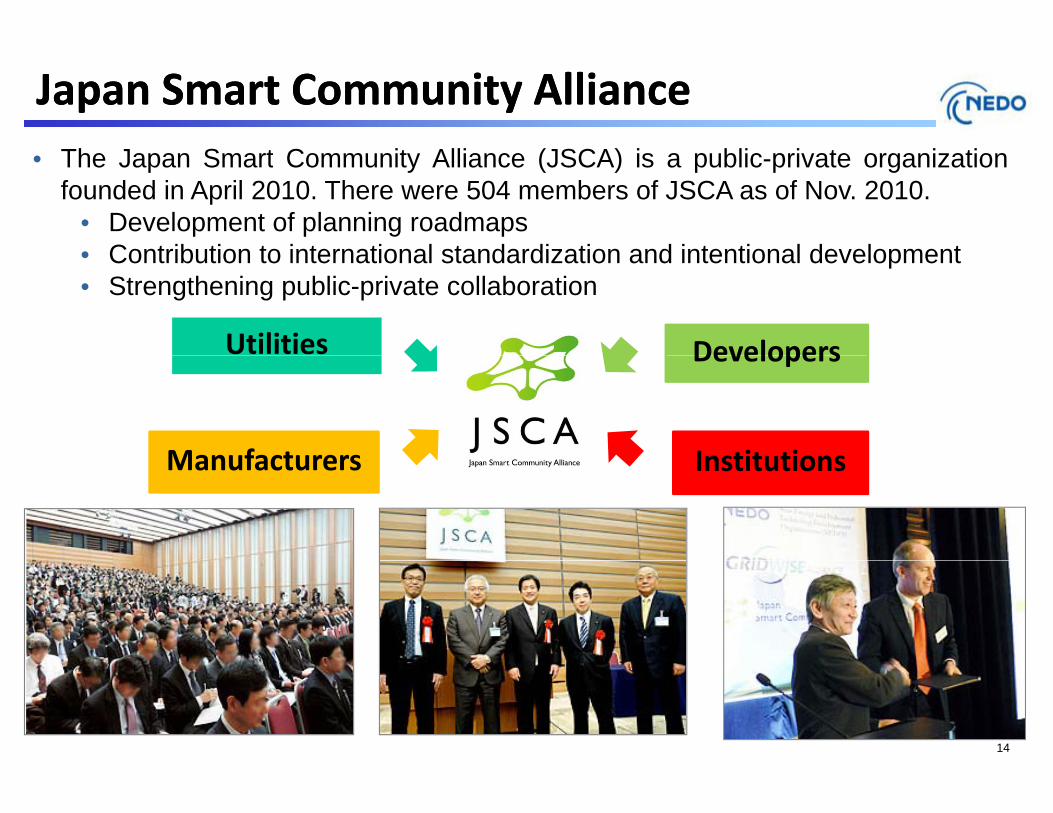
Japan Smart Community AllianceJapan Smart Community AllianceTh J S t C it Alli (JSCA) i bli i t i ti• The Japan Smart Community Alliance (JSCA) is a public-private organizationfounded in April 2010. There were 504 members of JSCA as of Nov. 2010.
• Development of planning roadmaps• Contribution to international standardization and intentional development• Contribution to international standardization and intentional development• Strengthening public-private collaboration
Utilities Developers
InstitutionsManufacturers
Developers
InstitutionsManufacturers
14
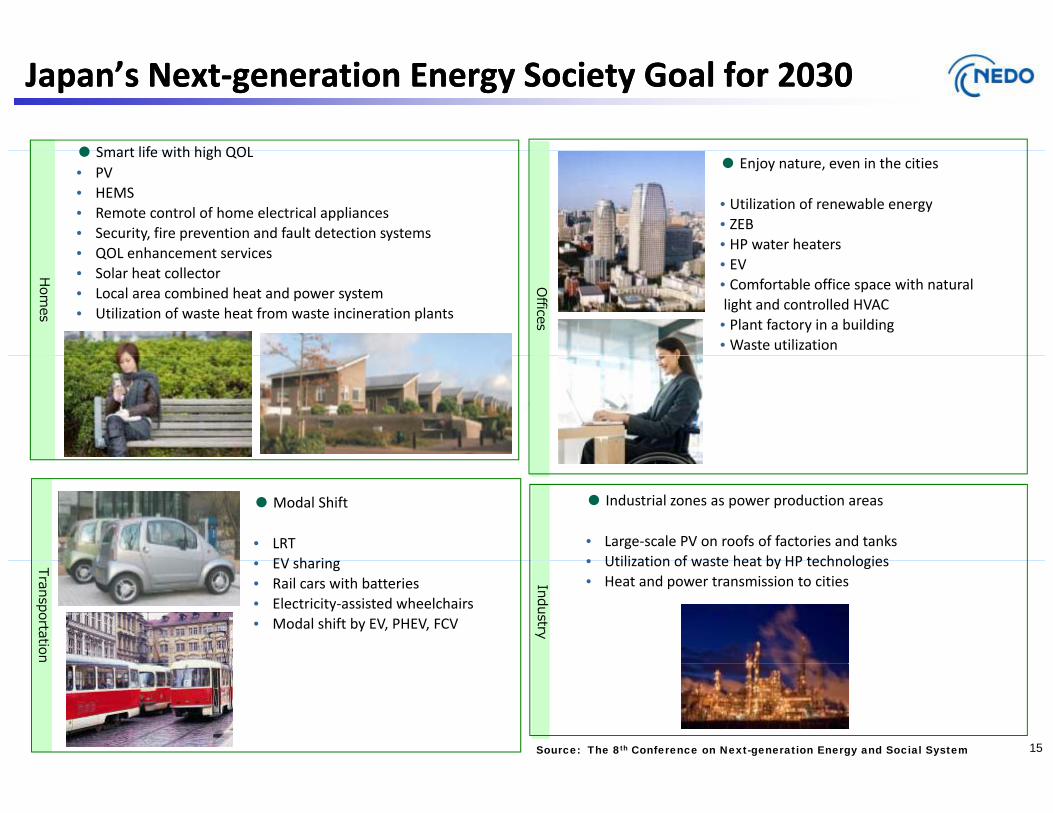
Japan’s NextJapan’s Next‐‐generation Energy Society Goal for 2030generation Energy Society Goal for 2030
● Smart life with high QOL● Smart life with high QOL• PV• HEMS• Remote control of home electrical appliances• Security, fire prevention and fault detection systems• QOL enhancement services
● Enjoy nature, even in the cities
• Utilization of renewable energy• ZEB• HP water heaters
Homes
Offices
• QOL enhancement services• Solar heat collector• Local area combined heat and power system• Utilization of waste heat from waste incineration plants
• EV• Comfortable office space with naturallight and controlled HVAC• Plant factory in a building• Waste utilization
● Modal Shift
• LRTEV h i
● Industrial zones as power production areas
• Large‐scale PV on roofs of factories and tanks• Utilization of waste heat by HP technologiesTransportation
Industry
• EV sharing• Rail cars with batteries• Electricity‐assisted wheelchairs• Modal shift by EV, PHEV, FCV
• Utilization of waste heat by HP technologies• Heat and power transmission to cities
15Source: The 8th Conference on Next-generation Energy and Social System
W kk i it
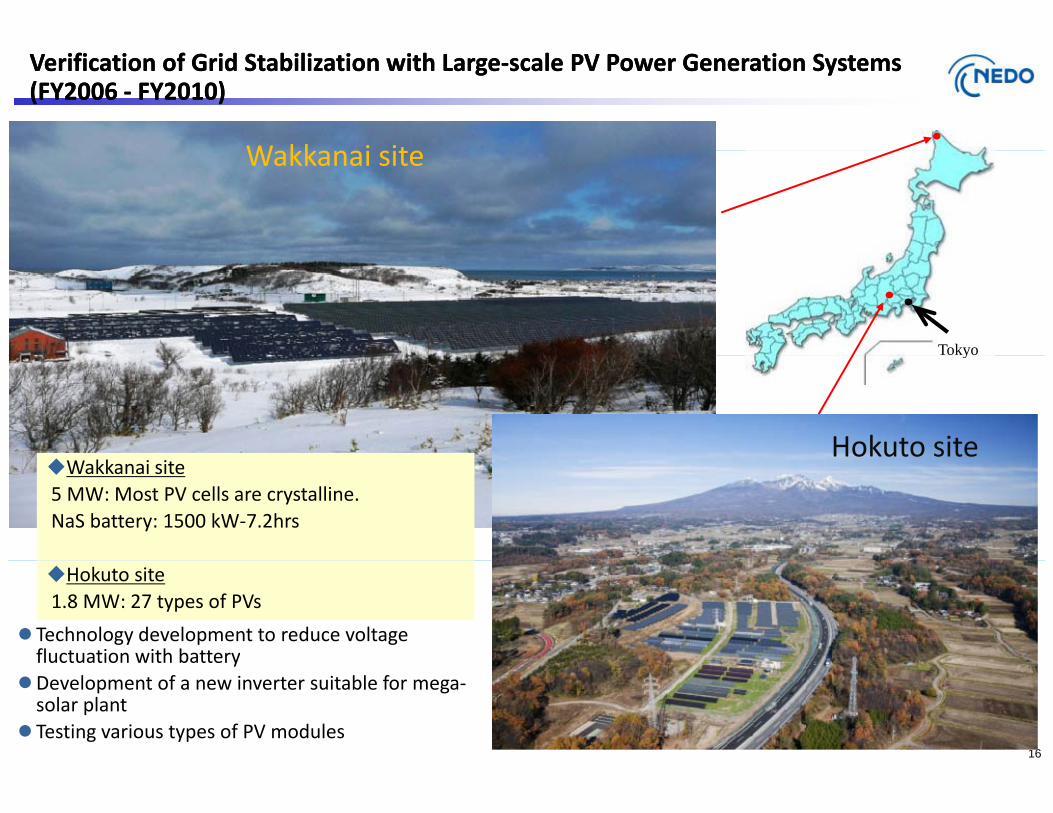
Verification of Grid Stabilization with LargeVerification of Grid Stabilization with Large‐‐scale PV Power Generation Systems scale PV Power Generation Systems ((FY2006 FY2006 ‐‐ FY2010FY2010) )
Wakkanai site
Tokyoy
Hokuto siteWakkanai site 5 MW: Most PV cells are crystalline.NaS battery: 1500 kW‐7.2hrs
Hokuto site 1.8 MW: 27 types of PVs
Technology development to reduce voltage fluctuation with battery
16
yDevelopment of a new inverter suitable for mega‐solar plant
Testing various types of PV modules
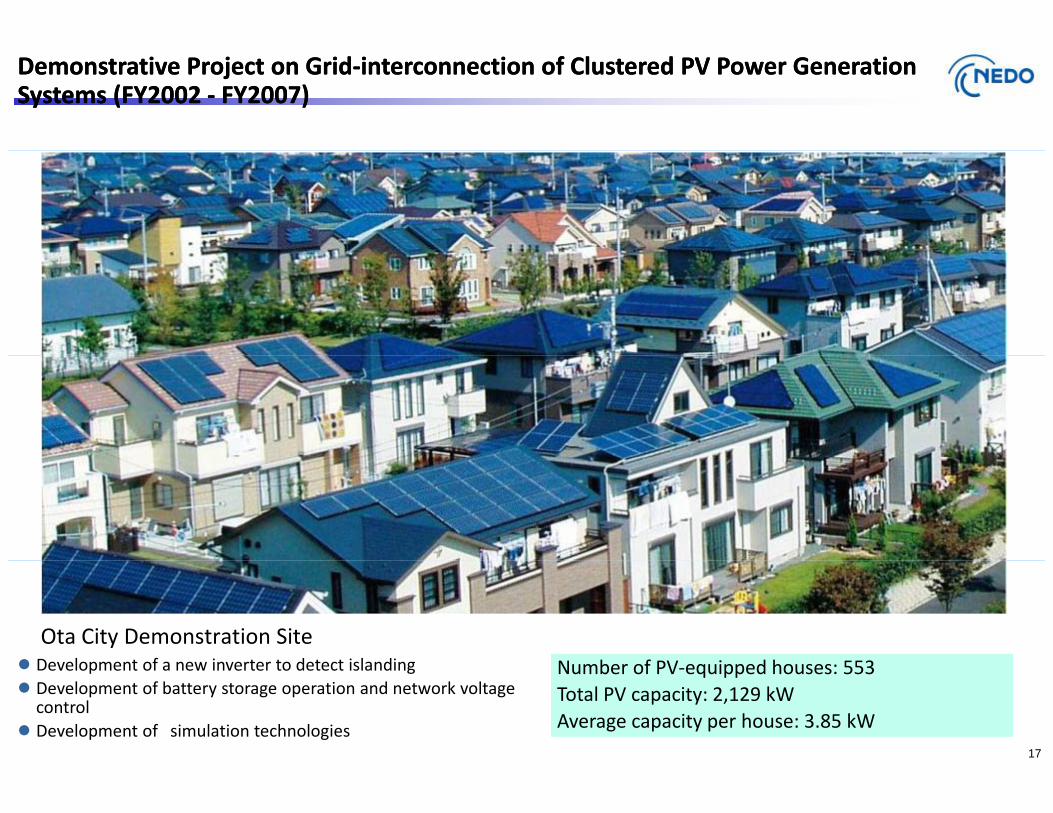
Demonstrative Project on GridDemonstrative Project on Grid‐‐interconnection of interconnection of Clustered Clustered PV Power Generation PV Power Generation Systems (Systems (FY2002 FY2002 ‐‐ FY2007FY2007) )
Ota City Demonstration SiteN b f PV i d h 553 Development of a new inverter to detect islanding Number of PV‐equipped houses: 553Total PV capacity: 2,129 kWAverage capacity per house: 3.85 kW
17
Development of a new inverter to detect islanding Development of battery storage operation and network voltage control
Development of simulation technologies
Yokohama City
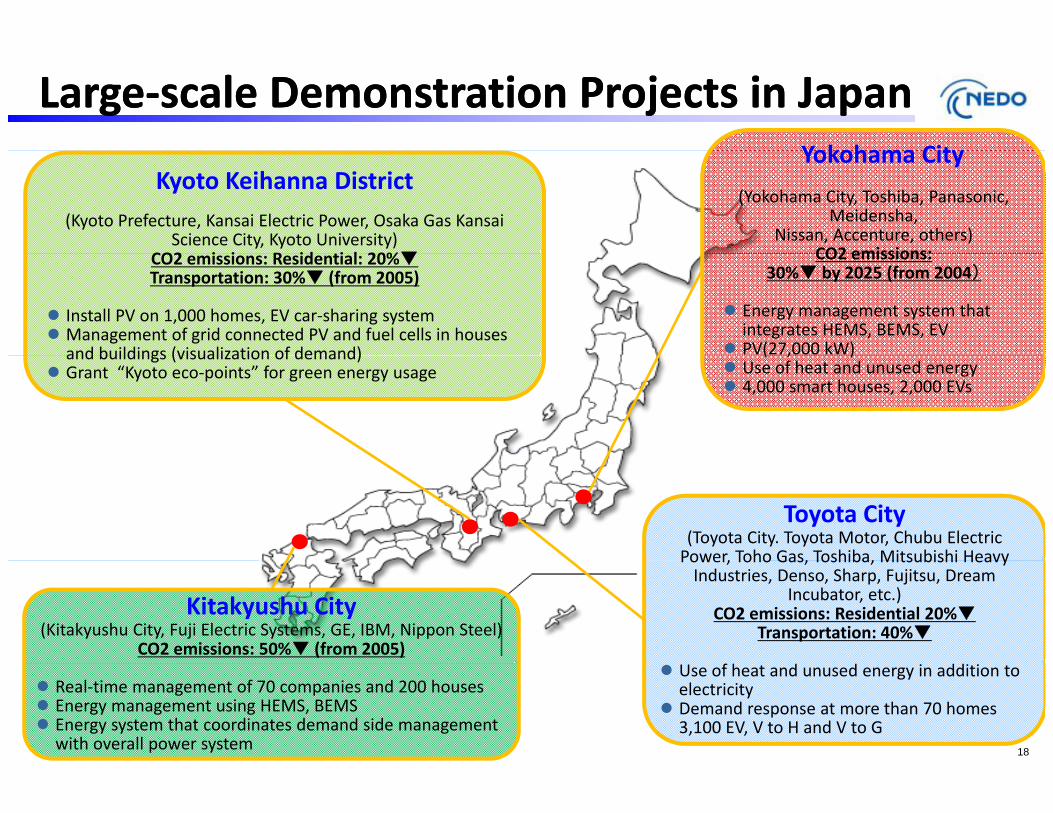
LargeLarge‐‐scale Demonstration Projects in Japanscale Demonstration Projects in JapanYokohama City
(Yokohama City, Toshiba, Panasonic, Meidensha,
Nissan, Accenture, others)CO2 emissions:
Kyoto Keihanna District(Kyoto Prefecture, Kansai Electric Power, Osaka Gas Kansai
Science City, Kyoto University)CO2 i i R id i l 20%▼ CO2 emissions:
30%▼ by 2025 (from 2004)
Energy management system that integrates HEMS, BEMS, EV
PV(27,000 kW)
CO2 emissions: Residential: 20%▼Transportation: 30%▼ (from 2005)
Install PV on 1,000 homes, EV car‐sharing system Management of grid connected PV and fuel cells in houses
and buildings (visualization of demand) ( , ) Use of heat and unused energy 4,000 smart houses, 2,000 EVs
and buildings (visualization of demand) Grant “Kyoto eco‐points” for green energy usage
Toyota City(Toyota City. Toyota Motor, Chubu Electric Power, Toho Gas, Toshiba, Mitsubishi HeavyPower, Toho Gas, Toshiba, Mitsubishi Heavy Industries, Denso, Sharp, Fujitsu, Dream
Incubator, etc.)CO2 emissions: Residential 20%▼
Transportation: 40%▼
Kitakyushu City(Kitakyushu City, Fuji Electric Systems, GE, IBM, Nippon Steel)
CO2 emissions: 50%▼ (from 2005)
18
Use of heat and unused energy in addition toelectricity
Demand response at more than 70 homes3,100 EV, V to H and V to G
Real‐time management of 70 companies and 200 houses Energy management using HEMS, BEMS Energy system that coordinates demand side management
with overall power system
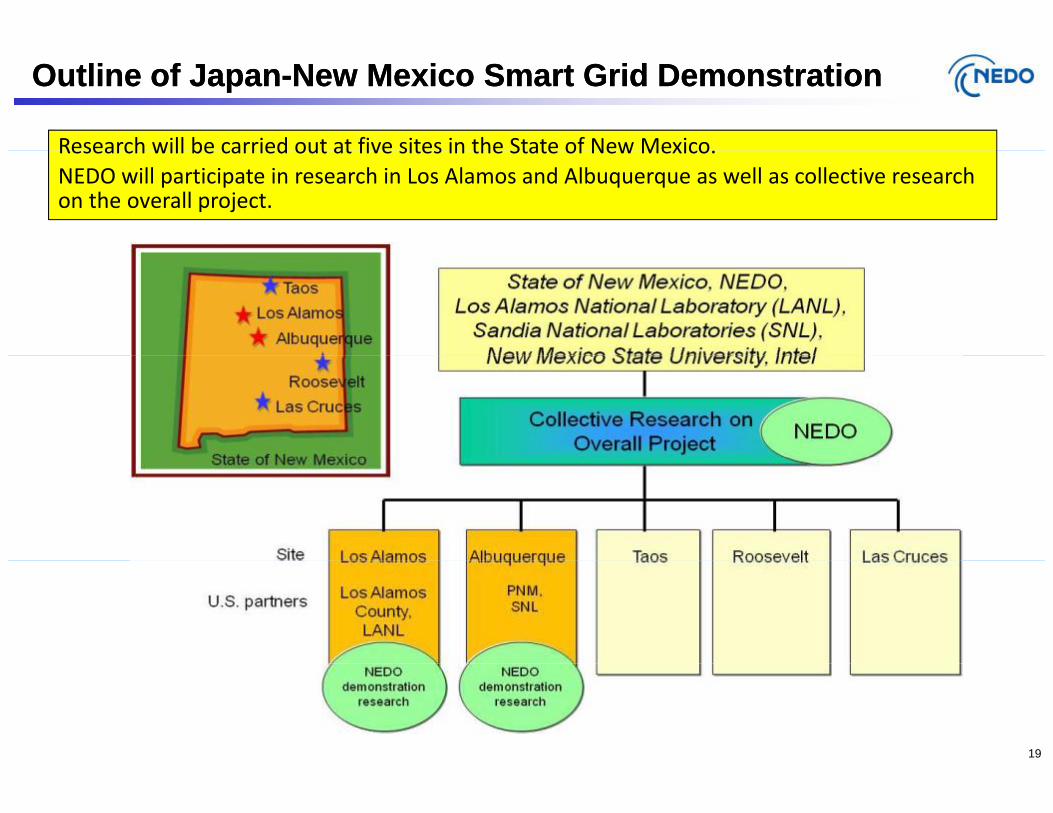
Research will be carried out at five sites in the State of New Mexico
Outline of JapanOutline of Japan--New Mexico Smart Grid DemonstrationNew Mexico Smart Grid Demonstration
Research will be carried out at five sites in the State of New Mexico. NEDO will participate in research in Los Alamos and Albuquerque as well as collective research on the overall project.
19
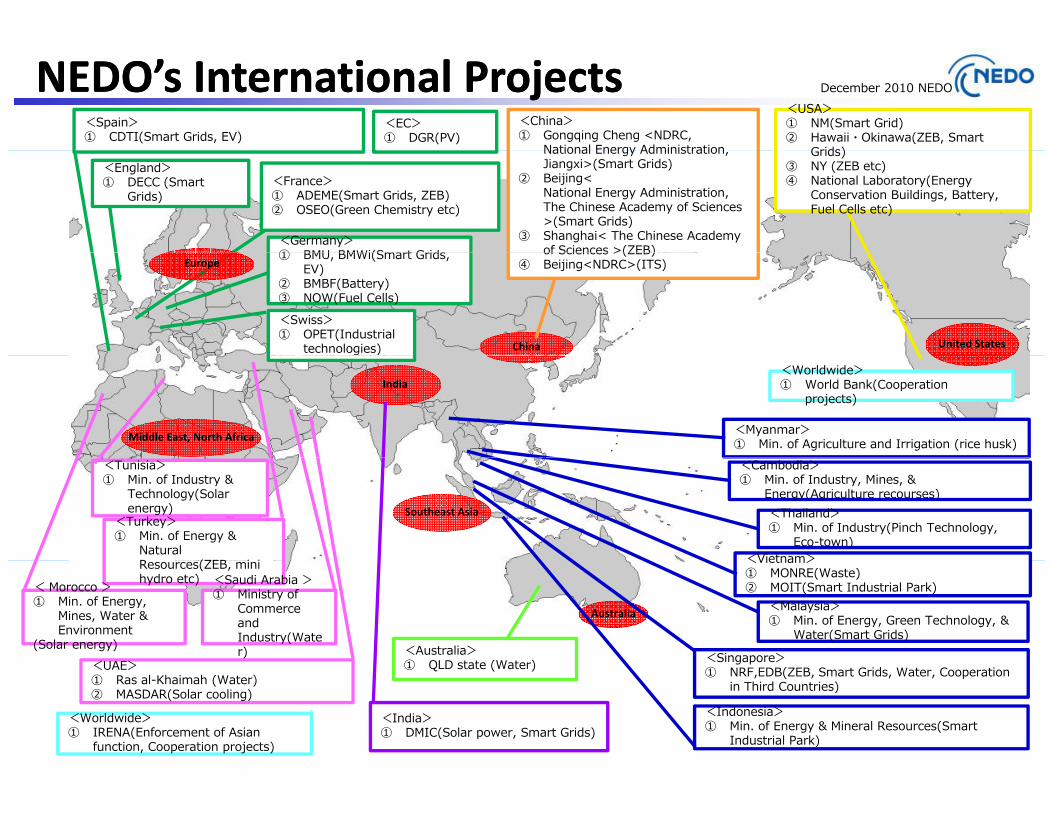
NEDO’s International NEDO’s International ProjectsProjects December 2010 NEDO
<Spain>① CDTI(Smart Grids, EV)
<China>① Gongqing Cheng <NDRC,
National Energy Administration
<USA>① NM(Smart Grid)② Hawaii・Okinawa(ZEB, Smart
Grids)
<EC>① DGR(PV)
<France>① ADEME(Smart Grids, ZEB)② OSEO(Green Chemistry etc)
<Germany>① BMU BMWi(Smart Grids
National Energy Administration, Jiangxi>(Smart Grids)
② Beijing< National Energy Administration, The Chinese Academy of Sciences >(Smart Grids)
③ Shanghai< The Chinese Academy of Sciences >(ZEB)
Grids)③ NY (ZEB etc)④ National Laboratory(Energy
Conservation Buildings, Battery, Fuel Cells etc)
<England>① DECC (Smart
Grids)
United StatesChina
① BMU, BMWi(Smart Grids, EV)
② BMBF(Battery)③ NOW(Fuel Cells)<Swiss>① OPET(Industrial
technologies)
Europeof Sciences >(ZEB)
④ Beijing<NDRC>(ITS)
India
Middle East, North Africa<Myanmar>① Min. of Agriculture and Irrigation (rice husk)
<Worldwide>① World Bank(Cooperation
projects)
<Tunisia>① Min. of Industry &
Technology(Solar energy) <Thailand>
① Min. of Industry(Pinch Technology, Eco-town)
Southeast Asia<Turkey>① Min. of Energy &
Natural R (ZEB i i <Vietnam>
<Cambodia>① Min. of Industry, Mines, &
Energy(Agriculture recourses)
Australia
<UAE> <Singapore><Australia>① QLD state (Water)
<Malaysia>① Min. of Energy, Green Technology, &
Water(Smart Grids)
Resources(ZEB, mini hydro etc)
<Vietnam>① MONRE(Waste)② MOIT(Smart Industrial Park)< Morocco >
① Min. of Energy, Mines, Water & Environment
(Solar energy)
<Saudi Arabia >① Ministry of
Commerce and Industry(Water)
<UAE>① Ras al-Khaimah (Water)② MASDAR(Solar cooling)
<India>① DMIC(Solar power, Smart Grids)
<Worldwide>① IRENA(Enforcement of Asian
function, Cooperation projects)
g p① NRF,EDB(ZEB, Smart Grids, Water, Cooperation
in Third Countries)<Indonesia>① Min. of Energy & Mineral Resources(Smart
Industrial Park)
① QLD state (Water)
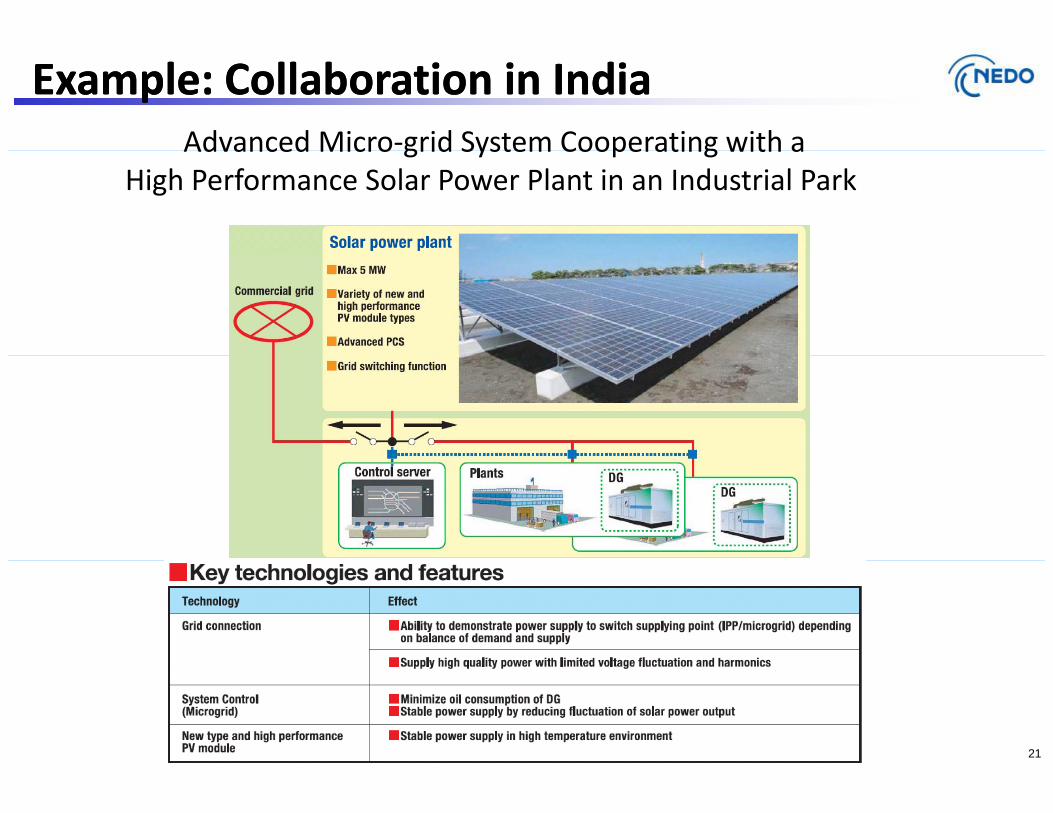
Example: Collaboration in IndiaExample: Collaboration in IndiaAdvanced Micro‐grid System Cooperating with aAdvanced Micro grid System Cooperating with a
High Performance Solar Power Plant in an Industrial Park
21
ConclusionConclusion
Japan had already achieved an advanced electricity gird Japan had already achieved an advanced electricity gird.
Based on this advanced electricity grid, Japan would like to introduce the large‐amounts of renewables and establish the “Smart Community”.
It is important to further develop and demonstrate smart community‐It is important to further develop and demonstrate smart communityrelated technologies in a real environment. Public‐private sector cooperation across various industries is necessary to establish smart communities.
Japan is pleased to share our experience. To realize smart communities around the world it is crucial to facilitate international deploymentaround the world, it is crucial to facilitate international deployment activities and strengthen collaboration with overseas organizations.
22
Thank you ! http://www.nedo.go.jp/