Embed Size (px)
Citation preview

Control Systems Example History Block Diagrams
Introduction to Feedback Control Systems
S. Hashtrudi ZadDept. of Electrical and Computer Engineering
Concordia University
January 2018
c© Copyright by Shahin Hashtrudi Zad 2015-2018
1 / 17

Control Systems Example History Block Diagrams
Control Systems I
Control systems are used to regulate variables such as
◮ position, velocity
◮ temperature, pressure and flow
to track a reference input which can either
◮ have a constant value (set point), or
◮ be a given function of time.
2 / 17

Control Systems Example History Block Diagrams
Control Systems II
Examples
◮ Automotive: Cruise control system◮ controlled variable: automobile speed◮ set point: chosen by driver
◮ Aerospace: Airplane autopilot system◮ controlled variable: altitude, heading◮ set point: chosen by pilot
3 / 17

Control Systems Example History Block Diagrams
Control Systems III
Examples
◮ Process Control: Flow control system◮ controlled variable: liquid flow◮ set point: chosen by operator
◮ Biology: Human thermoregulation◮ controlled variable: body temperature◮ set point: 37oC (set in hypothalamus)
4 / 17

Control Systems Example History Block Diagrams
Cruise Control System I
Let us consider the design and implementation of a cruise controlsystem.◮ process (system to-be-controlled): automobile◮ output (controlled variable): automobile speed (v)
First approach: Open-loop system design◮ Design:
◮ Choose control mechanism: adjust throttle position (x)◮ Drive the car at various speeds.◮ Find out the required throttle position.
◮ Implementation◮ For any cruise speed chosen by driver, use the table to set the
appropriate throttle position.
AutomobileThrottle Speed
v(t)x(t)
5 / 17

Control Systems Example History Block Diagrams
Cruise Control System II
Issues:
◮ Disturbance: inputs not manipulated by controller◮ Road grade (flat, uphill and downhill drive)◮ Wind
◮ Process changes or uncertainties◮ Number of passengers◮ Windows open or closed
Throttle
Wind
AuToMobIle
Road grade
Speed
v(t)x(t)
6 / 17

Control Systems Example History Block Diagrams
Cruise Control System III
Second approach: Closed-loop (feedback) system design
Throttle Speed
WindRoad grade
AutomobileActuatorControllerDesired Error
Controlsignal
Speed sensor
speedv(t)+
−
x(t)
◮ Controller receives speed measurements.
◮ Controller generates appropriate control signal based on theerror signal.(Error could be due to factors such as disturbance, noise andprocess changes.)
7 / 17

Control Systems Example History Block Diagrams
Feedback Control Systems
Block Diagram of a Feedback (Closed-loop) Control System
ControllersignalControl
Actuator
Sensor
ErrorProcess
Disturbance
OutputReference
input
(Command)
+
−
◮ Goals:
◮ Stability◮ Command following: Output ≈ Reference input;
both transient and steady-state behaviors are important(Recall: response (output) = transient resp. + steady-state resp.)
◮ Challenges:
◮ Disturbance◮ Process behavior may change◮ Process modeling uncertainties
8 / 17
Control Systems Example History Block Diagrams
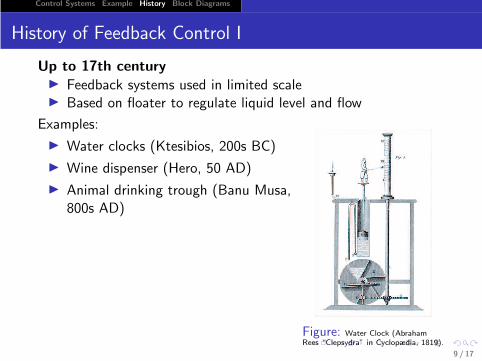
History of Feedback Control I
Up to 17th century◮ Feedback systems used in limited scale◮ Based on floater to regulate liquid level and flow
Examples:
◮ Water clocks (Ktesibios, 200s BC)
◮ Wine dispenser (Hero, 50 AD)
◮ Animal drinking trough (Banu Musa,800s AD)
Figure: Water Clock (AbrahamRees “Clepsydra” in Cyclopædia, 1819).
9 / 17

Control Systems Example History Block Diagrams
History of Feedback Control II
17th and 18th centuries
◮ Floaters are reinvented
◮ Wider use of feedback mechanisms
Examples:
◮ Thermostats fortemperature control(Drebbel, 17th century)
◮ Windmill speed control(Lee, 1745)
◮ Steam engine controlusing flyball governor(Watt, 1788)
Figure: R. Routledge, “Discoveries & Inventions of theNineteenth Century”, 13th edition, 1900.
10 / 17

Control Systems Example History Block Diagrams
History of Feedback Control III
19th up to mid 20th century
◮ Improved feedback mechanisms
◮ Analysis and design methods
Application domain Issue Solution (Method)Steam engines Error Integral controller Siemens (1846)
Stability Stability analysis using Maxwell (1868),(“hunting”) differential equation Routh (1877),
(time-domain method) Hurwitz (1895)Ship steering Slow response Powered steering Gray (1866)(servomechanism) with feedback
Disturbance PID controller Sperry (1911)Electronic amplifiers Component drift Negative feedback Black (1927)
High-order Frequency-domain Nyquist (1932),differential eq. design methods Bode (1940)
◮ Other notable application domains: Electric machinary,Process industries, Anti-aircraft guns
11 / 17

Control Systems Example History Block Diagrams
History of Feedback Control IV
Mid 20th century onwards
◮ More advanced methods◮ Digital computer control◮ Multi-input-multi-output methods◮ State-space methods (sets of first order diff. eq.)◮ Nonlinear methods◮ Optimal control◮ Stochastic methods
◮ New perspectives◮ Cybernetics (N. Wiener): Control and communication in the
animal and the machine
◮ New applications◮ Guided missiles, Spacecraft (e.g. Apollo program)◮ Automotive◮ Robotics◮ Unmanned Aerial Vehicles (UAV)
12 / 17

Control Systems Example History Block Diagrams
Building Block Diagrams for Feedback Control Systems I
ControllerErrorReference
input
(Command)
Actuator
Outputoutput
Actuator
Sensor
signal
Control
Disturbance
Process+
−
To build a block diagram for a feedback control system, identify
◮ Output (variable to-be-controlled)
◮ Sensor (measuring device)
◮ Controller
◮ Actuator
◮ Actuator output (input to the process to-be-controlled)
◮ Disturbance (inputs not manipulated by the controller)
13 / 17

Control Systems Example History Block Diagrams
Building Block Diagrams for Feedback Control Systems II
Example: Automatic Insulin Delivery SystemAfter food is eaten and digested, sugars (mainly glucose) are absorbed into thebloodstream. Normally, the pancreas secretes insulin into the bloodstream tometabolize the sugar. The pancreas of a diabetic person secretes insufficientinsulin to metabolize blood sugar and as a result, blood sugar levels couldbecome higher than normal. This could result in damage to body organs.
Automatic insulin delivery systems have been developed for diabetics. Thesystem which contains a tiny insulin reservoir and a pump is implanted in thebody. The system measures the blood sugar (glucose) level and compares itwith the level of a normal individual and sends appropriate commands to thepump to adjust insulin delivery from the reservoir to the body.
Draw a block diagram for the insulin delivery system. Identify the signals in theblock diagram and the function of each block.
14 / 17

Control Systems Example History Block Diagrams
Building Block Diagrams for Feedback Control Systems II
Example: Automatic Insulin Delivery SystemAfter food is eaten and digested, sugars (mainly glucose) are absorbed into thebloodstream. Normally, the pancreas secretes insulin into the bloodstream tometabolize the sugar. The pancreas of a diabetic person secretes insufficientinsulin to metabolize blood sugar and as a result, blood sugar levels couldbecome higher than normal. This could result in damage to body organs.
Automatic insulin delivery systems have been developed for diabetics. Thesystem which contains a tiny insulin reservoir and a pump is implanted in thebody. The system measures the blood sugar (glucose) level and compares itwith the level of a normal individual and sends appropriate commands to thepump to adjust insulin delivery from the reservoir to the body.
Draw a block diagram for the insulin delivery system. Identify the signals in theblock diagram and the function of each block.
◮ Output: sugar level
◮ Actuator: pump
◮ Actuator output: insulin from reservoir
◮ Disturbance (from control system’s perspective): insulin from pancreas
14 / 17

Control Systems Example History Block Diagrams
Building Block Diagrams for Feedback Control Systems III
Example: Automatic Insulin Delivery System
Sensor
Insulinfrom
reservoir
Insulin from pancreas
sugar level
Bodymetabolism
Sugar levelPumpControllerDesired +
−+
+
15 / 17

Control Systems Example History Block Diagrams
Summary
Benefits of feedback systems
16 / 17

Control Systems Example History Block Diagrams
Summary
Benefits of feedback systems
◮ Improve stability
16 / 17

Control Systems Example History Block Diagrams
Summary
Benefits of feedback systems
◮ Improve stability
◮ Improve response to input commands (both transient andsteady-state responses)
16 / 17

Control Systems Example History Block Diagrams
Summary
Benefits of feedback systems
◮ Improve stability
◮ Improve response to input commands (both transient andsteady-state responses)
◮ Reduce effects of disturbance
16 / 17

Control Systems Example History Block Diagrams
Summary
Benefits of feedback systems
◮ Improve stability
◮ Improve response to input commands (both transient andsteady-state responses)
◮ Reduce effects of disturbance
◮ Reduce sensitivity to process behavior and process model(Enhances robustness)
◮ Enhance functionalityExample: Warm-blooded animals (with thermoregulation)compared with cold-blooded animals (withoutthermoregulation)◮ can perform more vigorous activities◮ live and remain active in a wider range of temperatures.
(However the cost (energy) is higher:
◮ For a human at 20oC: metabolic rate = 1300 to 1800 kcal per day
◮ For an American alligator at 20oC: metabolic rate = 60 kcal per day)
16 / 17

Control Systems Example History Block Diagrams
To Probe Further
◮ Otto Mayr, “The origins of feedback control,” Scientific
American, vol. 223, no. 4, pp. 110-118, Oct. 1970.
◮ Stuart Bennett, “A brief history of automatic control,” IEEE
Control Systems, vol. 16, no. 3, pp. 17-25, June 1996.
17 / 17


![Solucionariolenguaespañola - Lengua y Literatura / IES ... · SOLUCIONARIO UNIDAD 7 1. *SHZPÄJH SVZ ZPN\PLU[LZ LU\UJPHKVZ ZLN U ZLHU ]LYIHSLZ V UV ]LYIHSLZ ... 4. *SHZPÄJH SHZ](https://img.dokumen.tips/doc/110x75/5bb4708e09d3f2317c8d73f6/solucionariolenguaespanola-lengua-y-literatura-ies-solucionario-unidad.jpg)