Embed Size (px)
Citation preview

Introduction to Esri Maps for Office
Welcome to the Essential ArcGIS Task Sheet Series. This series supplements the Iowa State University GIS Geospatial Technology Training Program short course series, “Essential ArcGIS Tutorial Series.” The task sheets are designed to provide quick, easy instructions for performing specific tasks in GIS.
Esri Maps for Office is a downloadable application available to all ArcGIS Online subscribers, paid or trial accounts. This application allows you to create dynamic maps of your Excel data without leaving the Excel environment. You can analyze your data in a location based context by creating clustered point maps or heat maps to understand the density of point features. You can also share the maps that you create in Excel to ArcGIS Online or copy and paste them into your PowerPoint presentations or Word documents. This task sheet will introduce you to the basics of using ESRI Maps for Office and demonstrate how to make a choropleth map within the Excel environment.
1. Download Esri Maps for Office
a. To use this application you must have an ArcGIS Online account. If you don’t have an account you can create a free 30-day trail account at www.arcgis.com or review publication PM2082-13h: Introduction to Creating and Using an ArcGIS Online Trial Subscription.
b. To download Esri Maps for Office, visit www.esri.com/software/arcgis/arcgisonline/apps/esri-maps-for-office and click on Get Esri Maps for Office. Select your language and download version that matches the bit version of Microsoft Office 2010 you have on your computer. Note: If you don’t know the bit version of Microsoft Office, open Excel, click the File tab, and select Help. In the About Microsoft Excel section on the right, the version information states whether it is 32-bit or 64-bit.
2. Opening Excel and Inserting a Map
a. Once the Esri Maps for Office download is complete, download the data used in this task sheet by navigating to www.extension.iastate.edu/communities/gis/quicktasksheets/data. Click on the publication number that matches this task sheet. In this case, the publication number is PM2082-14b.
b. Open the downloaded Excel table. You will now see a new tab at the top of the Excel menu called Esri Maps. Click on that tab.
c. Here you will need to sign in using your ArcGIS Online, paid or trial account. Click Sign In at the top of the Esri Maps menu and fill in your username and password.
d. Finally, to insert a map into your Excel spreadsheet, click Insert Map. Note: to see the full map click in the map header and drag the map below the chart headers.
Bailey Hanson [email protected], 515-520-1436 or for more information about the Geospatial Technology Program, contact: Professor Christopher J. Seeger, ASLA, GISP [email protected], 515-509-0651. This task sheet and more are available at www.extension.iastate.edu/gis ...and justice for allThe US Department of Agriculture (USDA) prohibits discrimination in all its programs and activities on the basis of race, color, national origin, age, disability, and where applicable, sex, marital status, familial status, parental status, religion, sexual orientation, ge-netic information, political beliefs, reprisal, or because all or part of an individual’s income is derived from any public assistance program. (Not all prohibited bases apply to all programs.) Persons with disabilities who require alternative means for communication of program information (Braille, large print, audiotape, etc.) should contact USDA’s TARGET Center at 202-720-2600 (voice and TDD). To file a complaint of discrimination, write to USDA, Director, Office of Civil Rights, 1400 Independence Avenue SW, Washington, DC 20250-9410, or call 800-795-3272 (voice) or 202-720-6382 (TDD).
Issued in furtherance of Cooperative Extension work, Acts of May 8 and June 30, 1914, in cooperation with the US Department of Agriculture. Cathann Kress, director, Cooperative Extension Service, Iowa State University of Science and Technology, Ames, Iowa.
Contact:
January 2014 PM2082-14b
3. Adding Data and Styling a Map
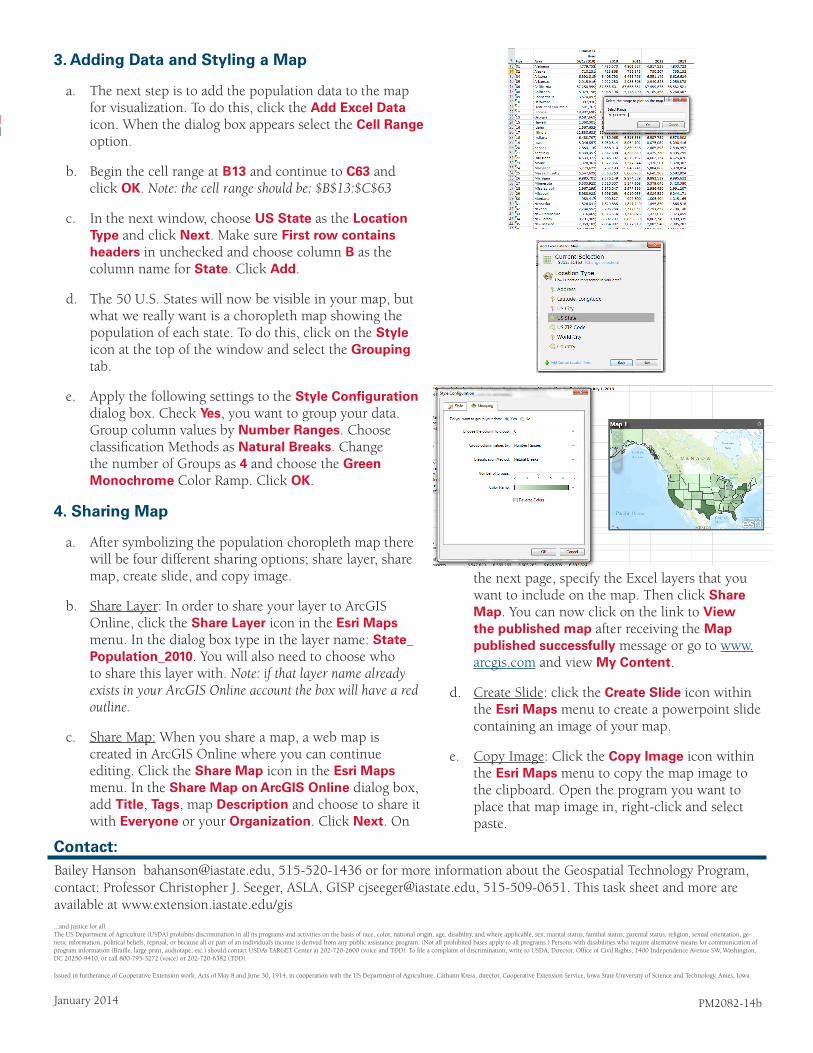
a. The next step is to add the population data to the map for visualization. To do this, click the Add Excel Data icon. When the dialog box appears select the Cell Range option.
b. Begin the cell range at B13 and continue to C63 and click OK. Note: the cell range should be: $B$13:$C$63
c. In the next window, choose US State as the Location Type and click Next. Make sure First row contains headers in unchecked and choose column B as the column name for State. Click Add.
d. The 50 U.S. States will now be visible in your map, but what we really want is a choropleth map showing the population of each state. To do this, click on the Style icon at the top of the window and select the Grouping tab.
e. Apply the following settings to the Style Configuration dialog box. Check Yes, you want to group your data. Group column values by Number Ranges. Choose classification Methods as Natural Breaks. Change the number of Groups as 4 and choose the Green Monochrome Color Ramp. Click OK.
4. Sharing Map
a. After symbolizing the population choropleth map there will be four different sharing options; share layer, share map, create slide, and copy image.
b. Share Layer: In order to share your layer to ArcGIS Online, click the Share Layer icon in the Esri Maps menu. In the dialog box type in the layer name: State_Population_2010. You will also need to choose who to share this layer with. Note: if that layer name already exists in your ArcGIS Online account the box will have a red outline.
c. Share Map: When you share a map, a web map is created in ArcGIS Online where you can continue editing. Click the Share Map icon in the Esri Maps menu. In the Share Map on ArcGIS Online dialog box, add Title, Tags, map Description and choose to share it with Everyone or your Organization. Click Next. On
the next page, specify the Excel layers that you want to include on the map. Then click Share Map. You can now click on the link to View the published map after receiving the Map published successfully message or go to www.arcgis.com and view My Content.
d. Create Slide: click the Create Slide icon within the Esri Maps menu to create a powerpoint slide containing an image of your map.
e. Copy Image: Click the Copy Image icon within the Esri Maps menu to copy the map image to the clipboard. Open the program you want to place that map image in, right-click and select paste.


![[English] Create Mobile LBS Application Using Maps API](https://img.dokumen.tips/doc/110x75/55a674ad1a28ab3c3c8b4744/english-create-mobile-lbs-application-using-maps-api.jpg)


