Embed Size (px)
Citation preview
Introduction to electron paramagnetic resonance spectroscopy
Gunnar Jeschke, HCI F227, [email protected]
epr@eth
Lecture : most important concepts treated by example
Script : in-depth discussion, including complications ( )www.ssnmr.ethz.ch/education/PCIV.html
Exercises : hands-on experience, deeper understanding, will be part of examination material
Examination : pass by knowing concepts and having "exercise level"
get good grade by in-depth understanding
Examination content: st will be specified in the last lecture (December 21 )
EPR lectures , 23.11., 30.11., 7.12., , , 21.12. 20.11. 18.12.14.12.
1
EPR:Introduction
PCIV-Part2-EPRSpectroscopy
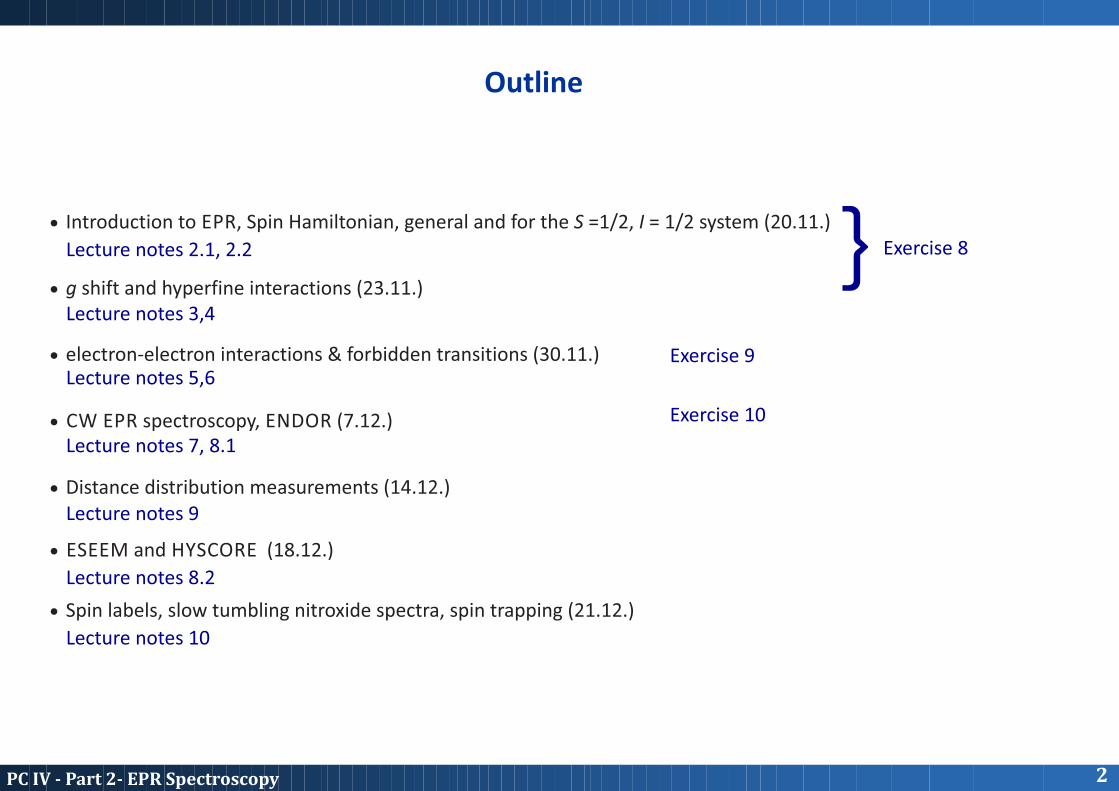
Outline
· Introduction to EPR, Spin Hamiltonian, general and for the S =1/2, I = 1/2 system (20.11.)
· g shift and hyperfine interactions (23.11.)
· electron-electron interactions & forbidden transitions (30.11.)
· CW EPR spectroscopy, ENDOR (7.12.)
· Distance distribution measurements ( )14.12.
· ESEEM and HYSCORE (18.12.)
· Spin labels, slow tumbling nitroxide spectra, spin trapping (21.12.)
2PCIV-Part2-EPRSpectroscopy
} Exercise 8
Exercise 9
Exercise 10
Lecture notes 2.1, 2.2
Lecture notes 3,4
Lecture notes 5,6
Lecture notes 7, 8.1
Lecture notes 9
Lecture notes 8.2
Lecture notes 10
EPR- the little big sister of NMR
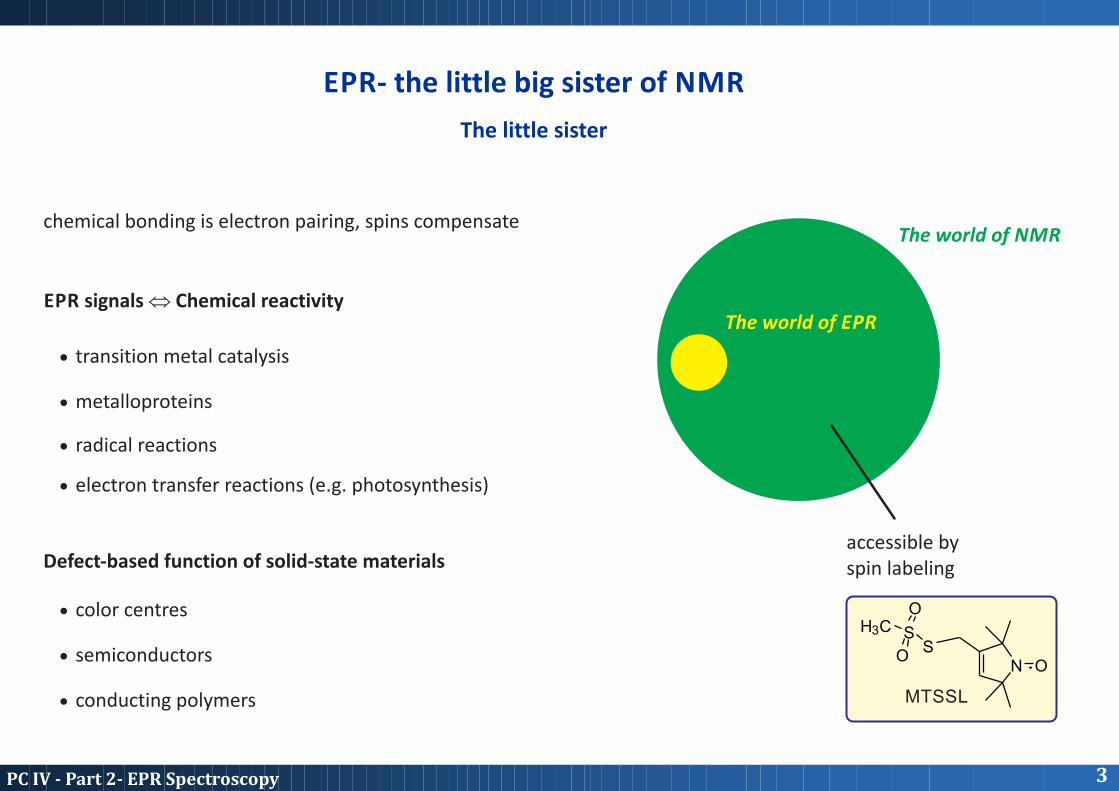
The little sister
chemical bonding is electron pairing, spins compensate
EPR signals Û Chemical reactivity
Defect-based function of solid-state materials
The world of NMR
The world of EPR
· radical reactions
· color centres
· transition metal catalysis
· semiconductors
· metalloproteins
· electron transfer reactions (e.g. photosynthesis)
· conducting polymers
accessible byspin labeling
N OS
S
O
O
H3C
MTSSL
3PCIV-Part2-EPRSpectroscopy
EPR- the little big sister of NMR
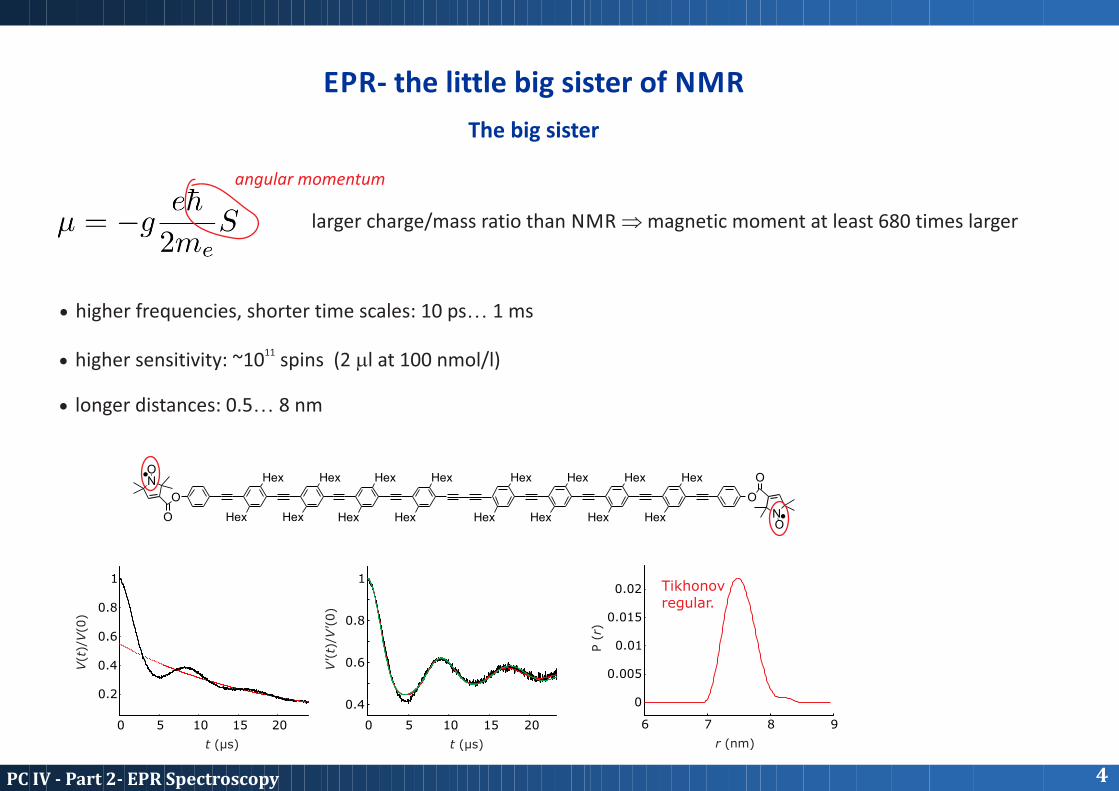
The big sister
larger charge/mass ratio than NMR Þ magnetic moment at least 680 times larger
· higher frequencies, shorter time scales: 10 ps¼ 1 ms
11· higher sensitivity: ~10 spins (2 ml at 100 nmol/l)
· longer distances: 0.5¼ 8 nm
Hex
Hex
O
O
NO
O
O
NO
Hex
Hex
Hex
Hex
Hex
Hex Hex
HexHex
Hex
Hex
Hex
Hex
Hex
0 5 10 15 20
0.2
0.4
0.6
0.8
1
t (µs)
V(t
)/V(0
)
6 7 8 9
0
0.005
0.01
0.015
0.02 Tikhonovregular.
r (nm)
P (
r)
0 5 10 15 20
0.4
0.6
0.8
1
t (µs)
V'(
t)/V
'(0)
angular momentum
4PCIV-Part2-EPRSpectroscopy

5PCIV-Part2-EPRSpectroscopy
Quantum electrodynamics (Schwinger):
quantitative prediction of g for an unbound electrone
g = 2.002319304e
A rotating homogeneous sphere with charge q
has a magnetic dipole moment m
The electron has intrinsic angular momentum - Spin
m = J
m = -g hS
q
e
2m
2m
® ® ®J : angular momentum
S = ½ : spin quantum number
g : quantum-mechanical correction
Stern-Gerlach experiment 1922
Uhlenbeck Goudsmit1925
The unpaired electron is a magnetic point dipole
mB
g = -g m /he B

Electron spin in a magnetic field
· by convention: magnetic field B along z0
· energy difference often smaller than thermal energy Þ small population difference 2e
Two states with different energy, corresponding to different magnetic quantum numbers mS
hn = hw = g m Be B 0
Ener
gy
magnetic field B0
m = -1/2, |bñ, ¯S
m = +1/2, |añ, S
· typical fields: 0.1¼1.5 T (high-field EPR 3.5¼12 T)
· typical frequencies: 1¼35 GHz (high-frequency 94¼300 GHz)
this high-temperature approximation can be violated in EPR (unlike NMR), e.g. n = 94 GHz, T = 4.2 K
6PCIV-Part2-EPRSpectroscopy

Relevant interactions in EPR spectroscopy
electron spin/static magnetic field
nuclear spin/static magnetic field
nuclear spin/electric field gradient
electron spin/nuclear spin
electron spin/electron spin (strong)
electron spin/electron spin (weak)
electron Zeeman
nuclear Zeeman
nuclear quadrupole
hyperfine
zero-field
exchange
dipole-dipole
Type Name Hamiltonian
(I > 1/2)
(S > 1/2)e
e
n
n
n
n
n
n
B0
7PCIV-Part2-EPRSpectroscopy

Typical magnitude of interactions
m.w. bands S X Q W
1mK 4.2 K 48 KThermal energy
Electron Zeeman interaction
Zero field splitting
Hyperfine interaction
Excitation bandwidth of pulse EPR
10 10 10 10 10 10 100 2 4 6 8 10 12
Dipole-dipole interactionbetween weakly coupled electron spins
distance 10 5 3 1 nm
Homogeneous EPR linewidths
Homogeneous ENDOR andESEEM linewidths
Nuclear dipole-dipole interaction
Nuclear J couplings
Chemical shifts
Nuclear Zeeman interaction
Nuclear quadrupole interaction
kHz MHz GHz THz
10 10 10 10 10 10 10 Hz0 2 4 6 8 10 12
kHz MHz GHz THz
resolutionlimit
8PCIV-Part2-EPRSpectroscopy
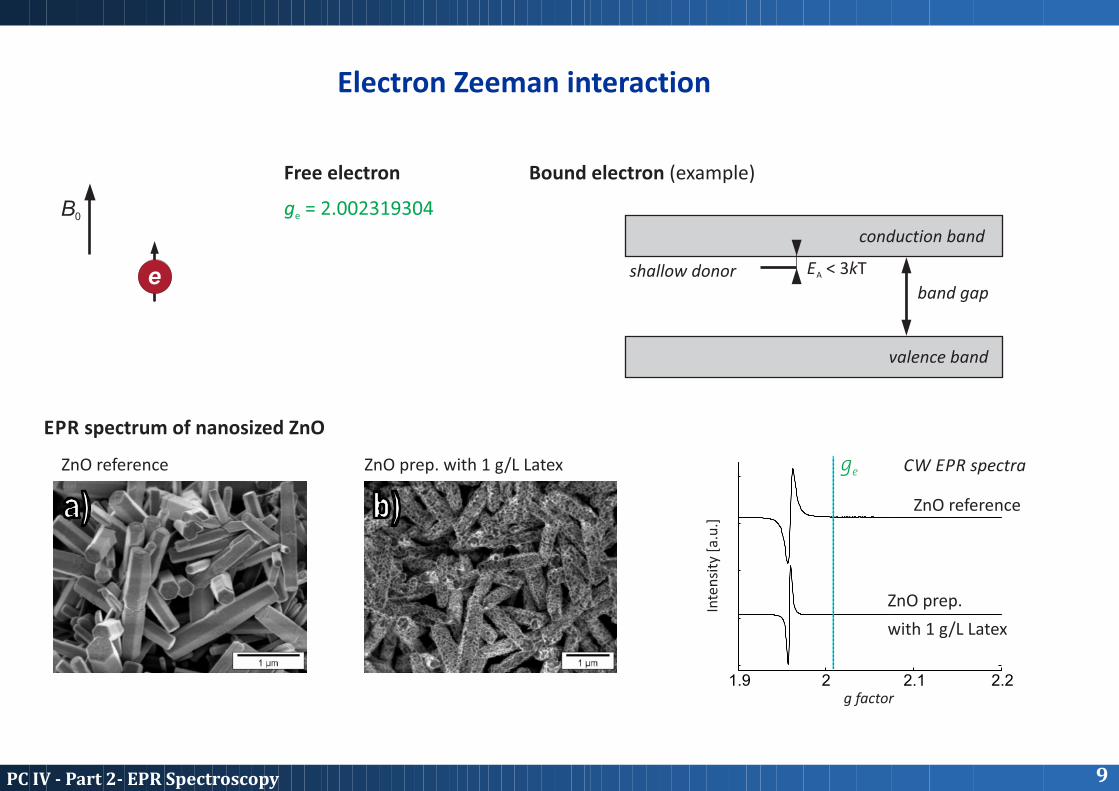
g = 2.002319304e
Electron Zeeman interaction
e
B0
EPR spectrum of nanosized ZnO
Free electron Bound electron (example)
1.9 2 2.1 2.2
ZnO reference
ZnO prep.
with 1 g/L Latex
g factorIn
ten
sity
[a.
u.]
ZnO reference ZnO prep. with 1 g/L Latex CW EPR spectra
valence band
band gap
conduction band
shallow donor E < 3kTA
ge
9PCIV-Part2-EPRSpectroscopy
9aPCIV-Part2-EPRSpectroscopy
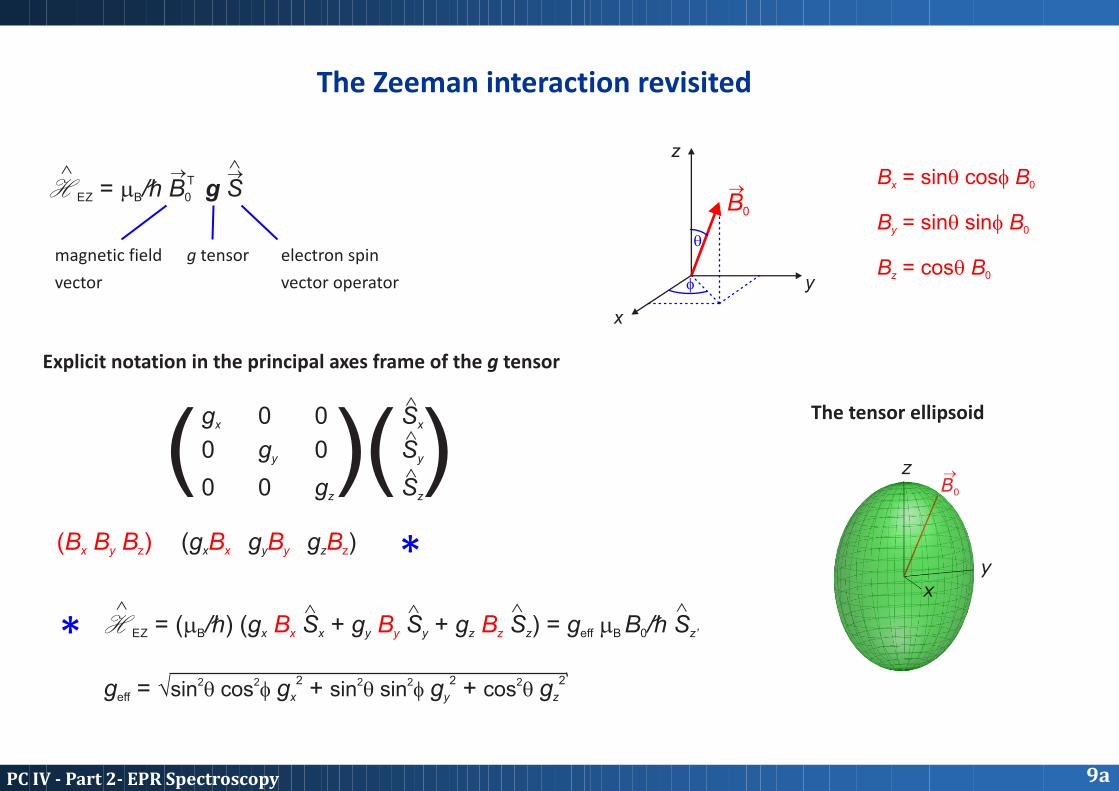
The Zeeman interaction revisited
TH = m /h B g SEZ B 0
H = (m /h) (g S + g S + g S ) = g m B /h S EZ B x x y y z z eff B 0 z’B B Bx y z
®®®
^
^
^
^
^ ^ ^ ^
^
^
magnetic field
vector
g tensor electron spin
vector operator
(B B B )x y z (g g g )x y zB B Bx y z
( () )gx
0
0
0
gy
0
0 Sx
Sy
Sz
0
gz
Explicit notation in the principal axes frame of the g tensor
The tensor ellipsoid
*
*
x
y
z
f
q
B = sinq cosf Bx 0
B = sinq sinf By 0
B = cosq Bz 0
B0
2 2 2g = Ö g + g + g eff x y z
2 2 2 2 2sin q cos f sin q sin f cos q
x
z
y
B0
®
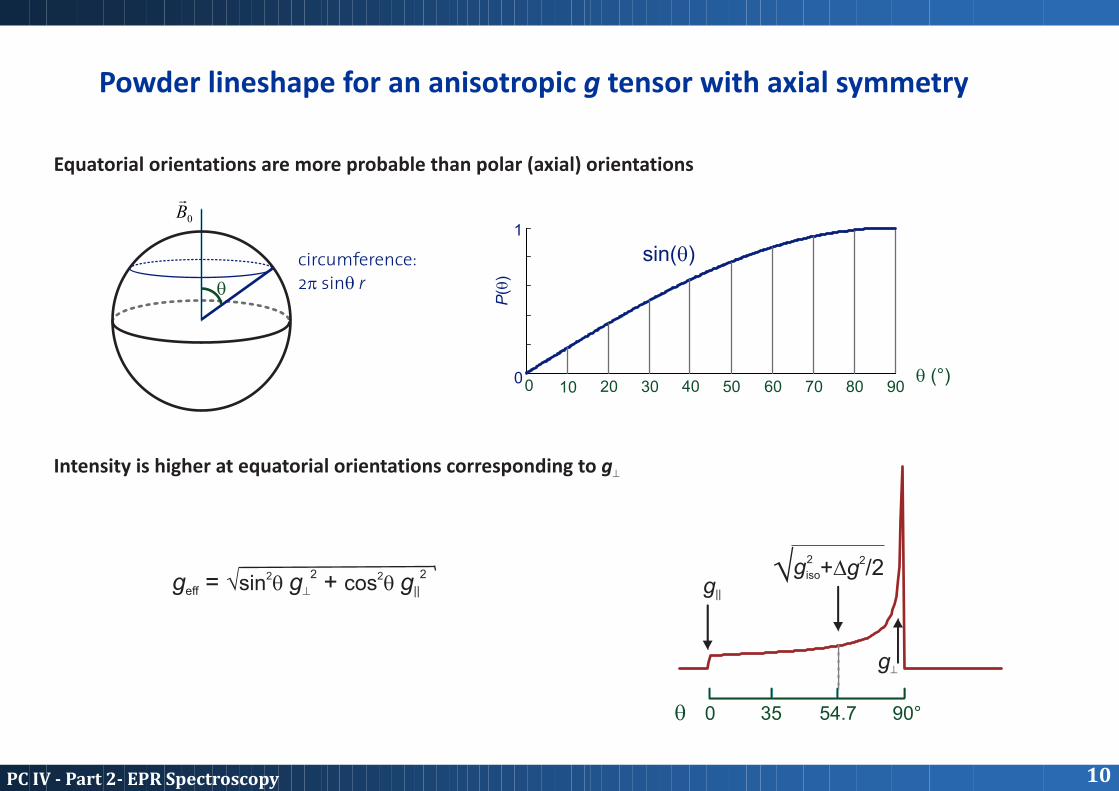
Powder lineshape for an anisotropic g tensor with axial symmetry
10PCIV-Part2-EPRSpectroscopy
0B
q
circumference:
2p sinq r
0 10 20 30 40 50 60 70 80 900
1
q (°)
P(q
)
q 0 35 54.7 90°
2gisoÖ 2+Dg /2
g^
g||
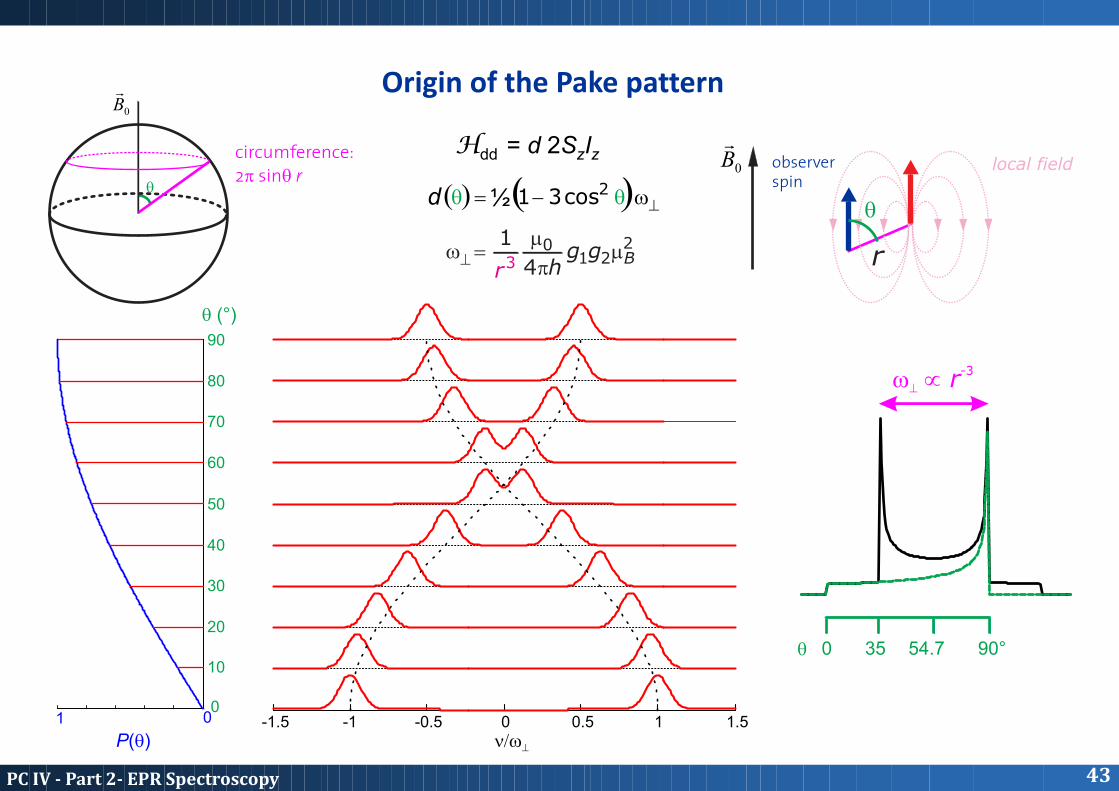
Equatorial orientations are more probable than polar (axial) orientations
Intensity is higher at equatorial orientations corresponding to g^
sin(q)
2 2g = Ö g + g eff ^ ||
2 2sin q cos q
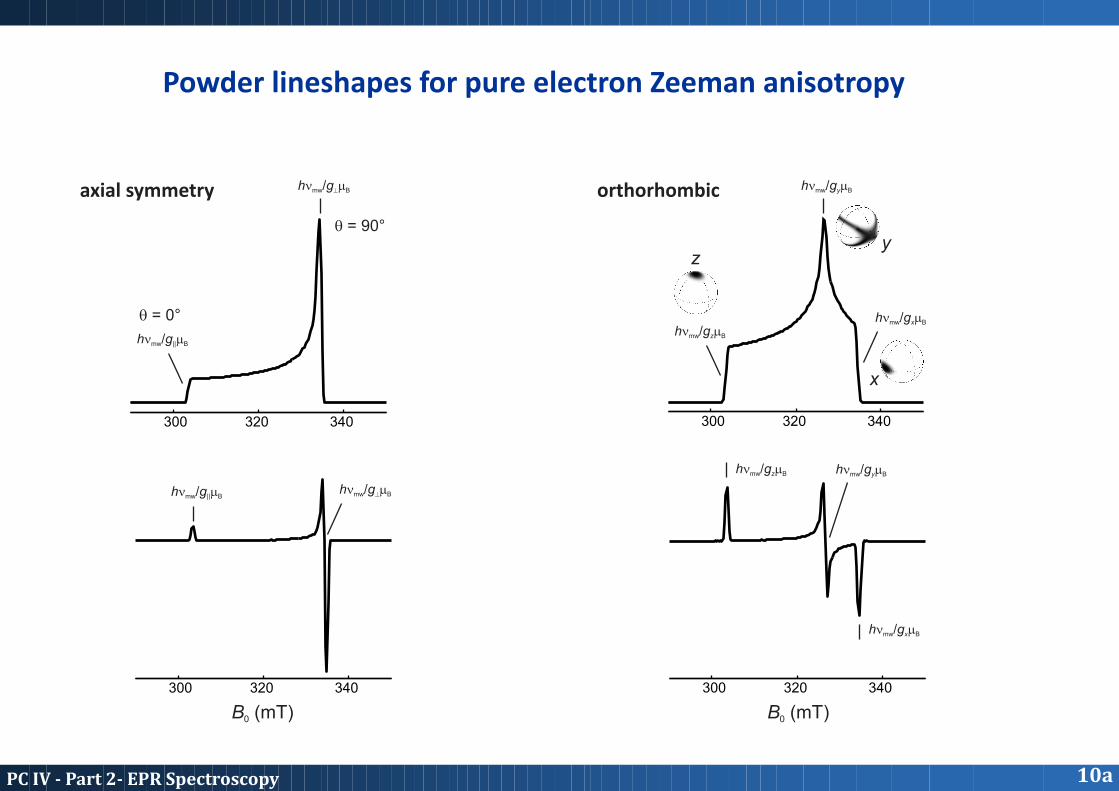
Powder lineshapes for pure electron Zeeman anisotropy
10aPCIV-Part2-EPRSpectroscopy
300 320 340
hn /g mmw || B
hn /g mmw z B
hn /g mmw || B
hn /g mmw z B
hn /g mmw x B
hn /g mmw ^ B hn /g mmw y B
hn /g mmw ^ B
hn /g mmw x B
hn /g mmw y B
300 320 340
B (mT)0 B (mT)0
q = 0°
q = 90°
300 320 340
300 320 340
axial symmetry orthorhombic
zy
x
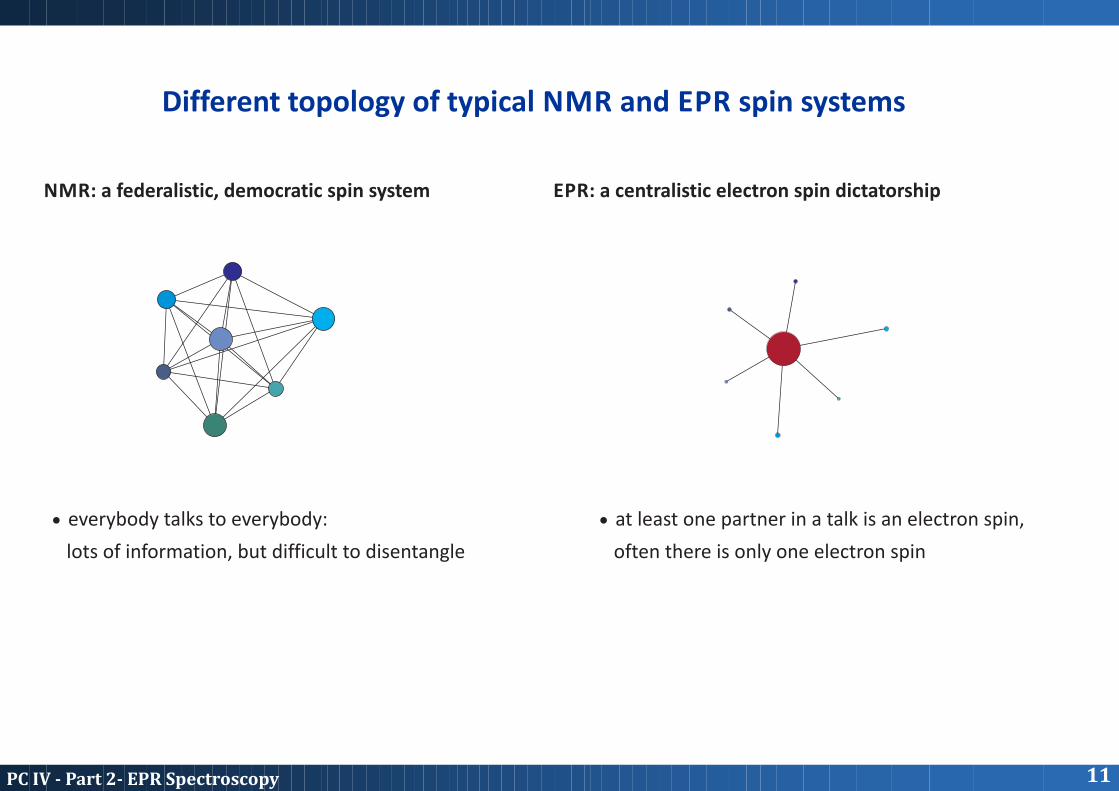
Different topology of typical NMR and EPR spin systems
NMR: a federalistic, democratic spin system EPR: a centralistic electron spin dictatorship
· everybody talks to everybody:
lots of information, but difficult to disentangle
· at least one partner in a talk is an electron spin,
often there is only one electron spin
11PCIV-Part2-EPRSpectroscopy
local field invertedlocal field
r r N
S
Exte
rnal
mag
net
ic f
ield
12PCIV-Part2-EPRSpectroscopy
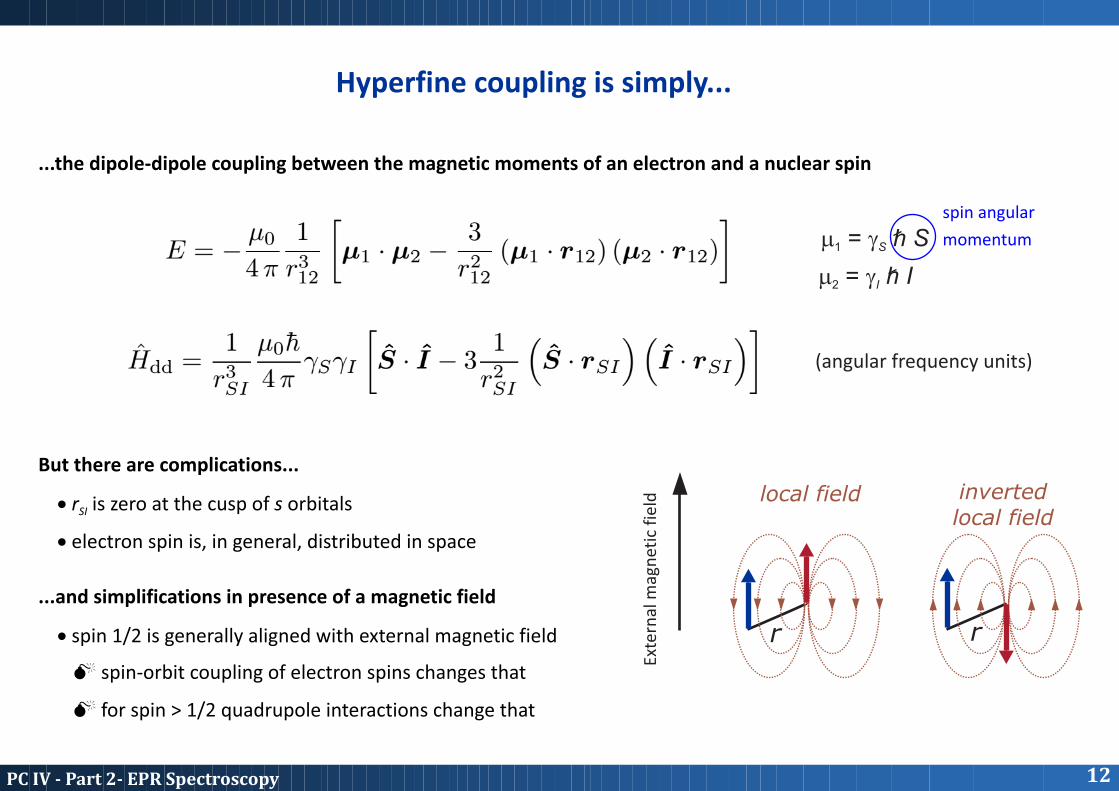
Hyperfine coupling is simply...
...the dipole-dipole coupling between the magnetic moments of an electron and a nuclear spin
But there are complications...
...and simplifications in presence of a magnetic field
· r is zero at the cusp of s orbitalsSI
· spin 1/2 is generally aligned with external magnetic field
· electron spin is, in general, distributed in space
M spin-orbit coupling of electron spins changes that
M for spin > 1/2 quadrupole interactions change that
m = g h S1 S
m = g h I2 I
(angular frequency units)
spin angular
momentum
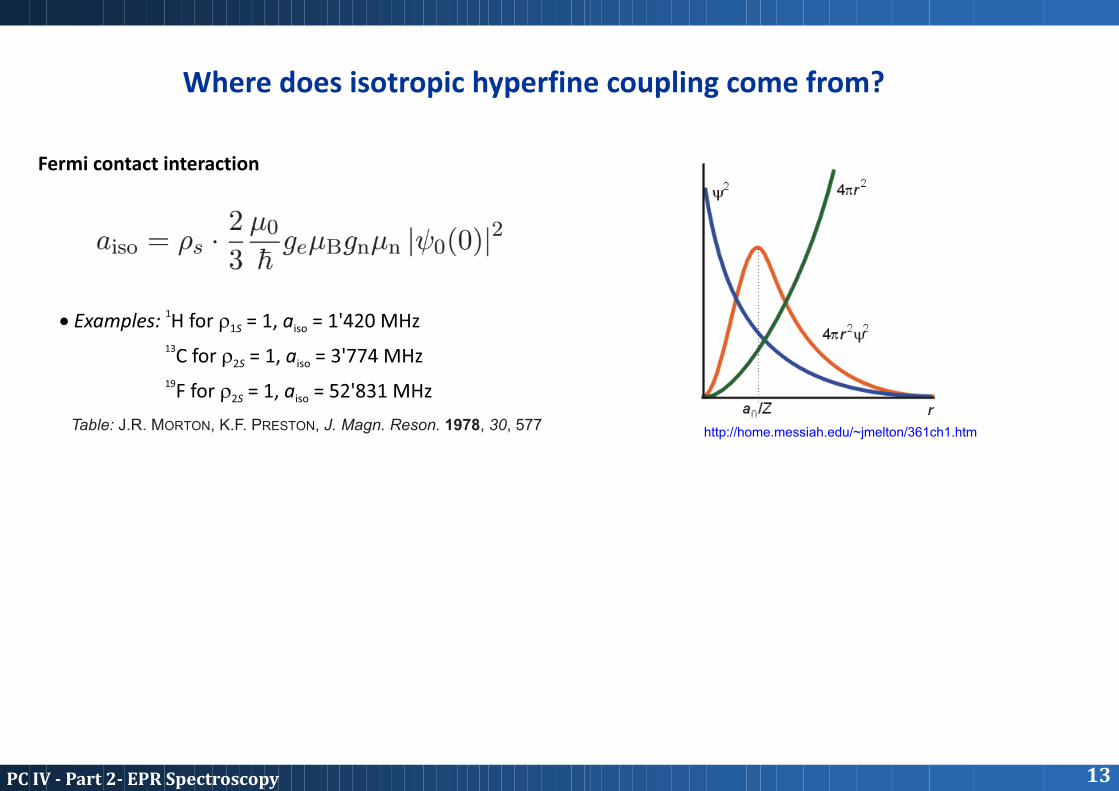
Where does isotropic hyperfine coupling come from?
Fermi contact interaction
1· Examples: H for r = 1, a = 1'420 MHz1S iso
13 C for r = 1, a = 3'774 MHz2S iso
19 F for r = 1, a = 52'831 MHz2S iso
http://home.messiah.edu/~jmelton/361ch1.htmTable: J.R. MORTON, K.F. PRESTON, J. Magn. Reson. 1978, 30, 577
13PCIV-Part2-EPRSpectroscopy

14PCIV-Part2-EPRSpectroscopy
Contributions to dipolar hyperfine coupling
Point-dipole approximation
Spin density in p, d, f orbitals of the nucleus under consideration
1· for negligible spin density in p, d, f atomic orbitals of the nucleus under consideration, in particular H
· often one orbital dominates, axial symmetry contribution
· uniaxial hyperfine constant per isotope, principal values (T, T, -2T)
· distribute electron spin to a set of points located at nuclei with significant spin density
· always traceless, but purely axial only if sum runs over a single center j
n unit vector from nucleus to j
th j center of spin density
®
13· Examples: C for r = 1, T = 107.3 MHzp
19 F for r = 1, T = 628 MHzp
Table: J.R. MORTON, K.F. PRESTON, J. Magn. Reson. 1978, 30, 577
H Hs s
pz pz
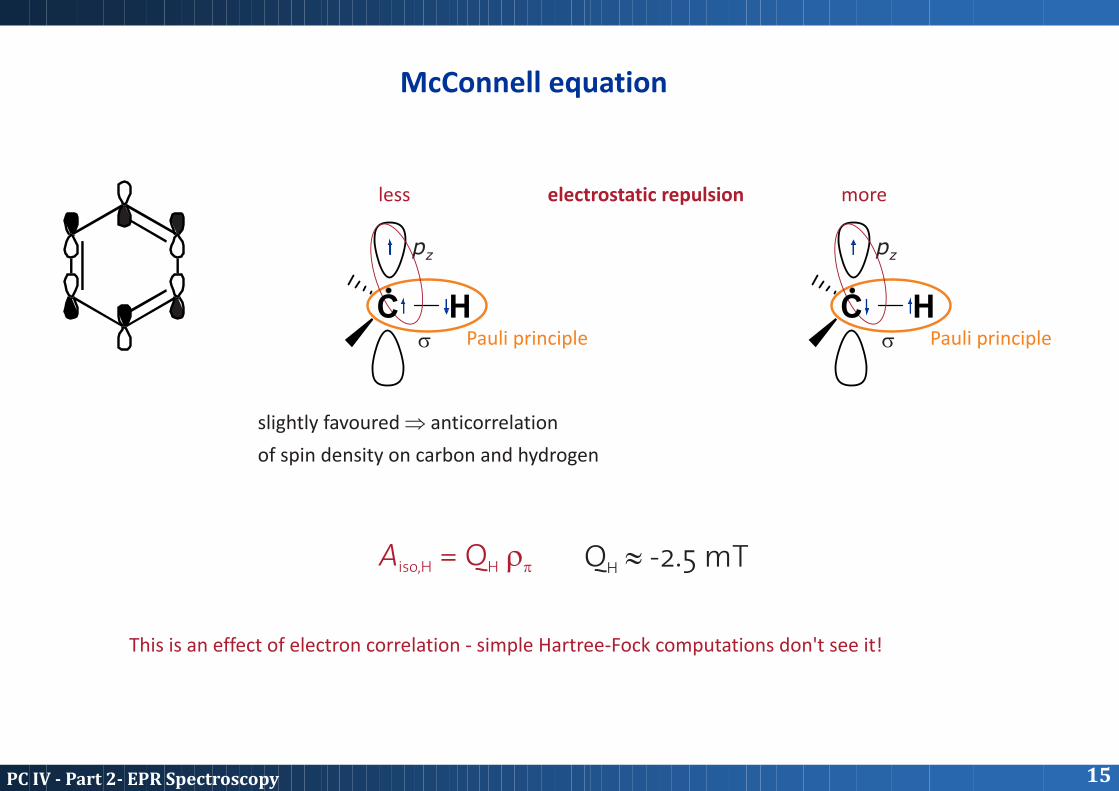
McConnell equation
Pauli principle Pauli principle
less electrostatic repulsion more
slightly favoured Þ anticorrelation
of spin density on carbon and hydrogen
A = Q riso,H H p Q » -2.5 mTH
This is an effect of electron correlation - simple Hartree-Fock computations don't see it!
15PCIV-Part2-EPRSpectroscopy
C C
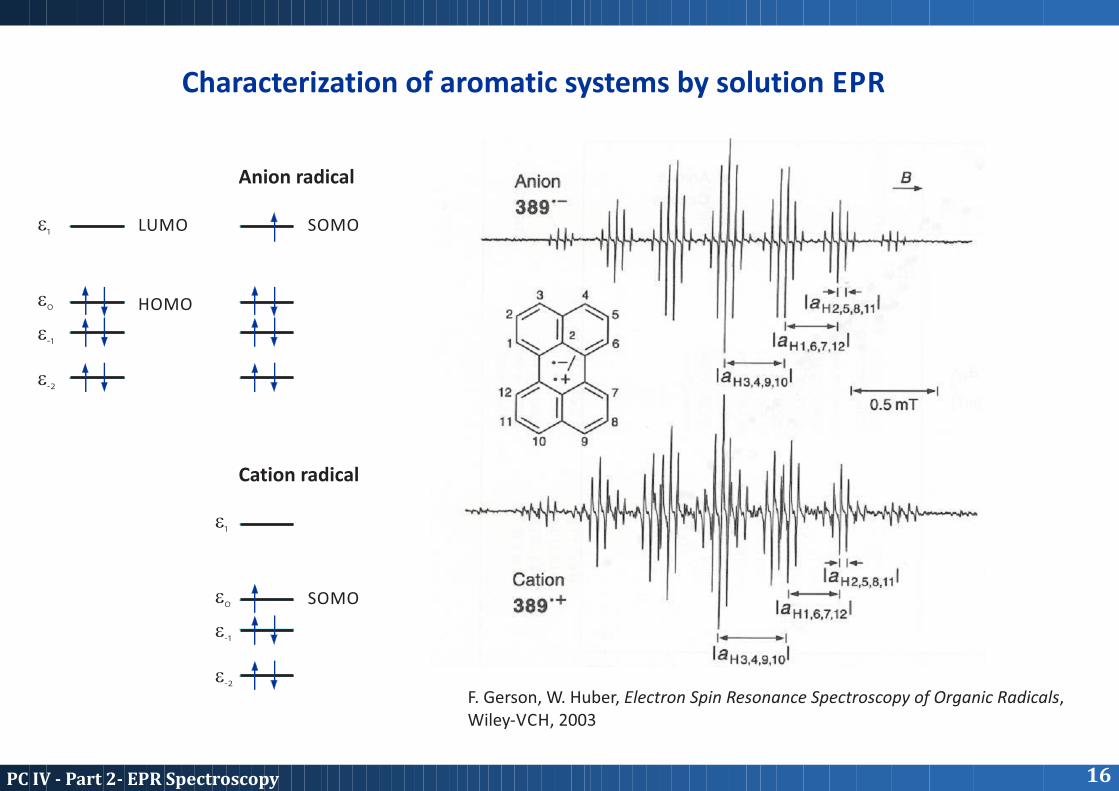
Characterization of aromatic systems by solution EPR
16PCIV-Part2-EPRSpectroscopy
e0
e0
e-1
e-1
e-2
e-2
e1
e1
HOMO
LUMO SOMO
SOMO
Anion radical
Cation radical
F. Gerson, W. Huber, Electron Spin Resonance Spectroscopy of Organic Radicals,Wiley-VCH, 2003
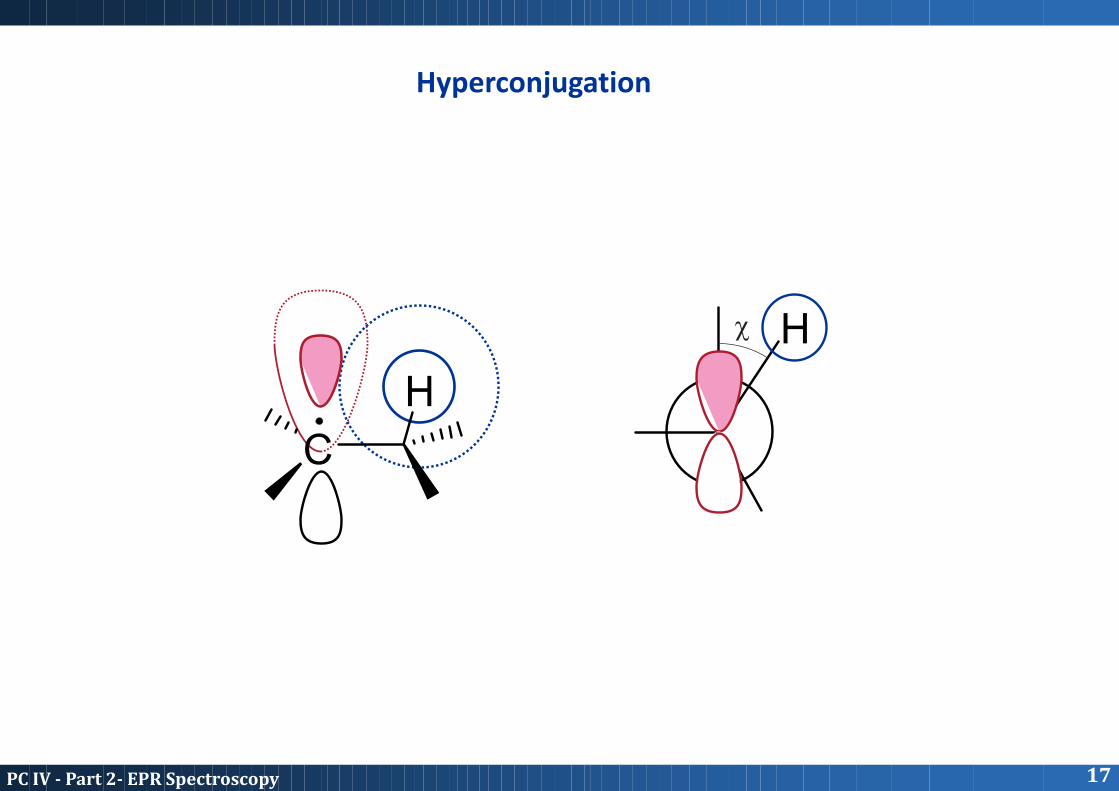
Hyperconjugation
C
H
Hc
17PCIV-Part2-EPRSpectroscopy

An
gu
lar
fre
qu
en
cy
magnetic field B0
|a a ñ, |a b ñS I S I
|a a ñS I
|b b ñS I
|a b ñS I
|b a ñS I
|b a ñ, |b b ñS I S I
Manifestation of hyperfine couplings in EPR spectra
electron Zeeman
field-dependent
A/2
A/2
· selection rules:
|Dm | = 1, Dm = 0S I
· level shift by hyperfine
interaction:
m m AS I
· be aware: hyperfine couplings are given in
- field units (G, mT)
- frequency units (MHz, A/2p)-1 - wave numbers (cm , A/2pc)
w +A/20 w -A/20
Field-swept EPR spectrum
static field B0
I
I II
II
-4 -11 G = 0.1 mT » 2.8 MHz » 10 cm (at g=g ) e
18PCIV-Part2-EPRSpectroscopy
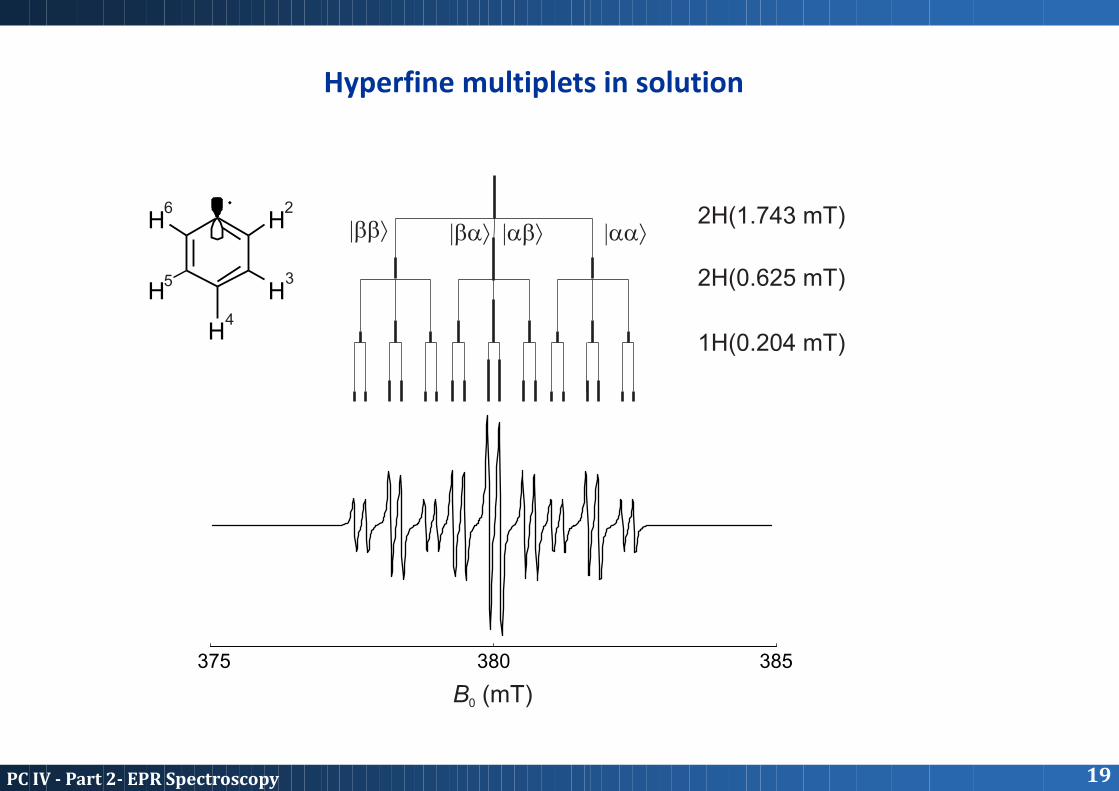
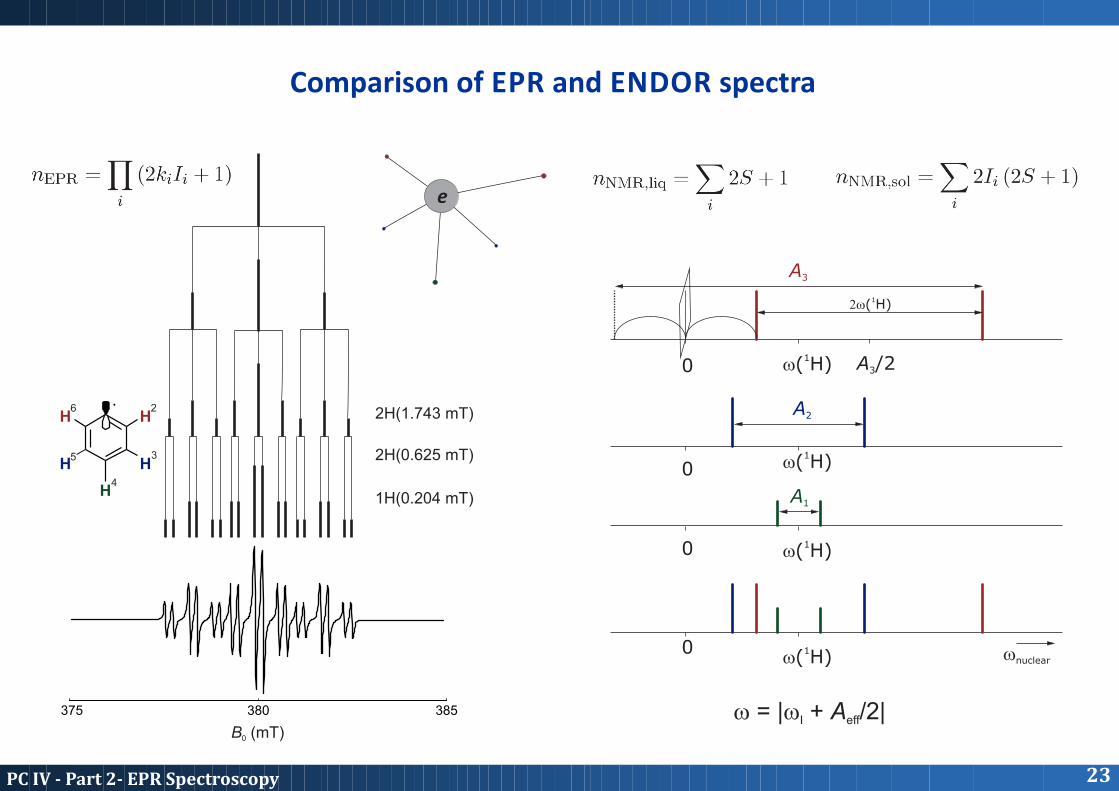
2H(1.743 mT)
2H(0.625 mT)
1H(0.204 mT)
375 380 385
B (mT)0
HH
H
H
H
26
35
4
|bbñ |bañ |abñ |aañ
Hyperfine multiplets in solution
19PCIV-Part2-EPRSpectroscopy

Hyperfine multiplets in solution (II)
20PCIV-Part2-EPRSpectroscopy
4 equivalent aromatic protons
2´2 equivalent aromatic protons
8 equivalent exo protons
2´4 equivalent exo protons
8 equivalent endo protons
2´4 equivalent endo protons
5·9·9 = 405 lines
4·3·3·5·5·5·5 = 22'500 lines
K⁺ + (I = 3/2)³⁹K
Pn = EPR
i
(2 k I + 1)ii
multiplicity
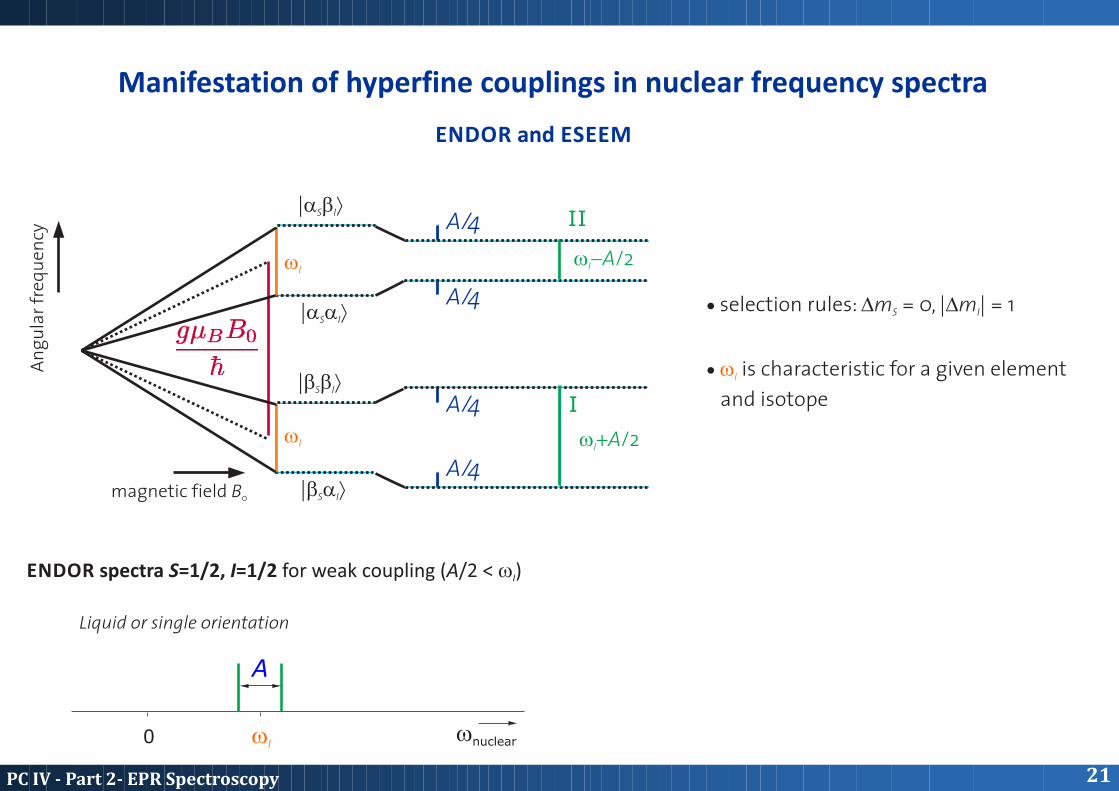
Manifestation of hyperfine couplings in nuclear frequency spectra
An
gu
lar
fre
qu
en
cy
magnetic field B0
|a a ñS I
|b a ñS I
|a b ñS I
|b b ñS I
A/4
A/4
A/4
A/4
· selection rules: Dm = 0, |Dm | = 1S I
· is characteristic for a given elementwI
and isotope
w +A/2I
w -A/2I
I
II
wI
wI
wI0
A
wnuclear
ENDOR spectra S=1/2, I=1/2 for weak coupling (A/2 < w )I
Liquid or single orientation
ENDOR and ESEEM
21PCIV-Part2-EPRSpectroscopy
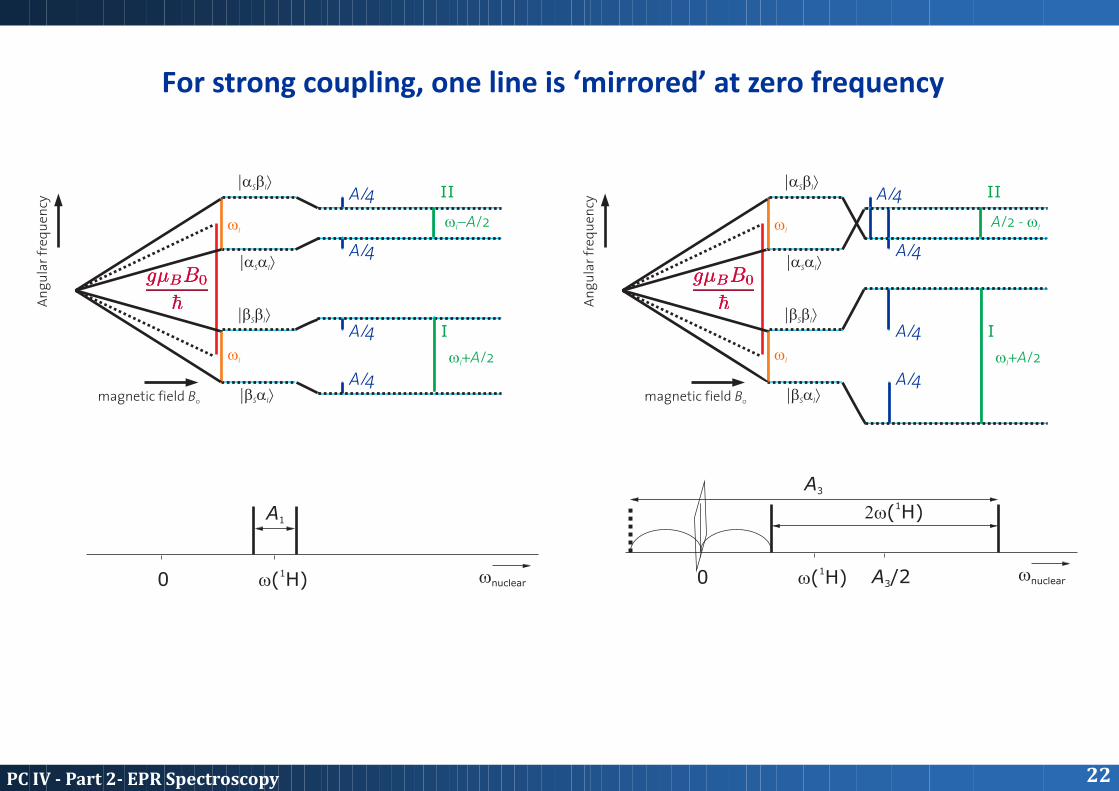
An
gu
lar
fre
qu
en
cy
An
gu
lar
fre
qu
en
cy
magnetic field B0 magnetic field B0
|a a ñS I |a a ñS I
|b a ñS I |b a ñS I
|a b ñS I |a b ñS I
|b b ñS I |b b ñS I
A/4 A/4
A/4 A/4
A/4 A/4
A/4 A/4
w +A/2I w +A/2I
w -A/2I A/2 - wI
I I
II II
wI wI
wI wI
For strong coupling, one line is ‘mirrored’ at zero frequency
1w( H)0
A1
wnuclear
1w( H)
12w( H)
0
A3
A /23wnuclear
22PCIV-Part2-EPRSpectroscopy
2H(1.743 mT)
2H(0.625 mT)
1H(0.204 mT)
375 380 385
B (mT)0
HH
H
H
H
26
35
4
w = |w + A /2| I eff
Comparison of EPR and ENDOR spectra
23PCIV-Part2-EPRSpectroscopy
1w( H)
12w( H)
1w( H)
1w( H)
1w( H)
0
0
0
0
A3
A1
A2
A /23
wnuclear
e
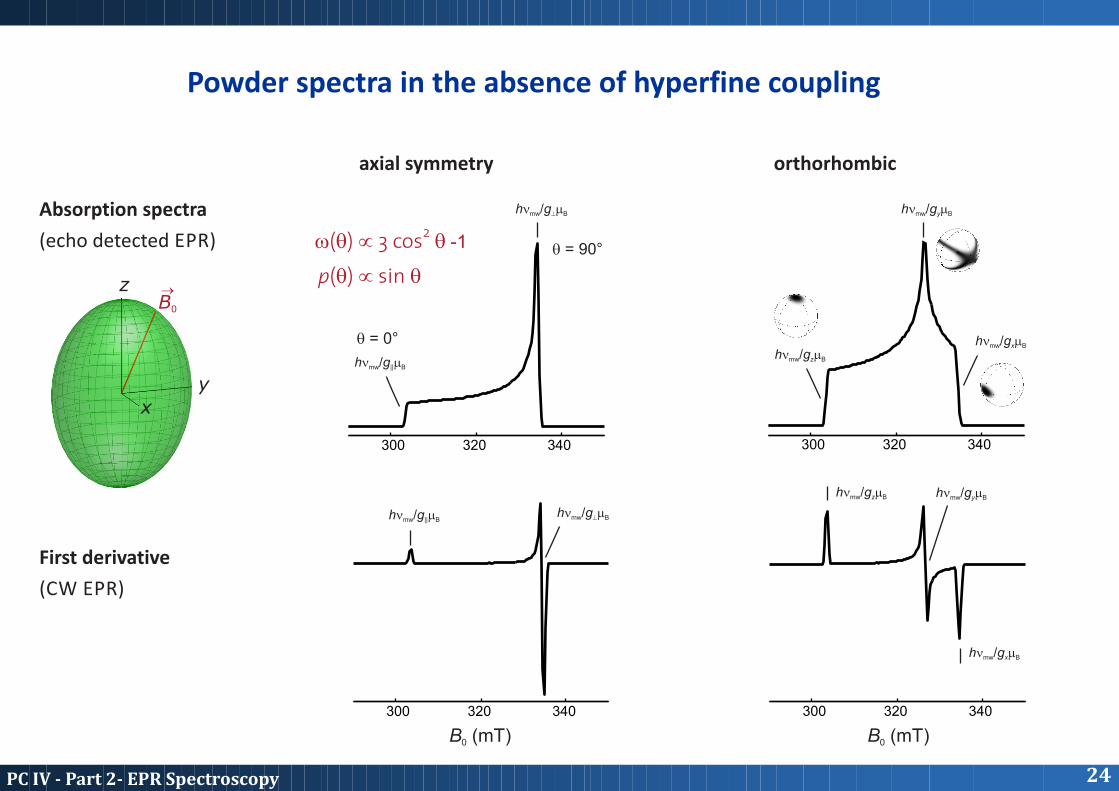
300 320 340
hn /g mmw || B
hn /g mmw z B
hn /g mmw || B
hn /g mmw z B
hn /g mmw x B
hn /g mmw ^ B hn /g mmw y B
hn /g mmw ^ B
hn /g mmw x B
hn /g mmw y B
300 320 340
B (mT)0 B (mT)0
q = 0°
q = 90°
300 320 340
300 320 340
Absorption spectra
(echo detected EPR)
First derivative
(CW EPR)
axial symmetry orthorhombic
Powder spectra in the absence of hyperfine coupling
p(q) µ sin q
2w(q) µ 3 cos q -1
x
z
y
B0
®
24PCIV-Part2-EPRSpectroscopy
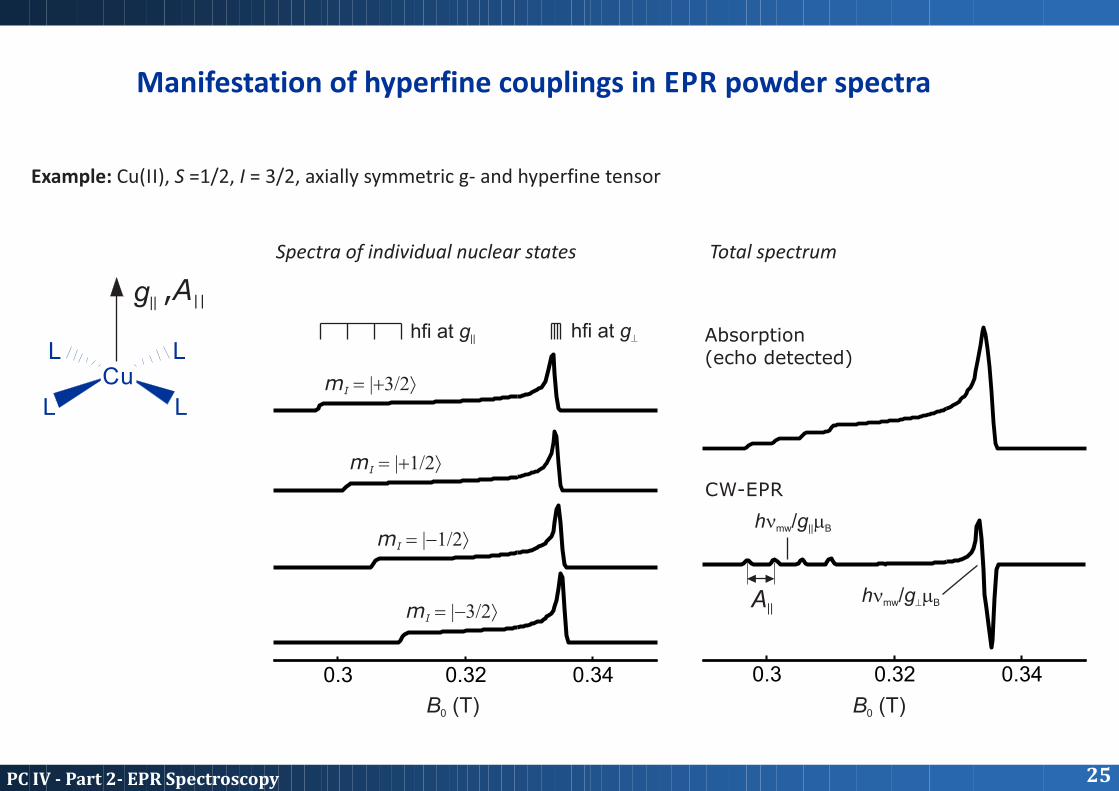
Example: Cu(II), S =1/2, I = 3/2, axially symmetric g- and hyperfine tensor
0.3 0.32 0.34 0.3 0.32 0.34
m = |-3/2ñI
m = |-1/2ñI
m = |+1/2ñI
m = |+3/2ñI
B (T)0 B (T)0
hn /g mmw || B
hfi at g||
A||hn /g mmw ^ B
hfi at g^
Cu
L
L L
L
g|| ,A||
Spectra of individual nuclear states Total spectrum
Absorption (echo detected)
CW-EPR
Manifestation of hyperfine couplings in EPR powder spectra
25PCIV-Part2-EPRSpectroscopy
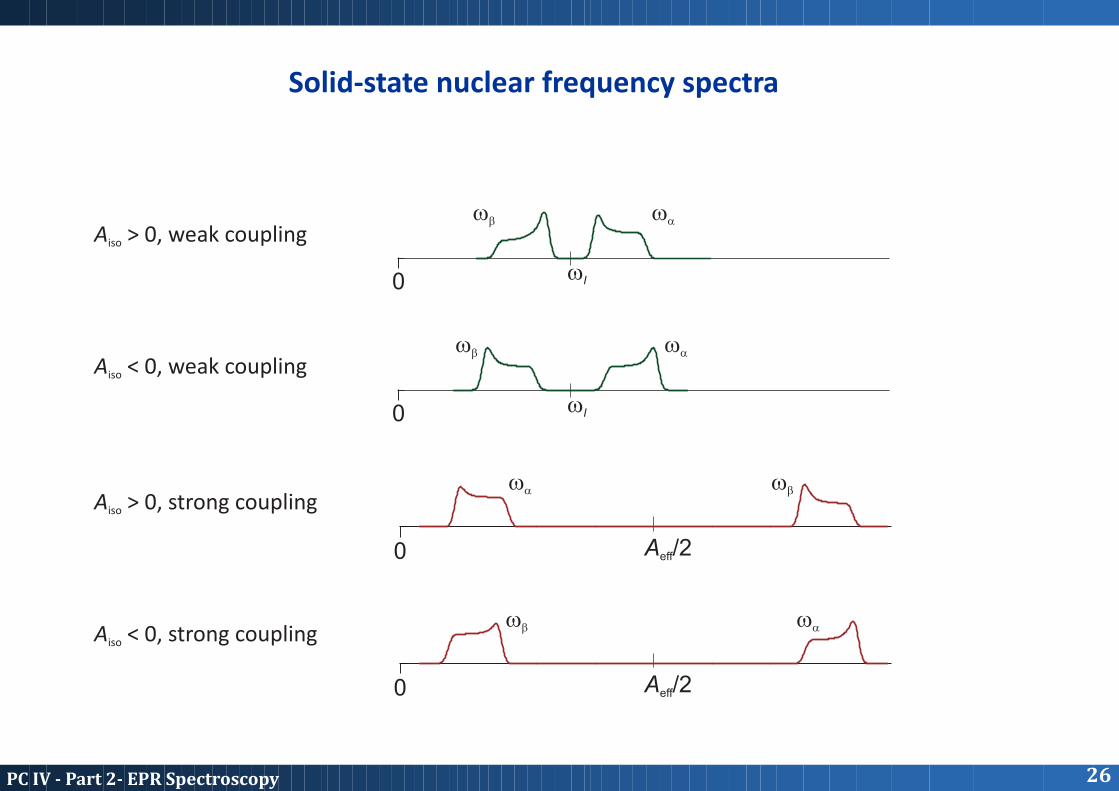
Solid-state nuclear frequency spectra
26PCIV-Part2-EPRSpectroscopy
wI
wI
0
0
wa
wa
wb
wb
0
0
A /2eff
A /2eff
wa
wa
wb
wb
A > 0, weak couplingiso
A > 0, strong couplingiso
A < 0, weak couplingiso
A < 0, strong couplingiso
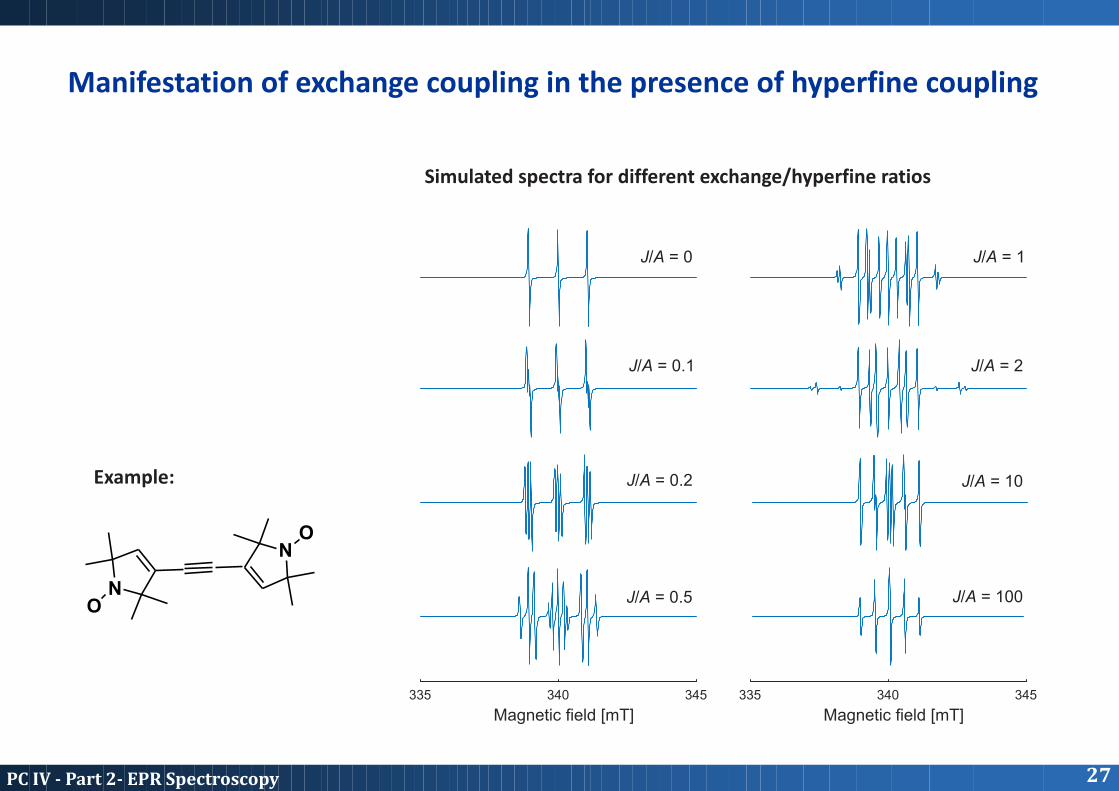
Manifestation of exchange coupling in the presence of hyperfine coupling
27PCIV-Part2-EPRSpectroscopy
335 335340 340345 345
Magnetic field [mT] Magnetic field [mT]
J/A = 0 J/A = 1
J/A = 2
J/A = 10
J/A = 100
J/A = 0.1
J/A = 0.2
J/A = 0.5N
N
O
O
Example:
Simulated spectra for different exchange/hyperfine ratios
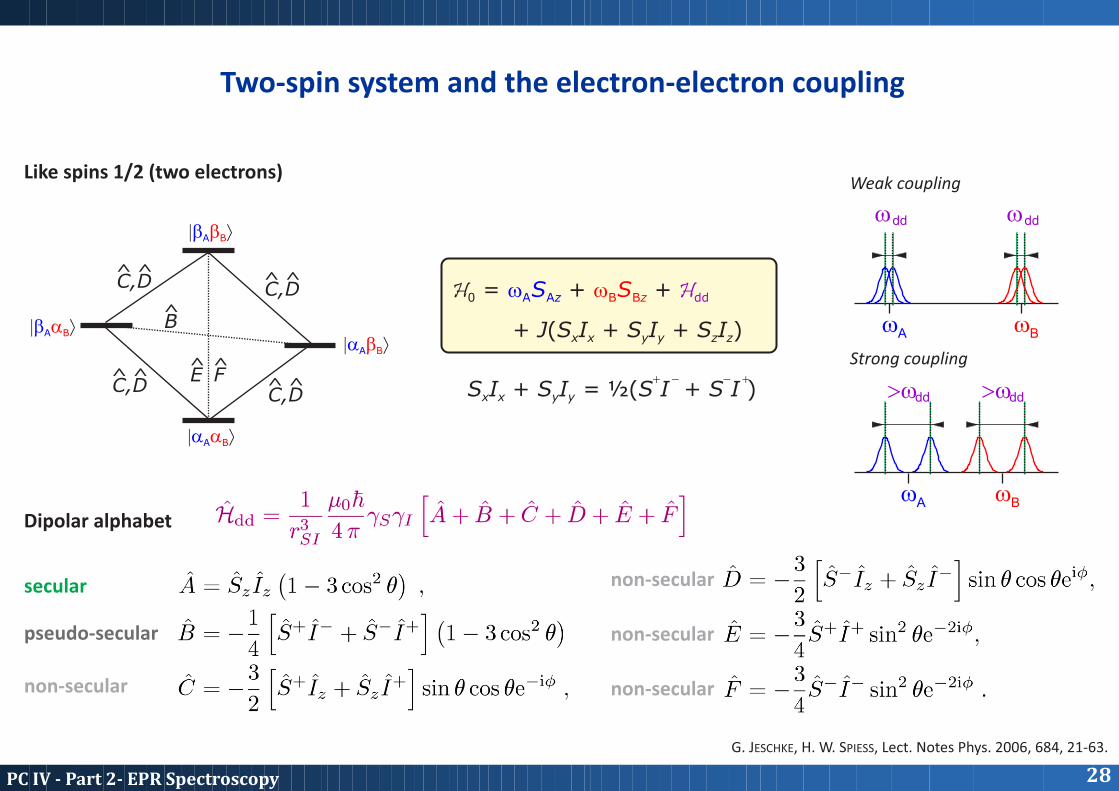
Two-spin system and the electron-electron coupling
| ñbAbB
| ñbAaB
| ñaAbB
| ñaAaB
B^
E F^ ^
C,D
C,D C,D
C,D^
^ ^
^^
^ ^
^
Like spins 1/2 (two electrons)
H = + + 0 w SA Az w SB Bz Hdd
+ J(S I + S I + S I )x x y y z z
G. JESCHKE, H. W. SPIESS, Lect. Notes Phys. 2006, 684, 21-63.
+ - - +S I + S I = ½(S I + S I )x x y y
Dipolar alphabet
secular
pseudo-secular
non-secular
non-secular
non-secular
non-secular
dd
dd
dd
dd
w
>w
w
>w
A
A
B
B
w
w
w
w
Weak coupling
Strong coupling
28PCIV-Part2-EPRSpectroscopy
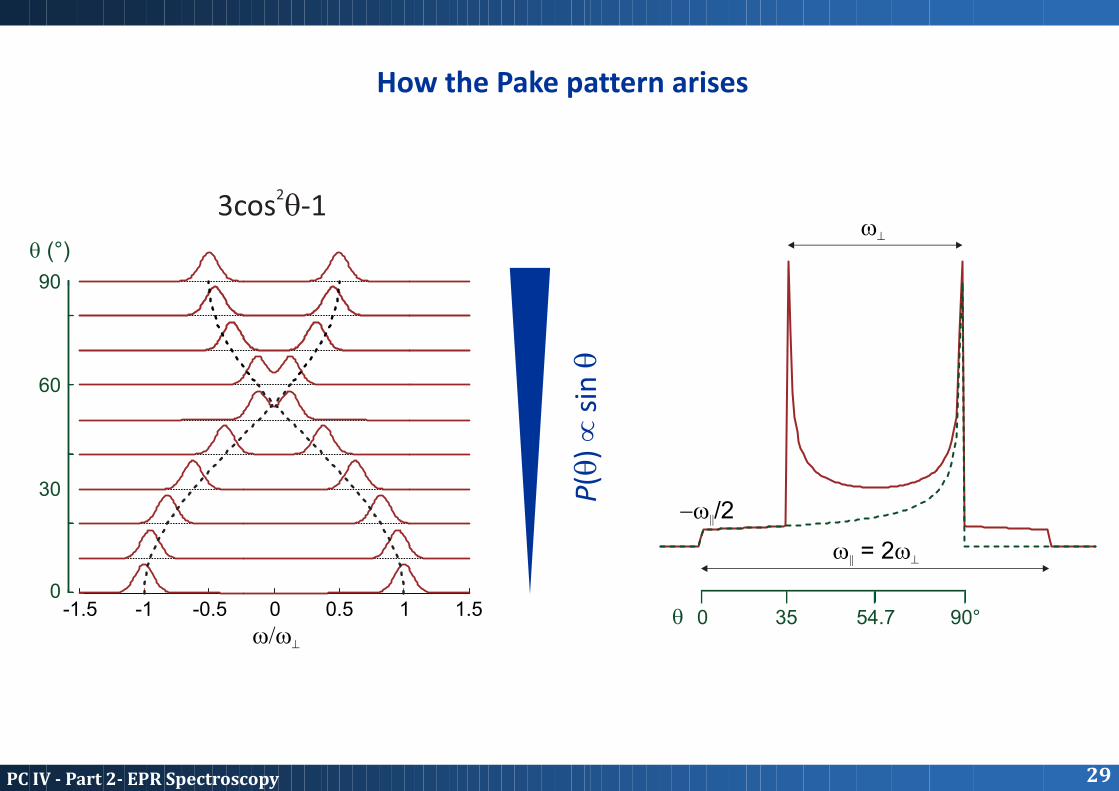
w/w^
w^
w = 2w|| ^
-w /2||
-1.5 -1 -0.5 0 0.5 1 1.5 q 0 35 54.7 90°
0
30
60
90
q (°)
How the Pake pattern arises
29PCIV-Part2-EPRSpectroscopy
23cos q-1
P(q
) µ
sin
q
d
eg
t2g
t2g
eg
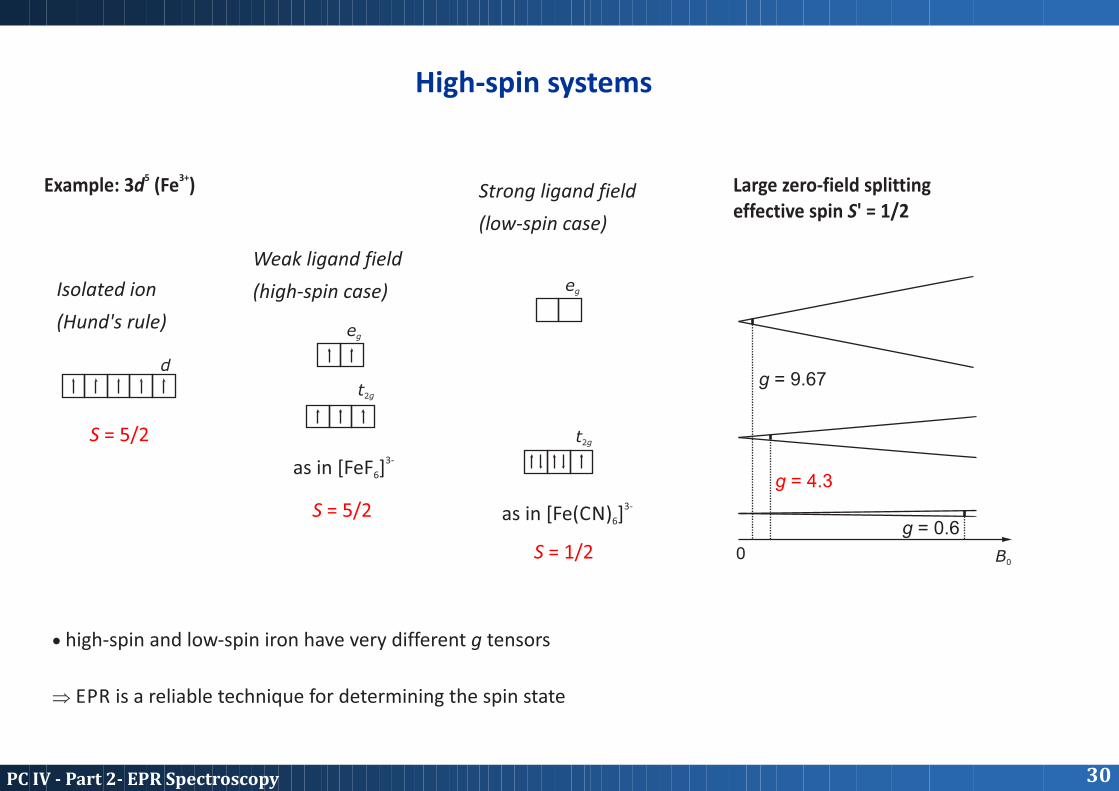
High-spin systems
5 3+Example: 3d (Fe ) Large zero-field splittingeffective spin S' = 1/2
Isolated ion
(Hund's rule)
Weak ligand field
(high-spin case)
Strong ligand field
(low-spin case)
3-as in [FeF ]6
3-as in [Fe(CN) ]6
S = 5/2
S = 5/2
S = 1/2 B00
g = 9.67
g = 4.3
g = 0.6
· high-spin and low-spin iron have very different g tensors
Þ EPR is a reliable technique for determining the spin state
30PCIV-Part2-EPRSpectroscopy
magnetic field (mT)
250 300 350 400 450
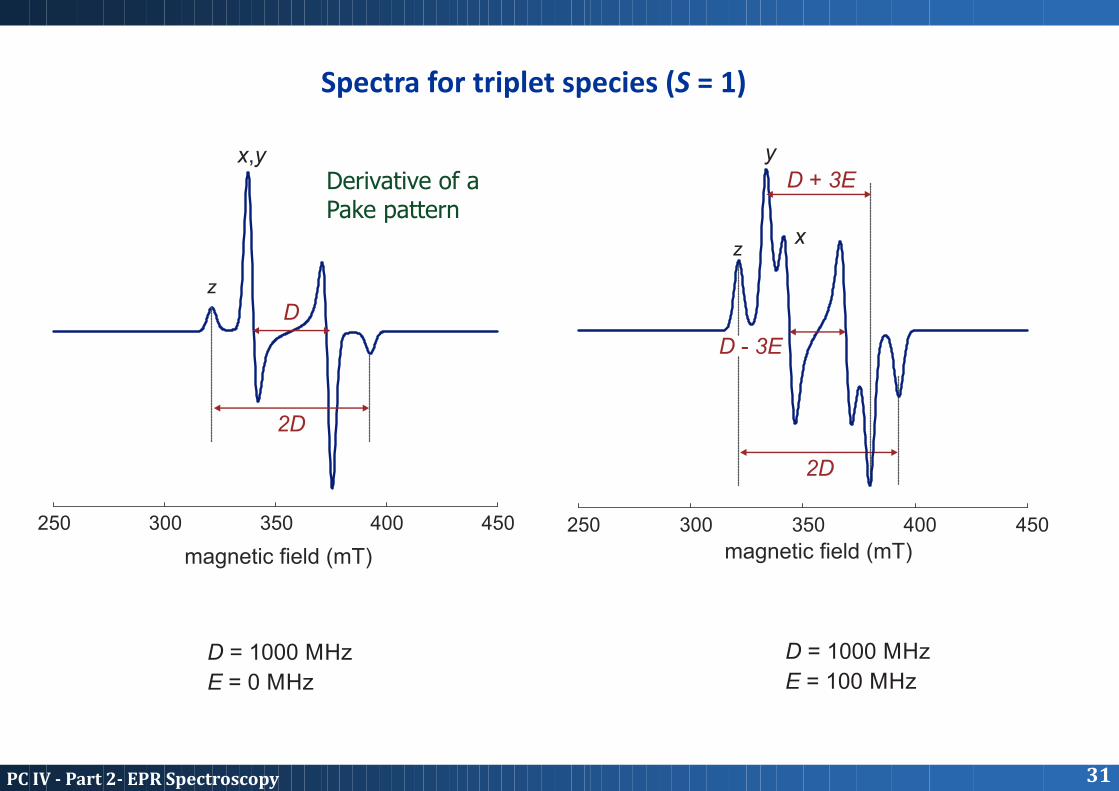
D = 1000 MHz
E = 0 MHz
D = 1000 MHz
E = 100 MHz
D
2D
2D
magnetic field (mT)250 300 350 400 450
x,y y
x
z
z
D - 3E
D + 3E
Spectra for triplet species (S = 1)
31PCIV-Part2-EPRSpectroscopy
Derivative of a Pake pattern
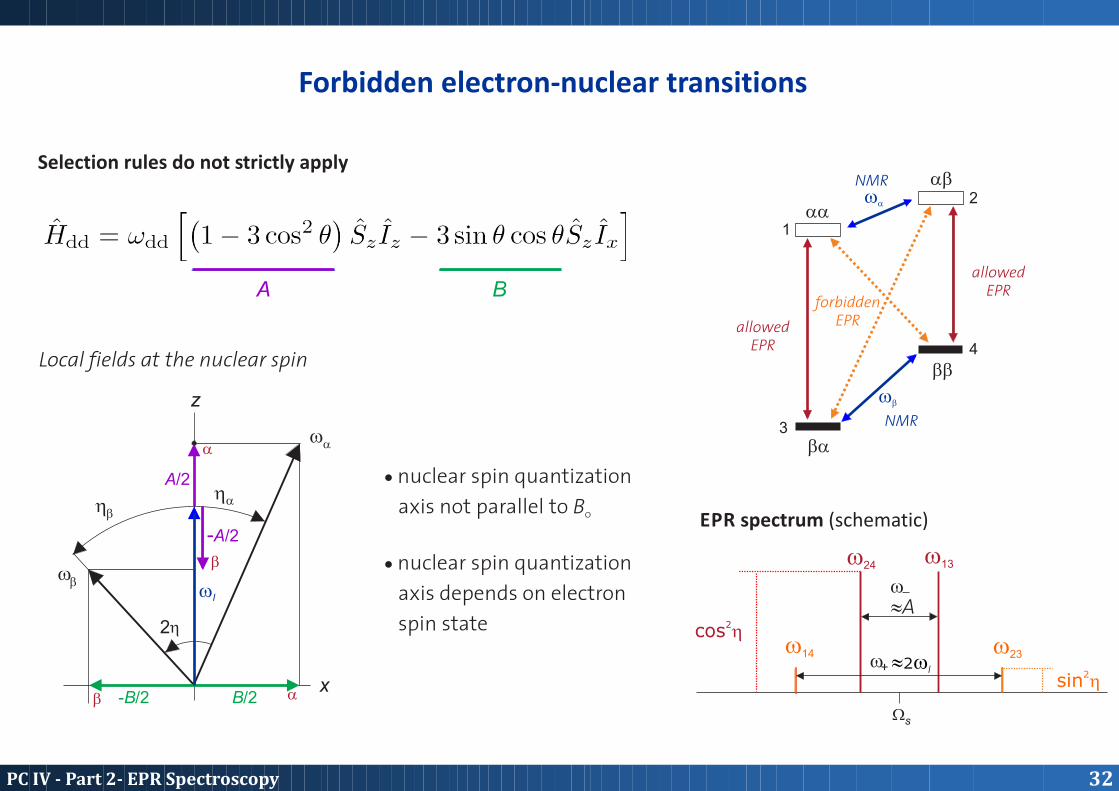
Forbidden electron-nuclear transitions
Selection rules do not strictly apply
z
x
A/2
-A/2
-B/2 B/2
wI
2
hah
h
b
w
wb
aa
b
b a
A B
Local fields at the nuclear spin
· nuclear spin quantization
axis not parallel to B0
· nuclear spin quantization
axis depends on electron
spin state
1
2
3
4
wa
wb
aa
ab
ba
bb
NMR
NMR
allowedEPR
allowedEPR
forbiddenEPR
32PCIV-Part2-EPRSpectroscopy
w24 w13
w14 w23
w
w
Ws
+
2cos h
2sin h
EPR spectrum (schematic)
»A
»2wI
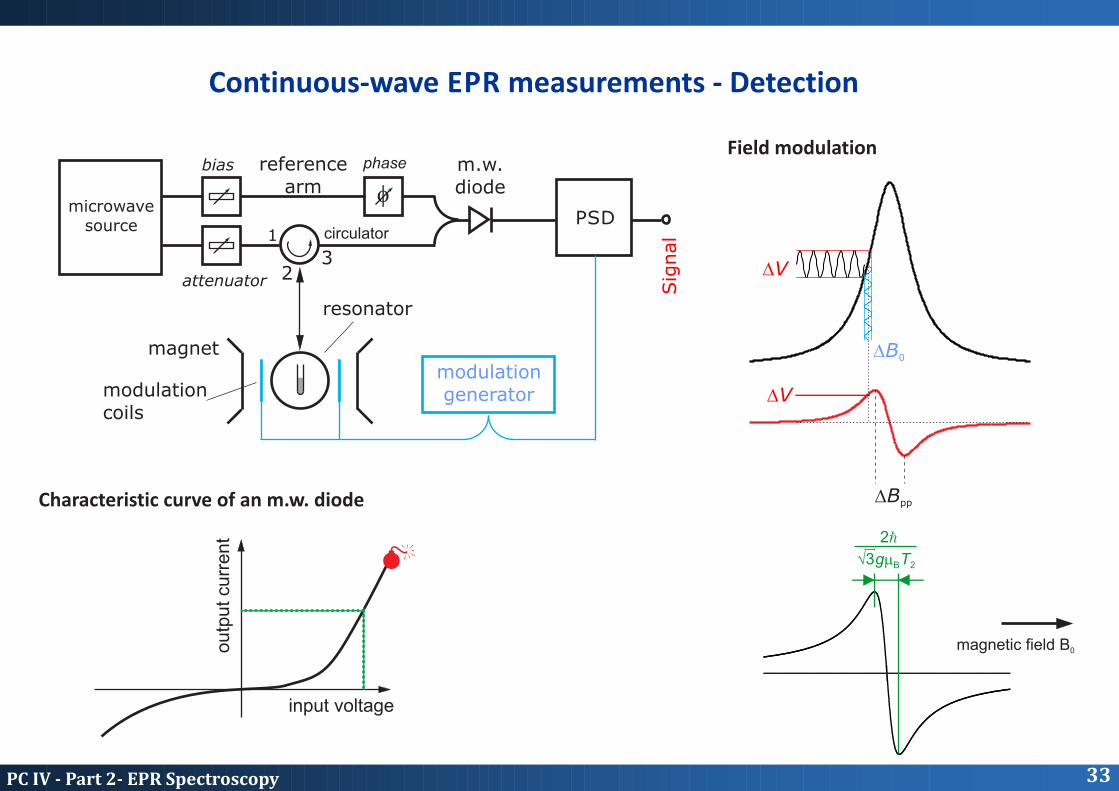
Continuous-wave EPR measurements - Detection
DB0
DBpp
DV
DV
input voltage
outp
ut cu
rrent
microwave source
reference arm
bias
attenuator
resonator
magnet
modulationcoils
1
23
f
m.w.diode
PSD
modulationgenerator
Sig
nalcirculator
phase
Characteristic curve of an m.w. diode
Field modulation
M
magnetic field B0
gm TB 2
2Ñ
Ö3
33PCIV-Part2-EPRSpectroscopy
N NNO O
OO=O O=OO=O· ··· ··
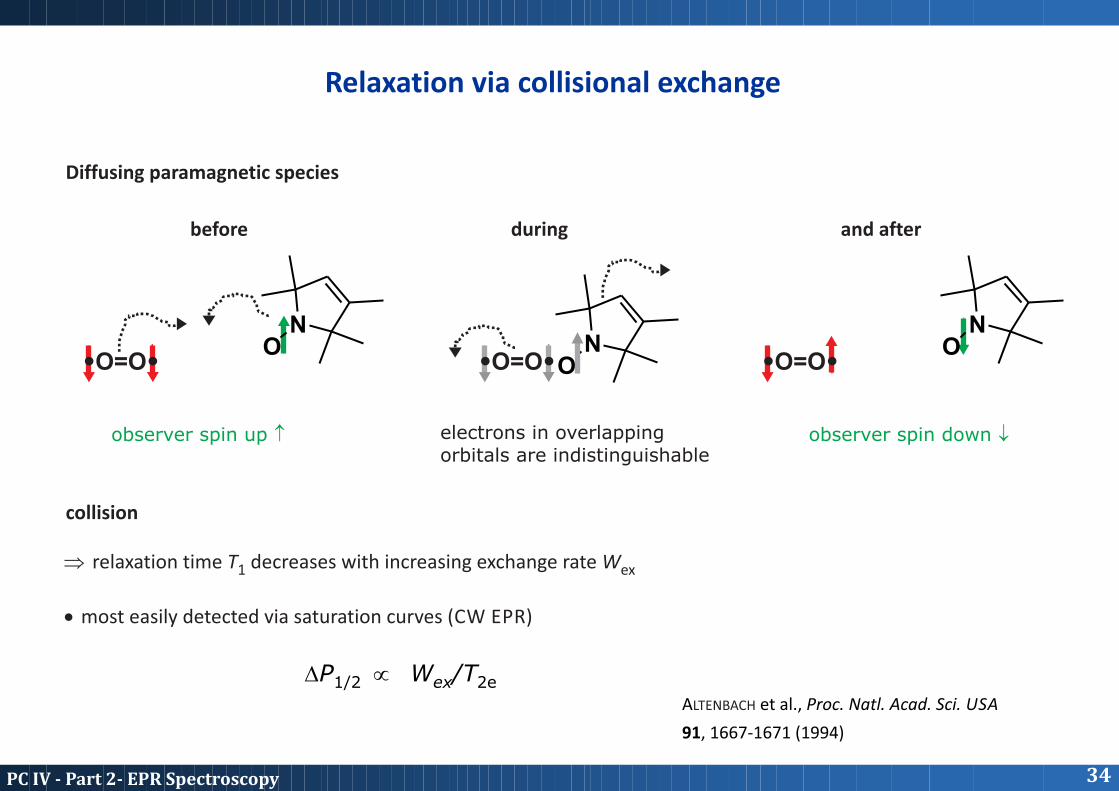
Diffusing paramagnetic species
collision
before and afterduring
electrons in overlappingorbitals are indistinguishable
observer spin up observer spin down ¯
· most easily detected via saturation curves (CW EPR)
Þ relaxation time T decreases with increasing exchange rate W1 ex
DP1/2 W /Tex 2eµA et al., Proc. Natl. Acad. Sci. USALTENBACH
91, 1667-1671 (1994)
Relaxation via collisional exchange
34PCIV-Part2-EPRSpectroscopy
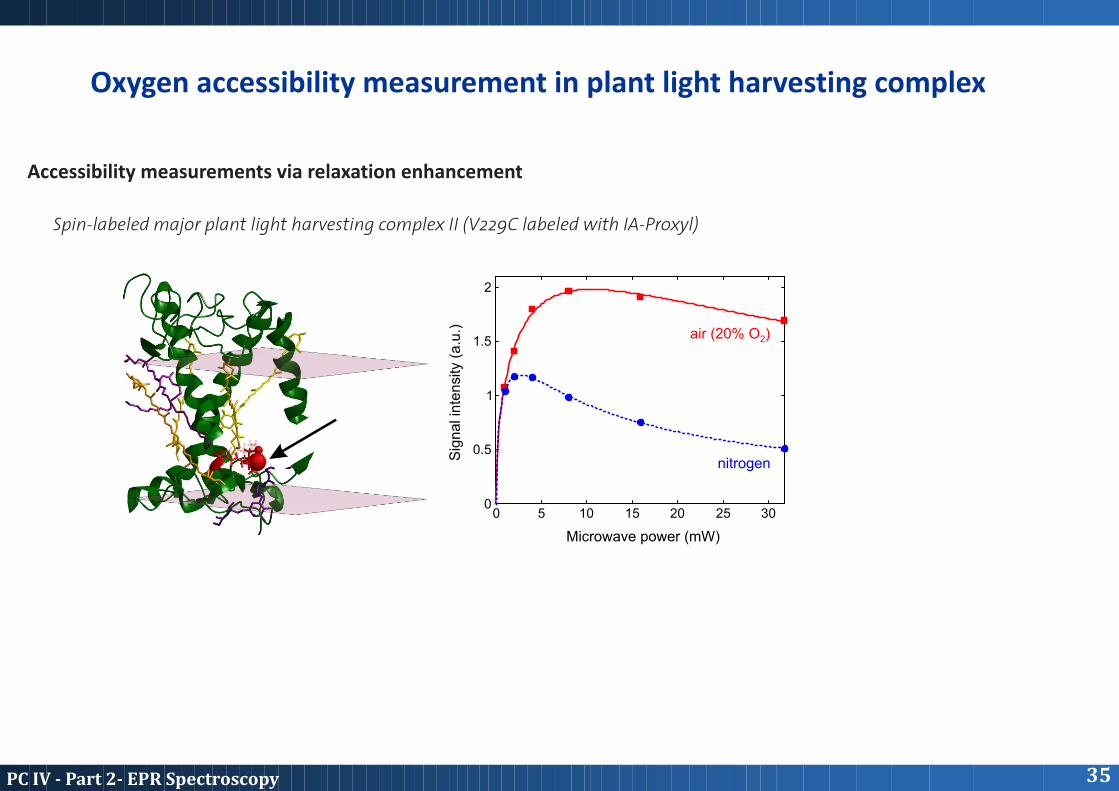
Oxygen accessibility measurement in plant light harvesting complex
0 5 10 15 20 25 300
0.5
1
1.5
2
Microwave power (mW)
Sig
nal i
nte
nsi
ty (
a.u
.) air (20% O )2
nitrogen
Accessibility measurements via relaxation enhancement
Spin-labeled major plant light harvesting complex II (V229C labeled with IA-Proxyl)
35PCIV-Part2-EPRSpectroscopy
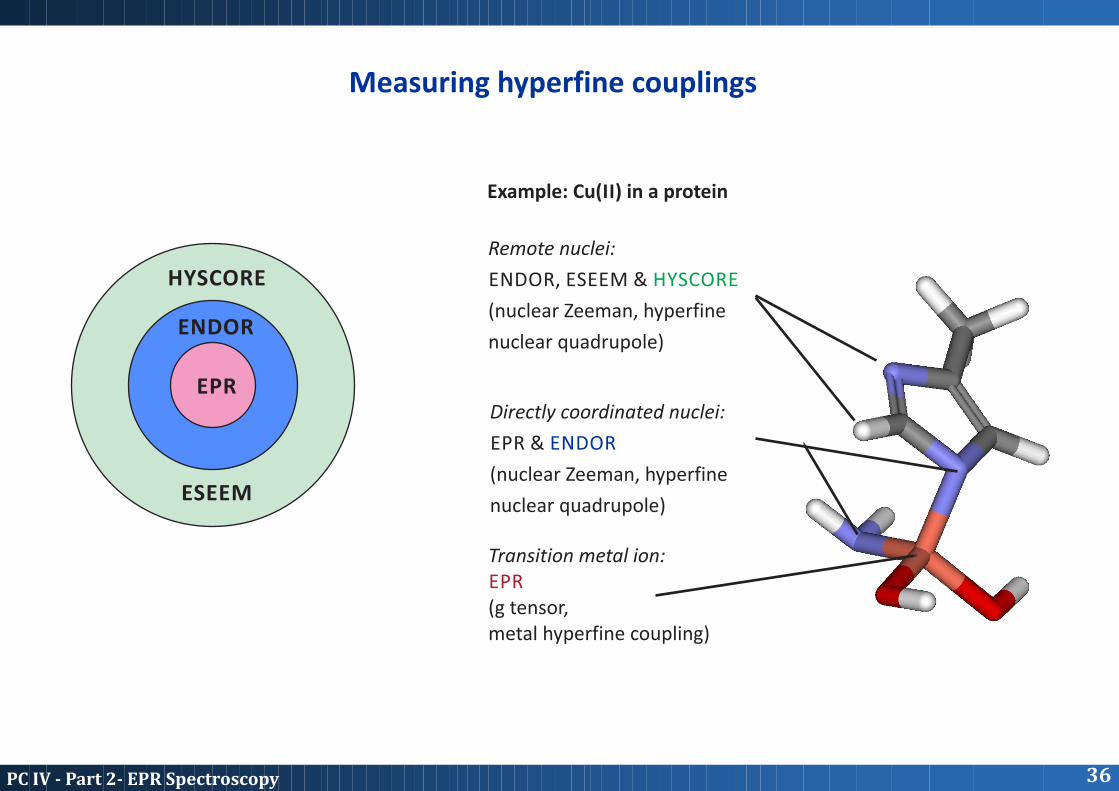
Measuring hyperfine couplings
Example: Cu(II) in a protein
Transition metal ion: EPR (g tensor, metal hyperfine coupling)
Directly coordinated nuclei:
EPR & ENDOR
(nuclear Zeeman, hyperfine
nuclear quadrupole)
Remote nuclei:
ENDOR, ESEEM & HYSCORE
(nuclear Zeeman, hyperfine
nuclear quadrupole)
EPR
ENDOR
HYSCORE
ESEEM
36PCIV-Part2-EPRSpectroscopy
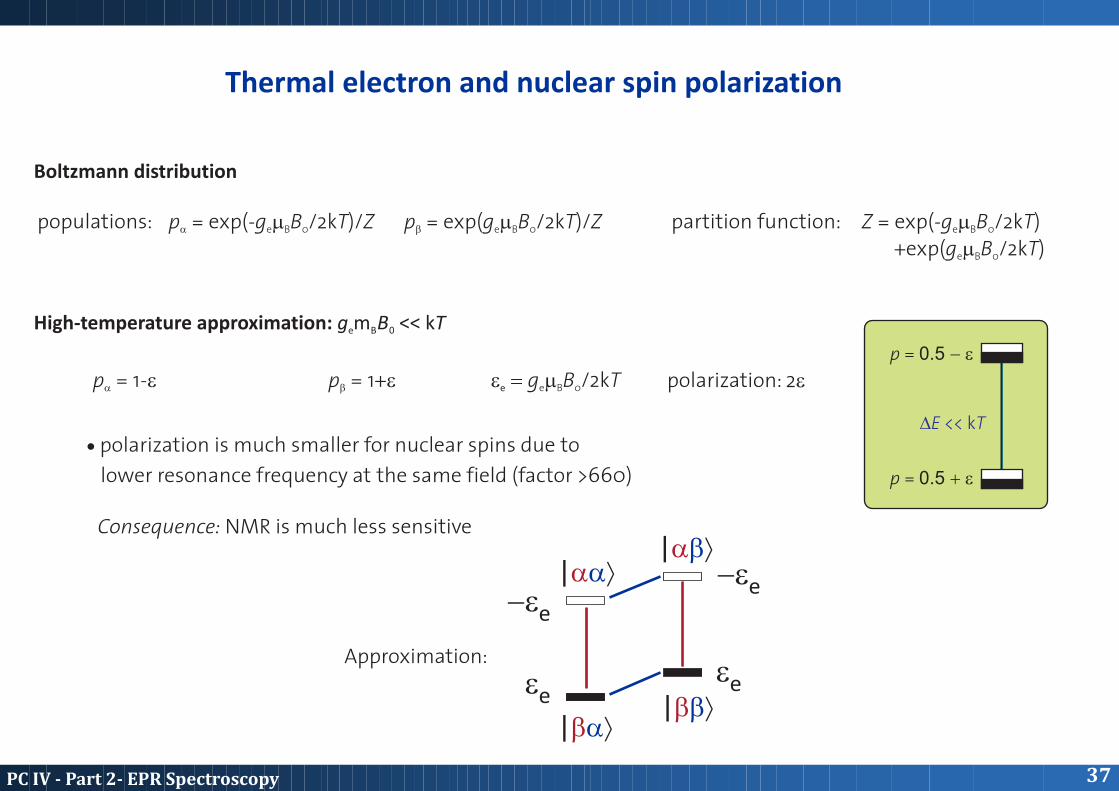
Thermal electron and nuclear spin polarization
p = exp(-g m B /2kT)/Za e B 0
p = 1-ea
populations: partition function:
polarization: 2e
Z = exp(-g m B /2kT)e B 0
+exp(g m B /2kT) e B 0
p = exp(g m B /2kT)/Zb e B 0
p = 1+eb e = g m B /2kTe e B 0
Boltzmann distribution
High-temperature approximation: g m B << kT e B 0
p = 0.5 - e
p = 0.5 + e
DE << kT
Consequence: NMR is much less sensitive
37PCIV-Part2-EPRSpectroscopy
· polarization is much smaller for nuclear spins due to
lower resonance frequency at the same field (factor >660)
| ñaa
| ñba
| ñab
| ñbbee
ee
-ee
-ee
Approximation:
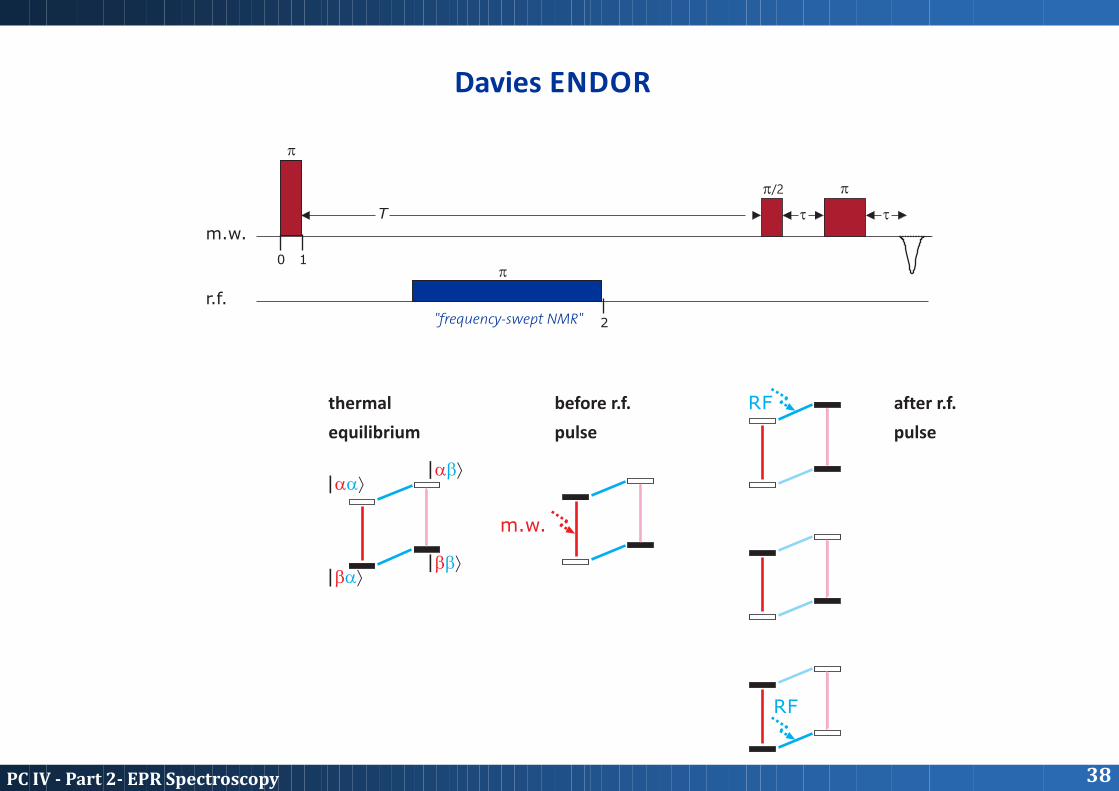
Davies ENDOR
| ñaa
| ñba
| ñab
| ñbb
m.w.
RF
RF
p
p/2 p
p
t tT
m.w.
r.f.
0 1
2"frequency-swept NMR"
thermal
equilibrium
before r.f.
pulse
after r.f.
pulse
38PCIV-Part2-EPRSpectroscopy
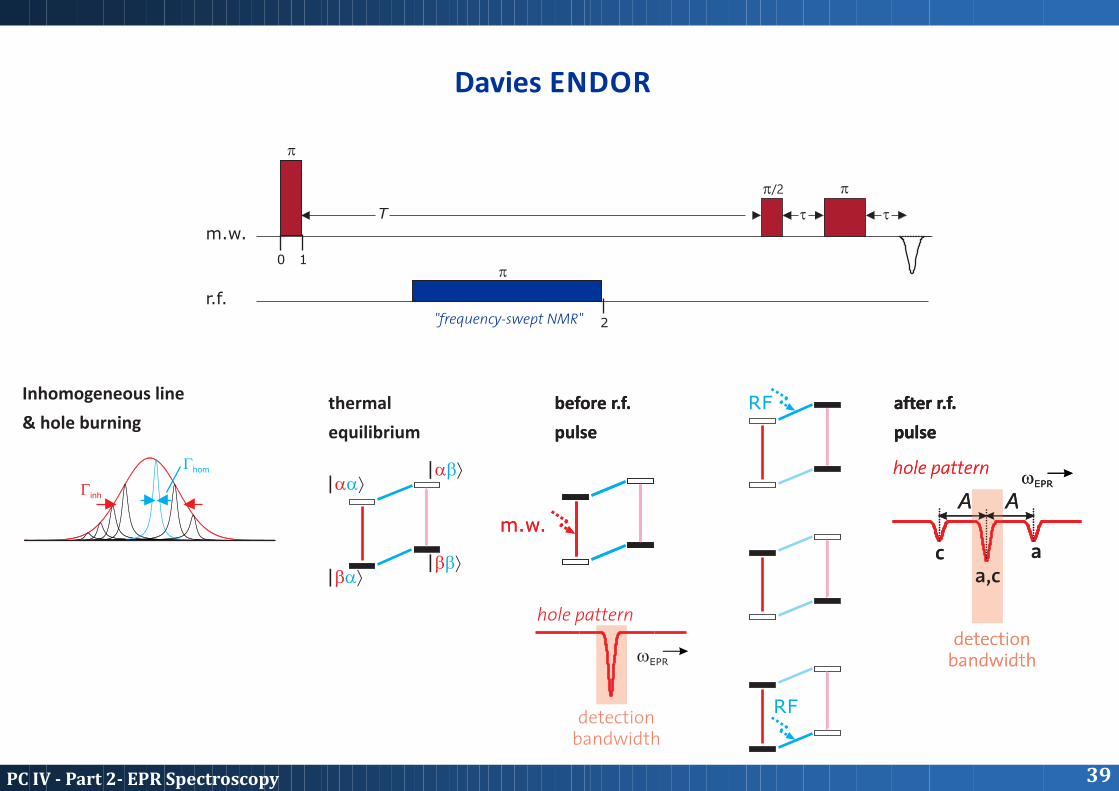
after r.f.
pulse
wEPR
A A
aca,c
hole pattern
detectionbandwidth
m.w.
before r.f.
pulse
after r.f.
pulse
wEPR
wEPR
A A
aca,c
hole pattern
hole pattern
detectionbandwidth
detectionbandwidth
Inhomogeneous line
& hole burning
Ginh
Ghom
Davies ENDOR
| ñaa
| ñba
| ñab
| ñbb
m.w.
RF
RF
p
p/2 p
p
t tT
m.w.
r.f.
0 1
2"frequency-swept NMR"
thermal
equilibrium
before r.f.
pulse
after r.f.
pulse
39PCIV-Part2-EPRSpectroscopy
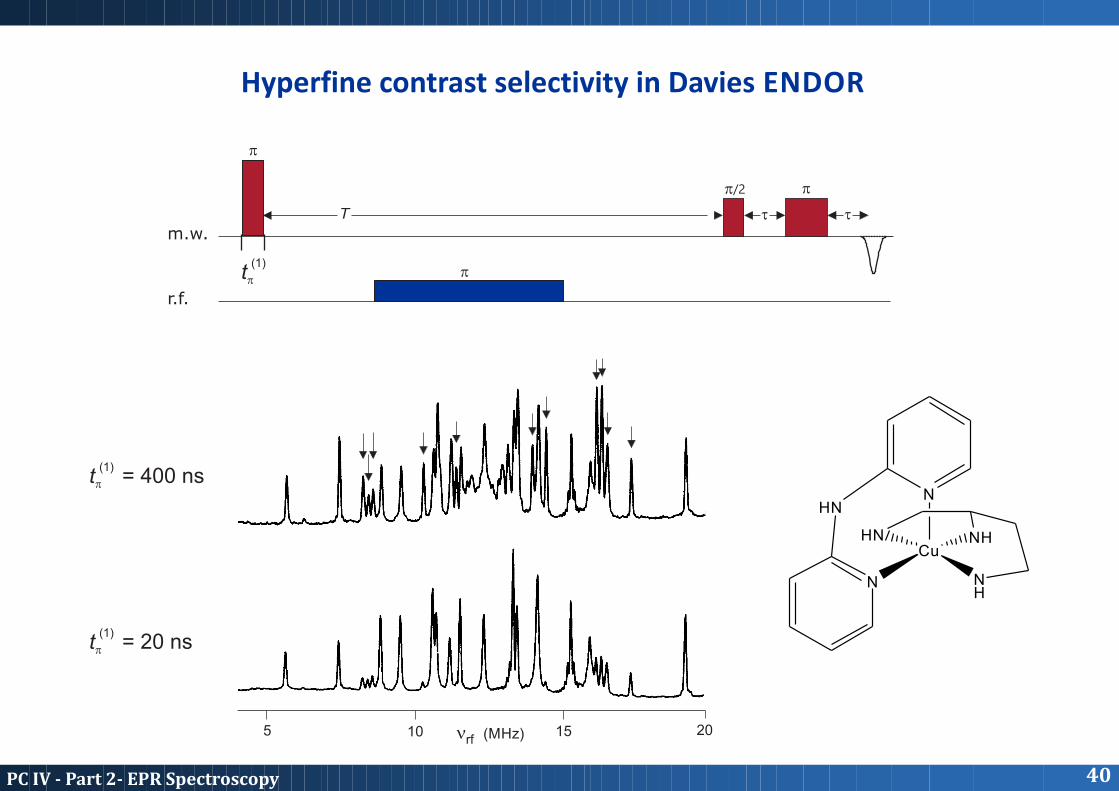
Hyperfine contrast selectivity in Davies ENDOR
15105 20n (MHz)rf
Cu
N
HN NH
NH
NHN
(1)t = 400 nsp
(1)t = 20 nsp
p
p/2 p
p
t tT
m.w.
r.f.
(1)tp
40PCIV-Part2-EPRSpectroscopy
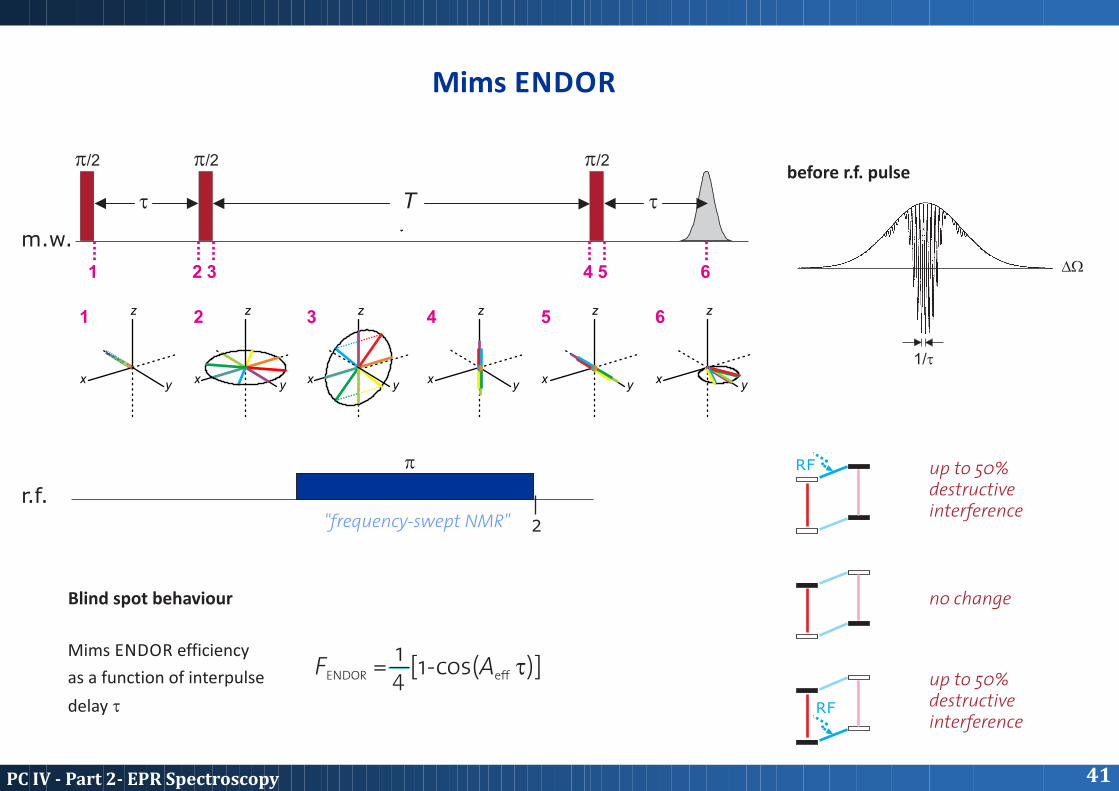
p/2 p/2p/2
t tT
1 2 3 4 5 6
y
z
x
1
y
z
x
2
y
z
x
3
y
z
x
4
y
z
x
5
y
z
x
6
Mims ENDOR
DW
1/t
RF
RF
p
r.f.
m.w.
2"frequency-swept NMR"
before r.f. pulse
Blind spot behaviour no change
up to 50% destructive interference
up to 50% destructive interference
F = [1-cos(A t)]ENDOR eff
14
Mims ENDOR efficiency
as a function of interpulse
delay t
41PCIV-Part2-EPRSpectroscopy

Electron-electron coupling
Exchange coupling
Dipole-dipole coupling
· arises from overlap of the SOMO's of two electrons
- binding overlap « antiferromagnetic coupling « DE =DE < DE =DEab ba aa bb
- anti-binding overlap « ferromagnetic coupling « DE =DE > DE =DEab ba aa bb
· strong exchange coupling (J > gm B /h)B 0
- antiferromagnetic: diamagnetic singlet ground state
- ferromagnetic: paramagnetic triplet ground state
|aañ
|bañ|abñ
|bbñ
Weak coupling: J, w << wdd 0
local field invertedlocal field
r r N
S
Exte
rna
l ma
gn
eti
c fi
eld
for weak g anisotropy for strong g anisotropy
w /2p » 52.04 MHz at r = 1 nmdd 12 r
0B
µ1
µ2
®
®
®
q1
q2
f
42PCIV-Part2-EPRSpectroscopy
0
10
20
30
40
50
60
70
80
90
01
Origin of the Pake pattern
q (°)
P(q) n/w^
-1.5 -1 -0.5 0 0.5 1 1.5
0B
q
circumference:
2p sinq rw^q-=q 2cos31
221
03 4
1Bgg
hrw^ m
p
m=
0B observer spin
local field
r
q
q 0 35 54.7 90°
-3w µ r^
d ½
H = d 2S Idd z z
43PCIV-Part2-EPRSpectroscopy
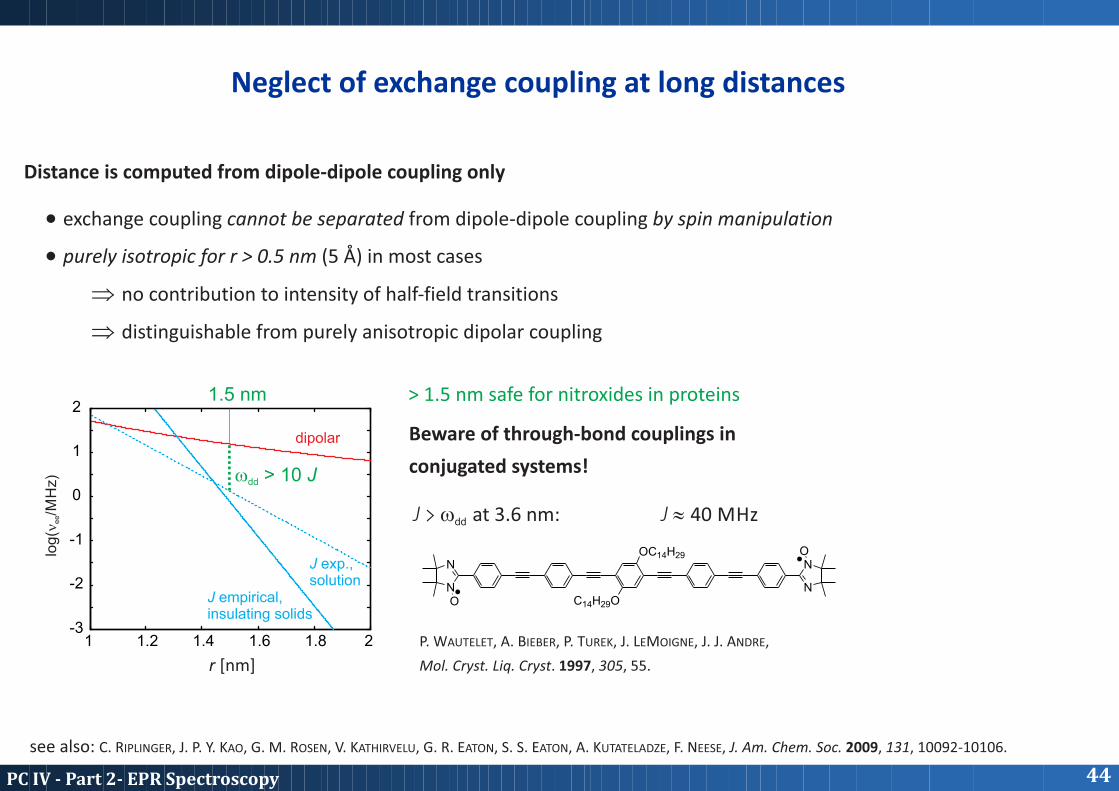
· exchange coupling from dipole-dipole coupling cannot be separated by spin manipulation
· (5 Å) in most casespurely isotropic for r > 0.5 nm
Þ no contribution to intensity of half-field transitions
Þ distinguishable from purely anisotropic dipolar coupling
1 1.2 1.4 1.6 1.8 2-3
-2
-1
0
1
2
J empirical,insulating solids
J exp.,solution
w > 10 Jdd
1.5 nm
dipolar
log
(n/M
Hz)
ee
Beware of through-bond couplings in
conjugated systems!
J > w at 3.6 nm: dd
N
N
ON
NOOC14H29
C14H29O
J » 40 MHz
P. WAUTELET, A. BIEBER, P. TUREK, J. LEMOIGNE, J. J. ANDRE,
Mol. Cryst. Liq. Cryst. 1997, 305, 55.
Neglect of exchange coupling at long distances
> 1.5 nm safe for nitroxides in proteins
Distance is computed from dipole-dipole coupling only
r [nm]
see also: C. RIPLINGER, J. P. Y. KAO, G. M. ROSEN, V. KATHIRVELU, G. R. EATON, S. S. EATON, A. KUTATELADZE, F. NEESE, J. Am. Chem. Soc. 2009, 131, 10092-10106.
44PCIV-Part2-EPRSpectroscopy
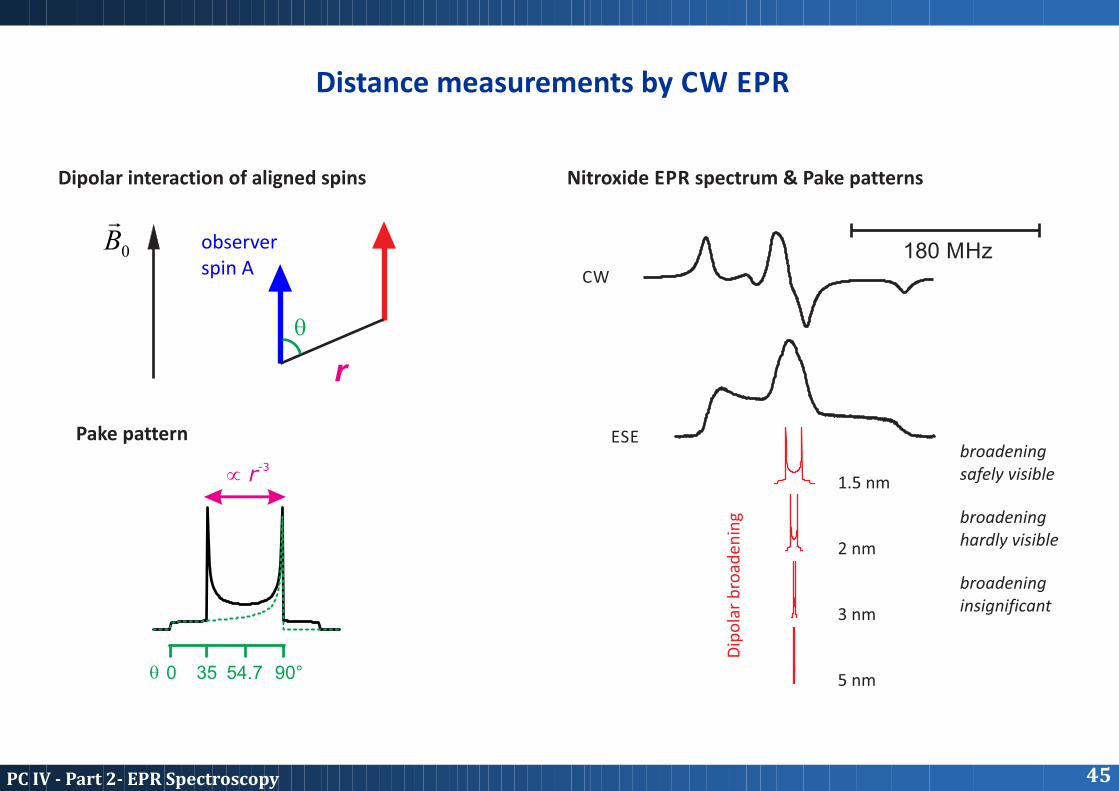
Distance measurements by CW EPR
r
0B
q
observer spin A
q 0 35 54.7 90°
-3µ r
Dipolar interaction of aligned spins Nitroxide EPR spectrum & Pake patterns
Pake pattern
180 MHzCW
ESE
Dip
ola
r b
road
enin
g
1.5 nm
2 nm
3 nm
5 nm
broadening safely visible
broadening hardly visible
broadening insignificant
45PCIV-Part2-EPRSpectroscopy
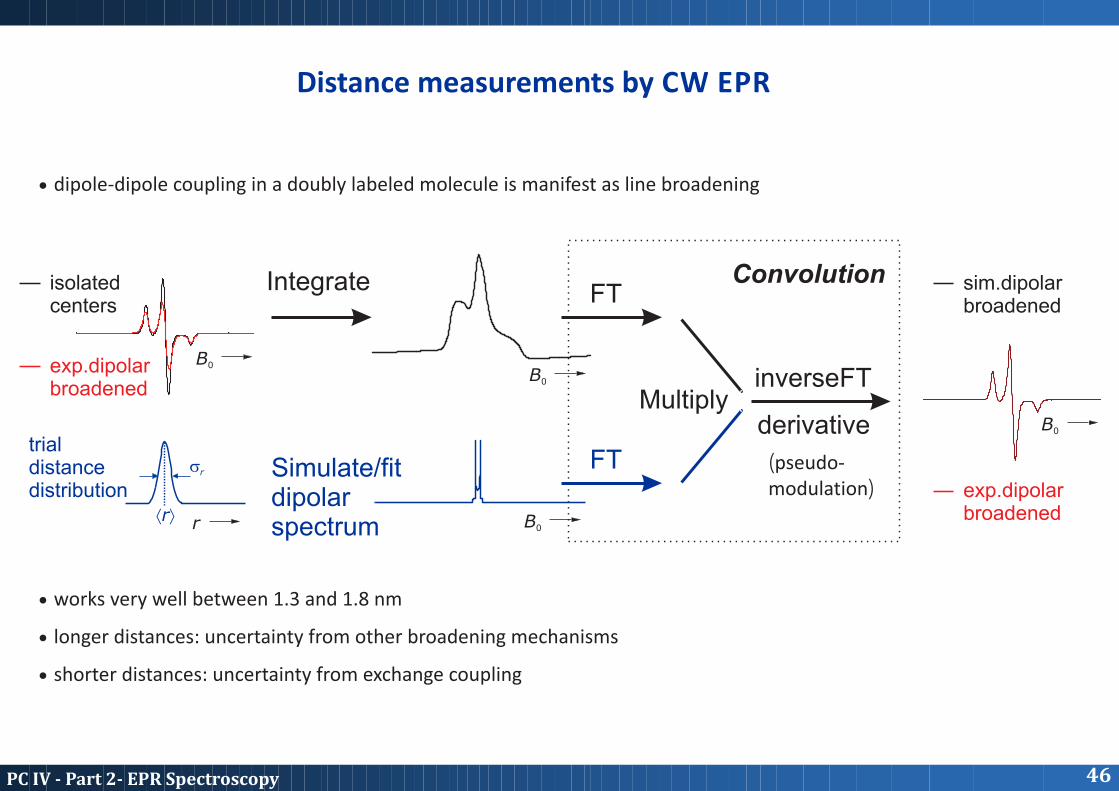
Distance measurements by CW EPR
· dipole-dipole coupling in a doubly labeled molecule is manifest as line broadening
· works very well between 1.3 and 1.8 nm
· longer distances: uncertainty from other broadening mechanisms
· shorter distances: uncertainty from exchange coupling
(pseudo-modulation)
46PCIV-Part2-EPRSpectroscopy
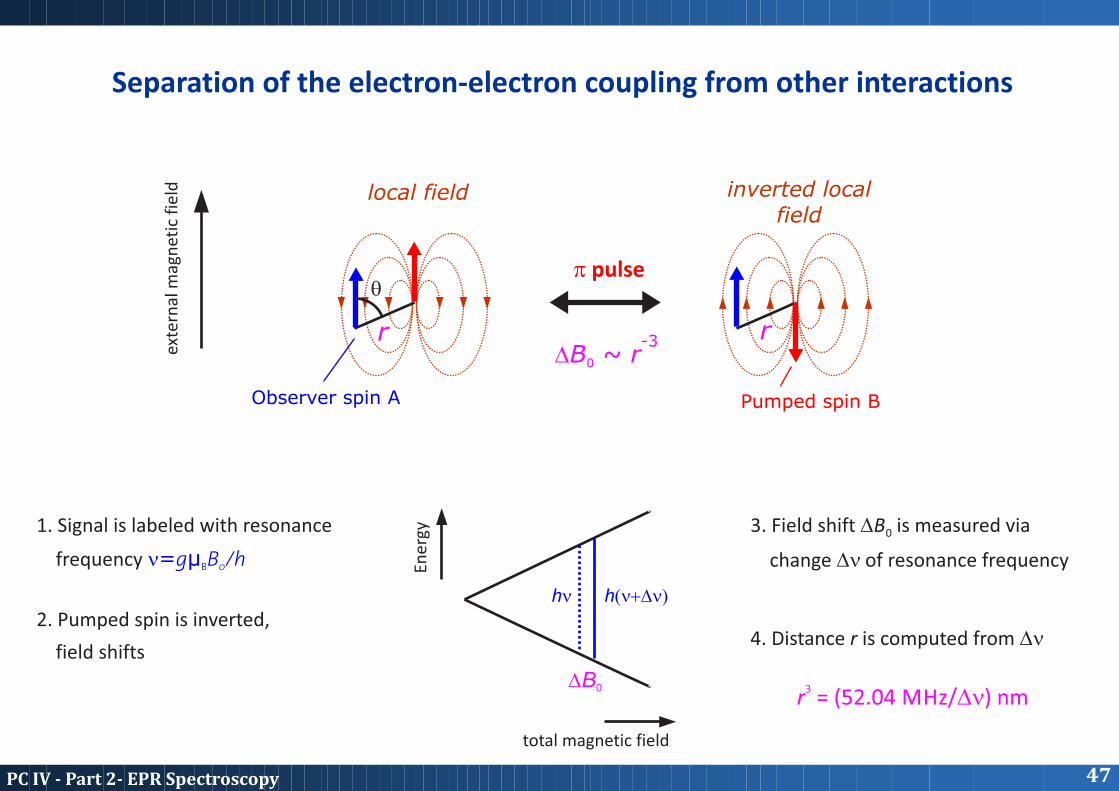
Separation of the electron-electron coupling from other interactions
Observer spin A Pumped spin B
local field inverted localfield
-3DB ~ r0
r r
3. Field shift DB is measured via 0
change Dn of resonance frequency
4. Distance r is computed from Dn
1. Signal is labeled with resonance
frequency n=gµ B /hB 0
2. Pumped spin is inverted,
field shifts
N
S
hn h(n+Dn)
DB0
p pulse
exte
rnal
mag
net
ic f
ield
Ener
gy
total magnetic field
3r = (52.04 MHz/Dn) nm
q
47PCIV-Part2-EPRSpectroscopy
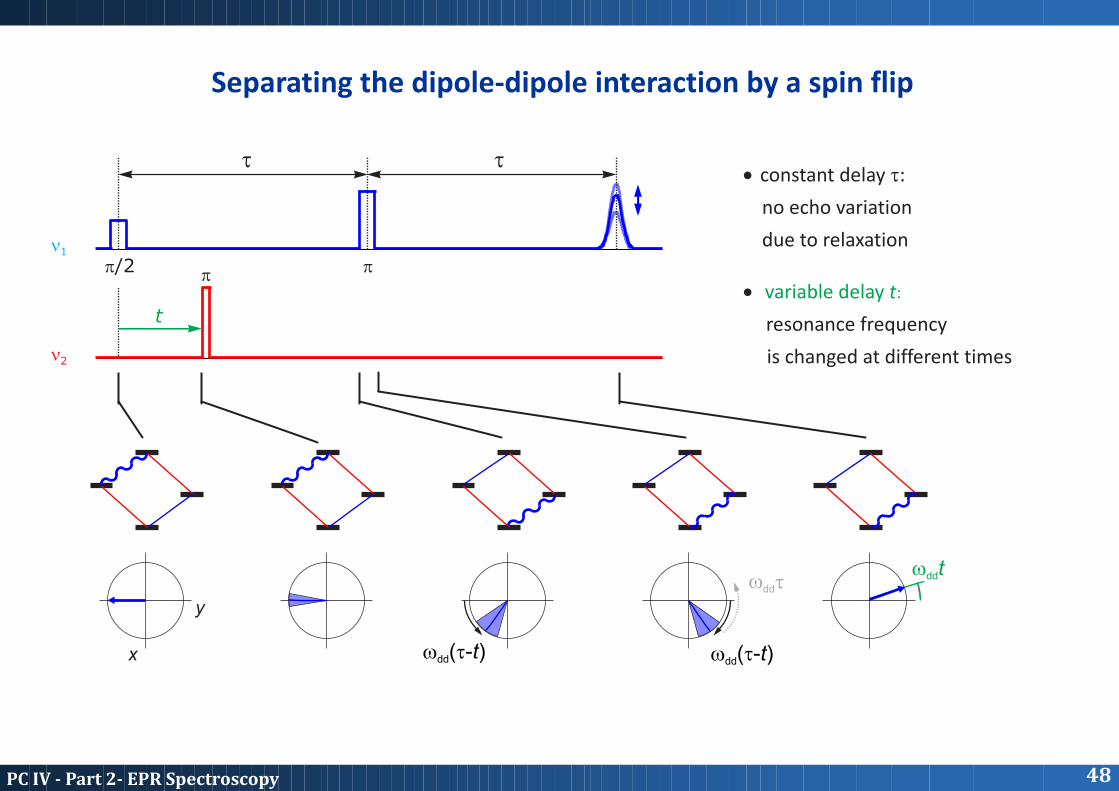
Separating the dipole-dipole interaction by a spin flip
t t
pp/2 p
n1
n2
t
· constant delay t:
no echo variation
due to relaxation
· variable delay t:
resonance frequency
is changed at different times
x
y
w (t-t)dd w (t-t)dd
w tdd
w tdd
48PCIV-Part2-EPRSpectroscopy
t t
p/2 p
p
t
wmw
wmw
(1)
(2)
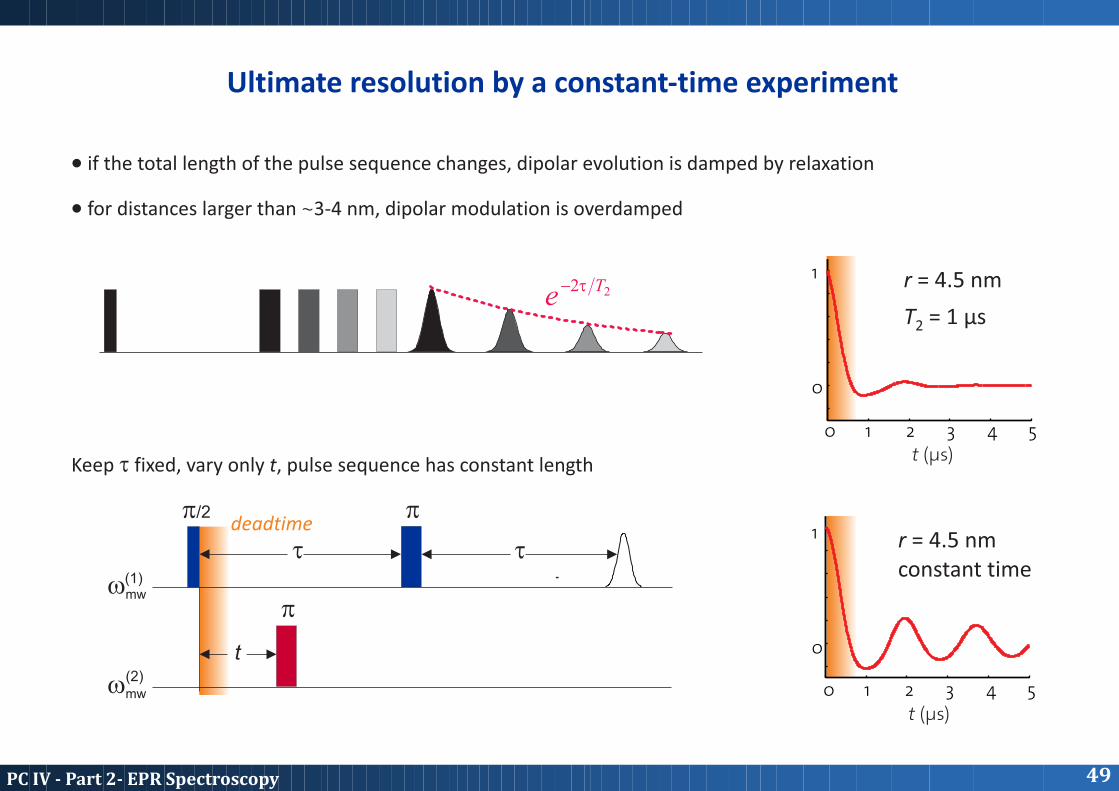
· if the total length of the pulse sequence changes, dipolar evolution is damped by relaxation
Keep t fixed, vary only t, pulse sequence has constant length
· for distances larger than ~3-4 nm, dipolar modulation is overdamped
22 Te t-
0
0
1
1
2
2
3
3
4
4
5
5
0
0
1
1
r = 4.5 nm
T = 1 µs2
r = 4.5 nmconstant time
t (µs)
t (µs)
deadtime
Ultimate resolution by a constant-time experiment
49PCIV-Part2-EPRSpectroscopy
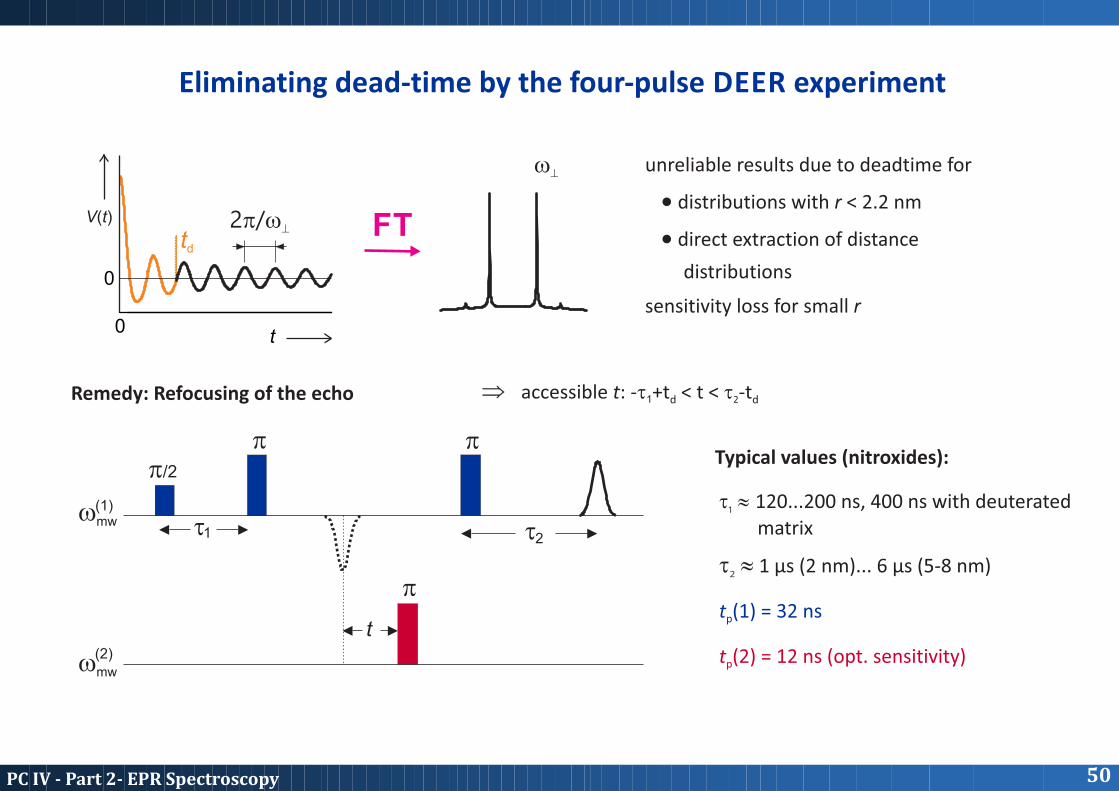
0
0
t
td
V(t) 2p/w^ FT
w^ unreliable results due to deadtime for
· distributions with r < 2.2 nm
· direct extraction of distance
distributions
sensitivity loss for small r
Remedy: Refocusing of the echo
p/2
p
p
p
t
t t1 2
wmw
wmw
(2)
(1)
accessible t: -t +t < t < t -t1 2d dÞ
Typical values (nitroxides):
t » 120...200 ns, 400 ns with deuterated1
matrix
t » 1 µs (2 nm)... 6 µs (5-8 nm)2
t (1) = 32 nsp
t (2) = 12 ns (opt. sensitivity)p
Eliminating dead-time by the four-pulse DEER experiment
50PCIV-Part2-EPRSpectroscopy
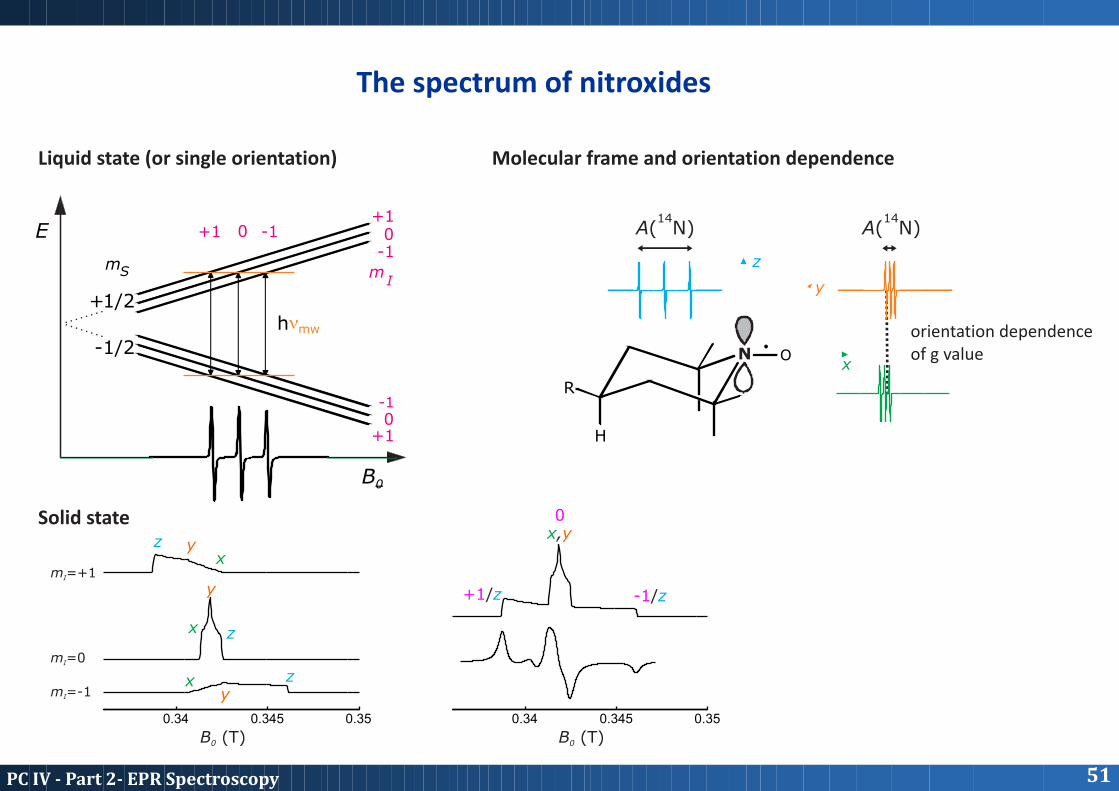
The spectrum of nitroxides
E
B0
+1/2
-1/2
hnmw
-10
+1
+1 0 -1+1
0-1
mS mI
Liquid state (or single orientation) Molecular frame and orientation dependence
Solid state
0.34 0.340.345 0.3450.35 0.35
m =-1I
m =0I
m =+1I
B (T)0 B (T)0
H
N
R
O.
z
y
x
14A( N)
14A( N)
orientation dependenceof g value
z
z
z
y
y
y
x
x
x
+1/z -1/z
0x,y
51PCIV-Part2-EPRSpectroscopy

Why can we excite two nitroxide labels with two frequencies?
pump (n )2
observe (n )1
B0
N NO
O
. .
B0
excitation bands
schematic spectra
· only for a fraction l of all spin pairs
of the the observed spin A coupled
spin B is indeed excited (pumped)
6.8 mT
H
N
R
O.
z
y
x
52PCIV-Part2-EPRSpectroscopy
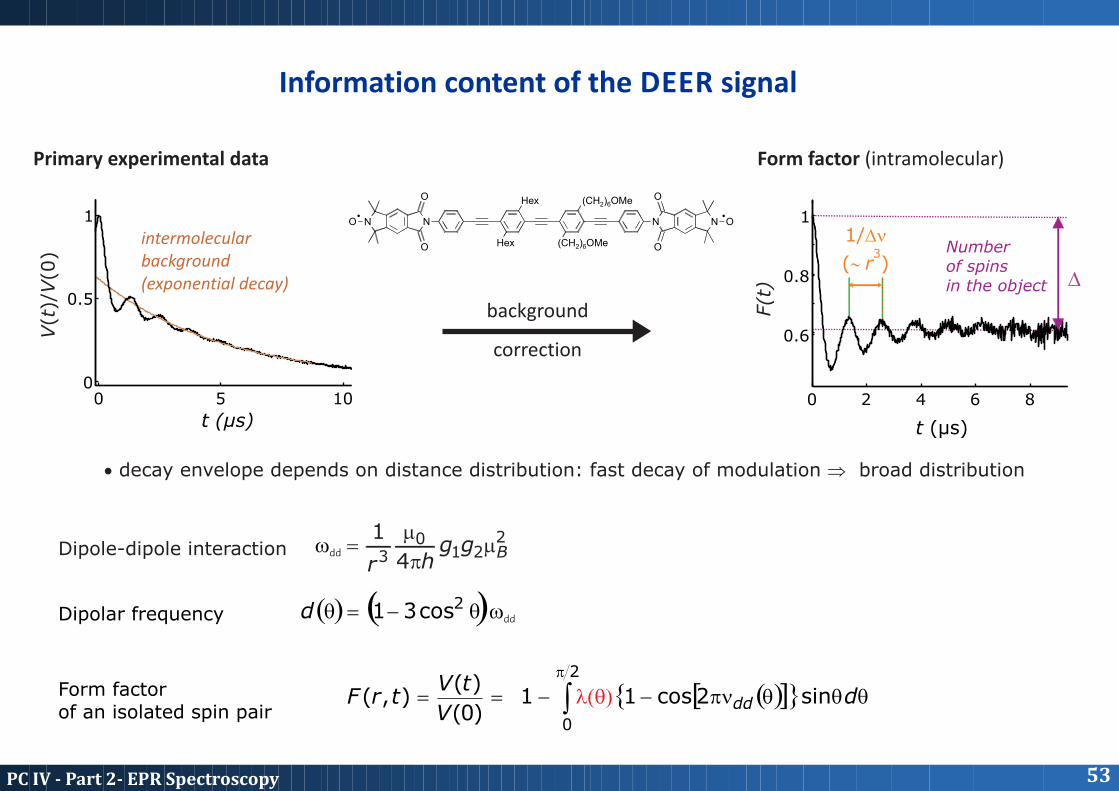
intermolecularbackground(exponential decay)
Numberof spinsin the object
1/Dn3
(~ r )
V(t
)/V(0
)
F(t
)
Primary experimental data Form factor (intramolecular)
background
correction
0 5 100
0.5
1
t (µs)0 2 4 6 8
0.6
0.8
1
t (µs)
Hex
Hex
NO•
N
O
O
N O•
N
O
O(CH2)6OMe
(CH2)6OMe
D
· decay envelope depends on distance distribution: fast decay of modulation Þ broad distribution
221
03 4
1Bgg
hrwdd m
p
m=Dipole-dipole interaction
Dipolar frequency wddq-=qd 2cos31
Form factorof an isolated spin pair
( )[ ]{ } qqqpn-l(q)-== òp
dV
tVtrF dd sin2cos11
)0(
)(),(
2
0
Information content of the DEER signal
53PCIV-Part2-EPRSpectroscopy
0 1 2 3
0.4
0.6
0.8
1
t (µs)
V'(
t)/V
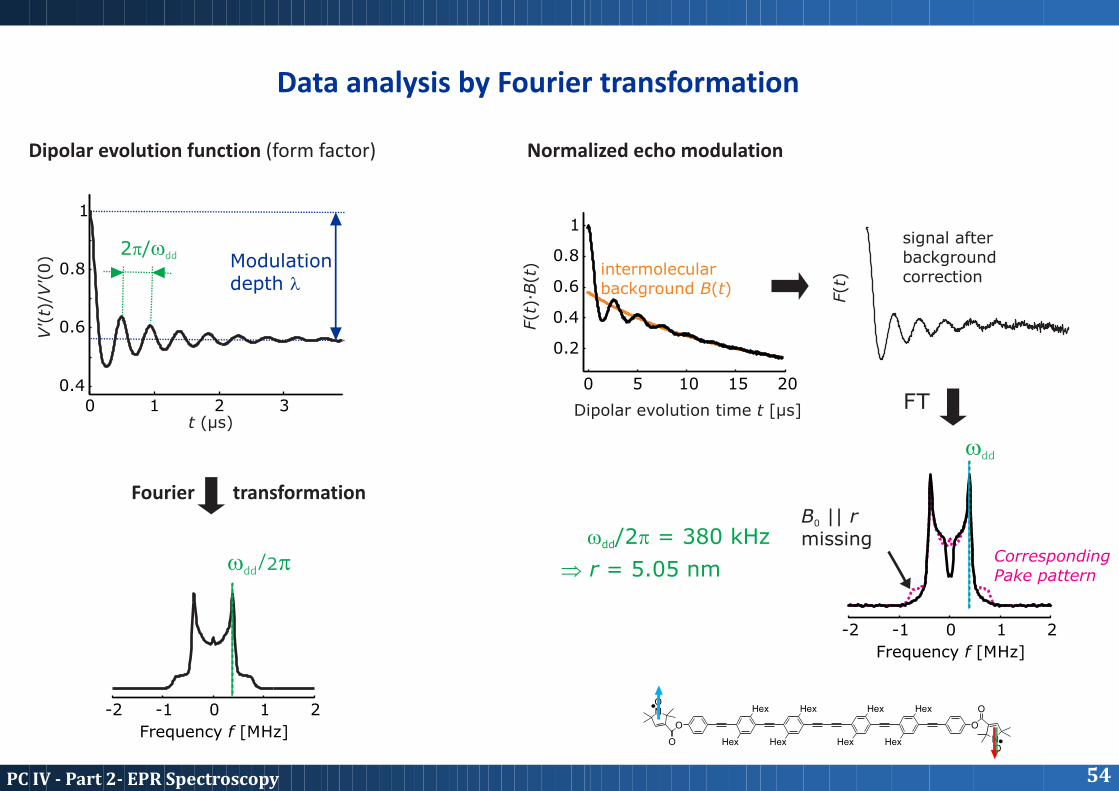
'(0) Modulation
depth l
2p/wdd
-2 -1 0 1 2
Frequency f [MHz]
Fourier
FT
transformation
w /2pdd
wdd
Normalized echo modulationDipolar evolution function (form factor)
0 5 10 15 20
0.2
0.4
0.6
0.8
1
intermolecularbackground B(t)
signal afterbackgroundcorrection
Dipolar evolution time t [µs]
F(t
)·B(t
)
F(t
)
-2 -1 0 1 2
Frequency f [MHz]
CorrespondingPake pattern
B || r0
missing w /2p = 380 kHz dd
Þ r = 5.05 nm
Hex
Hex
O
O
NO
O
O
NO
Hex
Hex
Hex
Hex
Hex
Hex
Data analysis by Fourier transformation
54PCIV-Part2-EPRSpectroscopy
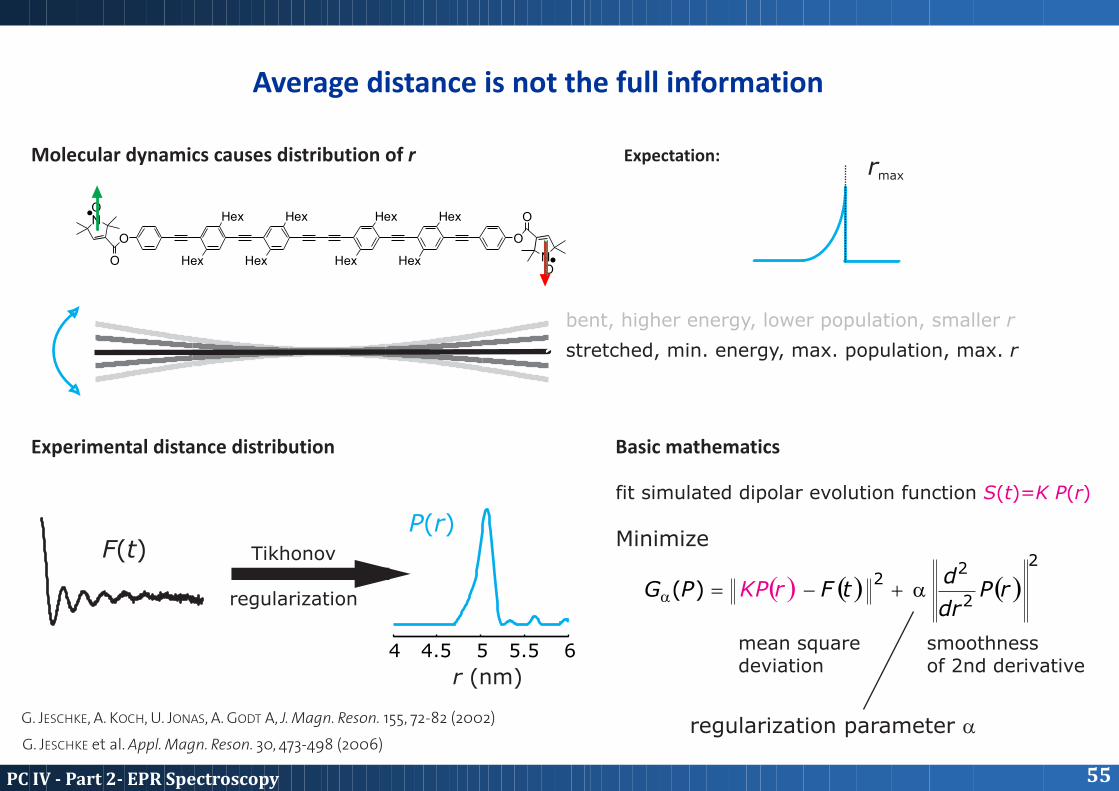
Average distance is not the full information
G. JESCHKE, A. KOCH, U. JONAS, A. GODT A, J. Magn. Reson. 155, 72-82 (2002)
G. JESCHKE et al. Appl. Magn. Reson. 30, 473-498 (2006)
Hex
Hex
O
O
NO
O
O
NO
Hex
Hex
Hex
Hex
Hex
Hex
Molecular dynamics causes distribution of r
Experimental distance distribution Basic mathematics
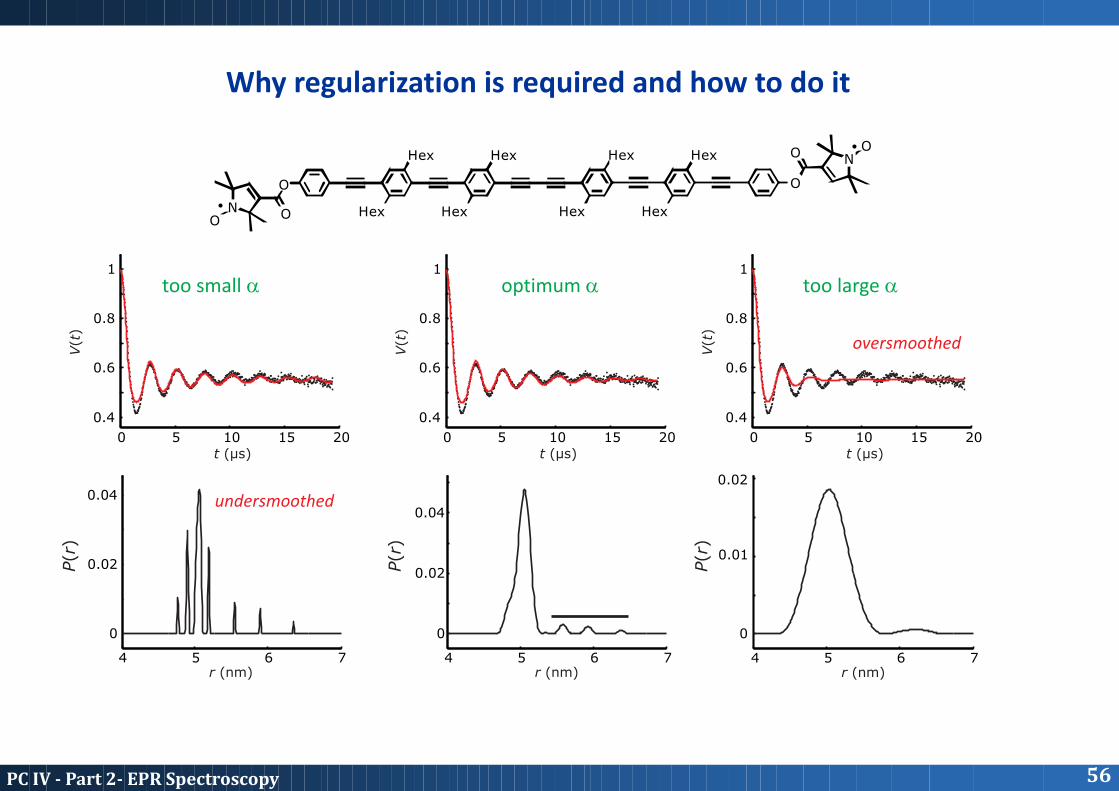
stretched, min. energy, max. population, max. r
bent, higher energy, lower population, smaller r
Expectation:rmax
4 4.5 5 5.5 6
r (nm)
Tikhonov
regularization
F(t)P(r)
fit simulated dipolar evolution function S(t)=K P(r)
Minimize
( ) ( ) ( )2
2
22
)( rPdr
dtFrKPPG a+-=a
mean squaredeviation
smoothnessof 2nd derivative
regularization parameter a
55PCIV-Part2-EPRSpectroscopy
0
0.02
0.04
0
0.01
0.02
4 4 45 5 56 6 67 7 7
0
0.02
0.04
0 5 10 15 20
0.4
0.6
0.8
1
t (µs)
V(t
)
0 5 10 15 20
0.4
0.6
0.8
1
t (µs)
V(t
)
0 5 10 15 20
0.4
0.6
0.8
1
t (µs)
V(t
)
P(r
)
P(r
)
P(r
)
r (nm) r (nm) r (nm)
HH ee xx
HH ee xx H He ex x
H He ex x
O
O NO
O
ONO•
•
oversmoothed
undersmoothed
Why regularization is required and how to do it
too small a optimum a too large a
56PCIV-Part2-EPRSpectroscopy
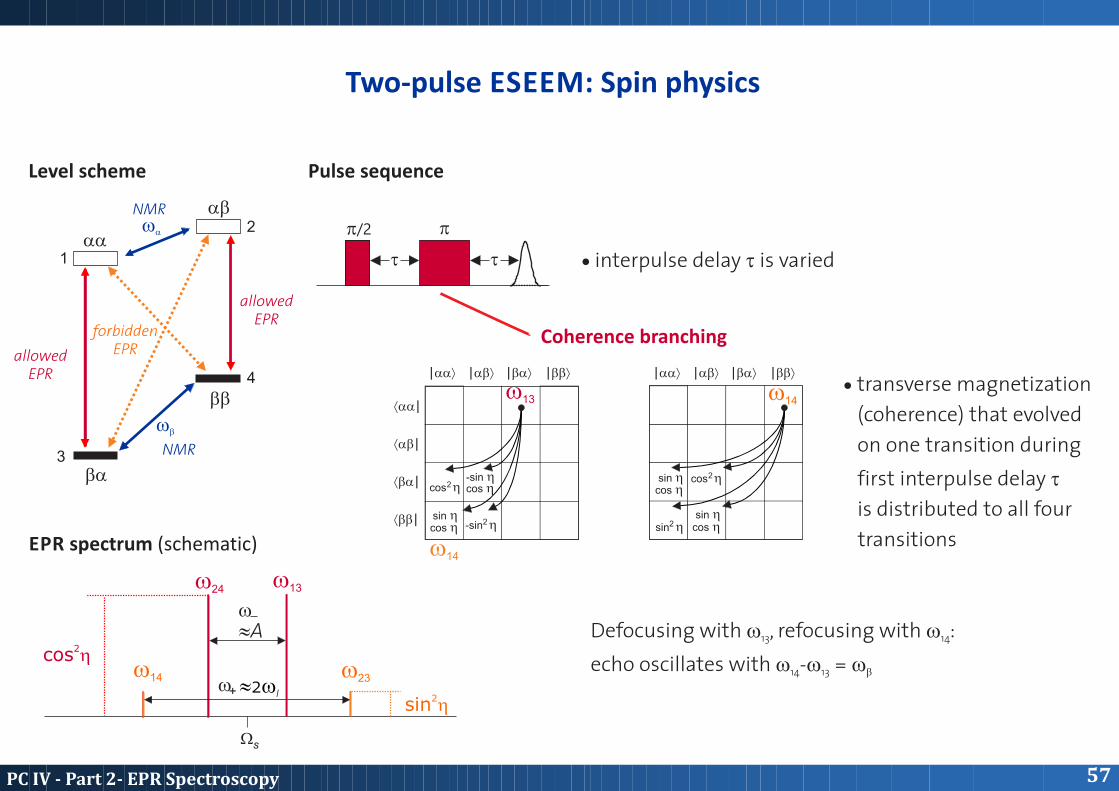
Two-pulse ESEEM: Spin physics
w14
p/2 p
t t
Level scheme Pulse sequence
Coherence branching
· interpulse delay t is varied
· transverse magnetization
(coherence) that evolved
on one transition during
first interpulse delay t
is distributed to all four
transitions
cos h
cos h
-sin h
cos h-sin h
sin h2
2
|aañ
áaa|
áab|
ába|
ább|
|abñ |bañ |bbñ
w13
cos hcos h
cos hsin hsin h
sin h
2
2
|aañ |abñ |bañ |bbñ
w14
Defocusing with w , refocusing with w :13 14
echo oscillates with w -w = w14 13 b
57PCIV-Part2-EPRSpectroscopy
1
2
3
4
wa
wb
aa
ab
ba
bb
NMR
NMR
allowedEPR
allowedEPR
forbiddenEPR
w24 w13
w14 w23
w
w
Ws
+
2cos h
2sin h
EPR spectrum (schematic)
»A
»2wI
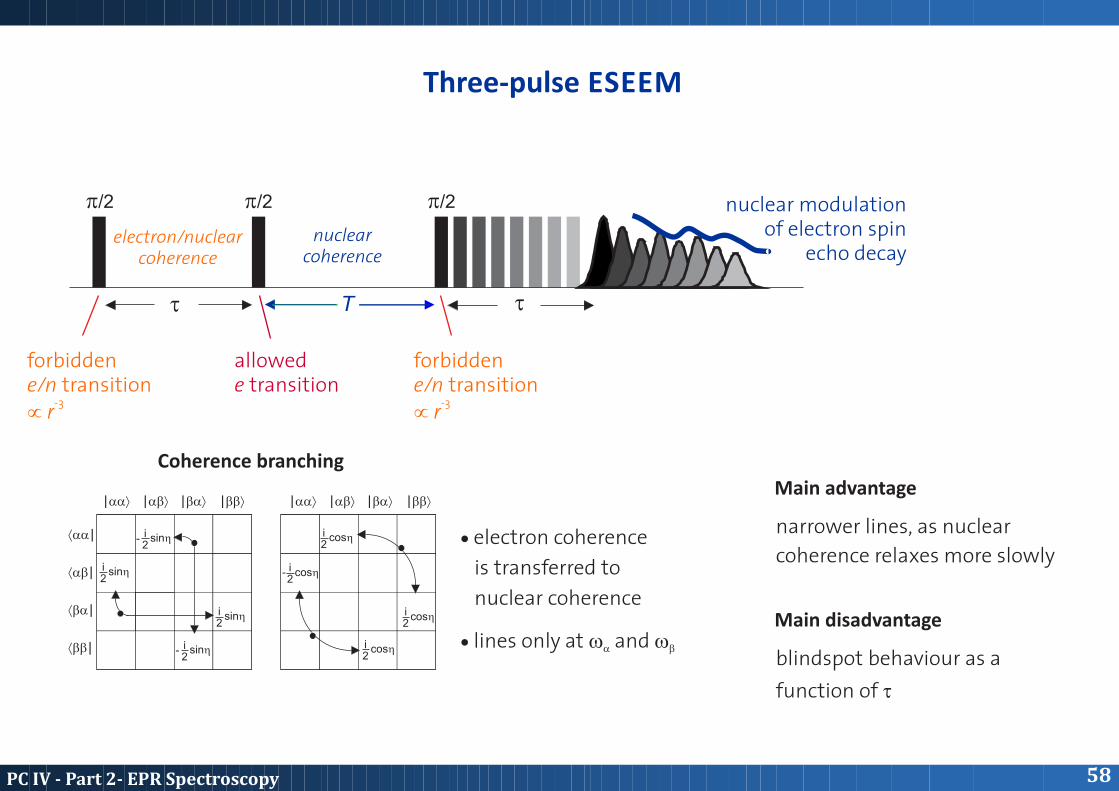
Three-pulse ESEEM
p/2 p/2 p/2
t tT
nuclear modulation of electron spin
echo decaynuclear
coherenceelectron/nuclear
coherence
forbiddene/n transition
-3µ r
forbiddene/n transition
-3µ r
allowede transition
|aañ
áaa|
áab|
ába|
ább|
|aañ|abñ |abñ|bañ |bañ|bbñ |bbñ
cosh
cosh
cosh
sinh
coshi2
i2
sinh
sinh
i2
i2
i2
i2
-
i2
-
sinhi2
-
Coherence branching
· electron coherence
is transferred to
nuclear coherence
· lines only at w and wa b
Main advantage
Main disadvantage
narrower lines, as nuclear
coherence relaxes more slowly
blindspot behaviour as a
function of t
58PCIV-Part2-EPRSpectroscopy
1PCIV-Part2-EPRSpectroscopy
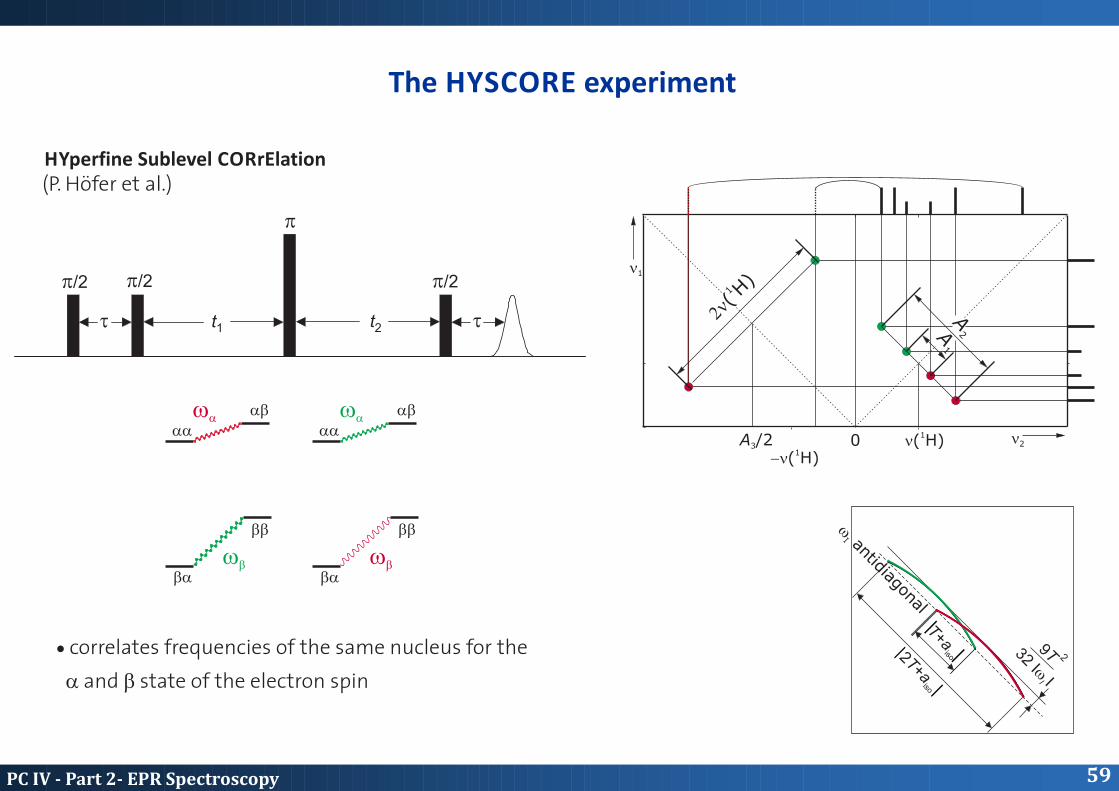
1n( H)1
-n( H)0
n1
1
2n(H)
A /23
p/2 p/2 p/2
p
t tt1 t2
wa wa
wb wb
aa aa
ab ab
ba ba
bb bb
A1
A2
n2
2T+aiso
T+aiso
9T32 IwII
2
w antidiagonal
I
The HYSCORE experiment
HYperfine Sublevel CORrElation(P. Höfer et al.)
· correlates frequencies of the same nucleus for the
a and b state of the electron spin
59PCIV-Part2-EPRSpectroscopy
60PCIV-Part2-EPRSpectroscopy
-30 -20 -10 0 10 20 300
10
20
30
-30 -20 -10 0 10 20 300
10
20
30
n2 /MHz
n2 /MHz
n1 / MHz
n1 / MHz
gz
Ni
OGlna‘147
Hg
Hg
Hg Hb1
Hg Hb2
SO
SO
3
3
-
-
N
N
N
NNi
NN
NN
Nin+
HN
H2NOC
H3C
–OOC
O
CH3
COO–
COO–
COO–
–OOC
O
H
H
O
H2NGln
a'147F430
gb
aBr
13C
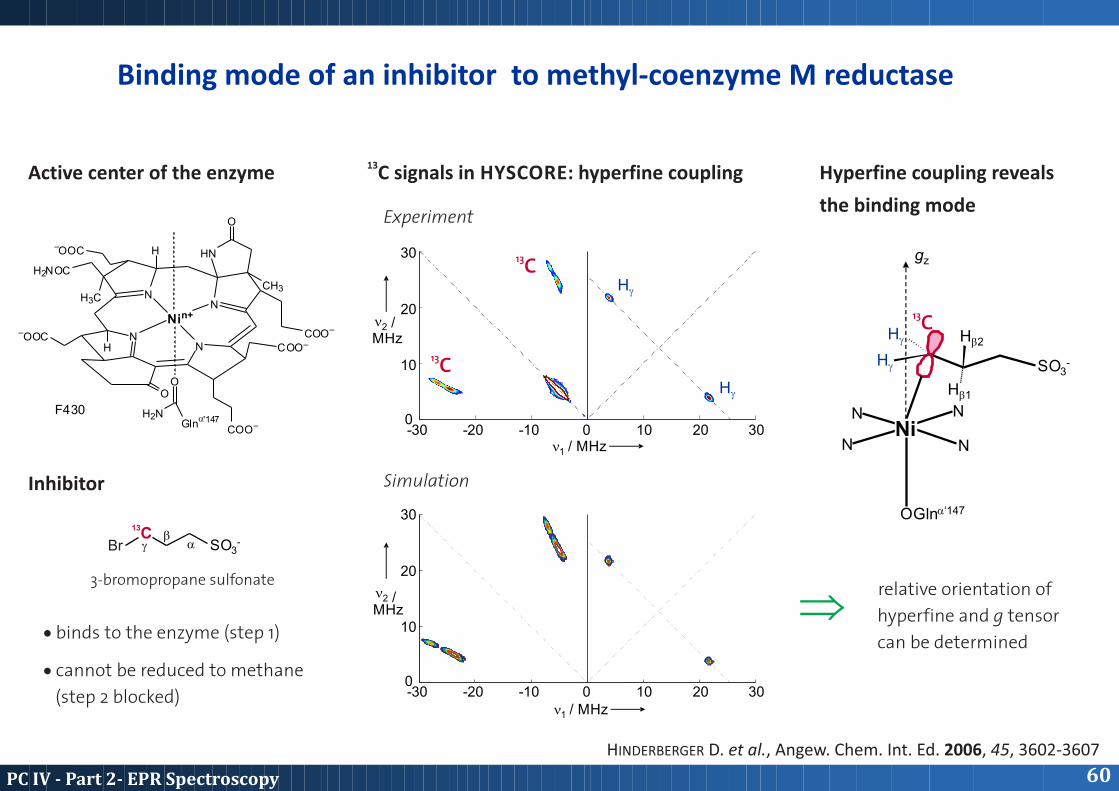
HINDERBERGER D. et al., Angew. Chem. Int. Ed. 2006, 45, 3602-3607
Binding mode of an inhibitor to methyl-coenzyme M reductase
3-bromopropane sulfonate
Active center of the enzyme 13C signals in HYSCORE: hyperfine coupling Hyperfine coupling reveals
the binding mode
Inhibitor
· binds to the enzyme (step 1)
relative orientation of
hyperfine and g tensor
can be determined
· cannot be reduced to methane
(step 2 blocked)
Experiment
Simulation
13C
13C
13C
Þ

EPR- the little big sister of NMR
The little sister
chemical bonding is electron pairing, spins compensate
EPR signals Û Chemical reactivity
Defect-based function of solid-state materials
The world of NMR
The world of EPR
· radical reactions
· color centres
· transition metal catalysis
· semiconductors
· metalloproteins
· electron transfer reactions (e.g. photosynthesis)
· conducting polymers
accessible byspin labeling
N OS
S
O
O
H3C
MTSSL
61PCIV-Part2-EPRSpectroscopy
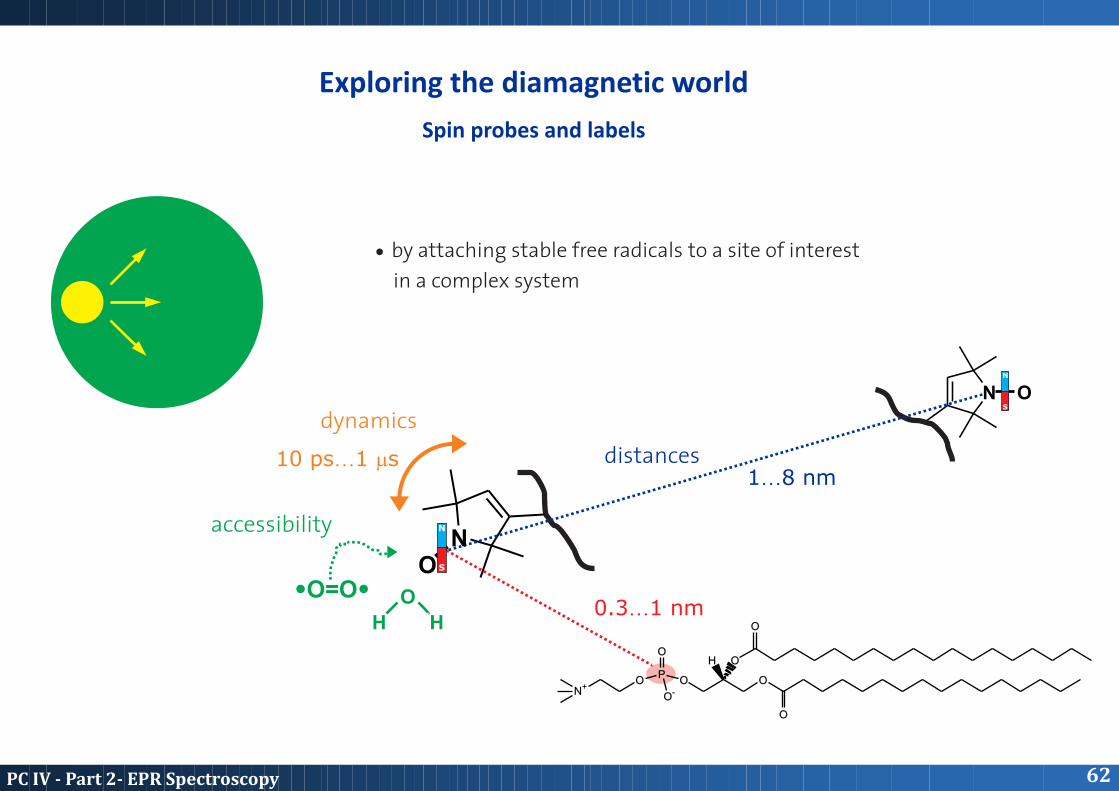
Exploring the diamagnetic world
Spin probes and labels
O
distances
·O=O·
accessibility
dynamics
N
S
NO
N
S
N
1¼8 nm10 ps¼1 ms
0.3¼1 nmO
H H
N+O
O
O
O
O
P
O-
O
O
H
· by attaching stable free radicals to a site of interest
in a complex system
62PCIV-Part2-EPRSpectroscopy
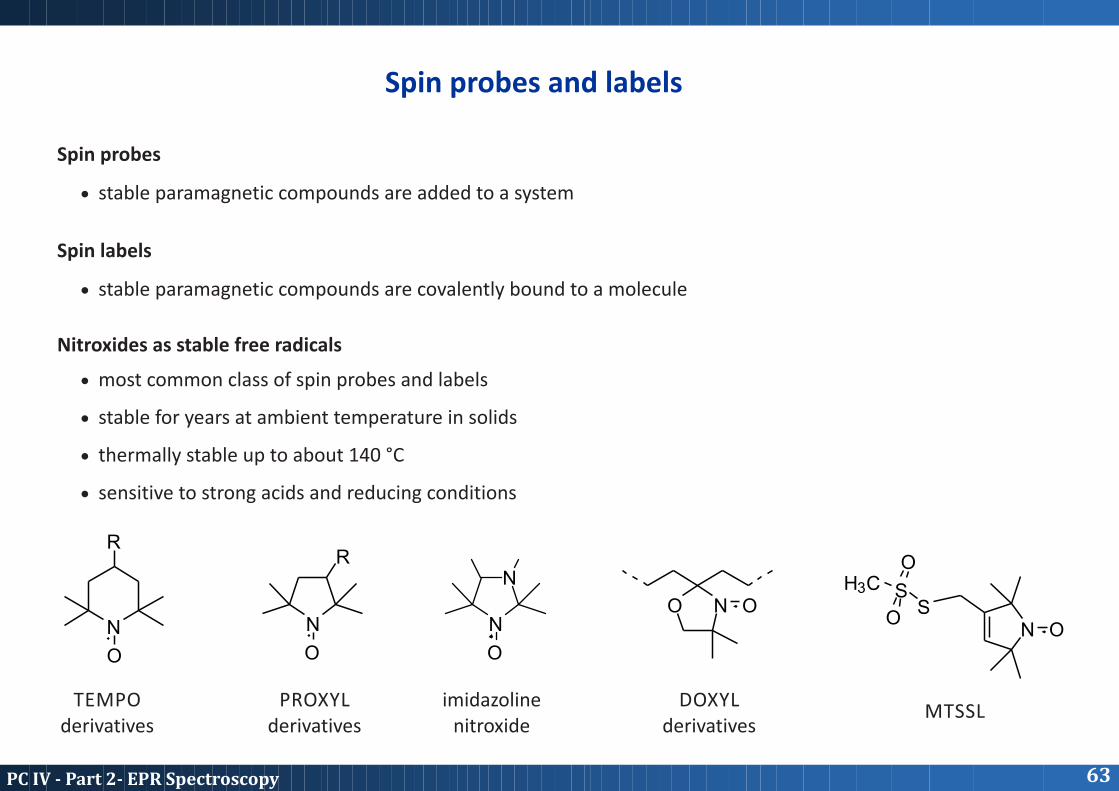
Spin probes and labels
Spin probes
Spin labels
Nitroxides as stable free radicals
· stable paramagnetic compounds are added to a system
· stable paramagnetic compounds are covalently bound to a molecule
· most common class of spin probes and labels
· stable for years at ambient temperature in solids
· thermally stable up to about 140 °C
· sensitive to strong acids and reducing conditions
N
O
R
N
O
R
N
N
O
TEMPOderivatives
PROXYLderivatives
imidazolinenitroxide
O N ON O
SS
O
O
H3C
DOXYLderivatives
MTSSL
63PCIV-Part2-EPRSpectroscopy
64PCIV-Part2-EPRSpectroscopy
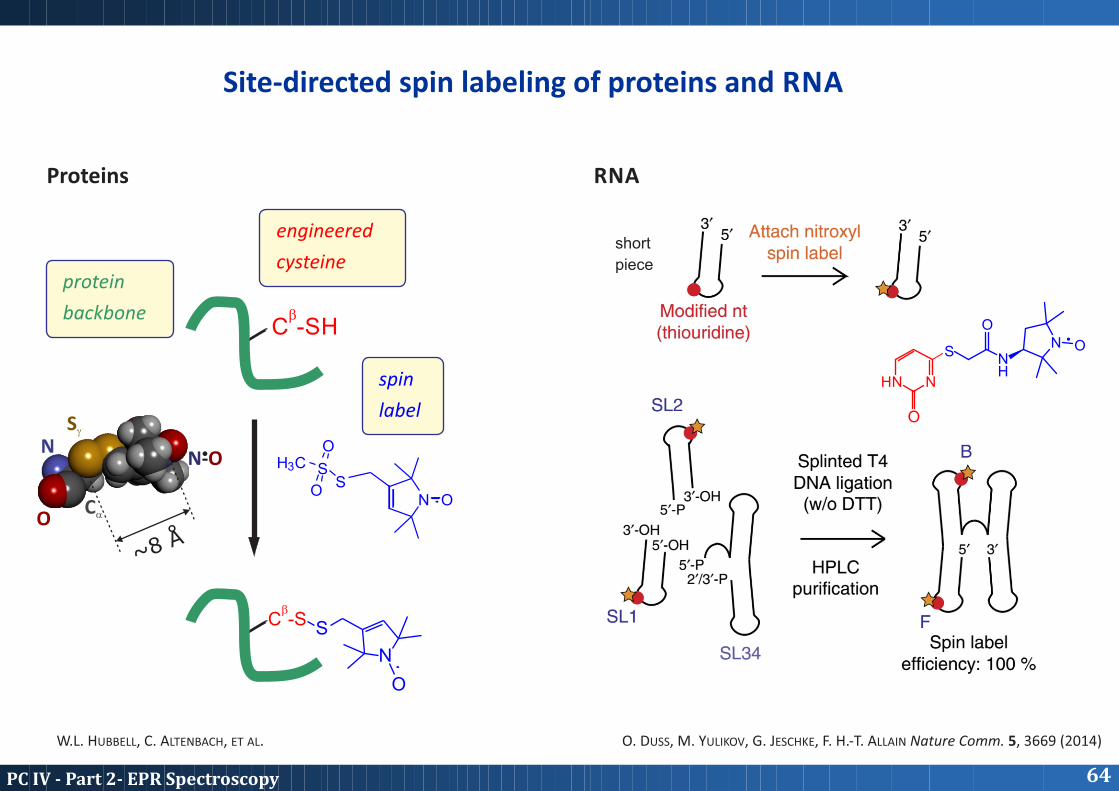
Site-directed spin labeling of proteins and RNA
~8 Å
bC -SH
bC -S
N OS
S
O
O
H3C
S
O
N
protein
backbone
engineered
cysteine
spin
label
Proteins RNA
O
HN N
S
O
NH
N O·
O. DUSS, M. YULIKOV, G. JESCHKE, F. H.-T. ALLAIN Nature Comm. 5, 3669 (2014)W.L. HUBBELL, C. ALTENBACH, ET AL.
short
piece
NSg
CaO
N-O·
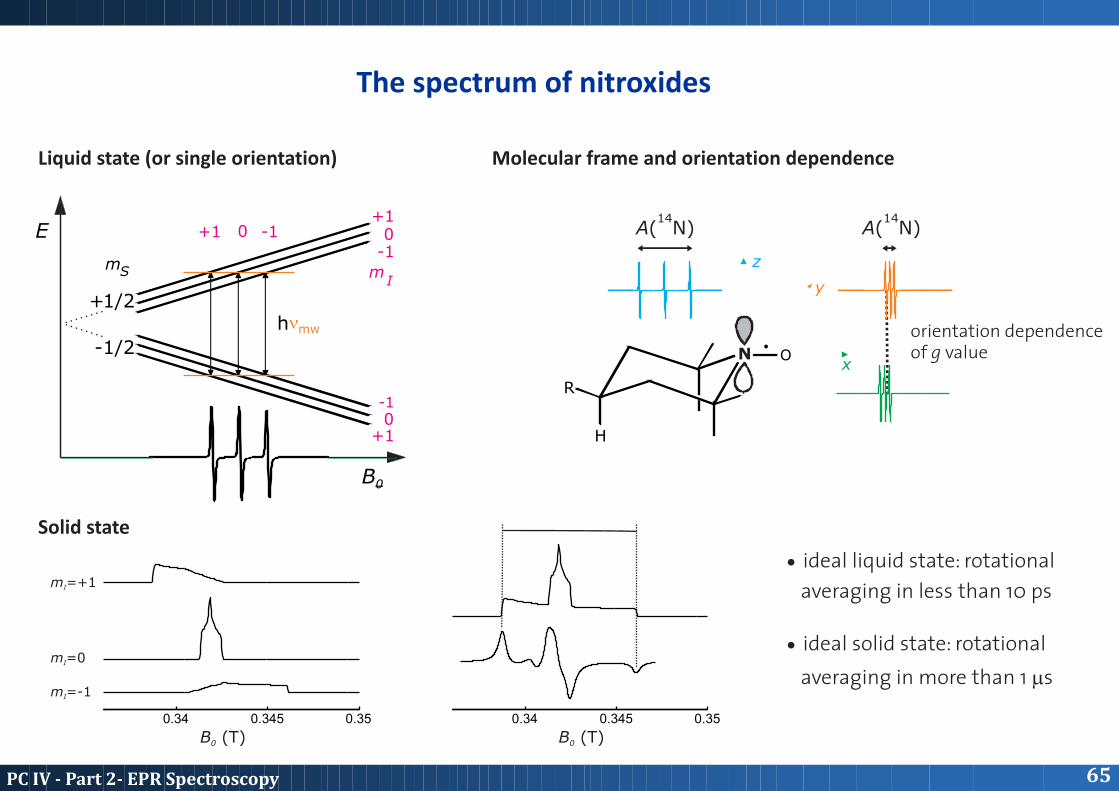
The spectrum of nitroxides
E
B0
+1/2
-1/2
hnmw
-10
+1
+1 0 -1+1
0-1
mS mI
Liquid state (or single orientation) Molecular frame and orientation dependence
Solid state
0.34 0.340.345 0.3450.35 0.35
m =-1I
m =0I
m =+1I
B (T)0 B (T)0
H
N
R
O.
z
y
x
14A( N)
14A( N)
orientation dependenceof g value
· ideal liquid state: rotational
averaging in less than 10 ps
· ideal solid state: rotational
averaging in more than 1 ms
65PCIV-Part2-EPRSpectroscopy
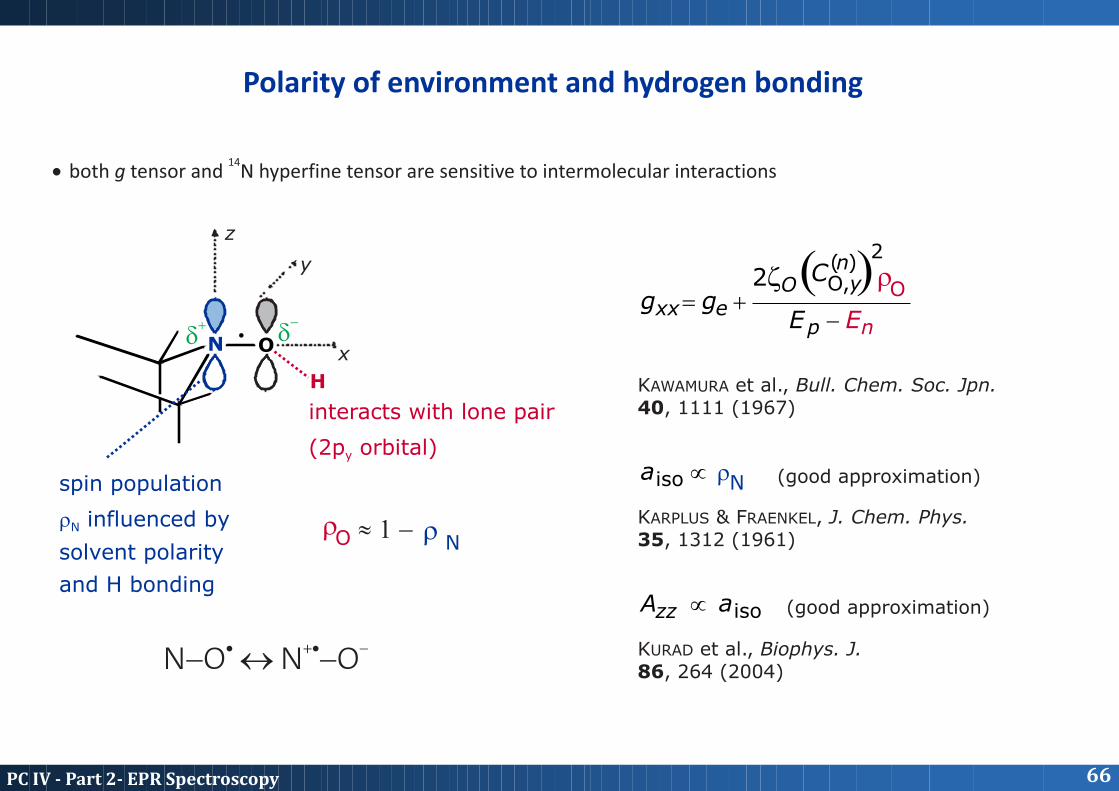
14· both g tensor and N hyperfine tensor are sensitive to intermolecular interactions
N O.
z
y
x
H
interacts with lone pair
(2p orbital)y
spin population
r influenced byN
solvent polarity
and H bonding
( )
np
O
nyOO
e
N
xx
iso
isozz
EE
Cg
r
g
a
aA
-
rz+=
µ
µ
2
2 ,
KAWAMURA et al., Bull. Chem. Soc. Jpn.40, 1111 (1967)
KARPLUS & FRAENKEL, J. Chem. Phys.35, 1312 (1961)
KURAD et al., Biophys. J.86, 264 (2004)
-d+
d
(good approximation)
(good approximation)
O Nr r» 1 -
Polarity of environment and hydrogen bonding
· +· -N-O « N -O
66PCIV-Part2-EPRSpectroscopy
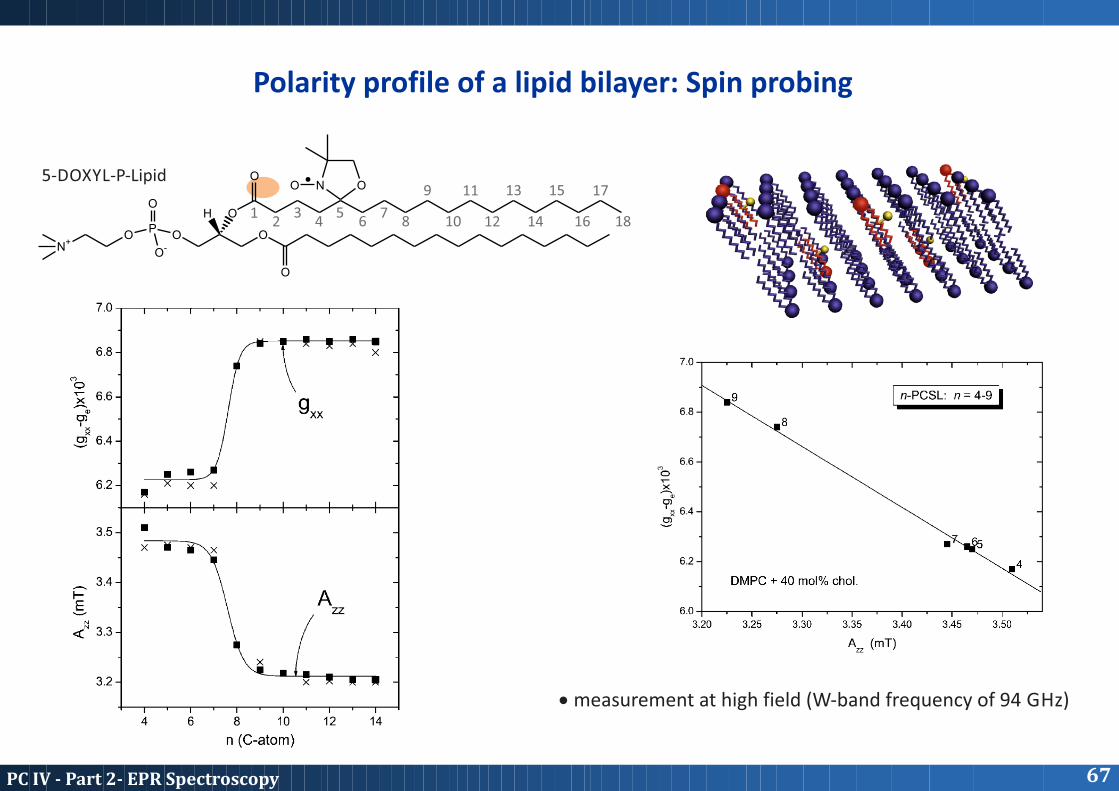
Polarity profile of a lipid bilayer: Spin probing
N+O
O
O
O
O
P
O-
O
O
H
NO O5-DOXYL-P-Lipid
· measurement at high field (W-band frequency of 94 GHz)
67PCIV-Part2-EPRSpectroscopy
12
34
56
78
9 11
12
13
14
15 17
181610
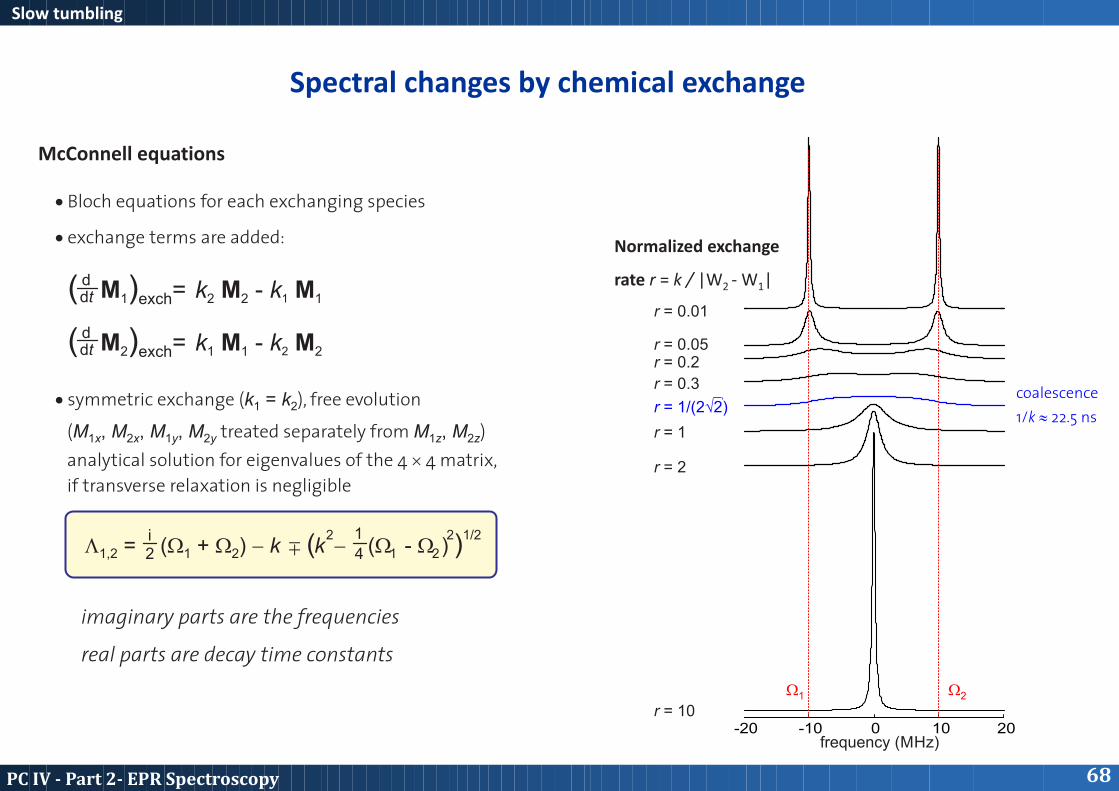
Spectral changes by chemical exchange
Slow tumbling
McConnell equations
· Bloch equations for each exchanging species
· exchange terms are added:
· symmetric exchange (k = k ), free evolution1 2
(M , M , M , M treated separately from M , M )1x 2x 1y 2y 1z 2z
analytical solution for eigenvalues of the 4 ´ 4 matrix,
if transverse relaxation is negligible
d( M ) = k M - k Mdt 11 2 2 1exch
d( M ) = k M - k Mdt 22 1 1 2exch
12 2 1/2i ±L = (W + W ) - k ( k - ( W - W ) )1,2 1 2 1 22 4
imaginary parts are the frequencies
real parts are decay time constants
-20 -10 0 10 20frequency (MHz)
Normalized exchange
rate r = k / |W - W |2 1
r = 10
r = 2
r = 1
r = 1/(2Ö2)
r = 0.3
r = 0.2r = 0.05
r = 0.01
coalescence
1/k » 22.5 ns
W1 W2
68PCIV-Part2-EPRSpectroscopy
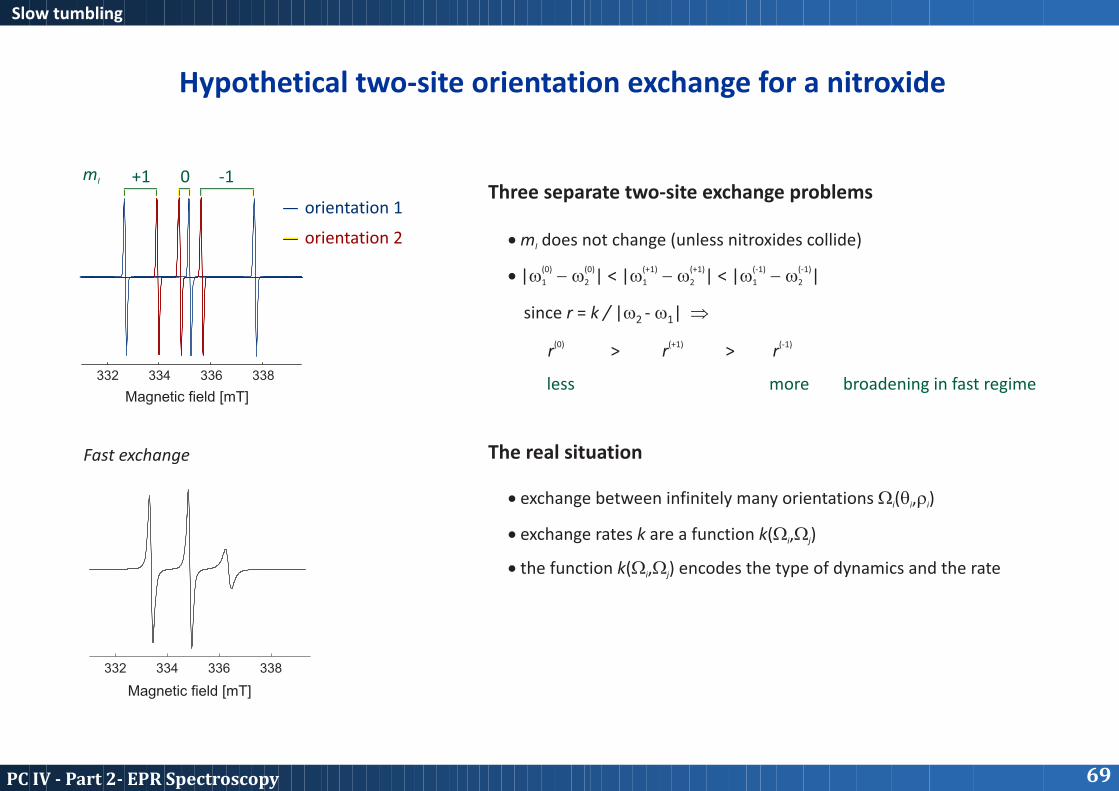
Hypothetical two-site orientation exchange for a nitroxide
332 334 336 338
Magnetic field [mT]
Magnetic field [mT]
+1 0 -1mI
orientation 1
orientation 2 · m does not change (unless nitroxides collide)I
· exchange between infinitely many orientations W (q ,r )i i i
(0) (0) (+1) (+1) (-1) (-1)· |w - w | < |w - w | < |w - w |1 2 1 2 1 2
· exchange rates k are a function k(W ,W ) i j
· the function k(W ,W ) encodes the type of dynamics and the rate i j
(0) (+1) (-1)r > r > r
Three separate two-site exchange problems
The real situation
less more broadening in fast regime
332 334 336 338
Fast exchange
since r = k / |w - w | Þ2 1
Slow tumbling
69PCIV-Part2-EPRSpectroscopy
70PCIV-Part2-EPRSpectroscopy
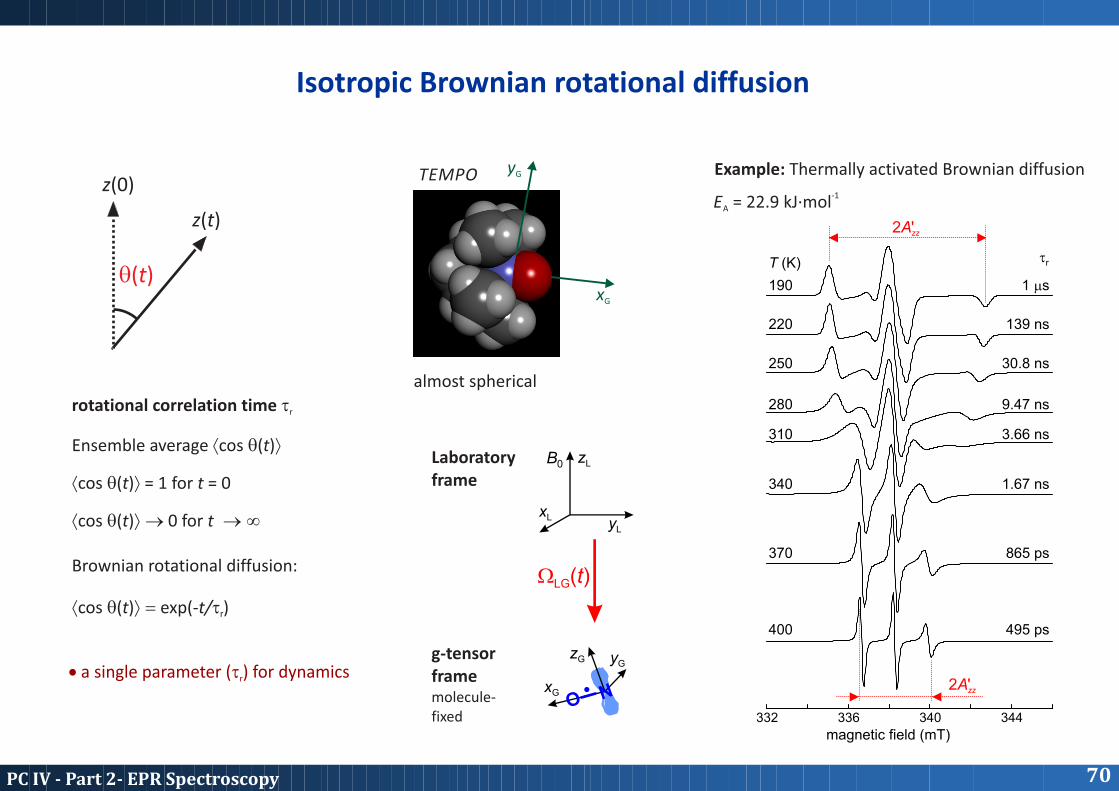
Isotropic Brownian rotational diffusion
2A'zz
2A'zz
magnetic field (mT)332 336 340 344
T (K) tr
400
370
340
310
280
250
220
190
495 ps
865 ps
1.67 ns
3.66 ns
9.47 ns
30.8 ns
139 ns
1 ms
-1E = 22.9 kJ·molA
z(0)
z(t)
q(t)
Ensemble average ácos q(t)ñ
ácos q(t)ñ = 1 for t = 0
ácos q(t)ñ ® 0 for t ® ¥
ácos q(t)ñ = exp(-t/t )r
Brownian rotational diffusion:
rotational correlation time tr
· a single parameter (t ) for dynamicsr
Example: Thermally activated Brownian diffusionTEMPO
xG
yG
almost spherical
B0 zL
zG
xL
xG
yL
yG
NO.
W (t)LG
Laboratoryframe
g-tensor framemolecule-fixed

71PCIV-Part2-EPRSpectroscopy
Anisotropic Brownian rotational diffusion
z
x
y
fast rotationR||
slowrotation
R^
5-Doxyl-stearic acid
O
OHO N O
prolate rotor
B0 zL
zMzG
xL
yM
xG
yL
xM
yG
N NO O. .
W (t)LM
WMG
Laboratoryframe
g-tensor framemolecule-fixed
nitroxide diffusionframe
molecule-fixed
· in general, six parameters for dynamics
3 diffusion tensor principal values
3 Euler angles a , b , gMG MG MG
· often reduced to two parameters
R = 1/6t , R = 1/6t|| || ^ ^
at known a , b , gMG MG MG
332 334 336 338
magnetic field (mT)
Assumption: t = 5 t^ ||
3 2t = Öt tr ^ ||
free tumbling in solution
tr
495 ps
865 ps
1.67 ns
3.66 ns
9.47 ns
30.8 ns
139 ns
1 ms
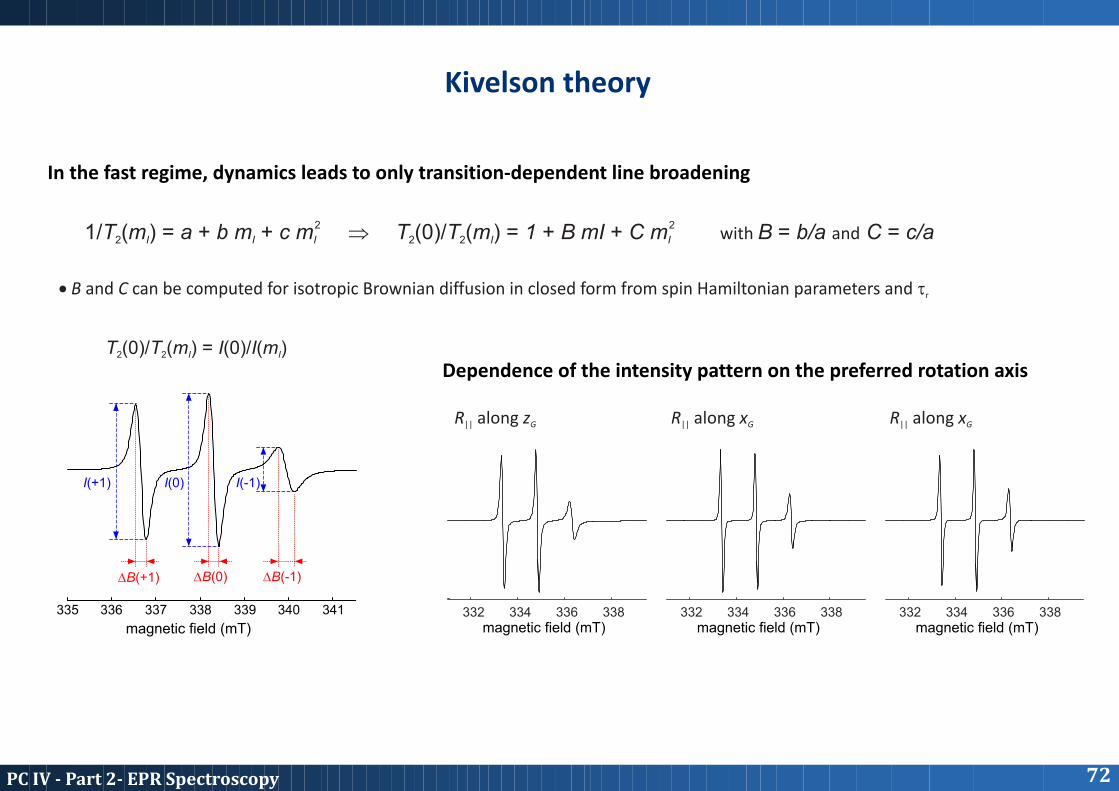
Kivelson theory
In the fast regime, dynamics leads to only transition-dependent line broadening
21/T (m ) = a + b m + c m2 I I I
2T (0)/T (m ) = 1 + B mI + C m2 2 I I with B = b/a and C = c/aÞ
· B and C can be computed for isotropic Brownian diffusion in closed form from spin Hamiltonian parameters and tr
magnetic field (mT)
336 337 338 339 340 341
DB(+1)
I(+1) I(0) I(-1)
DB(0) DB(-1)
335
T (0)/T (m ) = I(0)/I(m )2 2 I I
332 334 336 338magnetic field (mT) magnetic field (mT) magnetic field (mT)
Dependence of the intensity pattern on the preferred rotation axis
R along z|| G R along x|| G R along x|| G
332 332334 334336 336338 338
72PCIV-Part2-EPRSpectroscopy

Extrema separation
200 250 300 350 4003
4
5
6
7
8
temperature (K)
5 mT
Ext
rem
a s
epara
tion A
' (
mT
)zz
311.5 K
· characteristic parameter or T T5mT 50G
· corresponds to "mean" coalescence
· corresponds to t » 3.5 nsr
2A'zz
2A'zz
magnetic field (mT)332 336 340 344
T (K) tr
400
370
340
310
280
250
220
190
495 ps
865 ps
1.67 ns
3.66 ns
9.47 ns
30.8 ns
139 ns
1 ms
-1E = 22.9 kJ·molA
Example: Thermally activated Brownian diffusion
73PCIV-Part2-EPRSpectroscopy
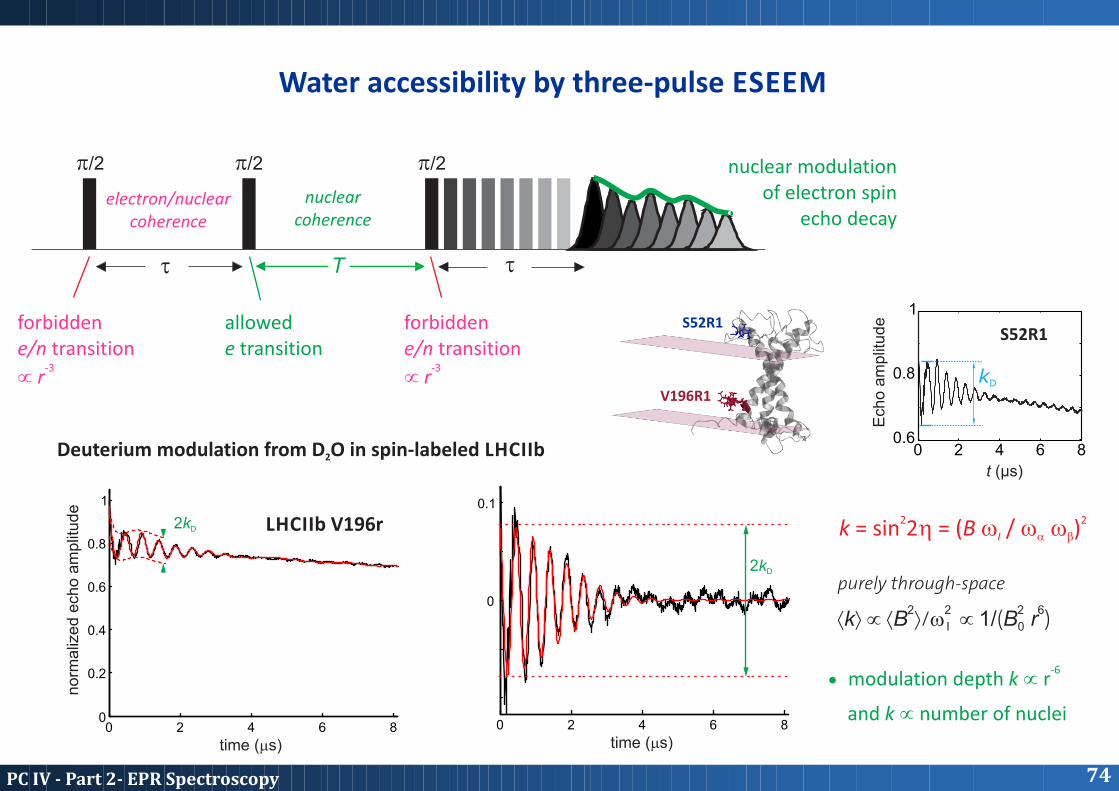
Water accessibility by three-pulse ESEEM
p/2 p/2 p/2
t tT
nuclear modulation of electron spin
echo decaynuclear
coherenceelectron/nuclear
coherence
forbiddene/n transition
-3µ r
forbiddene/n transition
-3µ r
allowede transition
Deuterium modulation from D O in spin-labeled LHCIIb2
-6· modulation depth k µ r
and k µ number of nuclei
0 2 4 6 8
0
0.2
0.4
0.6
0.8
1
norm
aliz
ed e
cho a
mplit
ude
time (ms)
2kD LHCIIb V196r
0 2 4 6 8
0
0.1
time (ms)
2kD
2 2k = sin 2h = (B w / w w )I a b
2 2 2 6ákñ µ áB ñ/w µ 1/(B r ) I 0
purely through-space
t (µs)
0 2 4 6 80.6
0.8
1
Ech
o a
mplit
ude
S52R1
kD
74PCIV-Part2-EPRSpectroscopy
S52R1
V196R1
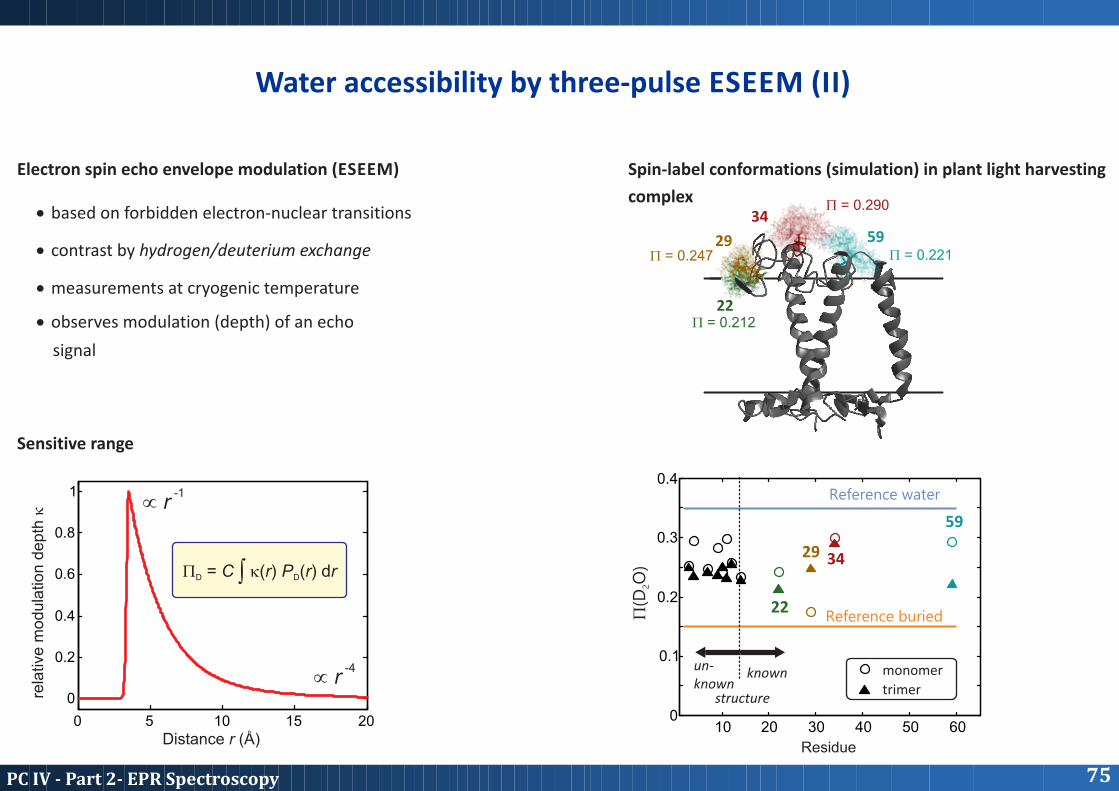
· based on forbidden electron-nuclear transitions
· contrast by hydrogen/deuterium exchange
· measurements at cryogenic temperature
· observes modulation (depth) of an echo
signal
Electron spin echo envelope modulation (ESEEM)
Sensitive range
0 5 10 15 20
0
0.2
0.4
0.6
0.8
1
rela
tive m
odula
tion d
epth
k
Distance r (Å)
-1µ r
-4µ r
P = C k(r) P (r) dr D Dò
Water accessibility by three-pulse ESEEM (II)
75PCIV-Part2-EPRSpectroscopy
5929
34
22
Spin-label conformations (simulation) in plant light harvesting
complex
P = 0.212
P = 0.247
P = 0.290
P = 0.221
Reference water
Reference buried
Residue
P(D
O)
2
59
34
22
29
known un-known
structure
10 20 30 40 50 600
0.1
0.2
0.3
0.4
monomer
trimer

N NNO O
OO=O O=OO=O· ··· ··
Diffusing paramagnetic species
collision
before and afterduring
electrons in overlappingorbitals are indistinguishable
observer spin up observer spin down ¯
· most easily detected via saturation curves (CW EPR)
Þ relaxation time T decreases with increasing exchange rate W1 ex
DP1/2 W /Tex 2eµA et al., Proc. Natl. Acad. Sci. USALTENBACH
91, 1667-1671 (1994)
Relaxation via collisional exchange
76PCIV-Part2-EPRSpectroscopy
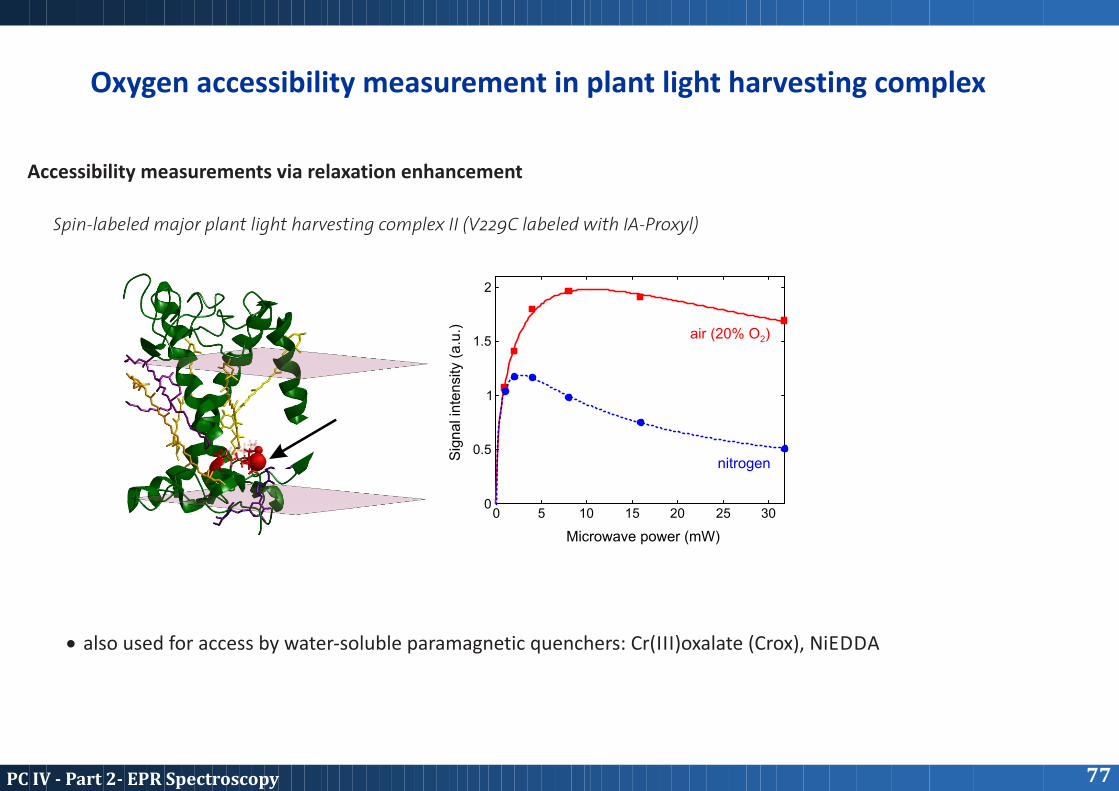
Oxygen accessibility measurement in plant light harvesting complex
0 5 10 15 20 25 300
0.5
1
1.5
2
Microwave power (mW)
Sig
nal i
nte
nsi
ty (
a.u
.) air (20% O )2
nitrogen
Accessibility measurements via relaxation enhancement
· also used for access by water-soluble paramagnetic quenchers: Cr(III)oxalate (Crox), NiEDDA
Spin-labeled major plant light harvesting complex II (V229C labeled with IA-Proxyl)
77PCIV-Part2-EPRSpectroscopy
N N
O O
NN
OO
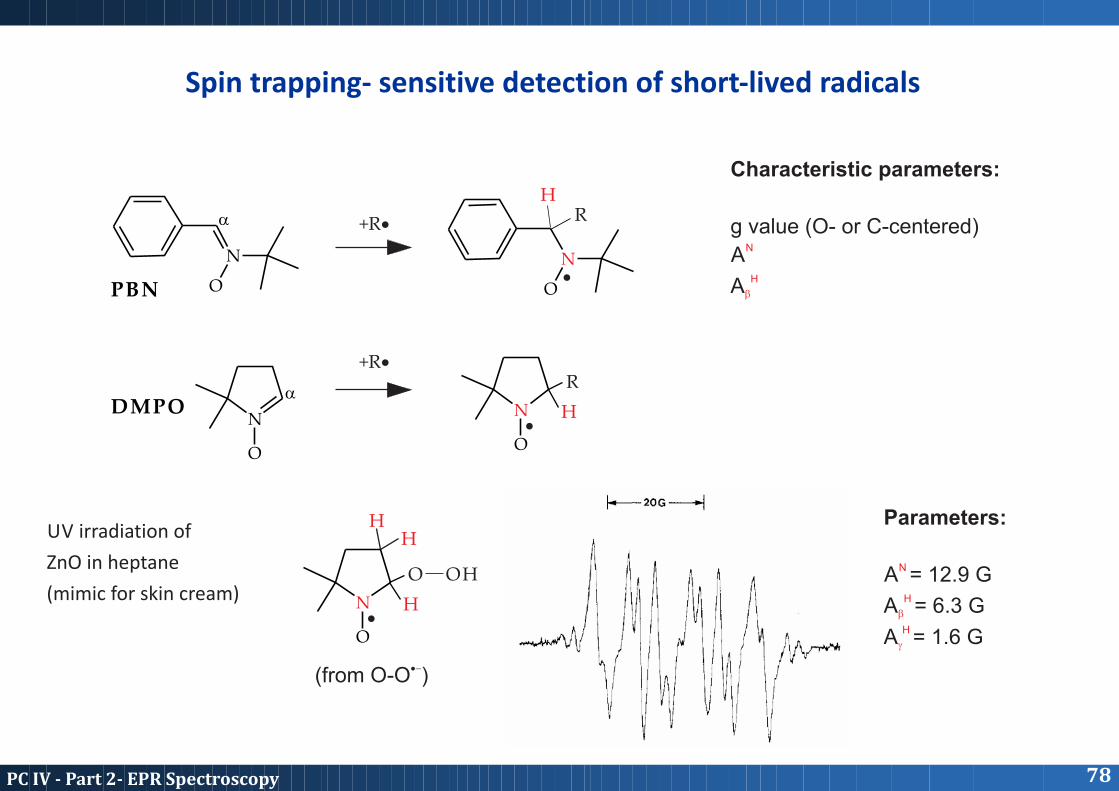
PBN
DMPO
a
a
+R·
·
·
R
R+R·
H
H
Characteristic parameters:
g value (O- or C-centered)
AN
A H
b
Parameters:
A = 12.9 GN
A = 6.3 GH
b
A = 1.6 GH
g
N
O·
O OH
H
HH
·-(from O-O )
UV irradiation of
ZnO in heptane
(mimic for skin cream)
Spin trapping- sensitive detection of short-lived radicals
78PCIV-Part2-EPRSpectroscopy
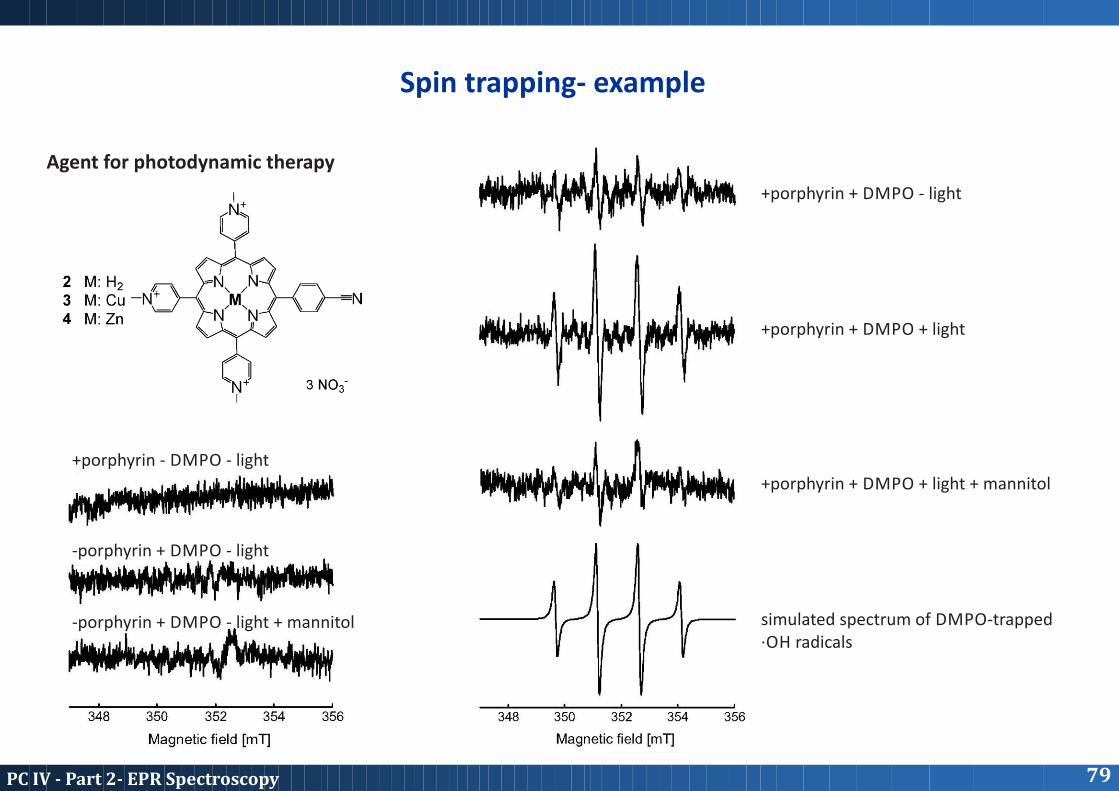
Spin trapping- example
79PCIV-Part2-EPRSpectroscopy
Agent for photodynamic therapy
+porphyrin - DMPO - light
+porphyrin + DMPO - light
+porphyrin + DMPO + light
+porphyrin + DMPO + light + mannitol
-porphyrin + DMPO - light
-porphyrin + DMPO - light + mannitol simulated spectrum of DMPO-trapped ·OH radicals
Prüfungsvorbereitung
80PCIV-Part2-EPRSpectroscopy
· den Fragenkatalog erhalten Sie nach dieser Vorlesungsstunde per E-mail
· PC IV/PCV: Sie bekommen entweder einen NMR- oder einen EPR-Prüfer
ich behalte mir vor, auch NMR zu fragen
· PC IV separat: 30 min, NMR & EPR werden geprüft
· die Übungen sind Prüfungsstoff
· die Folien zum EPR-Teil finden Sie unter
epr.ethz.ch/education/pc-iv-advanced-magnetic-resonance.html