Embed Size (px)
Citation preview
1esa .make la inen@evanomics .com
Introduction to Economic Value Added
September 1999, Esa Mäkeläinen, M. Sc. (Econ)
Contents1. Background, use, benefits2. Basic premise 3. Definition and characters4. EVA and market values5. EVA and bonus systems6. Implementation

2esa .make la inen@evanomics .com
History and background
• Old consept (Residual Income = Operating profit - capital costs)– However: the development level of capita markets, estimation of cc, Shareholder
Value -approach. were not supporting it those days
• In the late 1980´s Stern Stewart & Co (U.S.)– name and trademark EVATM (Economic Value Added)– presented the superior characters in perform. measurement, link to market values (the
bigger EVA, the bigger m-cap), bonus systems– presented some very successful EVA management and bonus systems (e.g. (Coca-
Cola, WalMart, Briggs & Stratton, AT&T)– During 90´s to almost every big US-company (most used measure)
What EVA has had to give in order to expand like this?• Superior performance measure compared to e.g. operating profit, profit after fin.
items, EPS, ROI, ROE… (explained later in detail why)• Still very simple and operatively practical• Improves profitability normally first through improved capital turnover• Very suitable for bonus systems (logically after the first point)

3esa .make la inen@evanomics .com
The basis of EVA: The average return on stock market
• The return of the most important stock indices during the last 20 years
Return of Indices, last 20 years
10
100
1000
10000
1978
1980
1982
1984
1986
1988
1990
1992
1994
1996
1998
Year
Ind
ex
valu
e
DOW JONES
SP 500
NASDAQ
DAX (SAKSA)
12,9% / year13,7% / year
11,4% / year
15,7% / year

4esa .make la inen@evanomics .com
The basis of EVA: The average return on stock market
• The return on stock markets has always (whole 20th century) been stable in the longterm (about 6%-points above the long-term risk-free rate)
– Nominal yields are not reliable comparison basis without considering inflation, therefore it is easier to talkabout return above the risk free rate)
• Investors can easily achieve the average index return with long-term invesments(diversified portfolio)
• Therefore owners do not in the long-term have to accept returns below this average==> the average long term equity return is also the alternative return for equityinvestments. Keeping money in companies producing less in the long-term is notsensible

5esa .make la inen@evanomics .com
Return to owners
– Let us assume that the companies at the market achieve a return of 10% on average. Thefollowing figure represents how the owners treat their holdings in different companies
-5 %
0 %
5 %
10 %
15 %
Co
mp
any
A
Co
mp
any
B
Co
mp
any
C
Co
mp
any
D
Co
mp
any
E
Co
mp
any
F
Return oncapital
Company A:Negative return:discontinued
Companies B and C:Insufficient yield: Capital will be withdrawn gradually: (investments to minimum)
Companies F and G:Above average yield:more investments, operations will be explanded
Company D:Sufficient return:Operations continueas before
Average return 10%

6esa .make la inen@evanomics .com
Average cost of capital
• The cost of capital of a company is the average cost of equity and debt• The cost of debt should be defined as the (long term) risk free rate + company
premium, e.g. 5% + 0,5% = 5,5%• Cost of equity -> average return on similar risky investment
– Cost of Equity: (long term) risk free rate + beta x (equity risk premium) =>– 5% + 1,3 x 6% = 12,8%
• Cost of capital (with target solvency) : (45% * 12,8%) + ( 55% * 5,5%)1 ≈ 9%
Cost 12,8%
Cost 5,5%
WACC9,0%
1Tax-schie ld of debt
not included hereAssets LiabilitiesFixed assets Equity
Land 90 Share capital 200Real estate 110 Retained earni 250Machinery 220
Working capital DebtInventories 310 long-term 250Sales recievab 220 short-term 200Cash and ban 50 other 100
Total assets 1000 Total assets 1000

7esa .make la inen@evanomics .com
Cost of capital (summary)
• Every company has certain average cost of capital which dependsonly on operative risk and long term interest rate levels (9% in theexample)
– In operations only thing that matters is the average cost of capital (9%), theindividual costs of debt / equity and the actualy solvency can be ignored at thislevel
• Cost of capital means the minimum return requirement, which mustbe achieved in order to get the owners to keep their money in theseoperations
• The cost of all assets is the same (9%)• Cost of capital should not be mixed up with the return objectives of
the company– If company produces good return on capital and big EVA, the profit
objectives/targets should be given as big EVA targets and not by increasing thecost of capital

8esa .make la inen@evanomics .com
EVA vs. traditional performance measures
• Measures from income statement; operating profit, profit beforeextras, net income, earnings per share
• The investors are interested mainly on how much resources are employed bygenerating the profits (what is the return on their capital)
• Absolute terms (euros, dollars) make these measures good from operative perspective
• ROI, RONA, ROCE, ROIC...• Fixed the main deficiency of income statement measures; capital was brought into the
picture• Are still not measures that could be maximized (steerign failure)• Unillustrive and non-practical in operative level

9esa .make la inen@evanomics .com
Traditional performance measures
Income Statement Assets Liabilities
Net sales Land Share capital - Variable costs Buildings - Fixed costs Machinery and equip. Retained earningsGross profit Excess derpeciation - Depreciation MaterialOperating profit WIP-inventory Long-term debt - Financial items Finished goods Short-term debtProfit before extras and taxes Advances received - Extraordinary items Sales receivables Accounts payableProfit before taxes Cash and bank Deferred items - Taxes Total assets Total assetsNet profit
ROI = Operating profit = Operating profitCapital employed Total assets - non-int. bearing items
10esa .make la inen@evanomics .com
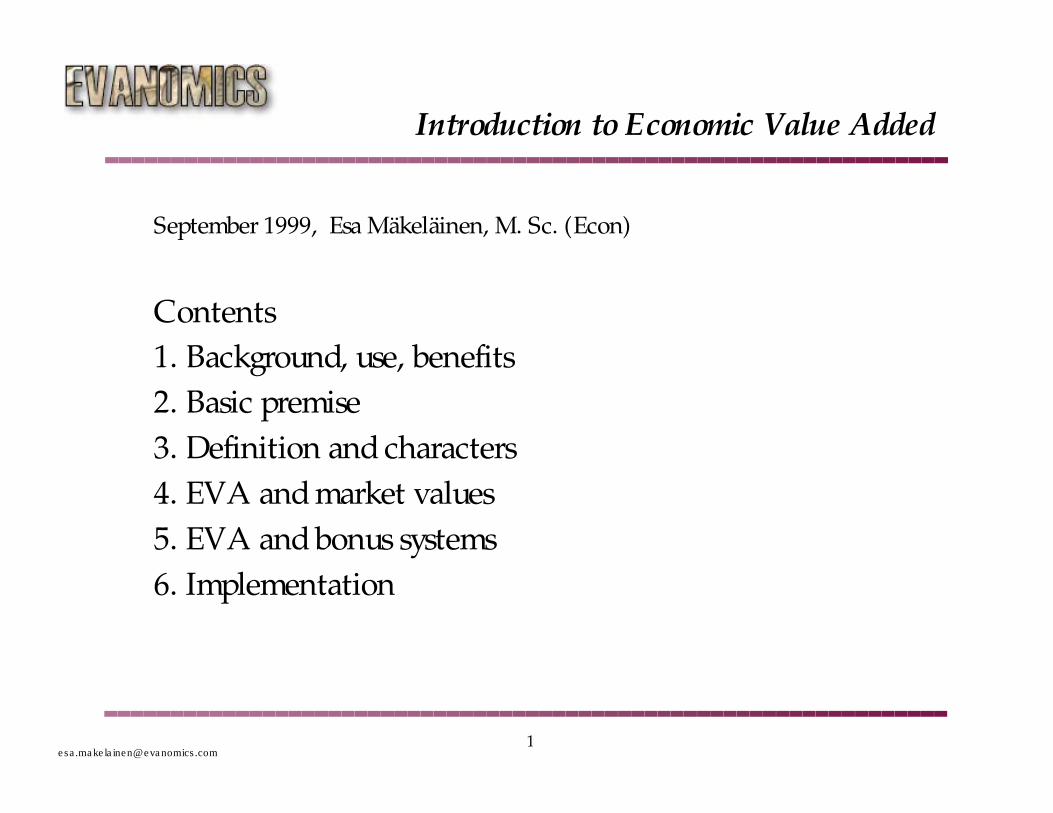
EVA vs return on investment (steering failure)
• Example: ROI 30%. How ROI and EVA change after an investment producing areturn of 20% ?
• ROI does not take into account the increase or decrease in invested capital. Thereforeit does not necessarily describe whether the profitability has decreased or improved=> non-optimal controlling tool and bonus base
Situation in the beginningOperating profit 30 000Capital employed 100 000 ROI 30 %
Cost of capital 10 % 0.1*100 000 = 10 000EVA = 30 000 - 10 000 = 20 000
Investment opportunityOperating profit 4000Required capital employed 20 000 (offers a return of 20 % )
Situation if investment done
Operating profit 30 000 + 4000 = 34 000Capital employed 100 000 + 20 000 = 120 000 ROI 28 %
Cost of capital 10 % 0.1*120 000= 12 000EVA =34 000-12 000 = 22 000

11esa .make la inen@evanomics .com
Calculation of EVA
Income Statement Assets Liabilities
Net sales Land Share capital - Variable costs Buildings - Fixed costs Machinery and equip. Retained earningsGross profit Excess depreciation - Depreciation MaterialOperating profit WIP-inventory Long-term debt - fixed assets x WACC Finished goods Short-term debt - Materials x WACC Advances received - Finished goods x WACC Sales receivables Accounts payable - Sales receivab. x WACC Cash and bank Deferred items + Accounts payabl. x WACC Total assets Total assets - TaxesEVA

12esa .make la inen@evanomics .com
EVA vs ROI, ROCE, RONA in operative level
• Return on capital is very unillustrative measure in operative level– The costs/costsavings of some process, function or line (production line, sales department
etc.) is very difficult to convert into change in ROI. Even if this would be done the result isvery uninformative
– With the EVA consept all costs, costsavings, increased revenues and costs of employedcapital are comparable and are in terms of final profitability (in absolute terms like EVAitself)
• Usually the importance of capital efficiency has been left aside as it has notbeen understood on operative level in ROI-steered companies
• Therefore usually implementing EVA improves first capital turnover(decreases working capital) as the cost of employed capital comes clear tooperative people (after these costs are taken in the income statement)

13esa .make la inen@evanomics .com
Summary: EVA as a measure of profitability
• First financial performance measure that can maximized as a sensibleobjective
– Capital and the growth of capital employed is integrated (compared to Operatingprofit and ROI)
• Simplifies the whole consept of profitability– With traditional measures this consept has been ambigious and complicated
• Integrates the effects of profitability and growth into same measure– The main objective of any company is to increase the value of the company. EVA
measures value creation and by maximizing long-term EVA the company ismaximizing its own value
• Very suitable as a bonus base– logically after the first point above– Unifies the goals of the owners and the company– Compenstion tied to increasinf the value of the company

14esa .make la inen@evanomics .com
EVA and market value
• Financial theory suggests that the value of the company dependsdirectly on the future EVA:
• The value of the company = Book value of equity + the value of future EVA
– Mathematically equal to Discounted Cash Flow -formula– Investors and analysts use EVA heavily (e.g. CS First Boston, Goldman Sachs,
Morgan Stanley, Merita Securities Ltd., Mandatum Stockbrokers, Opstock)– Compare to the valuation of a bond (next slide)
15esa .make la inen@evanomics .com
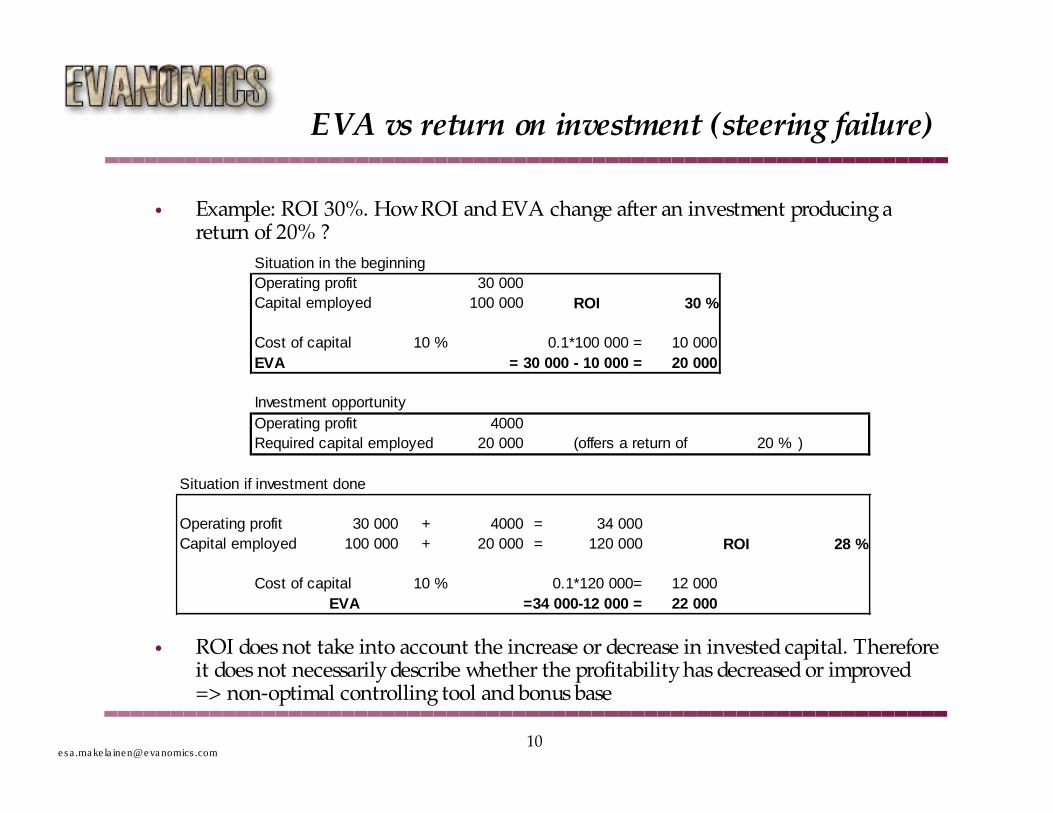
Value of a bond
• The bond is valued with a premium or a discount depending on the relationship betweencurrent interest rate on markets and coupon rate
Bondmarketvalue105
Market value
premium
Bondmarketvalue
80
Discount
Coupon rate > market rate
Coupon rate <market rate
Interest rate (market) 4%Coupon rate 5%Interest rate (market) 10%
Coupon rate 5%
Bond nominal
value100
Bondmarketvalue100
Coupon rate =market rate
Interest rate (market) 5%Coupon rate 5%

16esa .make la inen@evanomics .com
EVA and market value of a company
Marketvalue
of profitablecompany
Book value
of Equity
Market value Added
Book value
of Equity
Marketvalue
of unprofitable
company
MarketValueLost
EVA1
(1+ WACC)1
EVA2
(1+ WACC)2+ + ...
(- EVA1)
(1+ WACC)1
(- EVA2)
(1+ WACC)2+ + ...
Market value of a company = Book value of equity + discounted value of future EVA
The bigger future EVA, thebigger marke t va lue ofequity. Therefore EVA isa lso ”Va lue Basederformance measure”

17esa .make la inen@evanomics .com
EVA and market value of a company
Marketvalue
of profitablecompany
XXXX Plcxx Bn
xx euros/share
Book value
of Equityxx Bn
xx euros/share
MarketValueAddedxx Bn
xxeuros/share
EVA1
(1+WACC)1
EVA2
(1+ WACC)2+ +
EVA3
(1+ WACC)3
EVA4
(1+ WACC)4+ + ...
xx Mmk
xx Mmkxx Mmk
xx Mmk
xx Mmk
/1.0
/1.41
/1.29
/1.18
/1.09
Finnish companies with big MVA:
Nokia, Tieto, Fiskars, Hartwall, Lassila&Tikanoja, JOT Autom., Perlos, Eimo,Tulikivi, KCI Konecranes, PK Cables...

18esa .make la inen@evanomics .com
EVA and market value of a company
Book value
of Equity
Marketvalue
of unprofitable
company
Market ValueLost
(- EVA1)
(1+ WACC)1
(- EVA2)
(1+ WACC)2+ + ...
When they say, that you can lose money bylosing the alternative return they mean this...
Finnish companies in this situation currentlye.g.:Fortum, Rautaruukki, Metsä-Serla, HKRuokatalo, Neptun Maritime(Silja) ...

19esa .make la inen@evanomics .com
EVA vs MVA
Source : S tewart 1991

20esa .make la inen@evanomics .com
Change in EVA vs change in MVA
Source : S tewart 1991
21esa .make la inen@evanomics .com
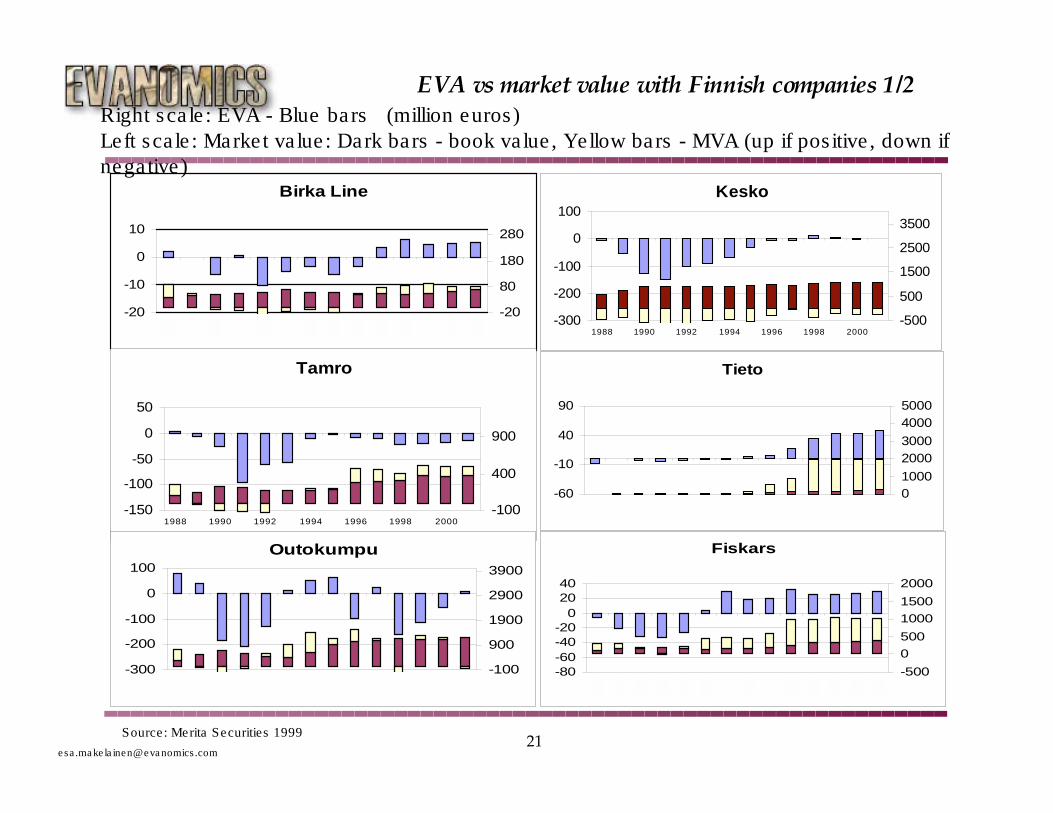
EVA vs market value with Finnish companies 1/2
Birka Line
-20
-10
0
10
-20
80
180
280
Kesko
-300
-200
-100
0
100
1988 1990 1992 1994 1996 1998 2000-500
500
1500
2500
3500
Tamro
-150
-100
-50
0
50
1988 1990 1992 1994 1996 1998 2000-100
400
900
Fiskars
-80-60-40-20
02040
-500
0
500
1000
1500
2000
Outokumpu
-300
-200
-100
0
100
-100
900
1900
2900
3900
Tieto
-60
-10
40
90
01000
20003000
40005000
Source : Merita Securities 1999
Right sca le : EVA - Blue bars (million euros)Left sca le : Marke t va lue : Dark bars - book va lue , Yellow bars - MVA (up if pos itive , down ifnega tive)

22esa .make la inen@evanomics .com
Lassila & Tikanoja
-30
-10
10
30
0
200
400
600
800
Nokia
-2000
-1000
0
1000
2000
0
50000
100000
150000
200000
Asko
-200
-150
-100
-50
0
50
-200
300
800
Hackman
-100-80-60-40-20
020
-1000100200300400500600
UPM-Kymmene
-4000
-3000
-2000
-1000
0
1000
2000
-1000
4000
9000
14000
Enso
-600
-400
-200
0
200
400
-500
1500
3500
5500
Source : Merita Securities 1999
Right sca le : EVA - Blue bars (million euros)Left sca le : Marke t va lue : Dark bars - book va lue , Yellow bars - MVA (up if pos itive , down ifnega tive)
EVA vs market value with Finnish companies 2/2

23esa .make la inen@evanomics .com
EVA and compensation systems
• Adequate level– As a kind of ”excess return” EVA is very suitable for bonus base, it does not give
bonuses if the shareholders can not get adequate returns in relation to riskinvolved
• Steering:– Increase in EVA (in long -term) means also increase in profitability and
company value (in contrary to traditional performance measures)
• Objective level• Features above enable also big bonuses if the shareholders first
benefit clearly– The management is often able to achieve big increases in shareowners wealth
• Bonuses should not be limited as we do not want the EVA to belimited
• Compensation systems the most essential area of EVA– Academic reaseach (e.g. Wallace 1997) gives empirical support

24esa .make la inen@evanomics .com
Implementation of EVA
• The benfits of EVA materialize as the key persons of the company:– Understand what real profitability is all about– Get motivated to improve profitability
• This provides that:– Key persons must understand what EVA is: where cost of capital comes from,
why EVA is an important measure and better that traditional measures– EVA is shown also in operative level reports– The compensation is tied to EVA or to its drivers
• If the implementation of EVA is failed the reasons have normally been thelack of EVA training among key persons or the lack of commitment fromthe whole upper management team

25esa .make la inen@evanomics .com
Kamensky Consulting implementation of EVA
1. Defining EVA calcul. and reporting procedures (0,5 - 1 days)– Defining capital costs, items included, reporting formats
2. EVA training (0,5 - 2 days)– The basic premise, rough calculation and the importance of EVA should be
trained to all key persons. Ideal trained group is 10-15 persons and the trainingtakes about two hours per group.
3. EVA compensation systems (0,5 - 1,5 days)– The main quidelines: based on positive EVA, increase of EVA or the increase of
EVA that exceeds certain growth rate, long-term and bonus bank, treatment ofgoodwill and strategic investments etc.

26esa .make la inen@evanomics .com
Kamensky Consulting fees
• Fees– Project 2000 euros/day + VAT + travelling expences
• If the ”project” consists only one day, then the cost per day would be 3000 euros
• The fees can be– According to actual days, which in turn would be done according to rough
implementation plan (normal)
– Fixed in advance permanently (no matter of the days done)
– Fees can also be substituted either partly or totally with comission tied to results(e.g. tied to EVA improvement, future EVA level, share price development,working capital reduction etc…)

27esa .make la inen@evanomics .com
Kamensky Consulting and EVA implementation (example)
• Implementation project: 3 SBUs ---> defining the calculation andreporting, training of key persons in each unit, the framework for EVAcompensation system
• 0,5 days EVA-introduction with the management team• 0,5 days definitions with the CFO and his/her department• 0,5 days EVA training (1. SBU key persons)• 0,5 days EVA training (2. SBU key persons)• 0,5 days second round with the EVA calculation and reporting
procedures (with CFO and his/her staff)• 0,5 days EVA training (3. SBU key persons)• 0,5 days the rough framework for EVA bonuses in each SBU• 0,5 days extra training for ”EVA-officers” (every SBU has one)• optional 0,5 days ; solving of the open questions confronted
(normally linked to bonus systems)– Altogether: 4,5 days: 9.000 euros + VAT + travelling expences