Embed Size (px)
Citation preview
1
Introduction to Digital Humanities: WDW235H1F1
Course Details
Professor Alexandra Bolintineanu
Course Description
Digital Humanities (DH) is a discipline at the intersections of the humanities with
computing. DH studies human culture -- art, literature, history, geography, religion -- through
computational tools and methodologies; and, in turn, DH studies digital artifacts through
humanist lenses, as complex cultural objects shaped by wider social, political, and philosophical
concerns. Digital humanists analyze languages through digital text collections; build digital
archives of forbidden books; construct video games to study literature; or resurrect historical
cities through digital maps.
This year the course focuses on endangered books: fragile, hidden, censored, forbidden. We
speak to scholars who build archives of forbidden literature. We visit the Thomas Fisher Rare
Book Library. We study rare books‘ histories through digital exhibits. By the end of the course,
you will have mastered concepts and technologies you can use in future courses and
workplaces: text encoding and data visualization, data analysis and digital exhibit
platforms. And you will learn how our stories and cultural conversations work and shapeshift
through digital environments.
Learning Goals
By the end of the course:
You will be able to describe the history and intellectual landscape of the digital
humanities, including the central concepts, debates, digital tools and platforms current in
the discipline.
You will have developed a set of best practices around datasets, project design and
management, and data curation.
You will have analyzed digital tools and platforms as complex cultural objects: shaped
by, and shaping, wider social concerns around race, class, gender, cultural values,
political hierarchies, and the ways we construct knowledge and meaning.
Through hands-on workshops:
You will clean and mine research datasets
You will create and analyze visualizations and digital maps
You will research and author your own digital exhibit
1 This is a revised version of my course syllabus: not the course syllabus as conceived before term, but a syllabus
shaped by the students‘ questions and research interests, and by our in-class discussions. I want to formally
acknowledge the insightful and engaged students of WDW235H1S (Fall 2017) for their hard work, sharp ideas, and
curiosity.
2
Course Readings & Technologies
Course readings will be available via the course Portal site each week. You are responsible for
checking the Portal site and ensuring you receive course announcements posted via Portal.
All technologies in this course are free and open-source. You will need access to a working
computer to complete the work for this course.
How This Course Works
Each week we have three hours of class:
Two hours of lecture and discussion (classroom time);
One hour of hands-on workshops and discussion (lab time).
Much of your course work will be done in class, in facilitated environments and hands-on
workshops. Given the fast pace and praxis-oriented environment, you must come to class on
time, all the time: it is all too easy, otherwise, to get lost. If this poses a problem, please let me
know as soon as possible.
Accessibility
Students with diverse learning styles and needs are more than welcome in this course. Please feel
free to approach me or Accessibility Services so we can assist you in achieving academic success
in this course.
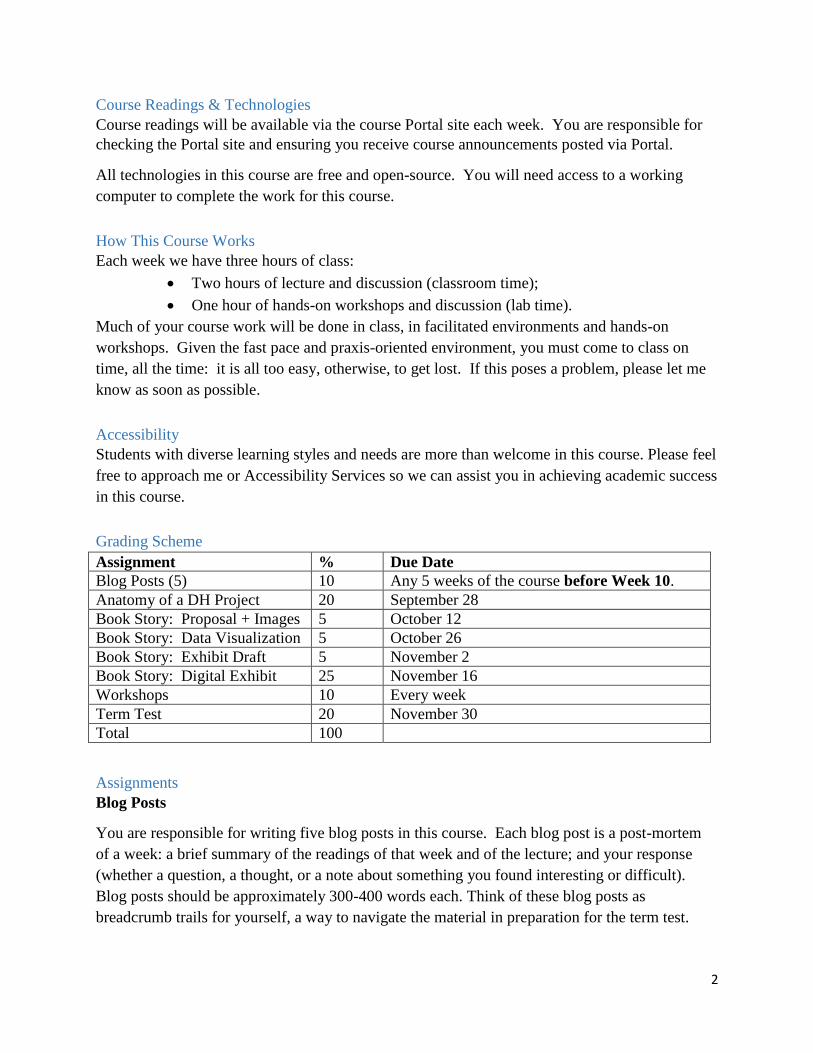
Grading Scheme
Assignment % Due Date
Blog Posts (5) 10 Any 5 weeks of the course before Week 10.
Anatomy of a DH Project 20 September 28
Book Story: Proposal + Images 5 October 12
Book Story: Data Visualization 5 October 26
Book Story: Exhibit Draft 5 November 2
Book Story: Digital Exhibit 25 November 16
Workshops 10 Every week
Term Test 20 November 30
Total 100
Assignments
Blog Posts
You are responsible for writing five blog posts in this course. Each blog post is a post-mortem
of a week: a brief summary of the readings of that week and of the lecture; and your response
(whether a question, a thought, or a note about something you found interesting or difficult).
Blog posts should be approximately 300-400 words each. Think of these blog posts as
breadcrumb trails for yourself, a way to navigate the material in preparation for the term test.
3
Word to the wise: Get your blog posts done early in the term. If you write more than 5 blog
posts, you will receive the grades for your best 5 blogs.
Workshops
Every week, you are also responsible for coming to the lab and undertaking the project or field
trip of the week in a facilitated environment. This is where you can explore, experiment, fail
creatively: all I require is engaged participation—that is, you come to class, do the hands-on
computer work, ask questions, and engage in class discussion.
DH Project Profile (Blog Post)
Your first assignment is to profile a Digital Humanities project, analyzing its research aims, its
form and content, its interface, technologies, and intended audience. 500-700 words. You will
select the project from a sign-up list available via our Portal site. Each project will be covered
by no more than two students. Projects are assigned on a first-come, first-served basis.
Book Story
Your major assignment in this course is to tell the story of a banned, challenged, or endangered
book through a digital exhibit.
I love hearing from you! I answer emails at [email protected] within 48 hours
or fewer on business days. However, I cannot answer email after 5:00 p.m. or on weekends.
Please email me as soon as possible to make sure you receive your answers in good time.
Due Dates, Late Penalties, Academic Integrity [removed: UofToronto specific logistics]
Acknowledgements
This syllabus draws on Kristen Mapes‘ Introduction to Digital Humanities, AL285
(http://dx.doi.org/10.17613/M6H34B) and on Miriam Posner‘s DH101: Introduction to Digital
Humanities, Fall 2014, UCLA.
Course Overview (Retrospective)
Week Topic
4
Week Topic
1 Introduction to Digital Humanities.
What is ―Digital Humanities‖? We discuss the range of projects, activities, and
concerns of this growing field, and collaboratively survey representative projects from
around the world. We discuss DH in relation to the theme of the course, banned books.
We play the ―Welcome to Digital Humanities‖ Twine game to explore DH history.
2, 3 The Anatomy of DH Projects
We discuss the components of digital humanities projects—data, code, tools, platforms,
standards and communities of practice—as they manifest across a gallery of projects,
living or dead. We investigate success, failure, and sustainability in DH projects. We
collaboratively analyze two DH projects, peering ―under the hood‖ of their technical
framework and examining their research questions, digital artifacts, user experiences
and intended audiences, and disciplinary implications.
Readings & Discussion:
Miriam Posner, ―How Did They Make That?‖ (2013)
Langdon Winner, ―Do Artifacts Have Politics?‖ (1980)
Alan Galey & Stan Ruecker, ―How a Prototype Argues‖ (2010)
5
Week Topic
4, 5,
6, 7 Rare Books & Digital Archives
Guest lecture: Prof. Ann Komaromi, editor of , on samizdat, ―a system of uncensored
textual production and circulation‖ in the former Soviet Union.
Visit: Thomas Fisher Rare Book Library
We examine digital archives, discussing creation, preservation, ethical concerns,
relationships with communities, and security and environmental issues raised by cloud
computing and machine learning. We examine UofT‘s guidelines around the ethical
and technical management of human research data.
We cement our understanding by visiting the Thomas Fisher Rare Book Library under
the guidance of P.J. Carefoote, Cataloguer and Reference Librarian, and by building an
Omeka exhibit around a digitized rare book.
Readings & Discussion
On Data:
UofToronto‘s research data management policies, including guidelines on handling
sensitive data (including de-identification, i.e. anonymizing your data) and on Canadian
funders' data publication requirements (two of the three federal funding bodies mandate
that data created with gov't funding be made public).
Christof Schöch, ―Big? Smart? Clean? Messy? Data in the Humanities‖ (2013).
Miriam Posner, Humanities Data: A Necessary Contradiction (2015)
On Resurrections, Risks, Losses
William Noel, ―Revealing the Lost Codex of Archimedes‖ (2012). [TED TALK]
Bethany Nowviskie, ―Digital Humanities in the Anthropocene‖ (2014).
Eira Tansey, ―When the Unbearable Becomes Inevitable: Archives and Climate
Change‖ (2017).
On Ethics, Communities
Alan Liu, ―Where is Cultural Criticism in the Digital Humanities?‖ (2012)
Roopika Risam, ―Across Two Imperial Cultures‖ (2015).
Duarte, Marisa Elena and Miranda Belarde-Lewis. 2015. "Imagining: Creating Spaces
for Indigenous Ontologies" (2015).
Bethany Nowviskie, ―Everywhere, Everywhen‖ (2016)
6
Week Topic
Week
8-10 Projects, Interfaces, and Data Visualization
In facilitated workshops, we turn to data visualization of humanities materials, using
Jane Austen‘s Lady Susan for experimentation (Voyant, Palladio, Cytoscape: text and
corpus work, network graphs, mapping, annotation). Then we analyze the American
Library Association‘s data on banned books and discuss how we might model,
interpret, question, and visualize this data.
Readings & Discussion
Johanna Drucker, ―Humanities Approaches to Graphical Display‖ (2011).
Miriam Posner, Data Trouble: Why Humanists Have Problems with Datavis, and Why
Anyone Should Care (2016)
Week
11 Retrospective
The last class is a retrospective look at the course. After the term test, students discuss
how to use DH approaches and tools on their home discipline. We also discuss how we
might apply the course learning outcomes to jobs in the corporate sector: we dissect a
job ad from Monster.ca to align students‘ newly acquired skills with every requirement
of that position.
Guest talk: Adriano Pasquali, The Book of Fame: videogames and digitized medieval
manuscripts
7
Course Project
An Object’s Tale: Building a Digital Exhibit
Overview
In this assignment, you get to tell the story of a banned book you have seen in person, either
from the Thomas Fisher Rare Book Library or from our list.
You will create a website that features a digital collection and exhibit about that book, using the
free, open-source content management platform Omeka. Like a good museum curator, you will
bring together a gallery of exciting pictures, and you will guide your visitors through that gallery
through a well-researched, interesting narrative about your book.
Your digital collection will catalogue evidence about your book: photographs of the book
itself (title page, illustrations, marginal annotations, damage, other interesting features);
images of related books from other museums; manuscript illuminations; other relevant
multimedia. Each object of your digital collection will be described systematically, as
books are described in a library catalogue.
Your exhibit will be a guided tour about your book and the circumstances under which it
was banned.
You will use some digital technology as part of this assignment.
This is a scaffolded assignment: that is, you will produce several components at each stage, and
each component builds on the ones before it-- like LEGO, except you get to build your own
bricks.
Learning Goals
By the end of this learning module, you will have learned:
How to understand your book‘s significance, history, and meaning, in its historical
context;
How to think about the transmission and attempted restriction of knowledge in different
technological platforms (manuscripts, printed books, digital media)
How to build an exhibit around objects and their history;
What metadata is, and why metadata matters
What Omeka is, and what content management systems are
How to create your own Omeka site: building items, batch-uploading items, creating
digital collections and building exhibits featuring scholarly materials
What You Hand In:
8
1. A proposal describing, in 200 words or fewer, the object whose story you plan to tell:
what it is; why it was banned, by whom, and in what historical context; and how you plan
to shape your exhibit.
2. A draft of your digital project (this should be a Word document).
3. A complete digital exhibit website that contains your collection of objects and a narrative
about that collection.
4. A data visualization or a Twine game about the book. This data visualization or Twine
game will become part of your exhibit.
Proposal
100-200 words: describe your book and the structure of your exhibit.
Sample Proposal
Example Discussion
My exhibit focuses on Ana Blandiana‘s Întâmplări de pe strada mea (‗Events
From My Street‘), a Romanian children‘s book, which was banned in Romania
during the Ceaușescu regime.
One sentence
identifying
your object
and its
place/time of
origin.
I will discuss this book from the following points of view:
Book. I describe the book itself, an illustrated children‘s book in verse.
Ban or Challenge. I discuss why the book was scrutinized by the Communist
regime. Some items here include: photos of the pages with the poem ―A star
on my street,‖ a poem about a boastful kitten which was interpreted as a
criticism of the dictator Ceausescu and caused the book to be scrutinized by the
Securitate (the secret police); archival photos of schoolchildren forced to
celebrate Ceausescu; and children‘s textbooks featuring first-page photographs
of Ceausescu. These artifacts show how official culture sought to frame and
control the experience and knowledge of childhood.
Conclusion. I discuss children‘s literature in Communist Romania as a space
in which writers dared to experiment, because children‘s books allowed writers
to say uncomfortable things in playful or disguised ways.
I contrast this with the ways the contemporary school system, in their
censorship of e.g. history books, competed to shape children‘s worlds and
knowledge, selecting the literature and history curriculum to reflect the
ideology of the totalitarian government.
An overview
of your
exhibit: its
sections and
some of its
objects.
You will
probably have
less to say in
your proposal:
that is FINE.
Indicate who
banned the
book, and
why, and how
your exhibit
will show this.
9
Collection
5 photos or more, to be described with Dublin Core metadata, including the photos of your
book:
The collection is a set of at least 5 photographs that document your book and the context in
which it was banned. The photographs of the book should be taken by yourself; the other
photographs, you may find on museum websites and cite properly.
Some examples of objects that shed light on your book and the context in which your book was
banned:
If you are using e.g. The Handmaid’s Tale, look at the Handmaid protests in the
U.S. in recent years;
If you are studying a book banned in Nazi Germany, find digitized archival
photographs documenting e.g. book burnings in Nazi Germany;
If you are studying a book banned by the Catholic Church, photograph the Index;
If you are studying, say, Darwin‘s Origin of Species, you can document its impact
with photos of 19th
century newspaper articles about it…or with 21st century
newspaper articles on the controversy around the depiction and teaching of
evolution vs. creationism in U.S. schools
If you are studying a science book, you can illustrate the science of the day with
museum pictures of relevant scientific instruments (microscopes, telescopes);
If you are studying a book of saints‘ lives (banned by Protestants) or a theological
work (attacking the Catholic Church), you may look for contemporary images of
e.g. book burnings, anti-Papal posters, etc.
Data Visualization or Twine Game
For this component of your assignment, you produce one of two things: a data visualization OR
a small Twine game.
The data visualization should illuminate an aspect of your banned book. You will submit the
image plus some text, in a .pdf file, on the Data Visualization deadline. Then, for your Omeka
exhibit, you will add an image of the dataviz as an Omeka Item. In that Omeka Item‘s Dublin
Core: Description field, write 100-200 words explaining: what your data is; how you obtained
it; what platform you used; and finally, how the dataviz illuminates the book, i.e. what you learn
about the book from the dataviz that you could not have learned otherwise.
Example:
The network graph we produced in class visualizes letter exchanges in Lady Susan.
The data that underlies the visualization is a .csv file of the letters—their Sender,
Receiver, Description, Place of Composition, and that place‘s Latitude and Longitude.
The data was obtained by manually compiling letter data from the novel and then
researching the geographical coordinates of the novel‘s named locations on Wikipedia.
10
This letter data is visualized through a network graph generated by Palladio. The
network graph traces exchanges of letters between the novel‘s characters; the letters are
the edges and the characters are the nodes of the graph. The graph sheds light on the
social dynamics of the novel, showing which characters communicate with one another
and which do not; which characters are at the centre of the social network—namely, Lady
Susan and Mr.Vernon, who write to and receive letters from most other characters – and
which characters are on the margins of this world– namely, Miss Vernon, who writes a
single letter, and receives none in return.
The dataviz does not have to be about the book‘s characters. It can be:
A visualization of the book‘s text viewed through Voyant (this is a very easy option and
will earn at most a B- unless you come up with some truly brilliant analysis);
A map of the author‘s life;
A map of books about your topic that appeared between 2000 and 2017, by geographic
location of their publishers;
A hand-drawn interpretive graph of the book‘s themes;
Other options that occur to you!
The second option for this portion of the assignment is a very short Twine game about your
book.
Your game can tell the story of how the book was written, or how the book was banned, or how
people got around book bans. Your player can inhabit the viewpoint of the author, or of a
censor, or of a reader encountering obstacles in getting access to the book. Or your game can tell
a small piece of the story from a character‘s point of view (that is, in your game, the player
inhabits the viewpoint of that character). Your game needs to have between 8 and 12 passages
(steps).
You will submit the .html file on the Data Visualization deadline.
Exhibit
In every exhibit, at least four sections are mandatory: Introduction; Book; Ban or Challenge;
and Conclusion. You may include other sections if needed.
Introduction
This section is a summary of your exhibit, indicating what your book is, when it was banned, and
why. 100-150 words. (A cleaned-up version of your proposal.)
Book

11
In this section, you describe your book and its author. What is its title? Who is its author? In
detail and in your own words, summarize what the book is about. Then describe the copy you
are using: when is it from? What does it look like? (Think about: size; shape; damage;
marginal annotations, if any; illustrations, if any; other distinguishing marks, if any.) Your items
in this section can be different photos of your book. Include as much descriptive detail as you
can.
Ban or Challenge
In this section, you describe the social and historical context of your book: that is, the book‘s
time, place, and purpose. When and where was it written? Who was its intended audience?
Who banned or challenged the book, and why? How was this censorship or challenge enforced?
What was the outcome of the banning decision? Your exhibit items can include maps,
photographs of people reading the book, photographs of people destroying the book, etc.
Conclusion
What insights (specific to your book—not a general conclusion that almost any other banned
book could illustrate) into the transmission of knowledge and its restriction would you like your
viewer to draw from your exhibit?
Works Cited
This section contains at least one resource—scholarly article or museum article or book—on
which your exhibit draws. You may use any scholarly citation style you like, as long as you are
consistent.
Example:
Gogâță, Cristina. ―Parallel Libraries Of The Former Securitate. Ana Blandiana, ‗Întâmplări De
Pe Strada Mea‘ (‗Events From My Street‘).‖ Studia Universitatis Babes-Bolyai. 61(2): 2006,
pp. 97-100.
Happy researching!
12
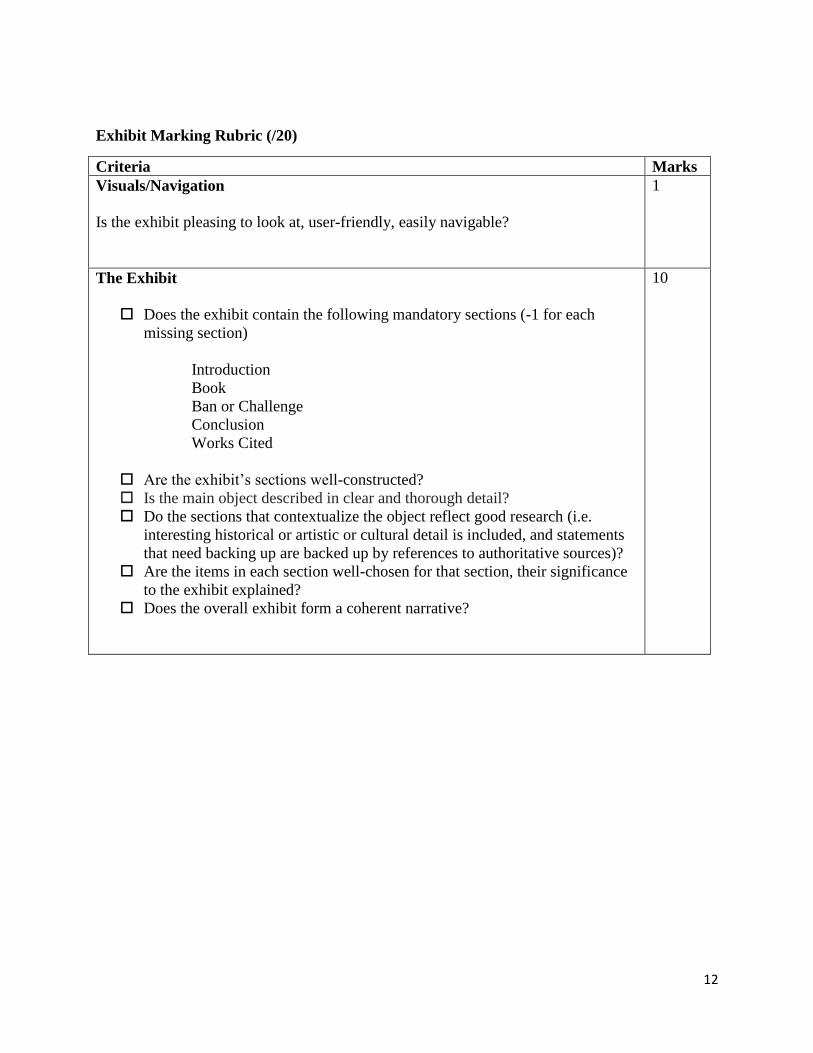
Exhibit Marking Rubric (/20)
Criteria Marks
Visuals/Navigation
Is the exhibit pleasing to look at, user-friendly, easily navigable?
1
The Exhibit
Does the exhibit contain the following mandatory sections (-1 for each
missing section)
Introduction
Book
Ban or Challenge
Conclusion
Works Cited
Are the exhibit‘s sections well-constructed?
Is the main object described in clear and thorough detail?
Do the sections that contextualize the object reflect good research (i.e.
interesting historical or artistic or cultural detail is included, and statements
that need backing up are backed up by references to authoritative sources)?
Are the items in each section well-chosen for that section, their significance
to the exhibit explained?
Does the overall exhibit form a coherent narrative?
10