Embed Size (px)
Citation preview

1
Introduction to Database Searching using MASCOT

2
: Introduction © 2007-2010 Matrix Science
Three ways to use mass spectrometry data for protein identification
1.Peptide Mass FingerprintA set of peptide molecular masses from an enzyme digest of a protein
There are three proven ways of using mass spectrometry data for protein identification. The first of these is known as a peptide mass fingerprint. This was the original method to be developed, and uses the molecular weights of the peptides resulting from digestion of a protein by a specific enzyme.

3
: Introduction © 2007-2010 Matrix Science
Peptide mass fingerprinting can only be used with a pure protein or a very simple mixture. The starting point will often be a spot off a 2D gel. The protein is digested with an enzyme of high specificity; usually trypsin, but any specific enzyme can be used. The resulting mixture of peptides is analysed by mass spectrometry. This yields a set of molecular mass values, which are searched against a database of protein sequences using a search engine. For each entry in the protein database, the search engine simulates the known cleavage specificity of the enzyme, calculates the masses of the predicted peptides, and compares the set of calculated mass values with the set of experimental mass values. Some type of scoring is used to identify the entry in the database that gives the best match, and a report is generated. I will discuss the subject of scoring in detail later.

4
: Introduction © 2007-2010 Matrix Science
If the mass spectrum of your peptide digest mixture looks as good as this, and it is a single protein, and the protein sequence or something very similar is in the database, your chances of success are very high.
Before searching, the spectrum must be reduced to a peak list: a set of mass and intensity pairs, one for each peak.
In a peptide mass fingerprint, it is the mass values of the peaks that matter most. The peak area or intensity values are a function of peptide basicity, length, and several other physical and chemical parameters. There is no particular reason to assume that a big peak is interesting and a small peak is less interesting. The main use of intensity information is to distinguish signal from noise.
Mass accuracy is important, but so is coverage. Better to have a large number of mass values with moderate accuracy than one or two mass values with very high accuracy.

5
: Introduction © 2007-2010 Matrix Science
PMF Servers on the Web
Aldente (Phenyx): http://www.expasy.org/tools/aldente/ASCQ_ME: https://www.genopole-lille.fr/logiciel/ascq_me/Bupid: http://zlab.bu.edu/Amemee/Mascot: http://www.matrixscience.com/search_form_select.htmlMassSearch: http://www.cbrg.ethz.ch/services/MassSearchMS-Fit (Protein Prospector): http://prospector.ucsf.edu/prospector/mshome.htmPepMAPPER: http://www.nwsr.manchester.ac.uk/mapper/Profound (Prowl): http://prowl.rockefeller.edu/prowl-cgi/profound.exeXProteo: http://xproteo.com:2698/
Mowse, PeptideSearch, Protocall
There is a wide choice of PMF servers on the web. I hope this is a complete list, in alphabetical order. If I am missing a public server, please let me know, and I will add it to the list.
Many other PMF programs have been described in the literature. Most packages are either available for download from the web or are commercial products.

6
: Introduction © 2007-2010 Matrix Science
SearchParameters
• database• taxonomy• enzyme• missed cleavages• fixed modifications• variable modifications• protein MW• estimated mass
measurement error
This is the Mascot search form for a peptide mass fingerprint. Besides the MS data, a number of search parameters are required. Some search engines require fewer parameters, others require more. We’ll be discussing most of these search parameters in detail in later talks.
To perform the search, you paste your peak list into the search form, or upload it as a file, provide values for the search parameters, and press the submit button.

7
: Introduction © 2007-2010 Matrix Science
A short while later, you will receive the results.
A peptide mass fingerprint search will almost always produce a list of matching proteins, and something has to be at the top of that list. So, the problem in the early days of the technique was how to tell whether the top match was “real”, or just the top match … that is, a false positive.
There have been various attempts to deal with this problem, which I will describe when we come to discuss scoring.

8
: Introduction © 2007-2010 Matrix Science
Henzel, W. J., Watanabe, C., Stults, J. T., JASMS 2003, 14, 931-942.
If you want to learn more about the origins of peptide mass fingerprinting, I strongly recommend this review by the Genentech group. They discuss the history and the methodology in a very readable style.

9
: Introduction © 2007-2010 Matrix Science
Peptide Mass Fingerprint
Fast, simple analysisHigh sensitivityNeed database of protein sequences
•not ESTs or genomic DNA
Sequence must be present in database•or close homolog
Not good for mixtures•especially a minor component.
One of the strengths of PMF is that it is an easy experiment that can be performed using just about any mass spectrometer. The whole process is readily automated and MALDI instruments, in particular, can churn out high accuracy PMF data at a very high rate.
In principal, it is a sensitive technique because you are analysing all of the peptides from the digest. It doesn’t matter too much if a small part of the protein fails to digest or some of the peptides are insoluble or don’t fly very well.
One of the limitations is that you need a database of proteins or nucleic acid sequences that are equivalent to proteins, e.g. mRNAs. In most cases, you will not get satisfactory results from an EST database, where most of the entries correspond to protein fragments, or genomic DNA, where there is a continuum of sequence, containing regions coding for multiple proteins as well as non-coding regions.
This is because the statistics of the technique rely on the set mass values having originated from a defined protein sequence. If multiple sequences are combined into a single entry, or the sequence is divided between multiple entries, the numbers may not work.
If the protein sequence, or a near neighbour, is not in the database, the method will fail. It is not a method for protein characterisation, only for identification.
The most important limitation concerns mixtures. If the data quality is good, then one or two, possibly three, major components can be identified. But if the data are poor, it can be difficult to get any match at all out of a mixture, and it is never possible to identify a minor component with any confidence. This is the Achilles' heel of PMF.
To identify proteins from mixtures reliably, it is necessary to work at the peptide level. That is, using MS/MS data.
10
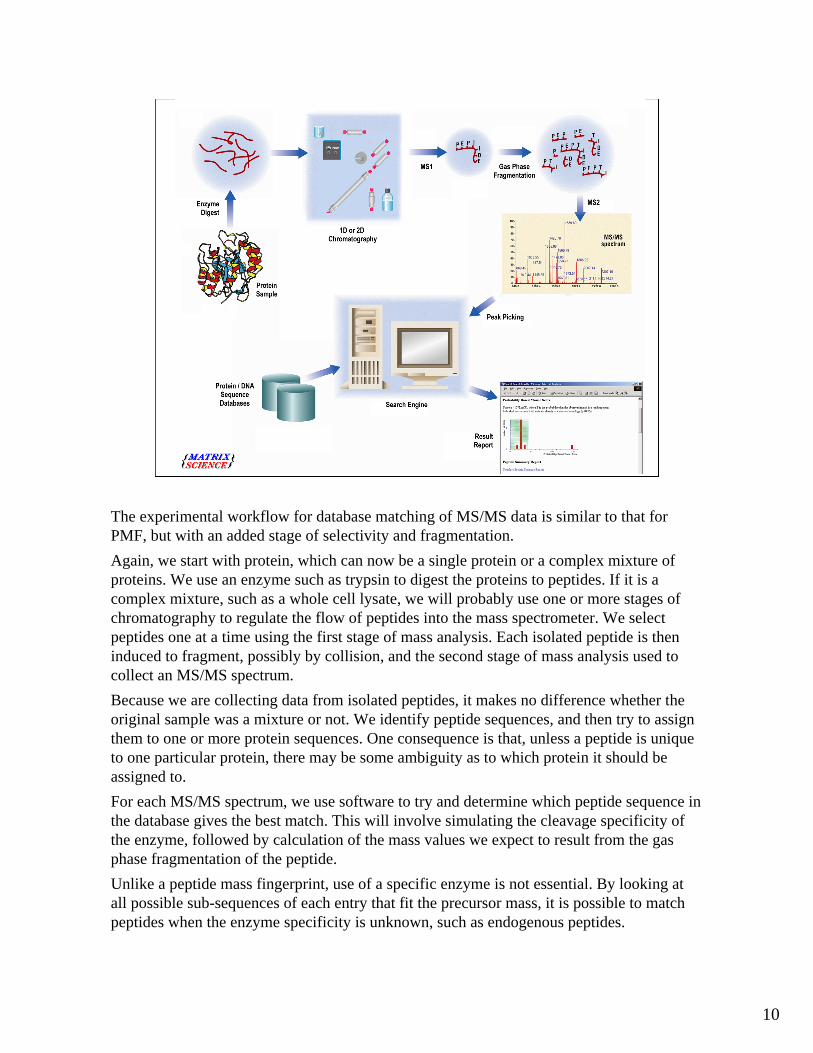
The experimental workflow for database matching of MS/MS data is similar to that for PMF, but with an added stage of selectivity and fragmentation.
Again, we start with protein, which can now be a single protein or a complex mixture of proteins. We use an enzyme such as trypsin to digest the proteins to peptides. If it is a complex mixture, such as a whole cell lysate, we will probably use one or more stages of chromatography to regulate the flow of peptides into the mass spectrometer. We select peptides one at a time using the first stage of mass analysis. Each isolated peptide is then induced to fragment, possibly by collision, and the second stage of mass analysis used to collect an MS/MS spectrum.
Because we are collecting data from isolated peptides, it makes no difference whether the original sample was a mixture or not. We identify peptide sequences, and then try to assign them to one or more protein sequences. One consequence is that, unless a peptide is unique to one particular protein, there may be some ambiguity as to which protein it should be assigned to.
For each MS/MS spectrum, we use software to try and determine which peptide sequence in the database gives the best match. This will involve simulating the cleavage specificity of the enzyme, followed by calculation of the mass values we expect to result from the gas phase fragmentation of the peptide.
Unlike a peptide mass fingerprint, use of a specific enzyme is not essential. By looking at all possible sub-sequences of each entry that fit the precursor mass, it is possible to match peptides when the enzyme specificity is unknown, such as endogenous peptides.

11
: Introduction © 2007-2010 Matrix Science
H – N – C – C – N – C – C – N – C – C – N – C – C – OH
R1 R2 R3 R4O O O
HH H H H HHH
O
a1 b1 c1 a2 b2 c2 a3 b3 c3
x3 y3 z3 x2 y2 z2 x1 y1 z1
H+
Roepstorff, P. and Fohlman, J. (1984). Proposal for a common nomenclature for sequence ions in mass spectra of peptides. Biomed Mass Spectrom 11, 601.
Database matching of MS/MS data is only possible because peptide molecular ions fragment at preferred locations along the backbone. In many instruments, the major peaks in an MS/MS spectrum are b ions, where the charge is retained on the N-terminus, and y ions, where the charge is retained on the C-terminus.
However, this depends on the ionisation technique, the mass analyser, and the peptide structure. Electron capture dissociation, for example, produces predominantly c and z ions.
12
: Introduction © 2007-2010 Matrix Science
[C]+[M]-NH2z
y-H2Oy°
y-NH3y*
[C]+[M]+Hy
[C]+[M]+CO-Hx
z - partial side chainw
y - complete side chainv
a - partial side chaind
[N]+[M]+NH2c
b-H2Ob°
b-NH3b*
[N]+[M]-Hb
a-H2Oa°
a-NH3a*
[N]+[M]-CHOa
Neutral MrIonType
Internal Immonium
Sequence Ions
Satellite Ions
Papayannopoulos, IA, The interpretation of collision-induced dissociation tandem mass spectra of peptides. Mass Spectrom. Rev., 14(1) 49-73 (1995).
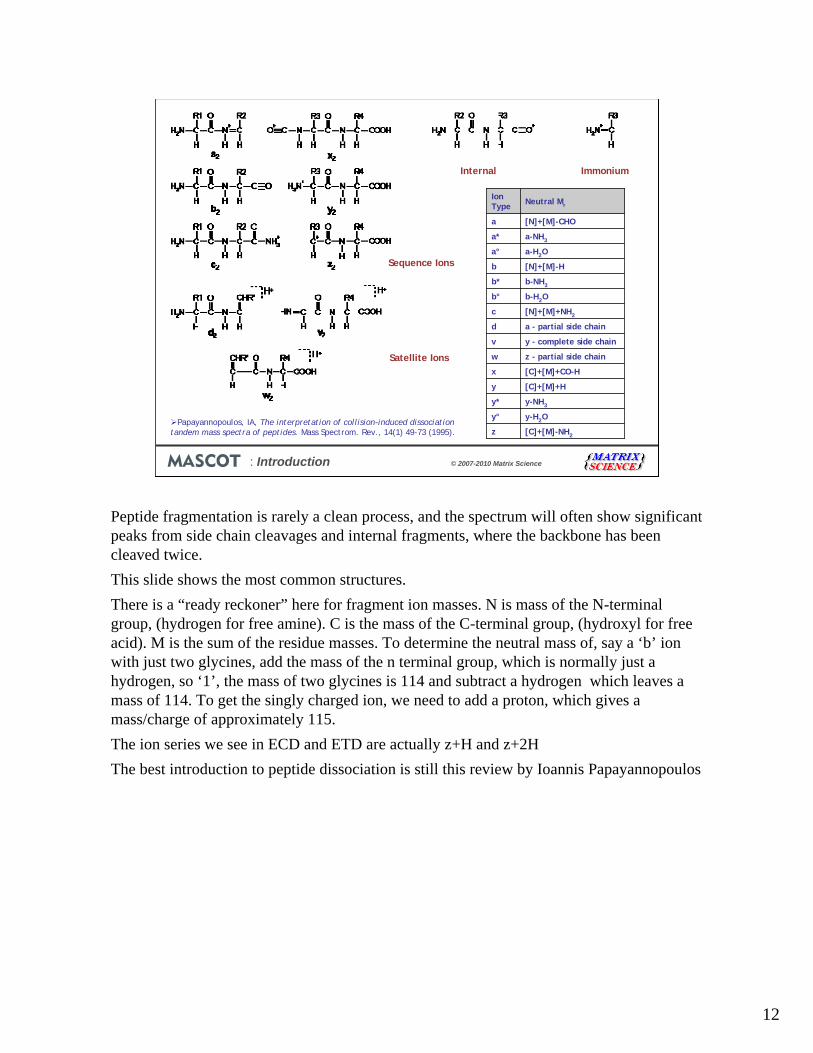
Peptide fragmentation is rarely a clean process, and the spectrum will often show significant peaks from side chain cleavages and internal fragments, where the backbone has been cleaved twice.
This slide shows the most common structures.
There is a “ready reckoner” here for fragment ion masses. N is mass of the N-terminal group, (hydrogen for free amine). C is the mass of the C-terminal group, (hydroxyl for free acid). M is the sum of the residue masses. To determine the neutral mass of, say a ‘b’ ion with just two glycines, add the mass of the n terminal group, which is normally just ahydrogen, so ‘1’, the mass of two glycines is 114 and subtract a hydrogen which leaves a mass of 114. To get the singly charged ion, we need to add a proton, which gives a mass/charge of approximately 115.
The ion series we see in ECD and ETD are actually z+H and z+2H
The best introduction to peptide dissociation is still this review by Ioannis Papayannopoulos
13
: Introduction © 2007-2010 Matrix Science
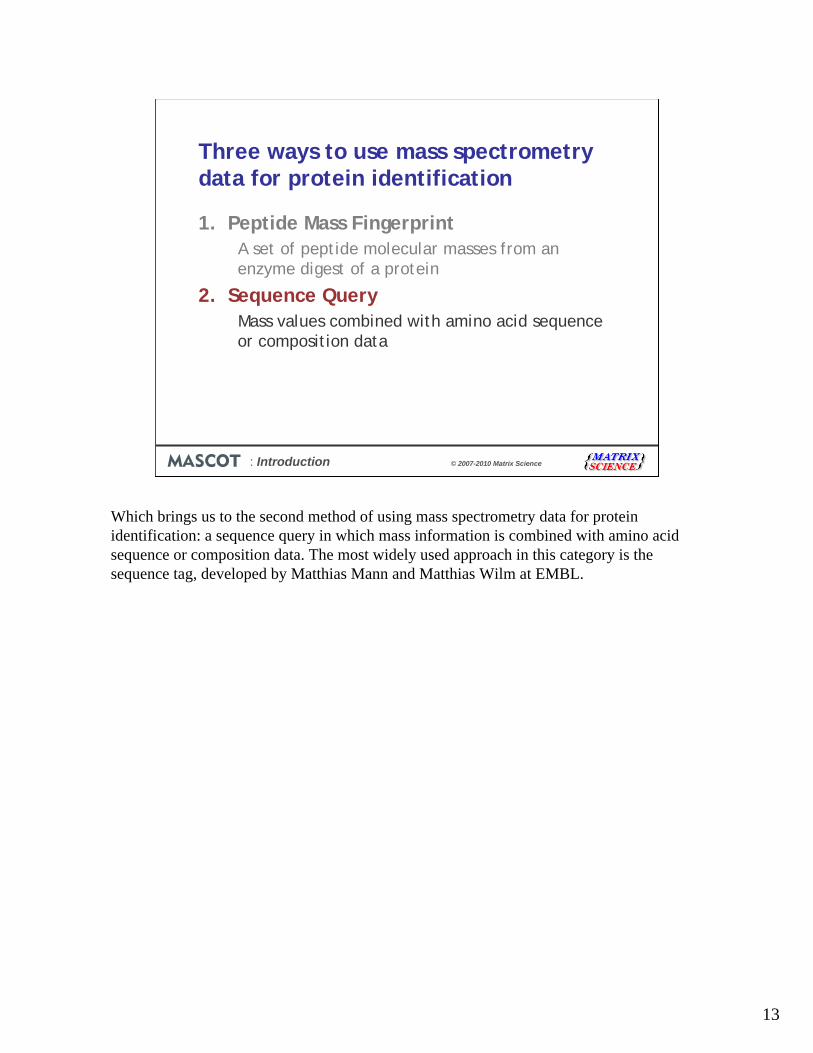
Three ways to use mass spectrometry data for protein identification
1. Peptide Mass FingerprintA set of peptide molecular masses from an enzyme digest of a protein
2. Sequence QueryMass values combined with amino acid sequence or composition data
Which brings us to the second method of using mass spectrometry data for protein identification: a sequence query in which mass information is combined with amino acid sequence or composition data. The most widely used approach in this category is the sequence tag, developed by Matthias Mann and Matthias Wilm at EMBL.

14
: Introduction © 2007-2010 Matrix Science
Mann, M. and Wilm, M., Error-tolerant identification of peptides in sequence databases by peptide sequence tags. Anal. Chem. 66 4390-9 (1994).
In a sequence tag search, a few residues of amino acid sequence are interpreted from the MS/MS spectrum.
Even when the quality of the spectrum is poor, it is often possible to pick out four clean peaks, and read off three residues of sequence. In a sequence homology search, a triplet would be worth almost nothing, since any given triplet can be expected to occur by chance many times in even a small database.
What Mann and Wilm realised was that this very short stretch of amino acid sequence might provide sufficient specificity to provide an unambiguous identification if it was combined with the fragment ion mass values which enclose it, the peptide mass, and the enzyme specificity.
15
: Introduction © 2007-2010 Matrix Science
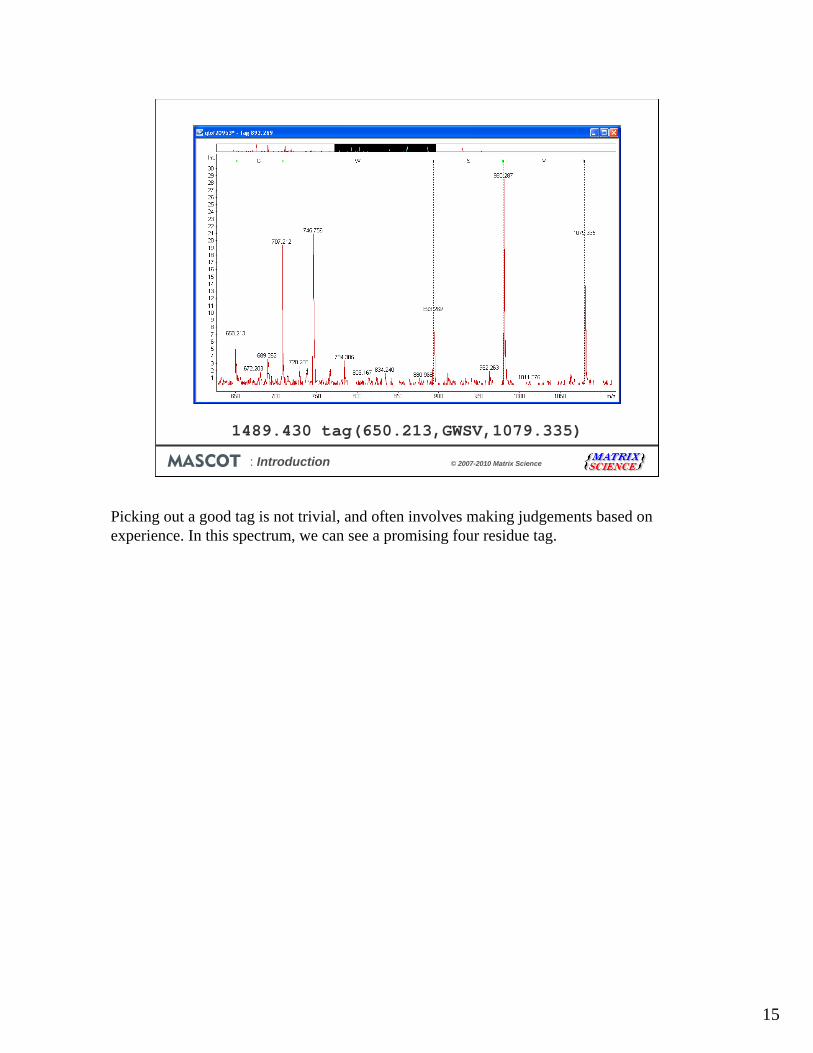
1489.430 tag(650.213,GWSV,1079.335)
Picking out a good tag is not trivial, and often involves making judgements based on experience. In this spectrum, we can see a promising four residue tag.
16
: Introduction © 2007-2010 Matrix Science
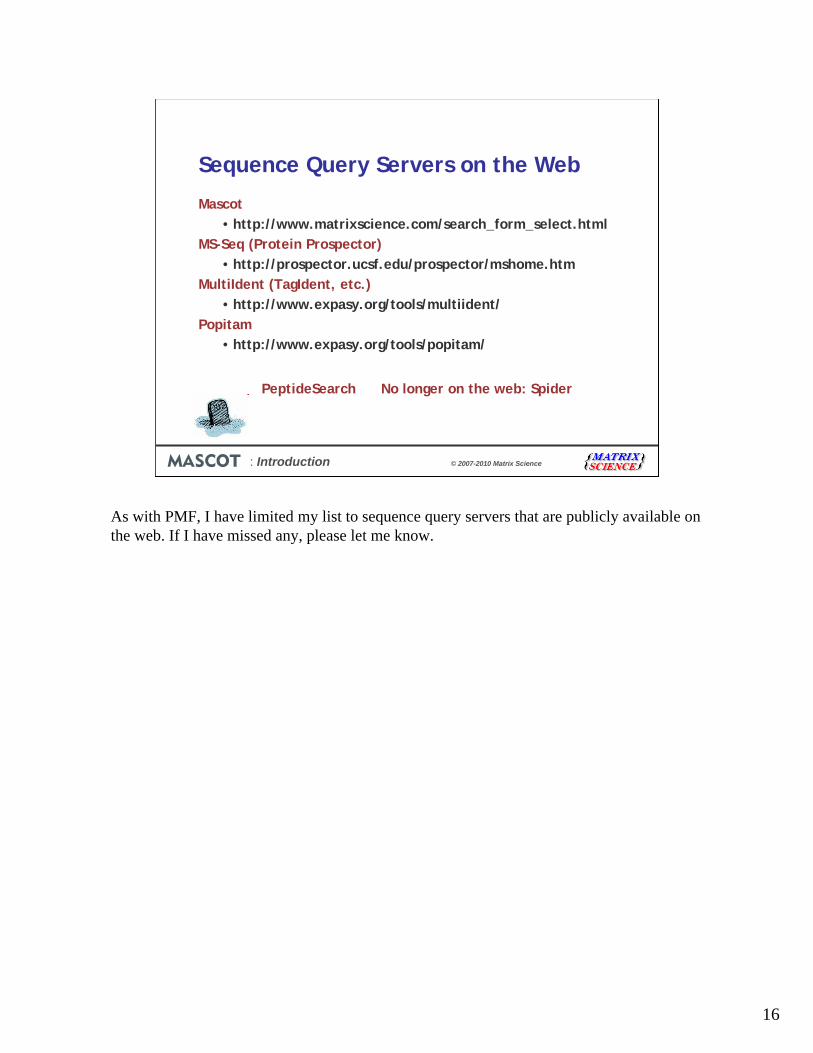
Sequence Query Servers on the Web
Mascot• http://www.matrixscience.com/search_form_select.html
MS-Seq (Protein Prospector)• http://prospector.ucsf.edu/prospector/mshome.htm
MultiIdent (TagIdent, etc.)• http://www.expasy.org/tools/multiident/
Popitam• http://www.expasy.org/tools/popitam/
PeptideSearch No longer on the web: Spider
As with PMF, I have limited my list to sequence query servers that are publicly available on the web. If I have missed any, please let me know.
17
: Introduction © 2007-2010 Matrix Science
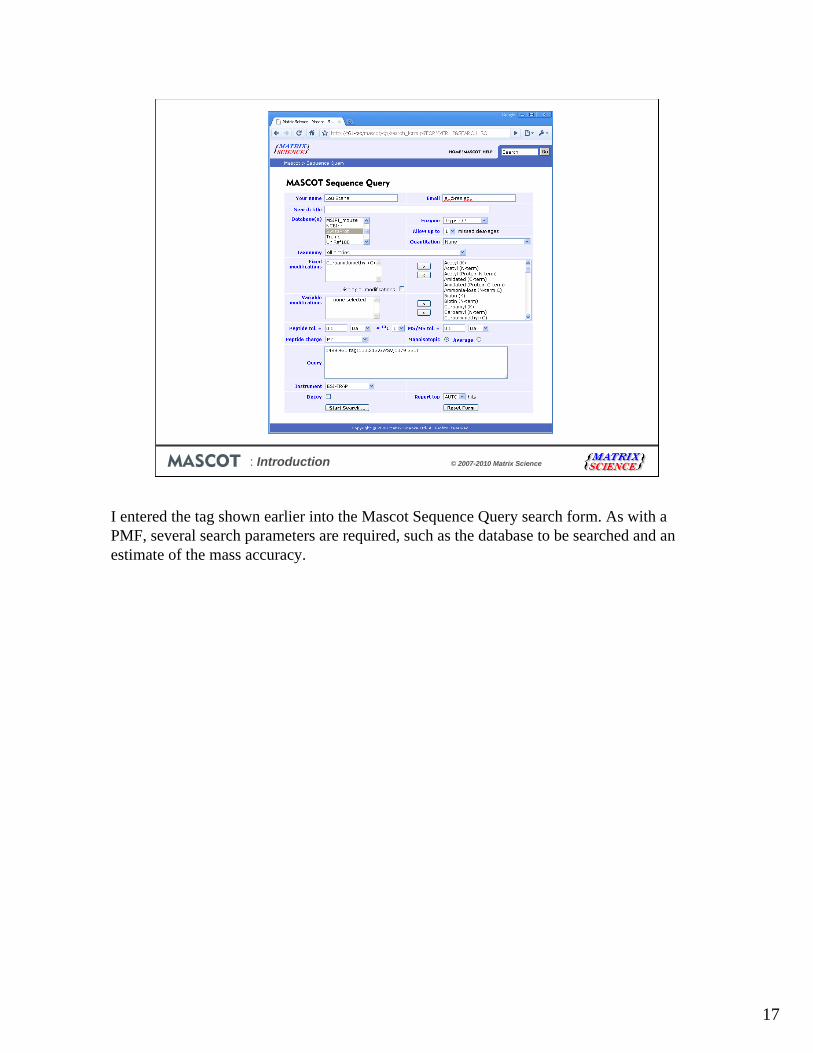
I entered the tag shown earlier into the Mascot Sequence Query search form. As with a PMF, several search parameters are required, such as the database to be searched and an estimate of the mass accuracy.

18
: Introduction © 2007-2010 Matrix Science
This is the result report from the search. There is just one peptide in the database that matches: LQGIVSWGSGCAQK from bovine trypsinogen.
The score is good, but even if it wasn’t, you are on very safe ground accepting any match to trypsin , keratin, or BSA ;-)

19
: Introduction © 2007-2010 Matrix Science
Sequence Tag
Rapid search times•Essentially a filter
Error tolerant•Match peptide with unknown modification or SNP
Requires interpretation of spectrum•Usually manual, hence not high throughput
Tag has to be called correctly•Although ambiguity is OK
2060.78 tag(977.4,[Q|K][Q|K][Q|K]EE,1619.7).
A sequence tag search can be rapid, because it is simply a filter on the database.
Without doubt, the most important advantage of this approach is the so-called “error tolerant” mode. This consists of relaxing the specificity, usually by removing the peptide molecular mass constraint. When this is done, the tag is effectively allowed to float within the candidate sequence, so that a match is possible even if there is a difference in the calculated mass to one side or the other of the tag. This is one of the few ways of getting a match to a peptide when there is an unsuspected modification or a variation in the primary amino acid sequence.
Tags can be called by software. But, in most cases, they are called manually, which requires time and skill.
If the tag is not correct, then no match will be found. With some search engines, ambiguity is OK, as long as it is recognised and the query is formulated correctly. Obviously, I=L and, in most cases, Q=K and F=MetOx. Software or a table of mass values can help identify the more common ambiguities.
20
: Introduction © 2007-2010 Matrix Science
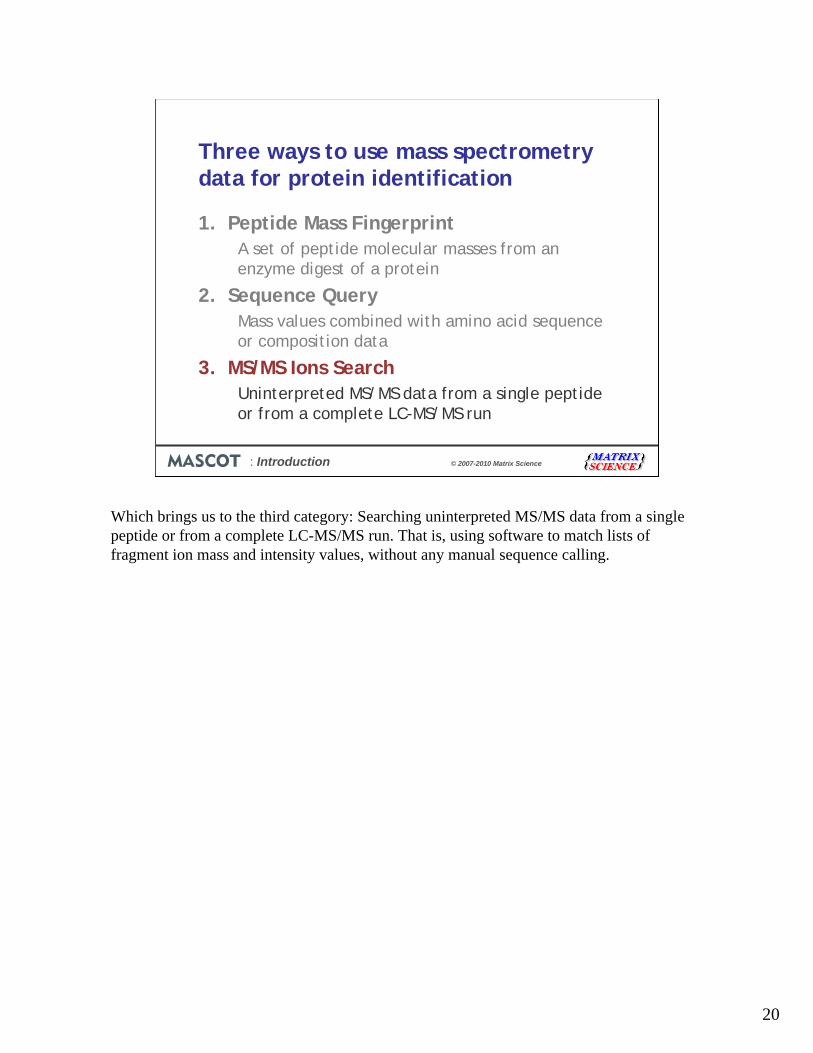
Three ways to use mass spectrometry data for protein identification
1. Peptide Mass FingerprintA set of peptide molecular masses from an enzyme digest of a protein
2. Sequence QueryMass values combined with amino acid sequence or composition data
3. MS/MS Ions SearchUninterpreted MS/MS data from a single peptide or from a complete LC-MS/MS run
Which brings us to the third category: Searching uninterpreted MS/MS data from a single peptide or from a complete LC-MS/MS run. That is, using software to match lists of fragment ion mass and intensity values, without any manual sequence calling.

21
: Introduction © 2007-2010 Matrix Science
Eng, J. K., McCormack, A. L. and Yates, J. R., 3rd., An approach to correlate tandem mass spectral data of peptides with amino acid sequences in a protein database. J. Am. Soc. Mass Spectrom. 5 976-89 (1994)
SEQUEST
This approach was pioneered by John Yates and Jimmy Eng at the University of Washington, Seattle. They used a cross correlation algorithm to compare an experimental MS/MS spectrum against spectra predicted from peptide sequences from a database. Their ideas were implemented as the Sequest program.
22
: Introduction © 2007-2010 Matrix Science
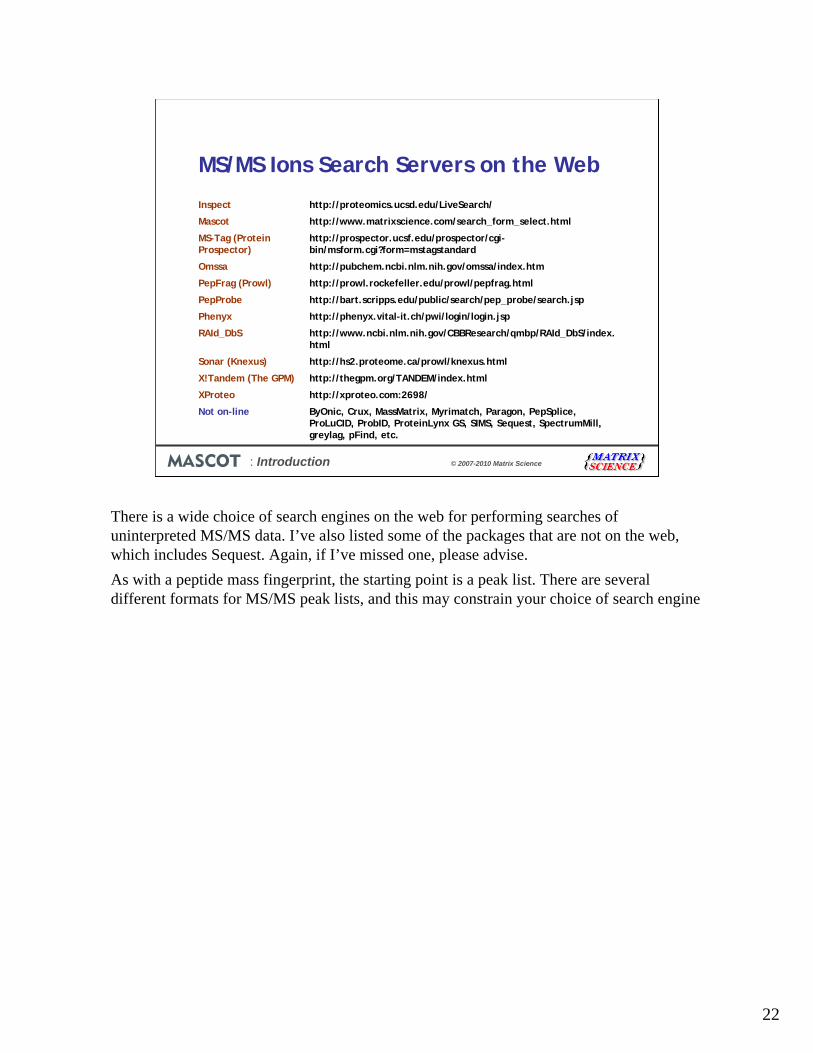
MS/MS Ions Search Servers on the Web
http://proteomics.ucsd.edu/LiveSearch/Inspect
ByOnic, Crux, MassMatrix, Myrimatch, Paragon, PepSplice, ProLuCID, ProbID, ProteinLynx GS, SIMS, Sequest, SpectrumMill, greylag, pFind, etc.
Not on-line
http://xproteo.com:2698/XProteo
http://thegpm.org/TANDEM/index.htmlX!Tandem (The GPM)
http://hs2.proteome.ca/prowl/knexus.htmlSonar (Knexus)
http://www.ncbi.nlm.nih.gov/CBBResearch/qmbp/RAId_DbS/index.html
RAId_DbS
http://phenyx.vital-it.ch/pwi/login/login.jspPhenyx
http://bart.scripps.edu/public/search/pep_probe/search.jspPepProbe
http://prowl.rockefeller.edu/prowl/pepfrag.htmlPepFrag (Prowl)
http://pubchem.ncbi.nlm.nih.gov/omssa/index.htmOmssa
http://prospector.ucsf.edu/prospector/cgi-bin/msform.cgi?form=mstagstandard
MS-Tag (Protein Prospector)
http://www.matrixscience.com/search_form_select.htmlMascot
There is a wide choice of search engines on the web for performing searches of uninterpreted MS/MS data. I’ve also listed some of the packages that are not on the web, which includes Sequest. Again, if I’ve missed one, please advise.
As with a peptide mass fingerprint, the starting point is a peak list. There are several different formats for MS/MS peak lists, and this may constrain your choice of search engine

23
: Introduction © 2007-2010 Matrix Science
This is the search form for an MS/MS search.
As before, you specify the database, mass accuracy, modifications to be considered, etc., and associate the peak list file with the search form.

24
: Introduction © 2007-2010 Matrix Science
The results from this type of search tend to be more complicated to report. This is because the results usually represent a number of MS/MS spectra, rather than a single spectrum. Hence, there is an additional dimension to the data.
For each spectrum, there may be multiple possible peptide matches. Each peptide match may be assignable to multiple proteins. This makes the results more difficult to represent in two dimensions and leads to a wide variety of reporting styles. Mascot uses a pop-up window to show the alternative peptide matches to each spectrum.

25
: Introduction © 2007-2010 Matrix Science
MS/MS Ions Search
Easily automated for high throughputCan get matches from marginal dataCan be slow
No enzymeMany variable modificationsLarge databaseLarge dataset
MS/MS is peptide identificationProteins by inference.
Searching of uninterpreted MS/MS data is readily automated for high throughput work. Most “proteomics pipelines” use this approach.
It offers the possibility of getting useful matches from spectra of marginal quality, where it would not be possible to call a reliable sequence tag.
On the down side, such searches can be slow. Particularly if performed without enzyme specificity or with several variable modifications.
Finally, always remember that it is peptides that are being identified, not proteins. From the peptides that have been identified, we can infer which proteins may have been present.

26
: Introduction © 2007-2010 Matrix Science
20 to 200 mass values
20 to 200 mass values
Information content
Residue level characterisation
Shotgun protein identification
Unique strength
Fragmentation channels
Protein lengthMajor unknown
Gas-phase dissociation
EnzymeCleavage specificity
Single peptide sequence
Single protein sequence
Boundary condition
MS/MSPMF
To complete this overview of the methods of protein identification, I’d like to compare the fundamental characteristics of database searching using MS data versus MS/MS data.
The mass spectrum of a tryptic digest of a protein of average size might contain 50 peptide masses, not dissimilar from the MS/MS spectrum of an average sized tryptic peptide. Thus, the “information content” of the individual spectra is similar. The reason an MS/MS search can be more powerful is mainly that the data set can contain many such spectra, so multiplying the information content. However, at the single spectrum level, there is little to choose.
In a peptide mass fingerprint, the boundary condition is that the peptides all originate from a single protein. In an MS/MS search, the boundary condition is that the fragments all originate from a single peptide. The weakness of the peptide mass fingerprint is that this boundary condition is often violated, and the spectrum actually represents the digest products of a protein mixture. The MS/MS boundary condition can also be violated, when we analyse co-eluting, isobaric peptides. If this happens, and we have a mixture, the MS/MS search is just as likely to fail as the PMF.
In the peptide mass fingerprint, the specificity comes from the predictable cleavage behaviour of the proteolytic enzyme. Thus, we want an enzyme with a low cutting frequency, such as trypsin. In the MS/MS ions search, the specificity comes from the mostly predictable gas-phase fragmentation behaviour of peptide molecular ions.
Arguably, the major strength of PMF is that it really is shotgun protein identification. The higher the coverage, the more confident one can be that the protein in the database is the one in the sample. The unique strength of searching MS/MS data is that one gets residue level information. A good match can reveal the presence and location of post translational modifications, which is not possible with a PMF.

27
: Introduction © 2007-2010 Matrix Science
Further Reading
Even a 2 day course has to skim over a lot of detail. This recent book provides greater depth in some areas that we don’t have time to deal with.