Embed Size (px)
Citation preview

Introduction to Data ScienceGIRI NARASIMHAN, SCIS, FIU

Time Series

CAP 5510 / CGS 5166
Time Series Analysis Applications
! Economic Forecasting ! Sales Forecasting ! Budgetary Analysis ! Stock Market Analysis ! Yield Projections
! Process and Quality Control ! Inventory Studies ! Workload Projections ! Utility Studies ! Census Analysis
11/4/19
!3
https://www.itl.nist.gov/div898/handbook/pmc/section4/pmc4.htm

CAP 5510 / CGS 5166
Average as an EstimateSuppl $ Error ES
1 9 -1 12 8 -2 43 9 -1 14 12 2 45 9 -1 16 12 2 47 11 1 18 7 -3 99 13 3 910 9 -1 111 11 1 112 10 0 0
Avg Est
7 9 10 12
SSE 144 48 36 84MSE 12 4 3 7
11/4/19
!4
" Is Average a good estimate? " Yes, it minimizes Mean
Square Error (MSE)

CAP 5510 / CGS 5166
Is Average a good predictor?
! Simple average is a bad predictor ❑ Example on right: average
does not show trend nor predict future
11/4/19
!5
CAP 5510 / CGS 5166
Moving Average vs Average
! Window size = 3 ! MSE = 3.0 ! Moving MSE = 2.42 ! Moving Average (MA) has
lower error than Average
11/4/19
!6
Suppl $ MA Error ES1 9 2 8
3 9 8.667 0.333 0.111
4 12 9.667 2.333 5.444
5 9 10.000 -1.000 1.000
6 12 11.000 1.000 1.000
7 11 10.667 0.333 0.111
8 7 10.000 -3.000 9.000
9 13 10.333 2.667 7.111
10 9 9.667 -0.667 0.444
11 11 11.000 0 0
12 10 10.000 0 0

CAP 5510 / CGS 5166
Double Moving Averages
! Compute moving average of moving average using same window size
! Errors can be reduced further
! Do a linear regression with single and double MA to forecast
11/4/19
!7
CAP 5510 / CGS 5166
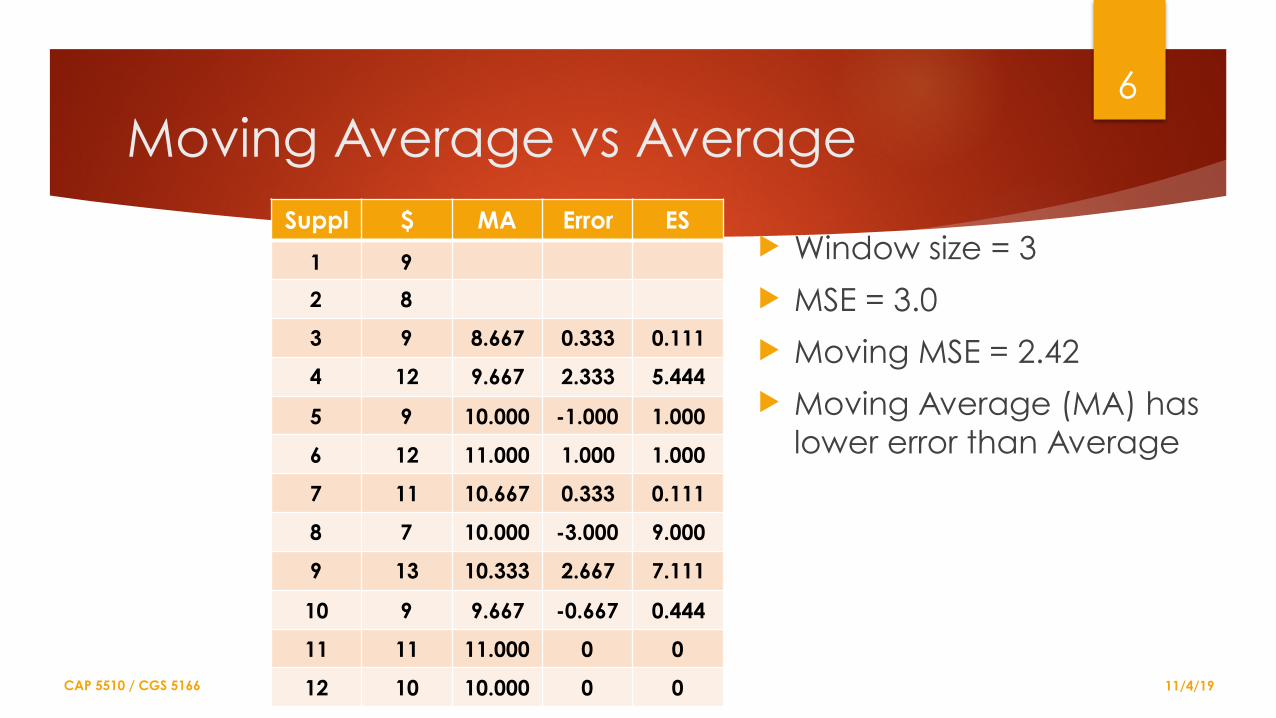
Exponential Smoothing
! MA gives equal weight to all items in window
! Exp Smoothing assigns exponentially decreasing weights for older items
11/4/19
!8

CAP 5510 / CGS 5166
Smoothing/Averaging/Filtering
! Need to remove natural variations in data ! Shows trends unhindered by local variations
11/4/19
!9
CAP 5510 / CGS 5166
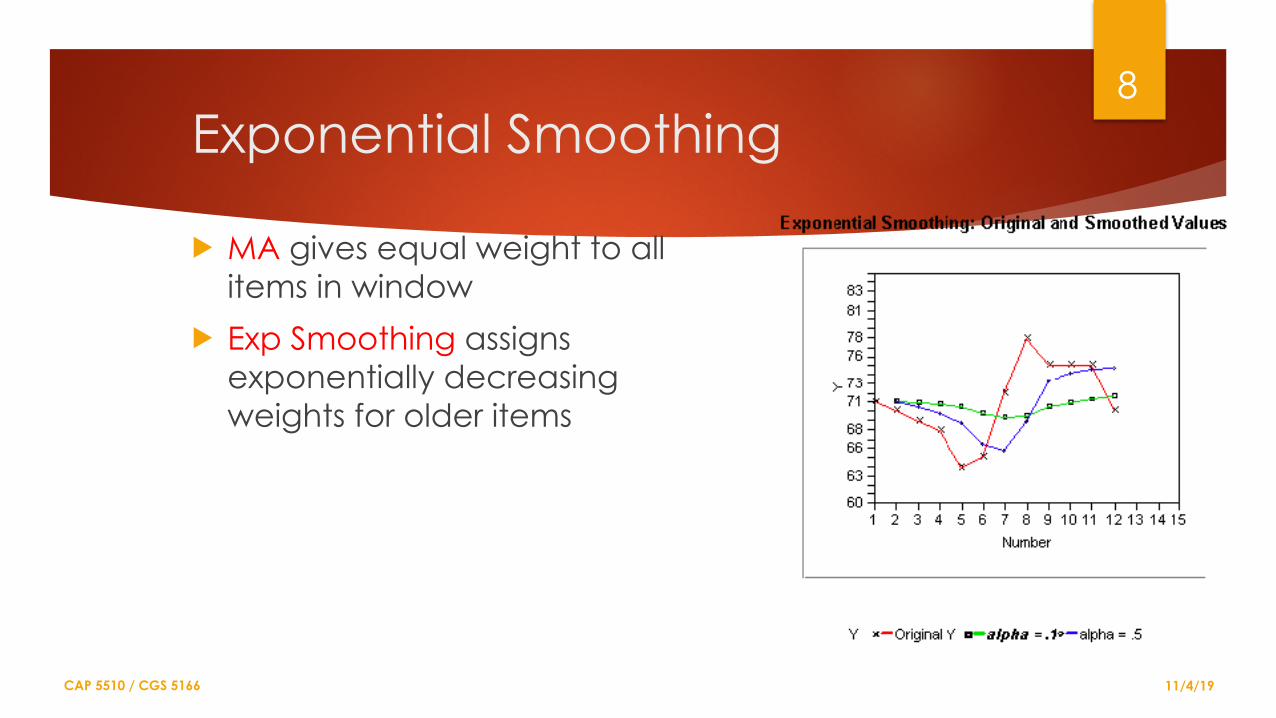
Smoothing and Forecasting
! Exponential Smoothing ❑ (y1, y2, …, yn) = sequence of observations
❑ (S1, S2, …, Sn) = smoothed observations
❑ St = ⍺ yt-1 + (1- ⍺)St-1
! Forecasting ❑ St+1 = St + ⍺⍷t
❑ where ⍷t is the forecast error
! More complex forecasting
11/4/19
!10

CAP 5510 / CGS 5166
Analysis
! Check for stationarity ! Check for Trends (seasonality) ! Check for non-constant variance
❑ Trends in transformed data ▪ Log transform
! Check for Randomness ❑ Autocorrelation plots
11/4/19
!11
CAP 5510 / CGS 5166
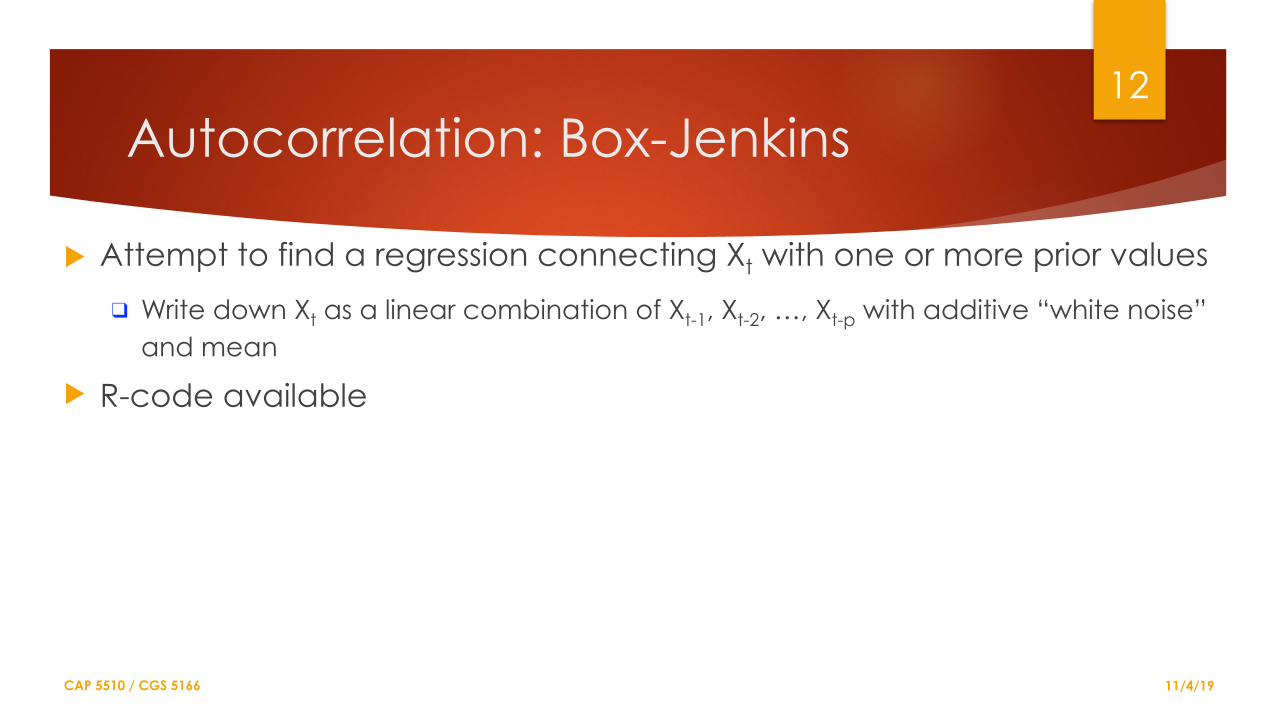
Autocorrelation: Box-Jenkins
! Attempt to find a regression connecting Xt with one or more prior values ❑ Write down Xt as a linear combination of Xt-1, Xt-2, …, Xt-p with additive “white noise”
and mean
! R-code available
11/4/19
!12
Giri Narasimhan
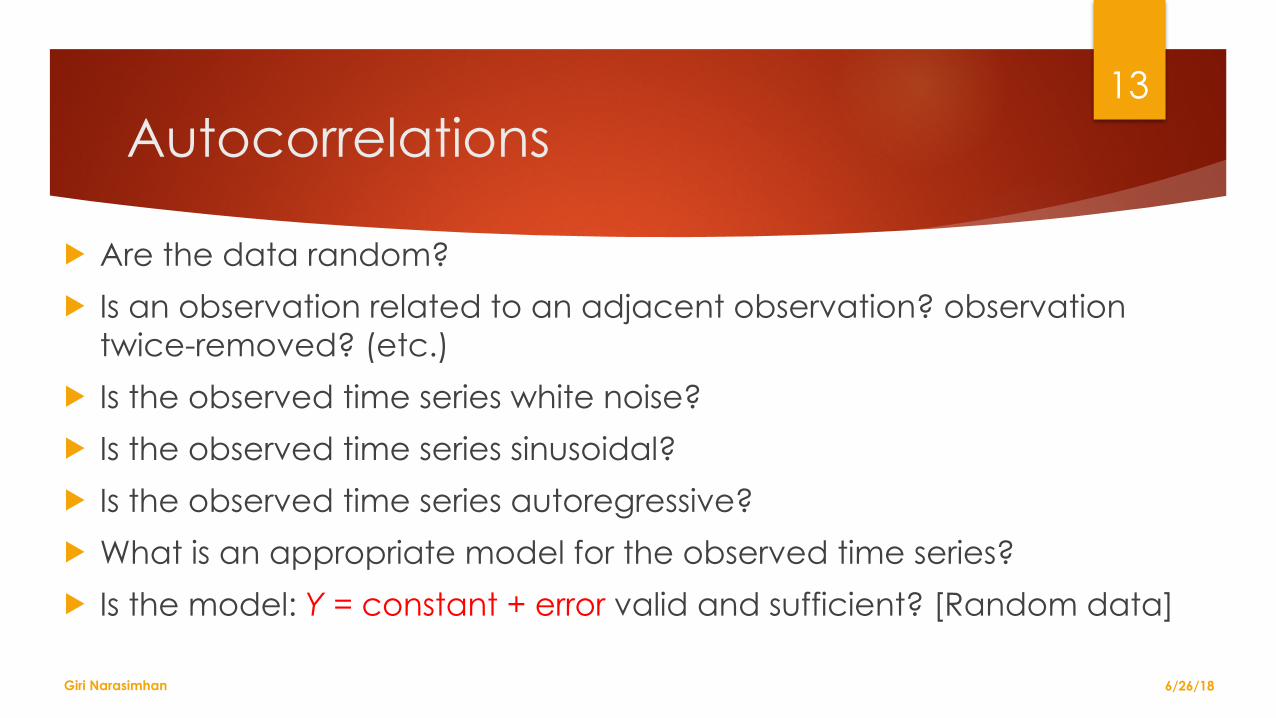
Autocorrelations
! Are the data random? ! Is an observation related to an adjacent observation? observation
twice-removed? (etc.) ! Is the observed time series white noise? ! Is the observed time series sinusoidal? ! Is the observed time series autoregressive? ! What is an appropriate model for the observed time series? ! Is the model: Y = constant + error valid and sufficient? [Random data]
6/26/18
!13

Giri Narasimhan
Sinusoidal curves
! The data come from an underlying sinusoidal model.
! Note alternating sequence of positive and negative spikes.
! Spikes are not decaying.
6/26/18
!14

Giri Narasimhan 6/26/18
!15
CAP 5510 / CGS 5166
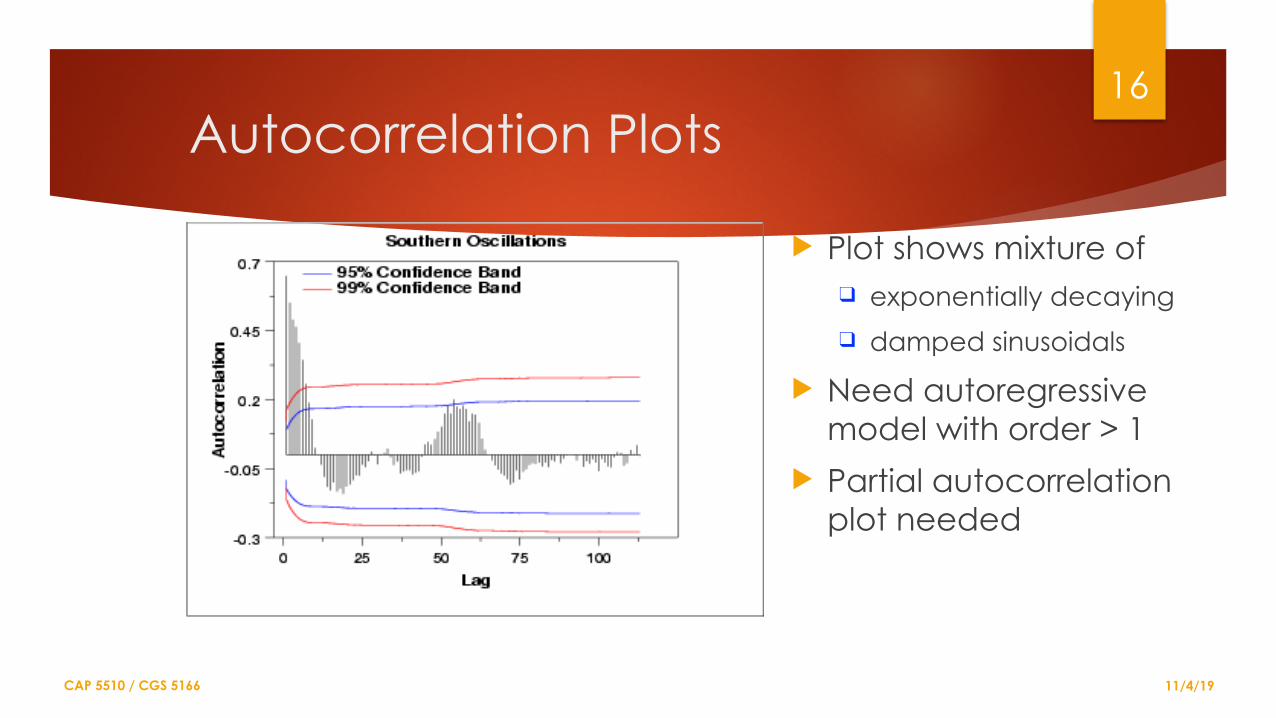
Autocorrelation Plots
! Plot shows mixture of ❑ exponentially decaying ❑ damped sinusoidals
! Need autoregressive model with order > 1
! Partial autocorrelation plot needed
11/4/19
!16

Giri Narasimhan
Interpreting patterns
6/26/18
!17
Pattern What the pattern indicates Example
Large spike at lag 1 that decreases after a few lags.
An autoregressive term in the data. Use the partial autocorrelation function to determine the order of the autoregressive term.
Large spike at lag 1 followed by a decreasing wave that alternates between positive and negative correlations.
A higher order autoregressive term in the data. Use the partial autocorrelation function to determine the order of the autoregressive term.
Significant correlations at the first or second lag, followed by correlations that are not significant.
A moving average term in the data. The number of significant correlations indicates the order of the moving average term.

CAP 5510 / CGS 5166
Spectral Plots
! Useful to analyze plots with complex cyclical structures
11/4/19
!18

OutliersFROM JOHNSON & WICHERN, APPLIED MULTIVARIATE STATISTICAL ANALYSIS, 6TH ED

CAP 5510 / CGS 5166
Canadian Hockey
! Kids trained early; Leagues for age groups ! Most talented get on Major Jr A league team& compete for
Memorial Cup ! What makes a top-notch hockey player? ! Soccer, Baseball, Cricket, Swimming, Gymnastics
11/4/19
!20

CAP 5510 / CGS 5166 11/4/19
!21
Jan 8 Feb 3 Mar 3 Apr 3
May 2 Jun 1 Jul Aug 2
Sep 1 Oct 1 Nov Dec 1

CAP 5510 / CGS 5166 11/4/19
!22

CAP 5510 / CGS 5166
Canadian Hockey Players
! Cutoff birthdate is the key ! Only accept kids who are not yet 10 on Jan 1 ! January Kids matured almost one extra year over December kids
11/4/19
!23

CAP 5510 / CGS 5166
Detecting Outliers
! Visual detection
! Harder in multivariate case. Why? ❑ May be univariate or multivariate outlier
11/4/19
!24

CAP 5510 / CGS 5166
Bivariate Outliers
11/4/19
!25

CAP 5510 / CGS 5166
Multivariate Outliers
! Some outliers are hard to detect ! Look for large values of
❑
11/4/19
!26

CAP 5510 / CGS 5166
! p variables ! n items/samples
11/4/19
!27

CAP 5510 / CGS 5166
Sample Covariance & Correlation
11/4/19
!28

CAP 5510 / CGS 5166
Basic Descriptive Statistics
11/4/19
!29

CAP 5510 / CGS 5166
Outlier detection
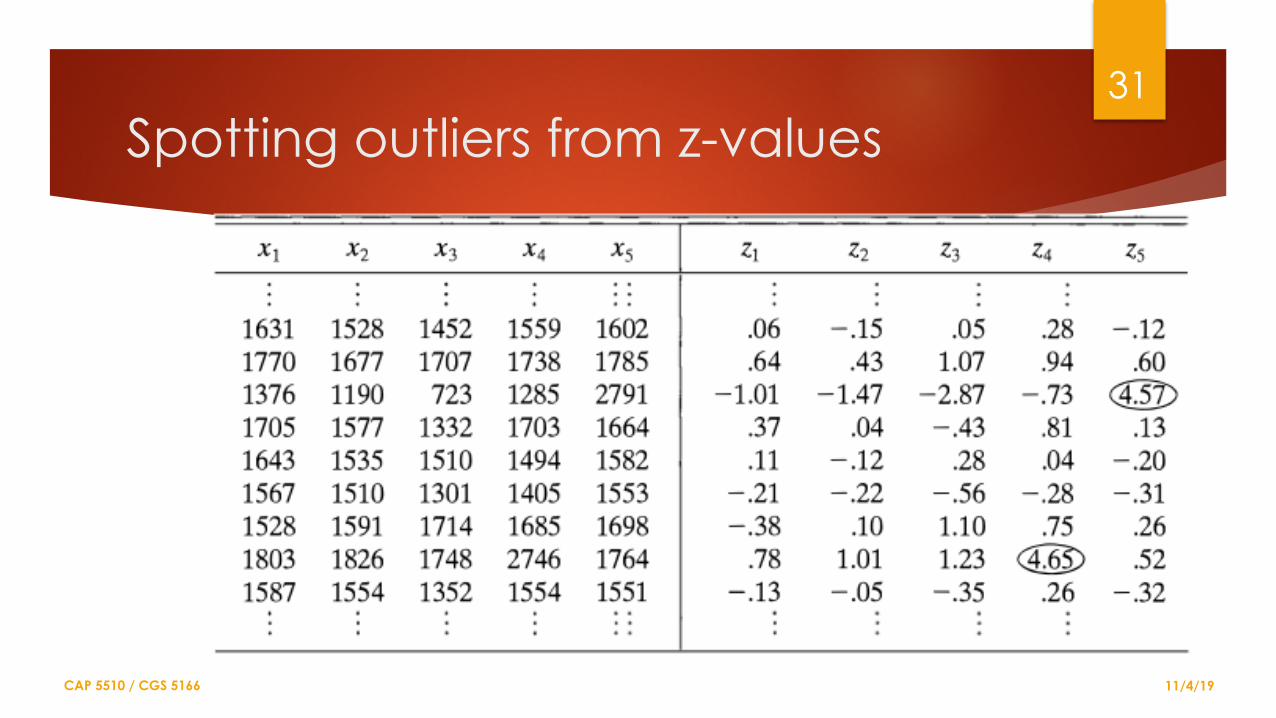
! Dot plots for each variable ! Scatter plot for each pair of variables ! Calculate z-values and examine for outliers
! Calculate gen sq distances & look for outliers
11/4/19
!30
CAP 5510 / CGS 5166
Spotting outliers from z-values
11/4/19
!31

CAP 5510 / CGS 5166
Spotting outliers from Gen. Distance values
11/4/19
!32

CAP 5510 / CGS 5166
Harder to spot them on scatter plots!
11/4/19
!33

CAP 5510 / CGS 5166
Other Transforms for Normality
11/4/19
!34
CAP 5510 / CGS 5166 11/4/19
!35