Embed Size (px)
Citation preview
1/21/2009
1
Introduction to Data Mining
Dr. Hui XiongRutgers University
Questions ?
• Instructor: Dr. Hui Xiong
• Office Hours: Ackerson 200K Wednesday 11:00AM‐12:00pm
• Office Phone: 973‐353‐5261
Email: [email protected]: http://datamining.rutgers.edu
1/21/2009
2
Required Textbook
Pang‐Ning Tan, Michael Steinbach, Vipin Kumar, Addison Wesley, ISBN: 0‐321‐32136‐7, 2005.
Course Objectives
• To teach the fundamental concepts of data mining
• To provide hands‐on experience in applying the concepts to real‐world applications.applications.

1/21/2009
3
Course Web Sitehttp://datamining.rutgers.edu/teaching/spring2009/DM/685.htmlp g• This web site is the location for course documents, assignments, announcements and other information. You should check it frequently to remain updated.
• Note that You are responsible for keeping aware of the announcements at the course web site.
Grading Policy
In-class work (including attendance) 10%A i t 20%Assignments 20%Projects 20%Exam I 25%Exam II 25%
N t th t th fi l l tt d i b dNote that the final letter grade is based on a curve.
1/21/2009
4
Attendance
Regular attendance is compulsory You areRegular attendance is compulsory. You are not allowed to check your emails, access Web sites not related to the course or work on something that is beyond the scope of this course during the class time.
Assignments
You may have discussions with your y yclass members, but you have to submit your own work. Please be sure to keep a copy of the assignment by yourself in case that there is any problem with your hand-in or you have to use it later this semester. y
Assignments have to be submitted before the beginning of the class on the specified due day. No late submissions will be accepted. For assignments and project reports, you are
1/21/2009
5
ExamsThere will be no make-up exams. You are required to present a written proof forrequired to present a written proof for situations, such as going to an emergency room due to unexpected and serious illness.
Chatting during the exam is not allowed. No collaboration between class members will becollaboration between class members will be allowed during any exam. There will be no extra-credit project.
Scholastic Dishonesty Policy
The University defines academic dishonesty as cheating, plagiarism,
unauthorized collaboration, falsifying academic records, and any act
designed to avoid participating honestly in the learning process.
Scholastic dishonesty also includes, but not limited to, providing false or
misleading information to receive a postponement or an extension on
assignments, and submission of essentially the same written assignment
for two different courses without the permission of faculty members.
The purpose of assignments is to provide individual feedback as wellto get you thinking. Interaction for the purpose of understanding aproblem is not considered cheating and will be encouraged. However,the actual solution to problems must be one’s own.
1/21/2009
6
Helpful Comments
To get full benefit out of the class youhave to work regularly Read thehave to work regularly. Read thetextbook regularly and start working onthe assignments soon after they arehanded out. Plan to spend at least 15hours a week on this class doingassignments or reading.
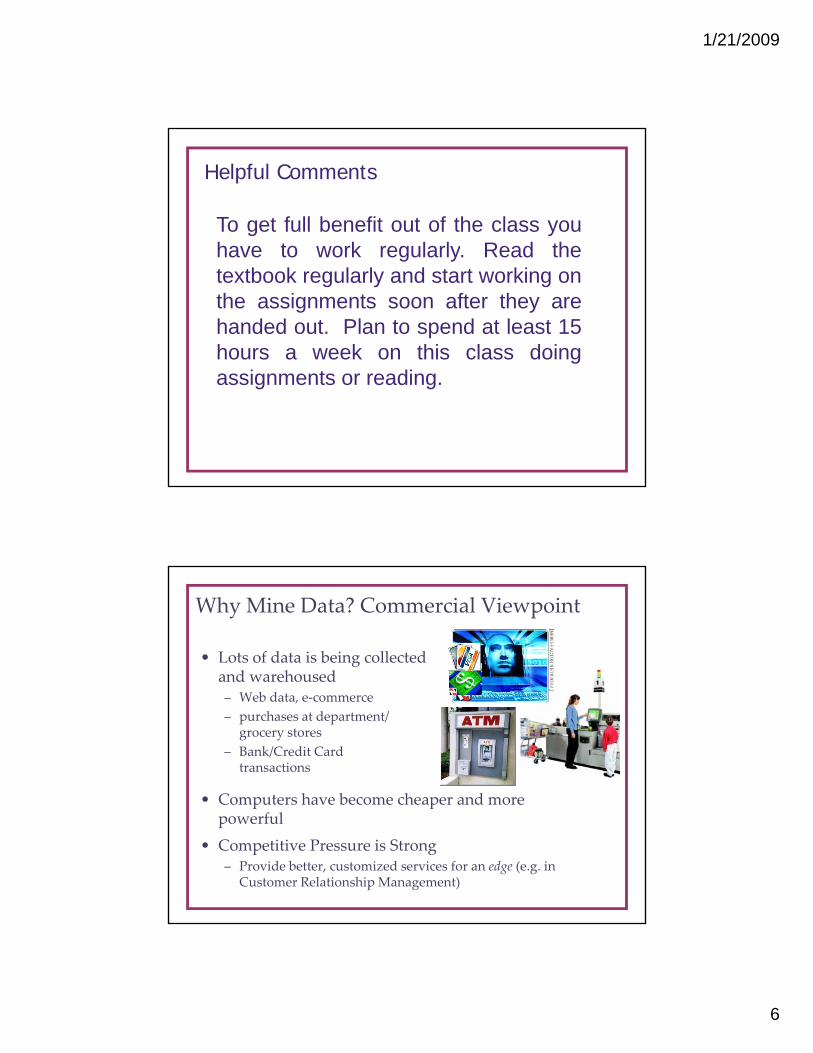
• Lots of data is being collected and warehoused
Why Mine Data? Commercial Viewpoint
– Web data, e‐commerce– purchases at department/
grocery stores– Bank/Credit Card
transactions
• Computers have become cheaper and more Co pu e s a e eco e c eape a o epowerful
• Competitive Pressure is Strong – Provide better, customized services for an edge (e.g. in
Customer Relationship Management)

1/21/2009
7
Why Mine Data? Scientific Viewpoint• Data collected and stored at
enormous speeds (GB/hour)– remote sensors on a satellite– telescopes scanning the skies– microarrays generating gene
expression data– scientific simulations
generating terabytes of data
• Traditional techniques infeasible forTraditional techniques infeasible for raw data
• Data mining may help scientists – in classifying and segmenting data– in Hypothesis Formation
Mining Large Data Sets ‐Motivation• There is often information “hidden” in the data that is not readily evident
• Human analysts may take weeks to discover useful informationinformation
• Much of the data is never analyzed at all
2,000,000
2,500,000
3,000,000
3,500,000
4,000,000
The Data Gap
0
500,000
1,000,000
1,500,000
1995 1996 1997 1998 1999
Total new disk (TB) since 1995 Number of
analysts
From: R. Grossman, C. Kamath, V. Kumar, “Data Mining for Scientific and Engineering Applications”

1/21/2009
8
Scale of DataOrganization Scale of Data
Walmart ~ 20 million transactions/dayGoogle 8 2 billion Web pagesGoogle ~ 8.2 billion Web pagesYahoo ~10 GB Web data/hrNASA satellites ~ 1.2 TB/dayNCBI GenBank ~ 22 million genetic sequencesFrance Telecom 29.2 TBUK Land Registry 18.3 TBAT&T Corp 26.2 TB
“The great strength of computers is that they can reliably manipulate vast amounts of data very quickly. Their great weakness is that they
don’t have a clue as to what any of that data actually means”(S. Cass, IEEE Spectrum, Jan 2004)
Why Do We Need Data Mining ?• Leverage organization’s data assets
– Only a small portion (typically ‐ 5%‐10%) of the ll d d i l dcollected data is ever analyzed
– Data that may never be analyzed continues to be collected, at a great expense, out of fear that something which may prove important in the future is missing.
– Growth rates of data precludes traditionalGrowth rates of data precludes traditional “manually intensive” approach

1/21/2009
9
Why Do We Need Data Mining?
• As databases grow, the ability to support the decision support process using traditional query languages pp p g q y g gbecomes infeasible– Many queries of interest are difficult to state in a query language (Query formulation problem)
– “find all cases of fraud”– “find all individuals likely to buy a FORD expedition”
– “find all documents that are similar to this customers problem”
(Latitude, Longitude)1
What is Data Mining?
•Many Definitions– Non‐trivial extraction of implicit, previously unknown and
potentially useful information from datap y– Exploration & analysis, by automatic or semi‐automatic
means, of large quantities of data in order to discover meaningful patterns
1/21/2009
10
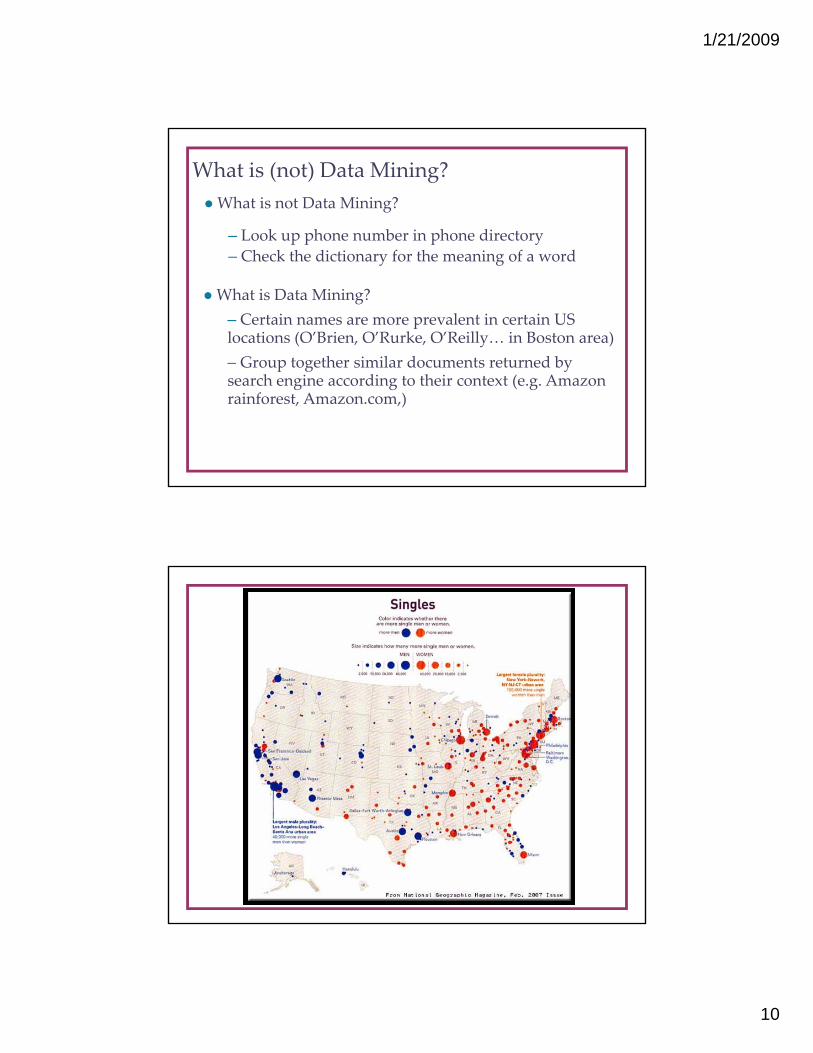
What is (not) Data Mining?What is not Data Mining?
– Look up phone number in phone directory
What is Data Mining?– Certain names are more prevalent in certain US locations (O’Brien, O’Rurke, O’Reilly… in Boston area)– Group together similar documents returned by
– Check the dictionary for the meaning of a word
Group together similar documents returned by search engine according to their context (e.g. Amazon rainforest, Amazon.com,)
1/21/2009
11
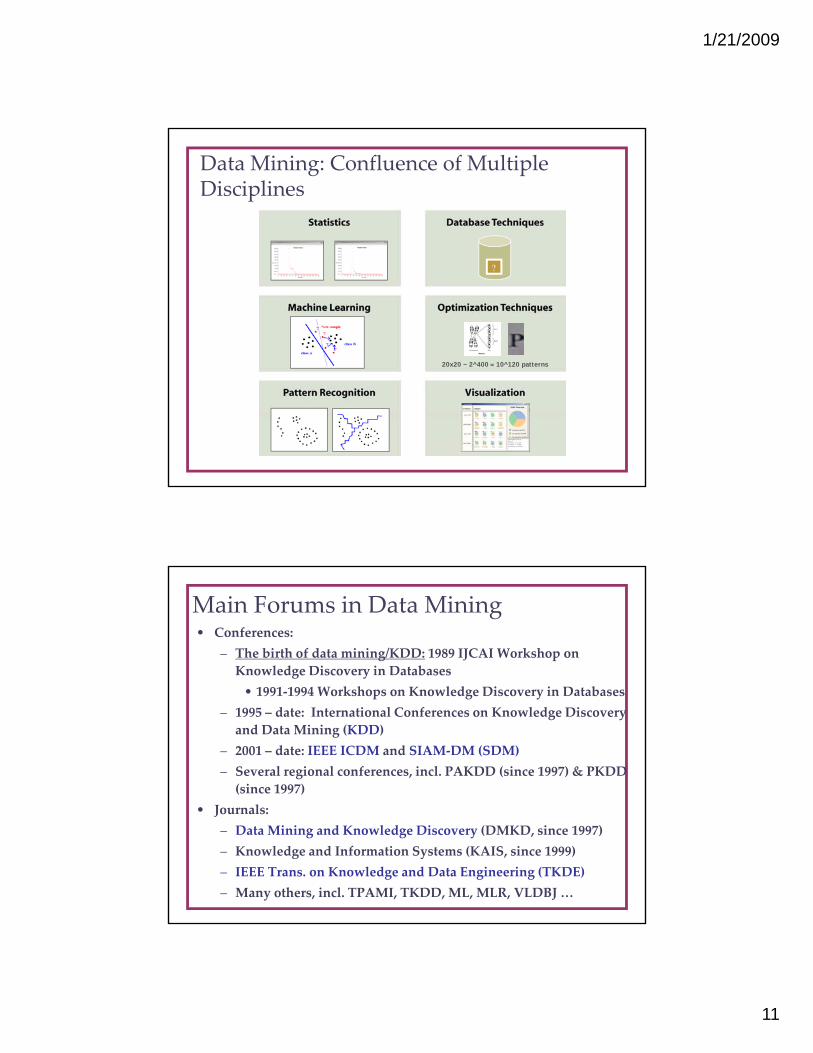
Data Mining: Confluence of Multiple Disciplines
?
20x20 ~ 2^400 ≈ 10^120 patternsp
Main Forums in Data Mining • Conferences:
– The birth of data mining/KDD: 1989 IJCAI Workshop on Knowledge Discovery in Databases • 1991‐1994 Workshops on Knowledge Discovery in Databases
– 1995 – date: International Conferences on Knowledge Discovery and Data Mining (KDD)
– 2001 – date: IEEE ICDM and SIAM‐DM (SDM)– Several regional conferences, incl. PAKDD (since 1997) & PKDD (since 1997)
J l• Journals:– Data Mining and Knowledge Discovery (DMKD, since 1997)– Knowledge and Information Systems (KAIS, since 1999)– IEEE Trans. on Knowledge and Data Engineering (TKDE)– Many others, incl. TPAMI, TKDD, ML, MLR, VLDBJ …
1/21/2009
12
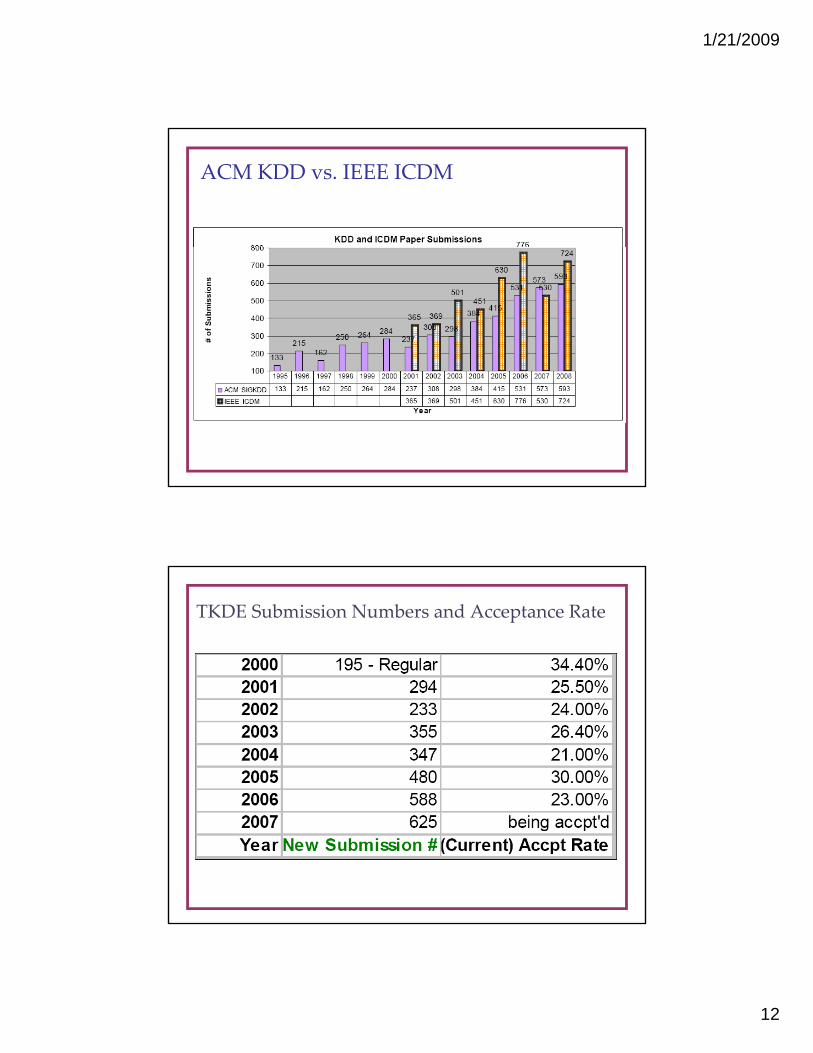
ACM KDD vs. IEEE ICDM
TKDE Submission Numbers and Acceptance Rate
1/21/2009
13
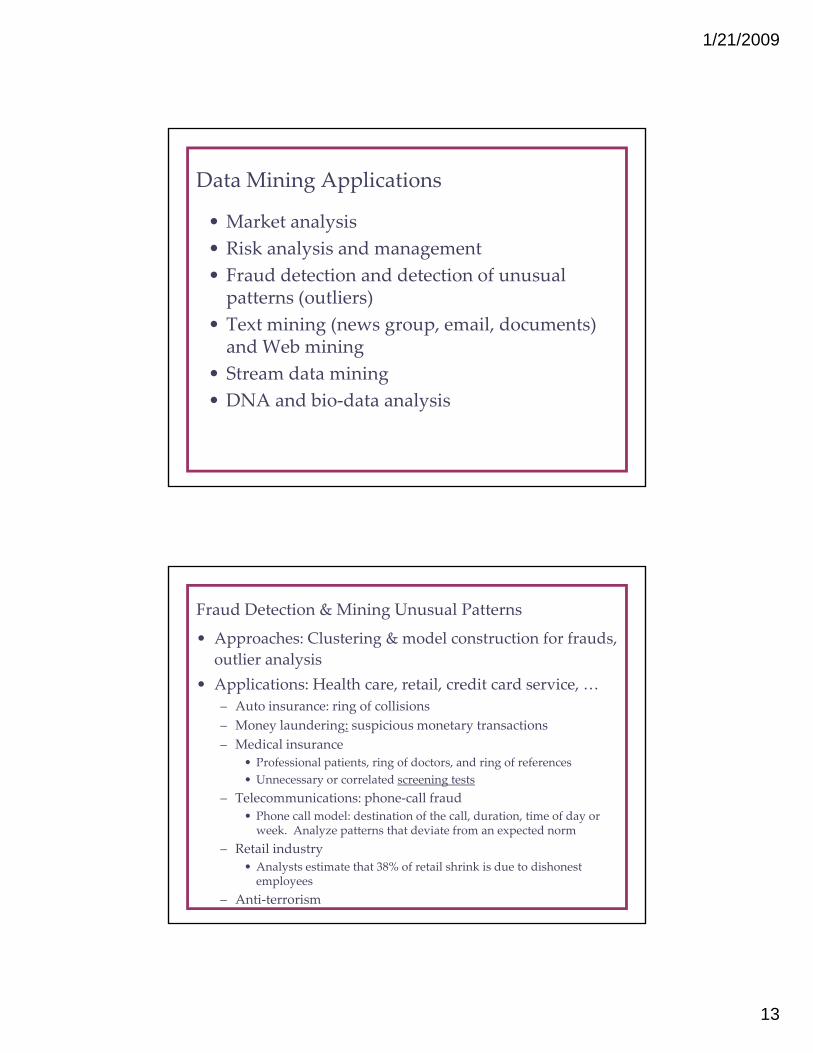
Data Mining Applications
• Market analysis• Risk analysis and management• Risk analysis and management• Fraud detection and detection of unusual patterns (outliers)
• Text mining (news group, email, documents) and Web miningS d i i• Stream data mining
• DNA and bio‐data analysis
Fraud Detection & Mining Unusual Patterns
• Approaches: Clustering & model construction for frauds, outlier analysis
• Applications: Health care retail credit card service• Applications: Health care, retail, credit card service, …– Auto insurance: ring of collisions – Money laundering: suspicious monetary transactions – Medical insurance
• Professional patients, ring of doctors, and ring of references• Unnecessary or correlated screening tests
– Telecommunications: phone‐call fraudp• Phone call model: destination of the call, duration, time of day or week. Analyze patterns that deviate from an expected norm
– Retail industry• Analysts estimate that 38% of retail shrink is due to dishonest employees
– Anti‐terrorism
1/21/2009
14
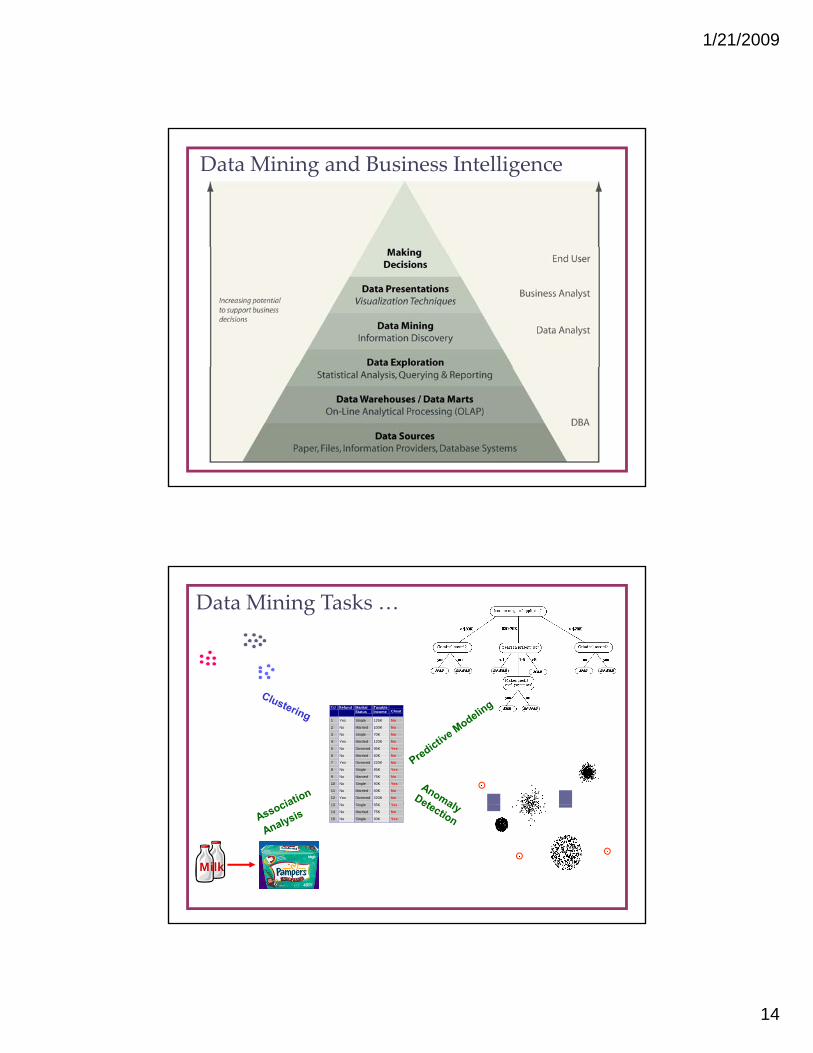
Data Mining and Business Intelligence
Data Mining Tasks …
Tid Refund Marital Status
Taxable Income Cheat
1 Yes Single 125K No
2 No Married 100K No
3 No Single 70K No
4 Yes Married 120K No
5 No Divorced 95K Yes
6 No Married 60K No
7 Yes Divorced 220K No
8 No Single 85K Yes
9 No Married 75K No
10 No Single 90K Yes
11 No Married 60K No
12 Yes Divorced 220K No
13 No Single 85K Yes
Data
13 No Single 85K Yes
14 No Married 75K No
15 No Single 90K Yes 10
Milk
1/21/2009
15
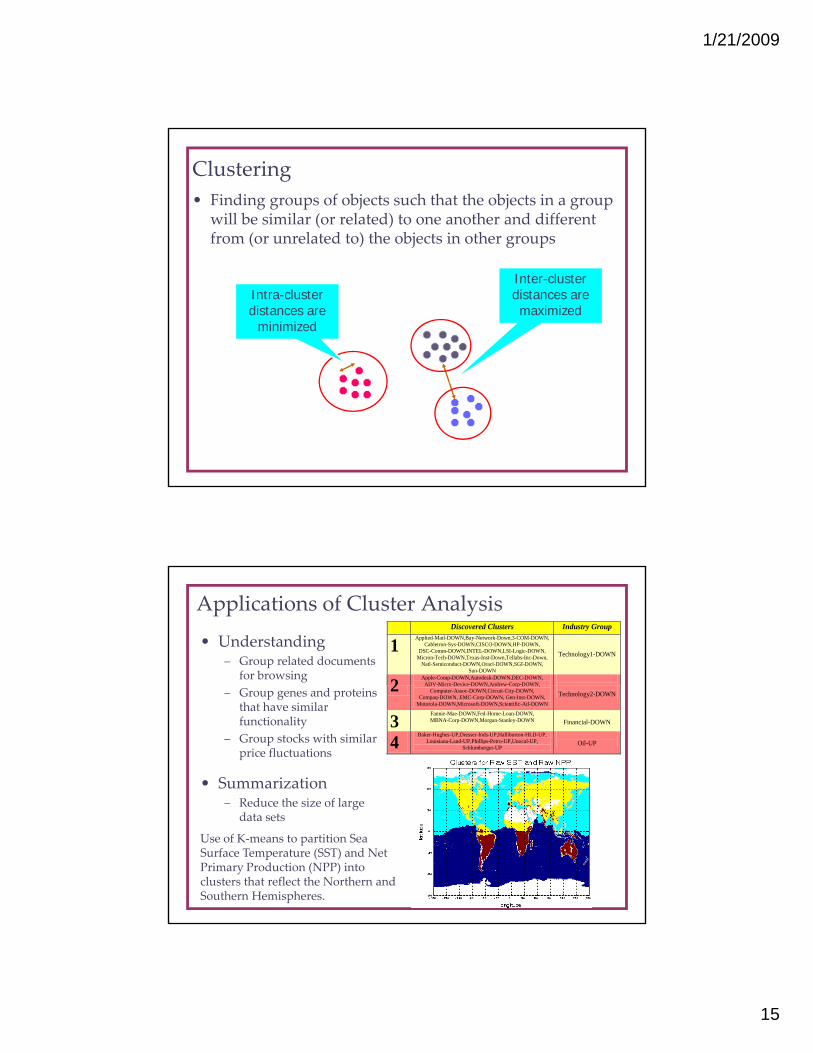
• Finding groups of objects such that the objects in a group will be similar (or related) to one another and different from (or unrelated to) the objects in other groups
Clustering
j g p
Inter-cluster distances are maximized
Intra-cluster distances are
minimized
• Understanding– Group related documents
for browsing
Discovered Clusters Industry Group
1 Applied-Matl-DOWN,Bay-Network-Down,3-COM-DOWN, Cabletron-Sys-DOWN,CISCO-DOWN,HP-DOWN,
DSC-Comm-DOWN,INTEL-DOWN,LSI-Logic-DOWN, Micron-Tech-DOWN,Texas-Inst-Down,Tellabs-Inc-Down,
Natl-Semiconduct-DOWN,Oracl-DOWN,SGI-DOWN, Sun-DOWN
Technology1-DOWN
2 Apple-Comp-DOWN,Autodesk-DOWN,DEC-DOWN, ADV-Micro-Device-DOWN Andrew-Corp-DOWN
Applications of Cluster Analysis
– Group genes and proteins that have similar functionality
– Group stocks with similar price fluctuations
• Summarization– Reduce the size of large
2 ADV Micro Device DOWN,Andrew Corp DOWN,Computer-Assoc-DOWN,Circuit-City-DOWN,
Compaq-DOWN, EMC-Corp-DOWN, Gen-Inst-DOWN, Motorola-DOWN,Microsoft-DOWN,Scientific-Atl-DOWN
Technology2-DOWN
3 Fannie-Mae-DOWN,Fed-Home-Loan-DOWN, MBNA-Corp-DOWN,Morgan-Stanley-DOWN
Financial-DOWN
4 Baker-Hughes-UP,Dresser-Inds-UP,Halliburton-HLD-UP, Louisiana-Land-UP,Phillips-Petro-UP,Unocal-UP,
Schlumberger-UP
Oil-UP
Reduce the size of large data sets
Use of K‐means to partition Sea Surface Temperature (SST) and Net Primary Production (NPP) into clusters that reflect the Northern and Southern Hemispheres.
1/21/2009
16
Clustering: Application 1
• Market Segmentation:– Goal: subdivide a market into distinct subsets of customers oa u i i e a a e i o i i u e o u o e
where any subset may conceivably be selected as a market target to be reached with a distinct marketing mix.
– Approach:• Collect different attributes of customers based on their
geographical and lifestyle related information.• Find clusters of similar customers.• Measure the clustering quality by observing buying
tt f t i l t th fpatterns of customers in same cluster vs. those from different clusters.
Clustering: Application 2
• Document Clustering:G l T fi d f d h i il– Goal: To find groups of documents that are similar to each other based on the important terms appearing in them.
– Approach: To identify frequently occurring terms in each document. Form a similarity measure based on the frequencies of different terms. Use it to cluster.

1/21/2009
17
What is not Cluster Analysis?• Simple segmentation
– Dividing students into different registration groups alphabetically, by last namep y, y
• Results of a query– Groupings are a result of an external specification– Clustering is a grouping of objects based on the data
• Supervised classificationSupervised classification– Have class label information
• Association Analysis– Local vs. global connections
Notion of a Cluster can be Ambiguous
How many clusters? Six Clusters
Four ClustersTwo Clusters

1/21/2009
18
Characteristics of the Input Data Are Important• Type of proximity or density measure
– This is a derived measure, but central to clustering • Sparsenessp
– Dictates type of similarity– Adds to efficiency
• Attribute type– Dictates type of similarity
• Type of Data– Dictates type of similarity
O h h i i l i– Other characteristics, e.g., autocorrelation• Dimensionality• Noise and Outliers• Type of Distribution
Data Mining Tasks …
Tid Refund Marital Status
Taxable Income Cheat
1 Yes Single 125K No
2 No Married 100K No
3 No Single 70K No
4 Yes Married 120K No
5 No Divorced 95K Yes
6 No Married 60K No
7 Yes Divorced 220K No
8 No Single 85K Yes
9 No Married 75K No
10 No Single 90K Yes
11 No Married 60K No
12 Yes Divorced 220K No
13 No Single 85K Yes
Data
13 No Single 85K Yes
14 No Married 75K No
15 No Single 90K Yes 10
Milk
1/21/2009
19
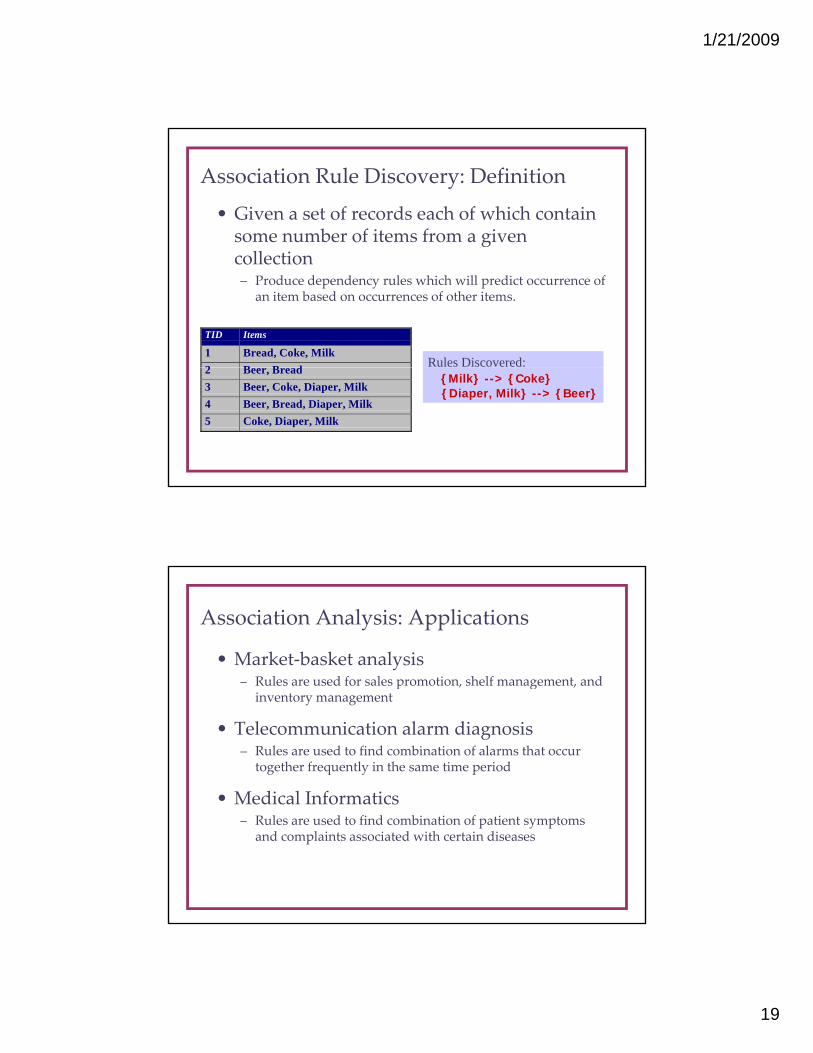
Association Rule Discovery: Definition
• Given a set of records each of which contain some number of items from a given collection– Produce dependency rules which will predict occurrence of
an item based on occurrences of other items.
TID Items
1 Bread, Coke, Milk2 B B d Rules Discovered:Rules Discovered:2 Beer, Bread3 Beer, Coke, Diaper, Milk4 Beer, Bread, Diaper, Milk5 Coke, Diaper, Milk
{Milk} --> {Coke}{Diaper, Milk} --> {Beer}{Milk} --> {Coke}{Diaper, Milk} --> {Beer}
Association Analysis: Applications
• Market‐basket analysis– Rules are used for sales promotion, shelf management, andRules are used for sales promotion, shelf management, and
inventory management
• Telecommunication alarm diagnosis– Rules are used to find combination of alarms that occur
together frequently in the same time period
• Medical Informatics– Rules are used to find combination of patient symptoms
and complaints associated with certain diseases
1/21/2009
20
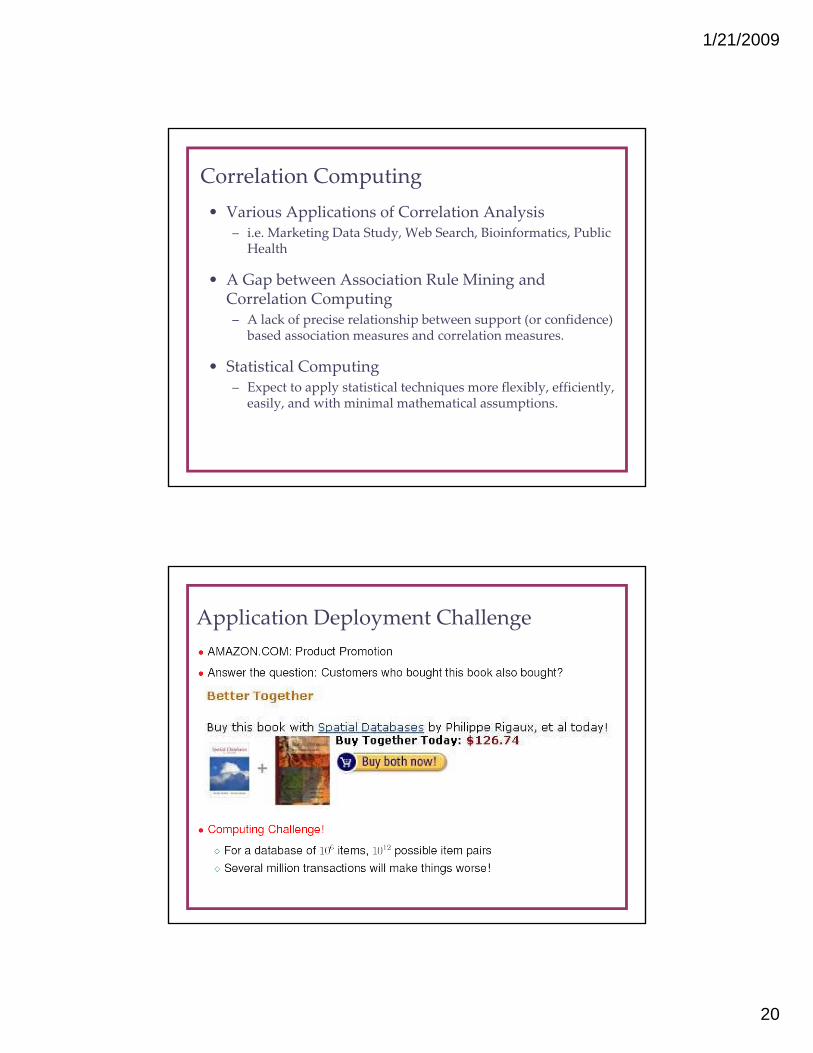
Correlation Computing• Various Applications of Correlation Analysis
– i.e. Marketing Data Study, Web Search, Bioinformatics, Public HealthHealth
• A Gap between Association Rule Mining and Correlation Computing– A lack of precise relationship between support (or confidence)
based association measures and correlation measures.
• Statistical Computing• Statistical Computing– Expect to apply statistical techniques more flexibly, efficiently,
easily, and with minimal mathematical assumptions.
Application Deployment Challenge
1/21/2009
21
Data Mining Tasks …
Tid Refund Marital Status
Taxable Income Cheat
1 Yes Single 125K No
2 No Married 100K No
3 No Single 70K No
4 Yes Married 120K No
5 No Divorced 95K Yes
6 No Married 60K No
7 Yes Divorced 220K No
8 No Single 85K Yes
9 No Married 75K No
10 No Single 90K Yes
11 No Married 60K No
12 Yes Divorced 220K No
13 No Single 85K Yes
Data
13 No Single 85K Yes
14 No Married 75K No
15 No Single 90K Yes 10
Milk
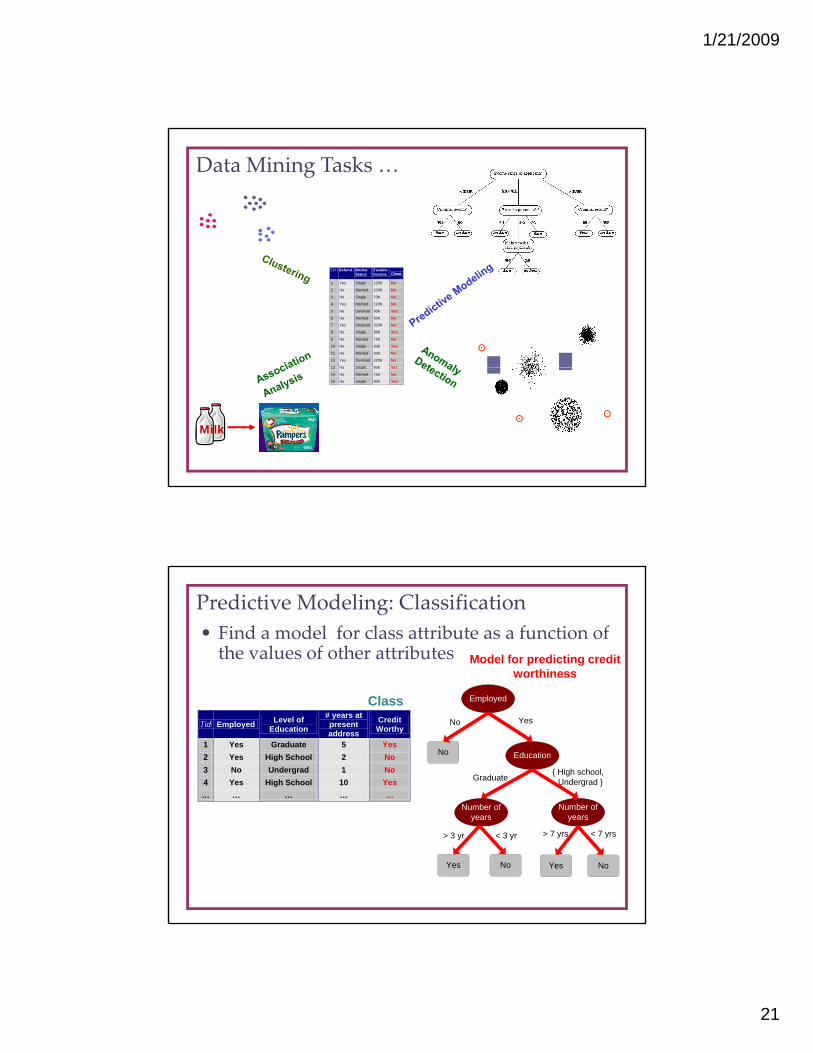
• Find a model for class attribute as a function of the values of other attributes Model for predicting credit
worthiness
Predictive Modeling: Classification
Tid Employed Level of Education
# years at present address
Credit Worthy
1 Yes Graduate 5 Yes 2 Yes High School 2 No 3 No Undergrad 1 No 4 Yes High School 10 Yes … … … … …
10
Class Employed
No Education
N b f
No Yes
Graduate{ High school, Undergrad }
N b f Number ofyears
Yes No
> 7 yrs < 7 yrs
Yes
Number ofyears
No
> 3 yr < 3 yr

1/21/2009
22
Classification Example
Tid Employed Level of Education
# years at present address
Credit Worthy
1 Yes Undergrad 7 ?
TestSet
Tid Employed Level of Education
# years at present address
Credit Worthy
1 Yes Graduate 5 Yes 2 Yes High School 2 No 3 No Undergrad 1 No 4 Yes High School 10 Yes … … … … …
10
1 Yes Undergrad 7 ? 2 No Graduate 3 ? 3 Yes High School 2 ? … … … … …
10
Training Set Model
Learn Classifier
• Predicting tumor cells as benign or malignant
Cl if i di d i
Examples of Classification Task
• Classifying credit card transactions as legitimate or fraudulent
• Classifying secondary structures of protein as alpha‐helix, beta‐sheet, or random coil
• Categorizing news stories as finance• Categorizing news stories as finance, weather, entertainment, sports, etc
• Identifying intruders in the cyberspace
1/21/2009
23
Classification: Application 1• Fraud Detection
– Goal: Predict fraudulent cases in credit card transactions.Approach– Approach:• Use credit card transactions and the information on its
account‐holder as attributes.– When does a customer buy, what does he buy, how often he pays on time, etc
• Label past transactions as fraud or fair transactions. This forms the class attribute.
• Learn a model for the class of the transactions.ea a o e o e c ass o e a sac io s• Use this model to detect fraud by observing credit card
transactions on an account.
Classification: Application 2• Churn prediction for telephone customers
– Goal: To predict whether a customer is likely to be l ilost to a competitor.
– Approach:• Use detailed record of transactions with each of the past
and present customers, to find attributes.– How often the customer calls, where he calls, what
time‐of‐the day he calls most, his financial status, marital status, etc.marital status, etc.
• Label the customers as loyal or disloyal.• Find a model for loyalty.
From [Berry & Linoff] Data Mining Techniques, 1997
1/21/2009
24
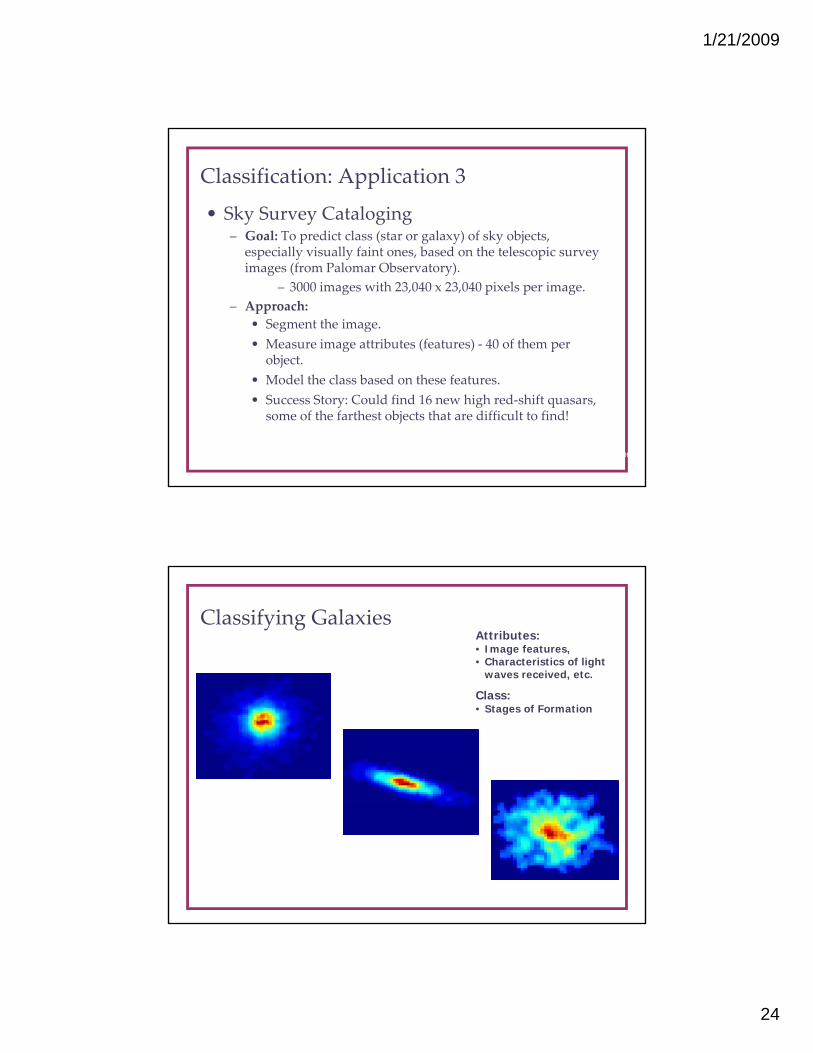
Classification: Application 3
• Sky Survey Cataloging– Goal: To predict class (star or galaxy) of sky objects,
i ll i ll f i b d h l iespecially visually faint ones, based on the telescopic survey images (from Palomar Observatory).
– 3000 images with 23,040 x 23,040 pixels per image.– Approach:
• Segment the image. • Measure image attributes (features) ‐ 40 of them per
object.j• Model the class based on these features.• Success Story: Could find 16 new high red‐shift quasars,
some of the farthest objects that are difficult to find!
From [Fayyad, et.al.] Advances in Knowledge Discovery and Data Mining, 1996
Classifying Galaxies
Early
Attributes:• Image features, • Characteristics of light
waves received, etc.
Intermediate
Late
Class: • Stages of Formation
Data Size: • 72 million stars, 20 million galaxies• Object Catalog: 9 GB• Image Database: 150 GB

1/21/2009
25
Classification Techniques
• Base Classifiers– Decision Tree based Methods– Rule‐based Methods– Nearest‐neighbor– Neural Networks– Naïve Bayes and Bayesian Belief Networks– Support Vector MachinesSupport Vector Machines
• Ensemble Classifiers– Boosting, Bagging, Random Forests
Data Mining Tasks …
Tid Refund Marital Status
Taxable Income Cheat
1 Yes Single 125K No
2 No Married 100K No
3 No Single 70K No
4 Yes Married 120K No
5 No Divorced 95K Yes
6 No Married 60K No
7 Yes Divorced 220K No
8 No Single 85K Yes
9 No Married 75K No
10 No Single 90K Yes
11 No Married 60K No
12 Yes Divorced 220K No
13 No Single 85K Yes
Data
13 No Single 85K Yes
14 No Married 75K No
15 No Single 90K Yes 10
Milk
1/21/2009
26
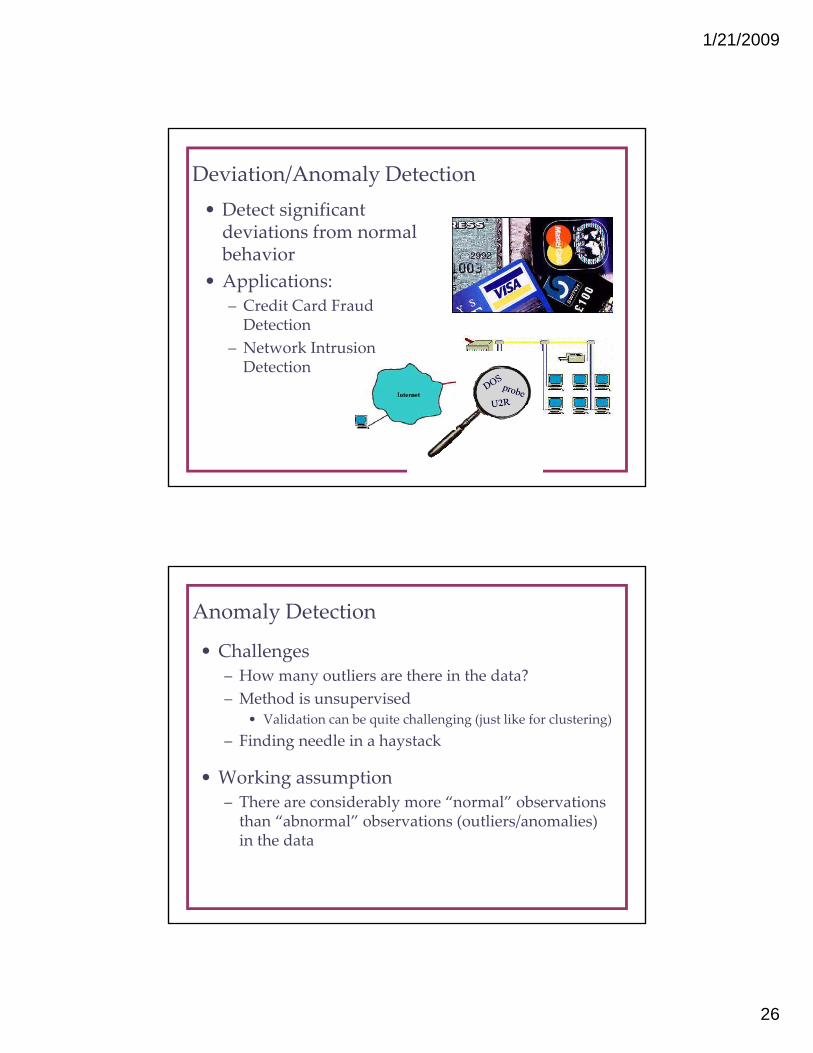
Deviation/Anomaly Detection• Detect significant deviations from normal b h ibehavior
• Applications:– Credit Card Fraud Detection
– Network Intrusion DetectionDetection
Anomaly Detection
• Challenges– How many outliers are there in the data?y– Method is unsupervised
• Validation can be quite challenging (just like for clustering)– Finding needle in a haystack
• Working assumption– There are considerably more “normal” observationsThere are considerably more normal observations than “abnormal” observations (outliers/anomalies) in the data
1/21/2009
27
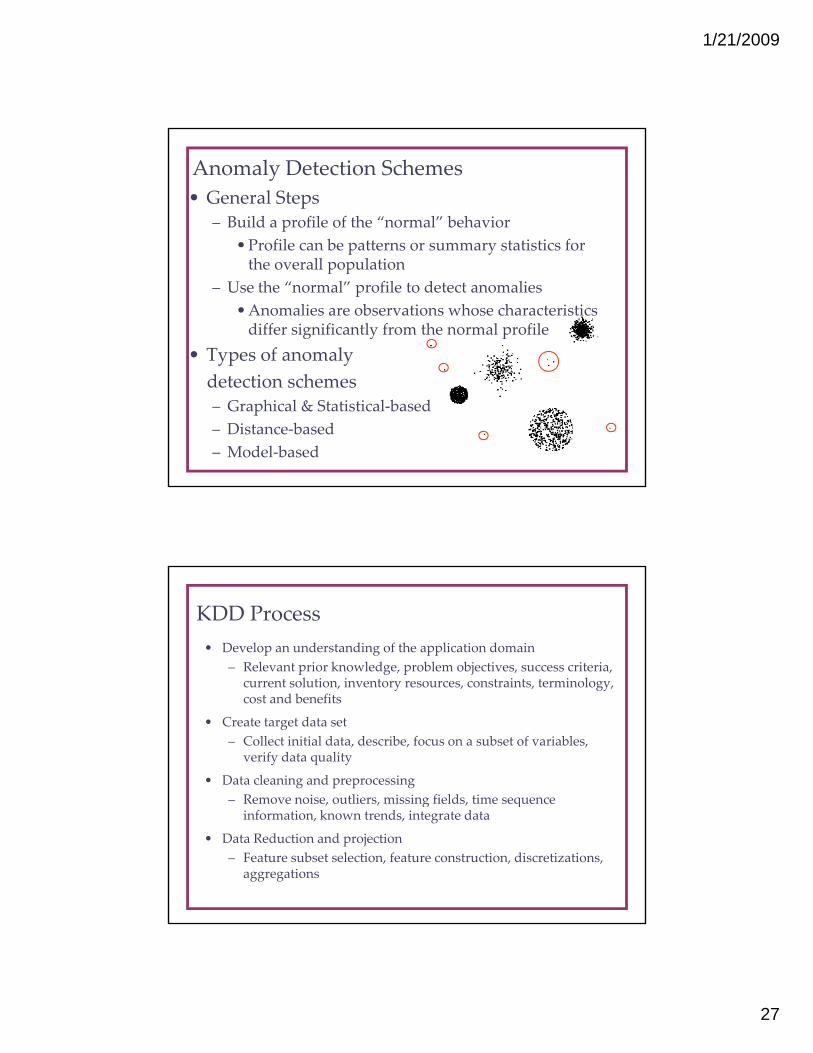
Anomaly Detection Schemes • General Steps
– Build a profile of the “normal” behavior•Profile can be patterns or summary statistics forProfile can be patterns or summary statistics for the overall population
– Use the “normal” profile to detect anomalies•Anomalies are observations whose characteristicsdiffer significantly from the normal profile
• Types of anomaly detection schemes– Graphical & Statistical‐based– Distance‐based– Model‐based
KDD Process• Develop an understanding of the application domain
– Relevant prior knowledge, problem objectives, success criteria, current solution inventory resources constraints terminologycurrent solution, inventory resources, constraints, terminology, cost and benefits
• Create target data set– Collect initial data, describe, focus on a subset of variables,
verify data quality
• Data cleaning and preprocessing– Remove noise, outliers, missing fields, time sequence , , g , q
information, known trends, integrate data
• Data Reduction and projection– Feature subset selection, feature construction, discretizations,
aggregations

1/21/2009
28
KDD Process
• Selection of data mining task– Classification, segmentation, deviation detection, a i i a io , eg e a io , e ia io e e io ,link analysis
• Select data mining approach • Data mining to extract patterns or models• Interpretation and evaluation of patterns/modelspatterns/models
• Consolidating discovered knowledge
Knowledge Discovery
1/21/2009
29
Challenges of Data Mining
• Scalability• Dimensionalityy• Complex and Heterogeneous Data• Data Quality• Data Ownership and Distribution• Privacy PreservationS• Streaming Data
• Data from Multi‐Sources
Commercial and Research ToolsWEKA: http://www.cs.waikato.ac.nz/ml/weka/
SAS: http://www.sas.com/
Clementine: http://www.spss.com/spssbi/clementine/
Intelligent Miner htt // 3 ib / ft /d t /i i /http://www‐3.ibm.com/software/data/iminer/
Insightful Miner http://www.insightful.com/products/product.asp?PID=26
1/21/2009
30
Textbooks
Hans Rosling: No more boring data: TEDTalks
http://www.youtube.com/watch?v=hVimVzgtD6w
1/21/2009
31
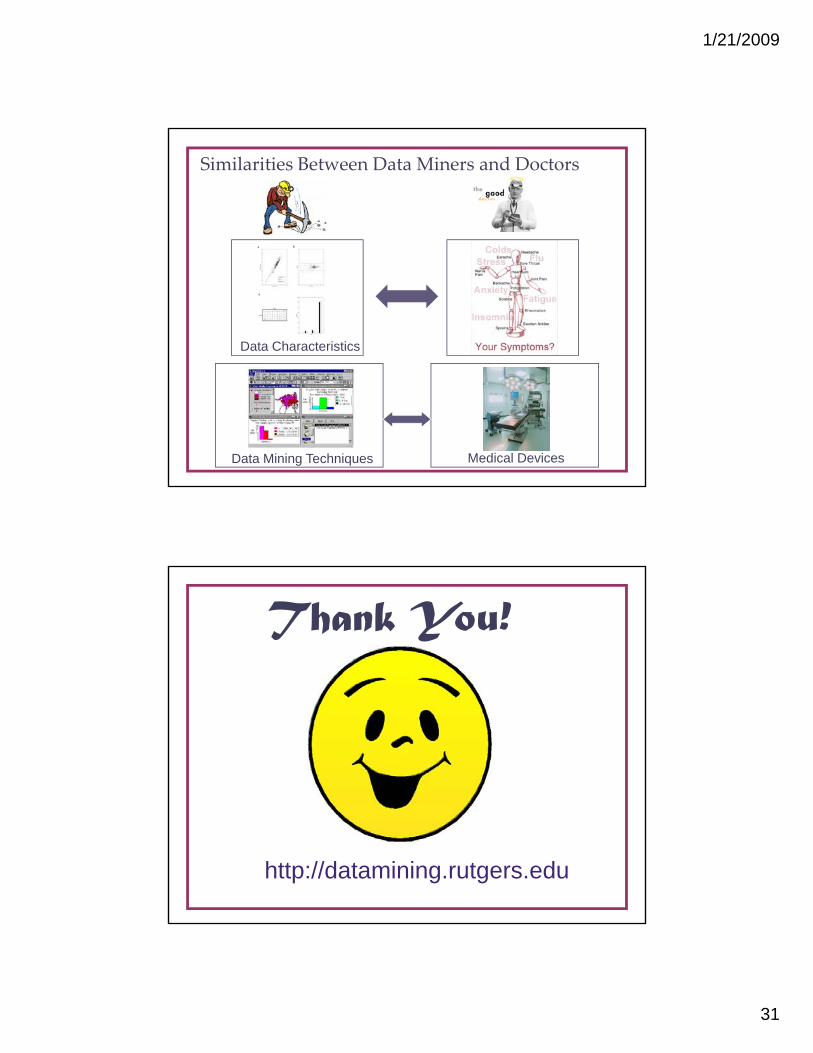
Similarities Between Data Miners and Doctors
Data Characteristics
Data Mining Techniques Medical Devices
Thank You!
http://datamining.rutgers.edu