Embed Size (px)
Citation preview

Introduction to Construction Scheduling
with
Construction Scheduling Training Series
This manual provides the basic concepts of CPM scheduling combined with software techniques that provides the knowledge required to begin using Asta PowerProject to plan a project, schedule a project, update a schedule, document delays, customize the schedule, establish resources & cost accounts and viewing tabular & graphic reports.
www.encgrp.com

Technical Support
Phone 800-991-7029
Email [email protected]
Submit a ticket online http://www.projectnetworking.com/project/Asta
Self-Service Support Portal http://support.astaPowerProject.com/

While every effort has been made to ensure complete and accurate information of the contents
in this documentation, Encore Group of Professionals, LLC cannot be legally responsible for
errors and omissions, or damages or loss of equipment or information caused as a result of the
documentation.
No part of this documentation may be reproduced by any means or stored in any form without
express permission from Encore Group of Professionals, LLC.

1
Chapter 1. Getting started with Asta PowerProject .............................................. 5
Asta Basics ............................................................................................................................................... 6
Viewing your Schedule in Asta PowerProject ............................................................................................ 7
The PowerProject Menus and Toolbars ..................................................................................................... 8
Chapter 2. Creating a Project in PowerProject.................................................... 11
Creating a New Project in PowerProject .................................................................................................. 12
Saving a file ........................................................................................................................................... 13
Closing a project ..................................................................................................................................... 13
Exiting Asta PowerProject ...................................................................................................................... 14
Exercise: Create a Project in PowerProject .............................................................................................. 14
Building Blocks of a Project Schedule ..................................................................................................... 15
Chapter 3. Setting up Project Calendars .............................................................. 16
To display a list of available Calendars.................................................................................................... 16
To select the calendar you wish to use as the default ................................................................................ 17
Calendar screen overview ....................................................................................................................... 18
Adding exceptions .................................................................................................................................. 19
Deleting exceptions ................................................................................................................................ 20
Exercise: Create Project Calendars .......................................................................................................... 20
Chapter 4. Creating a Project Organization Structure........................................ 22
Creating summary tasks .......................................................................................................................... 24
Opening and closing summary tasks ........................................................................................................ 25
2
Adding & Removing tasks into Summary Groups.................................................................................... 25
Removing Summary Tasks ..................................................................................................................... 25
Using the project view to navigate your project ....................................................................................... 26
Summary bar level formatting ................................................................................................................. 26
Chapter 5. Adding Tasks ....................................................................................... 29
Creating Tasks in the Spreadsheet ........................................................................................................... 29
Milestones .............................................................................................................................................. 33
Inserting bars .......................................................................................................................................... 33
Creating Expanded Tasks ........................................................................................................................ 34
Task-per-line mode ................................................................................................................................. 35
Moving and editing tasks ........................................................................................................................ 37
Moving bars vertically ............................................................................................................................ 38
Setting Activity Defaults ......................................................................................................................... 39
Chapter 6. Linking Tasks – Adding Logic ............................................................ 40
Link types............................................................................................................................................... 40
Drawing links with lag time .................................................................................................................... 43
Moving/Editing Links ............................................................................................................................. 44
Block linking .......................................................................................................................................... 45
Link tasks mode ...................................................................................................................................... 45
Cross Chart linking ................................................................................................................................. 47
Linking tasks without drawing on the Bar Chart ...................................................................................... 48
The Wild Card ........................................................................................................................................ 49
3
Reviewing links ...................................................................................................................................... 50
Exercise: Link activities in 3 Phases ........................................................................................................ 52
Chapter 7. Managing Tasks and Groups .............................................................. 53
Copy Tasks and Bars .............................................................................................................................. 53
Task Pools .............................................................................................................................................. 54
Copy and Paste Summary Tasks .............................................................................................................. 55
Hammock Tasks ..................................................................................................................................... 56
Buffer Tasks ........................................................................................................................................... 58
Hiding Tasks .......................................................................................................................................... 60
Chapter 8. Rescheduling a Project Schedule ........................................................ 62
Changing the project start date ................................................................................................................ 63
Chapter 9. Assigning Constraints ......................................................................... 65
Adding a constraint ................................................................................................................................. 65
Types of Constraint................................................................................................................................. 66
Reschedule results (Float) ....................................................................................................................... 67
Run a Filter for the Critical Path .............................................................................................................. 68

4
Course Objectives
During the day you will learn how to:
� Edit and apply working time using calendars
� Create a linked bar chart
� Understand and analyse the Critical Path and Float
� Manipulate the chart using constraints
� Summarize the bar chart
� Create a coded reporting system
� Edit the display
� Update progress on your project
� Print your project
Topics will be backed up by exercises This booklet is yours to take away Please feel free to add any notes you feel are relevant Please ask any questions
� = Note, something of interest
� = Warning, something to make you aware of.

5
Getting Started with Asta PowerProject
Chapter 1. Getting started with Asta
PowerProject
In this chapter you’ll be introduced to Asta PowerProject. We’ll then
look at PowerProject’s menus at the open screen and project screen to
aquaint you with the program’s capabilities.

6
Getting Started with Asta PowerProject
Asta Basics
Start Asta PowerProject by double-clicking on the desktop program icon. Once you’ve started Asta
PowerProject, you can begin working with a project. The initial startup menu allows the user to open new,
recent or existing projects and perform various project utilities such as saving and deleting files.
PowerProject follows many of the rules for Windows:
� Left click will usually select an item
7
Getting Started with Asta PowerProject
� Double click will activate it
� Right click gives you a menu to make changes
� Click and drag will move an item from one part of the screen to another or will select multiple items
� Shift button will allow you to select adjacent items
� Control button will select non-adjacent items
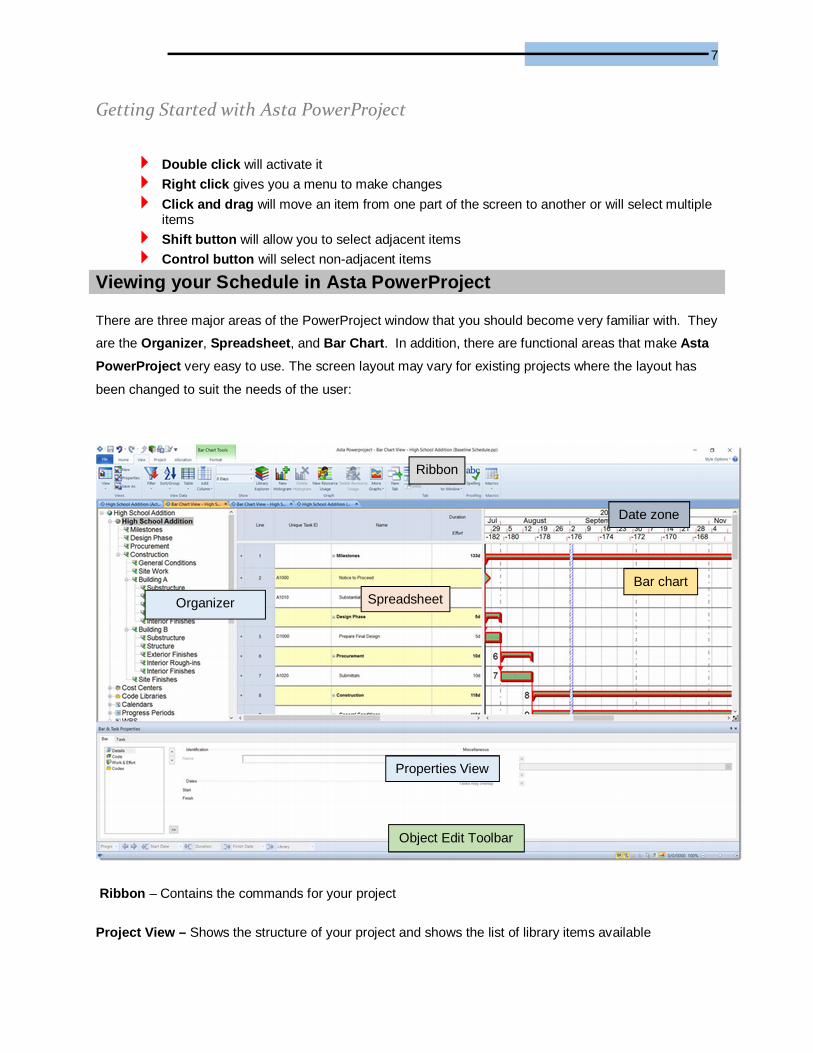
Viewing your Schedule in Asta PowerProject
There are three major areas of the PowerProject window that you should become very familiar with. They
are the Organizer, Spreadsheet, and Bar Chart. In addition, there are functional areas that make Asta
PowerProject very easy to use. The screen layout may vary for existing projects where the layout has
been changed to suit the needs of the user:
Ribbon – Contains the commands for your project
Project View – Shows the structure of your project and shows the list of library items available
Ribbon
Organizer
Bar chart Spreadsheet
Object Edit Toolbar
Properties View
Date zone

8
Getting Started with Asta PowerProject
Bar Chart – Information on your project in graphic form, your Gantt Chart
Date zone – Timescale for showing dates for years, months, weeks etc.
Spreadsheet – Information on your project in tabular form
Properties View – Allows you to edit the properties of a selected object
Object Edit Toolbar – Used to edit tasks and/or links in the bar chart
The PowerProject Menus and Toolbars
Templates
Printing

9
Getting Started with Asta PowerProject
Option Settings
Home Ribbon
View Ribbon
Project Ribbon
Allocation Ribbon

10
Getting Started with Asta PowerProject
Format Ribbon

11
Creating a Project in PowerProject
Chapter 2. Creating a Project in
PowerProject
In this chapter you will create a project in PowerProject and begin
building a construction schedule.

12
Creating a Project in PowerProject
Creating a New Project in PowerProject
Templates are used to make creating a new project as quick as possible, as the template can contain
information that you may wish to use like tables, code libraries, filters and many more items.
� Select the File tab
� Select New:
� Select a template on which to base your project e.g. Construction Template
Enter the details on the new project:
� Filename – The name of the document
� Name – The print title
� For – Who the project is for i.e. the client
� By – Who the project is by i.e. your name or company
� Start – The start date for the whole project
� Once these details have been entered, click Create
� Opening an existing project
� Select the File tab
� Your recent projects are displayed to the right. Double click to select & Open a project
� If your project has not been opened recently, Select Open from the menu on the left

13
Creating a Project in PowerProject
� Select your file & click Open
Saving a file
� Select the File Tab & Save or the Save button on the quick access tool bar
When saving a file under a new name, the existing version is kept and a new version is saved under the new name.
� Select the File tab and Save As
Closing a project
� Close the project tabs using the ‘X’ next to each tab:

14
Creating a Project in PowerProject
Or:
� Return to the File tab and select
If the project has not been saved, you will be prompted to do so
Exiting Asta PowerProject
� Select the File Tab & select Exit from the left hand menu
Or
� Click on the X at the top right of the screen
Exercise: Create a Project in PowerProject
Create the following project using the Construction Template: File Name: New School.pp Project Title: High School Addition For: (Your Local School District) By: (Your name or company Name) Start: today’s date
� N.B. If you try to close an individual project, or the PowerProject software altogether, without saving, PowerProject will ensure you do not accidentally lose changes by prompting to ask if you want to save

15
Creating a Project in PowerProject
Building Blocks of a Project Schedule

16
Setting up Project Calendars
Chapter 3. Setting up Project Calendars
Calendars define the working and non-working time within a project. The Calendar consists of a planned
pattern of work to which exceptions can be added. An exception is any day which does not conform to the
planned pattern of work, e.g. holidays or overtime
To display a list of available Calendars
The calendars are accessed from the Project View
Click on the ‘+’ symbol to display the contents of a folder

17
Setting up Project Calendars
� Any new task you create will follow the default calendars’ work pattern
To select the calendar you wish to use as the default
� Right click on the calendar you wish to set as the default
� Select Task Default from the list
� The tick will move to the new default calendar
Once the default calendar has been selected, you can then edit the calendars properties to the specific
working patterns of this project
To edit the calendar:
� Right click on the calendar you wish to edit
To view a Calendar or add exceptions to a Calendar, right click on the Calendar name and click on Properties
The Default Calendar icon

18
Setting up Project Calendars
� Select Properties
Calendar screen overview
Each day in the Calendar has a working pattern assigned to it. An exception is any day which does not
follow that working pattern.
Each day has a period of working and non-working time assigned. To view these times
� Double click on the day you wish to view. The day will open in a separate pop up, showing the working and non-working time during that day.

19
Setting up Project Calendars
� All Asta supplied calendars have the same 8 hour per day pattern
Adding exceptions
You can add additional exceptions to the calendar to show additional bank holidays, shut down days or
additional weekend working.
To add an exception:
� In the Calendar tab, Left click on the date you wish to select. If you wish to select more than one date, you will need to hold the CTRL key and click on each date
� Click the Add Exception button
� Choose which Exception type you wish to add
� Choose the period of time you wish the exception to last for in the Exception period section
� Click Add
When adding an exception, it is important to set the correct time periods. Most schedules are measuring
days not hours. Best practices in this case are to select the 24 hour exception:

20
Setting up Project Calendars
24 hour exception will add the selected exception for the whole 24 hours of the day
Specific start and end times allows you to set the start and finish of the time to the nearest 30 minutes
From work pattern periods matches the morning and afternoon to those already set for the calendar. (This option will produce the best results)
Best practices are to print the calendar for review by the project team and/or include with a schedule
submittal to the owner. Simply select Print while in the Calendar tab.
Deleting exceptions
Removing an exception from a date will return those dates back to the standard work pattern:
� Select the dates with the exceptions you wish to remove
� Click Delete Exceptions
� A pop up will appear asking if you are sure you wish to delete the exceptions. If you are, select Yes, if not select No.
Exercise: Create Project Calendars
Create a 5 Day Workweek Calendar with holidays:
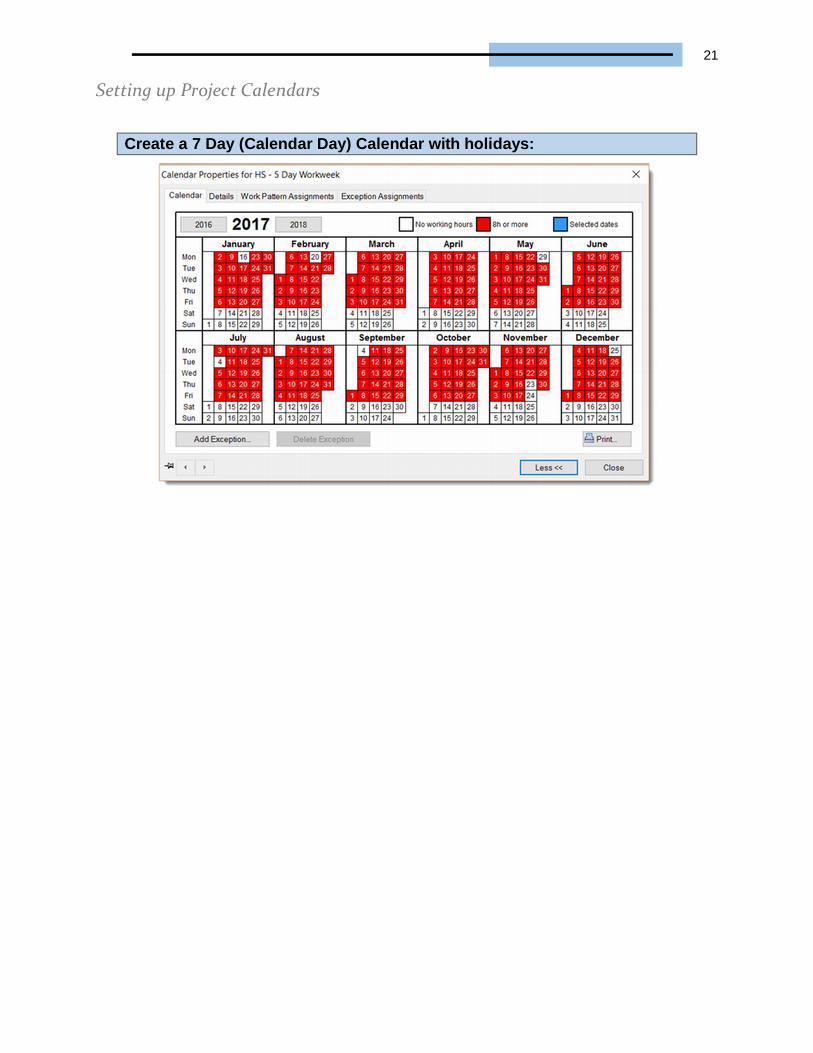
21
Setting up Project Calendars
Create a 7 Day (Calendar Day) Calendar with holidays:

22
Creating a Project Organization Structure
Chapter 4. Creating a Project
Organization Structure
Project management is not only about defining tasks and setting up their dependencies, it is also about
organising the different parts of a project into a coordinated whole
Asta PowerProject lets you organize your project using Summary Tasks to group related tasks together
and this section explains how you can use summary bars to structure your project in a logical format
A Project Organization Structure is a system where all the tasks grouped together in a hierarchical
structure. A Project Organization Structure is useful when you want to break down the work involved in a
project, starting from the main phases of the project and expanding right down to the individual tasks that
must be carried out (see diagrams below).
Right Click on the Project in your Project View and select “Insert Child Summary”
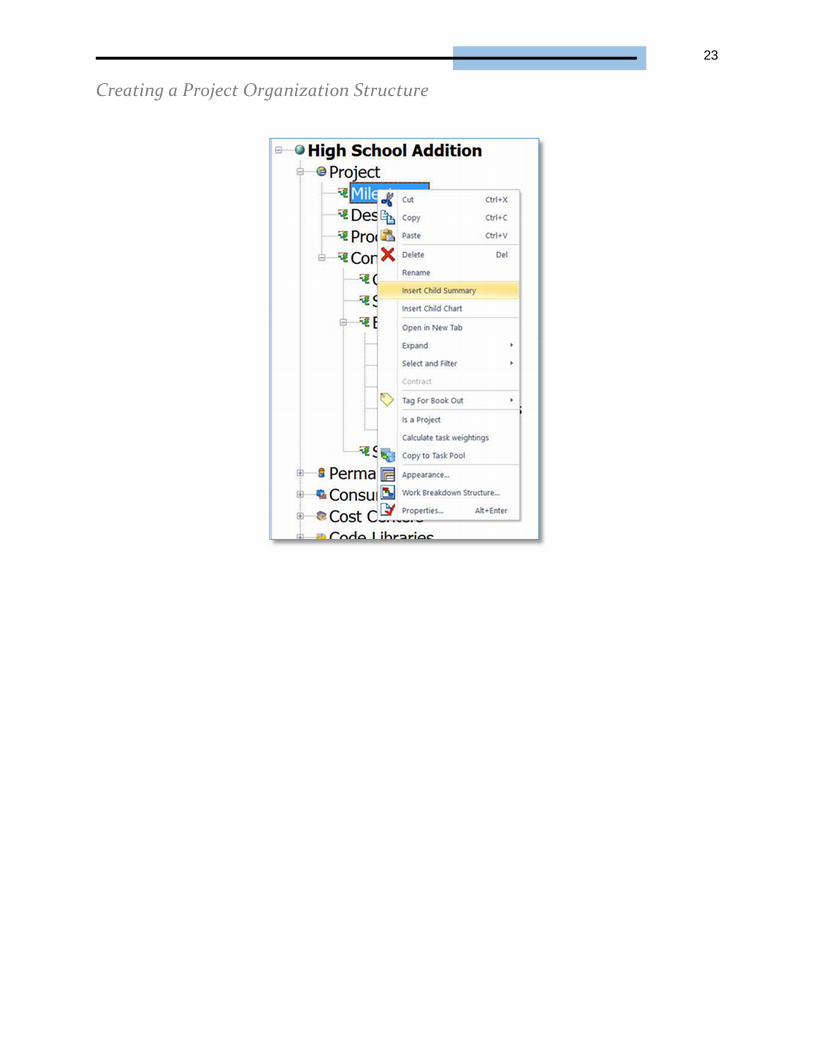
23
Creating a Project Organization Structure

24
Creating a Project Organization Structure
Using this technique, create the following Project Organizational Structure.
Creating summary tasks
Summary tasks are useful for grouping related activities together in sequential order. A summary task
takes its position and duration from the position and duration of the tasks within the summary group. It
provides ‘rolled up’ information relating to all tasks within the summary and gives the user control over
displaying each & every task in the project or displaying only the summarized information
To summarize tasks in the project:
� Highlight the bars you wish to group together by clicking and dragging on the line numbers within the table
� On the Home tab click the Summarize command

25
Creating a Project Organization Structure
� A summary bar appears on the Bar chart:
� Enter a name for the summary bar in the table e.g. Restroom Finishes
You can now choose to hide the tasks that are part of the summary group from the chart so that only the
summary bar & ‘rolled up’ details are displayed
Opening and closing summary tasks
� On the Bar Chart, place the cursor over the summary task so that the Candy Wrapper cursor is displayed and double click
� The individual tasks are hidden from view
� Double click again to display the tasks
Adding & Removing tasks into Summary Groups
� Select the bar(s) by clicking on the line number
� On the Home tab click on the Indent button on the ribbon
� Bars are added to the summary that is above
� To remove tasks from a summary group, use the Outdent button
Removing Summary Tasks
� Select all of the contents of the summary group

26
Creating a Project Organization Structure
� Click the Outdent button from the ribbon
If there are no contents in the summary group the summary task no longer exists
Using the project view to navigate your project
The structure of our project is clearly displayed in the Project View.
� Click on the ‘+’ sign to open the contents of headings. Program is usually the top level
� Select any of the summary groups to display only that section of work on the Bar Chart
In the example below only Superstructure has been selected therefore you are only shown the contents
of the Superstructure summary bar:
Summary bar level formatting
Once you have a structure in your project, the spreadsheet cell color and font, as well as the background
color for that row on the bar chart, can be set for a Summary task in the Project View. The coloring is set
for each level of the project, so more than one summary may have the same color.
To alter the appearance of the Summary bar task:
� In the Project view right click on any Summary bar and select Appearance

27
Creating a Project Organization Structure
� Choose the text color, background color and font style and size of your choice:
Once the level coloring is set, it will need to be turned on in the Bar chart.
To turn the summary row color on:
� On the Format tab click the Format Bar Chart command
� On the General tab you can choose to show Summary row coloring on the Spreadsheet, Bar chart and also show banding down the left hand side of the spreadsheet
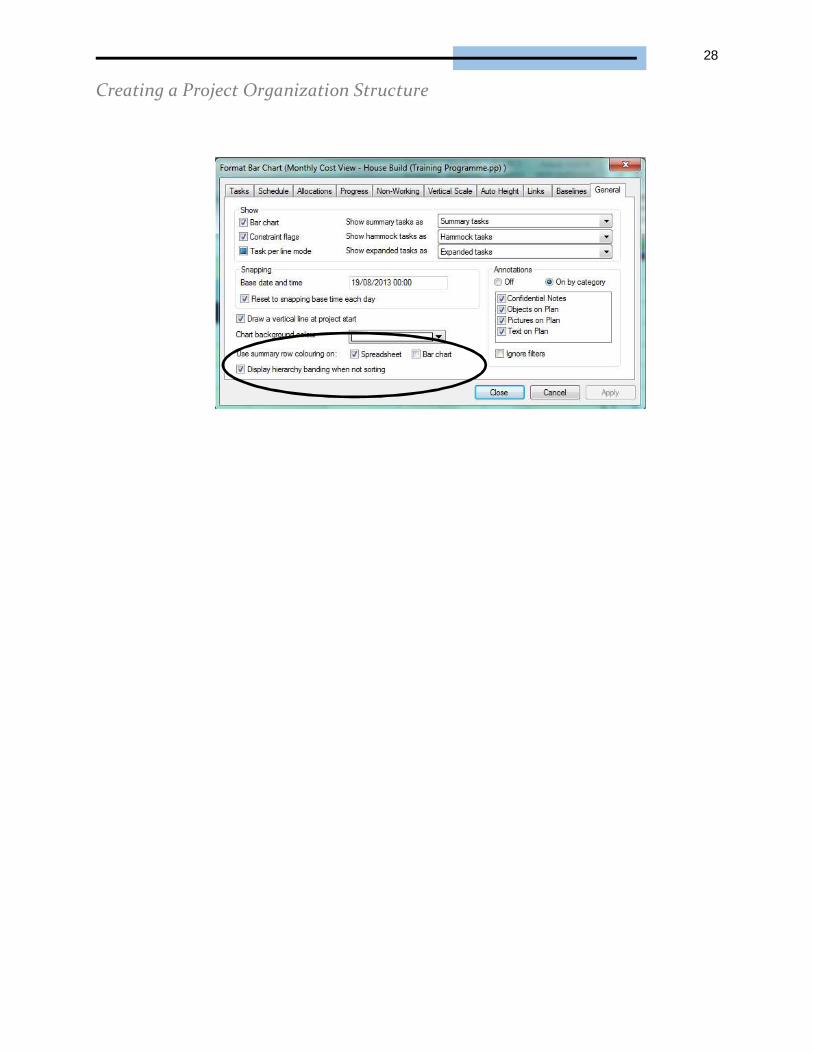
28
Creating a Project Organization Structure

29
Adding Tasks
Chapter 5. Adding Tasks
A Project is a series of tasks which must be completed to achieve a set of objectives. The Spreadsheet
displays the task information and the Gantt chart (Bar Chart) shows the tasks in their date position and
duration:
A Task is a unit of work with a duration. Tasks can be created on the Spreadsheet or drawn onto the
Gantt chart and they can be linked to show relationships between them to create the critical path. You
can create more than one task on the same bar to show repetitive or intermittent working. Task names
can be used to describe the task, and do not need to be unique
Creating Tasks in the Spreadsheet
To create the task titles that will make up the project select an element in the Project Organizational
Structure:
� Move the mouse pointer over an empty cell in the Name column and left click
� In the Milestone section type the name ‘Notice to Proceed’ and press ENTER
A task can be created by either typing the duration into the column on the Spreadsheet, or by using the
cursor to draw onto the Bar Chart. Once created, any aspect of the task can be edited using either the
Spreadsheet or using the mouse on the task bar

30
Adding Tasks
To create tasks in the Spreadsheet:
� Type the following task names and durations in the appropriate columns for the listed Project Organization Structure (POS).
You can use any duration unit by adding the appropriate letter after the number, i.e. d for days and w for weeks
� Press ENTER. A task is displayed on the Bar Chart
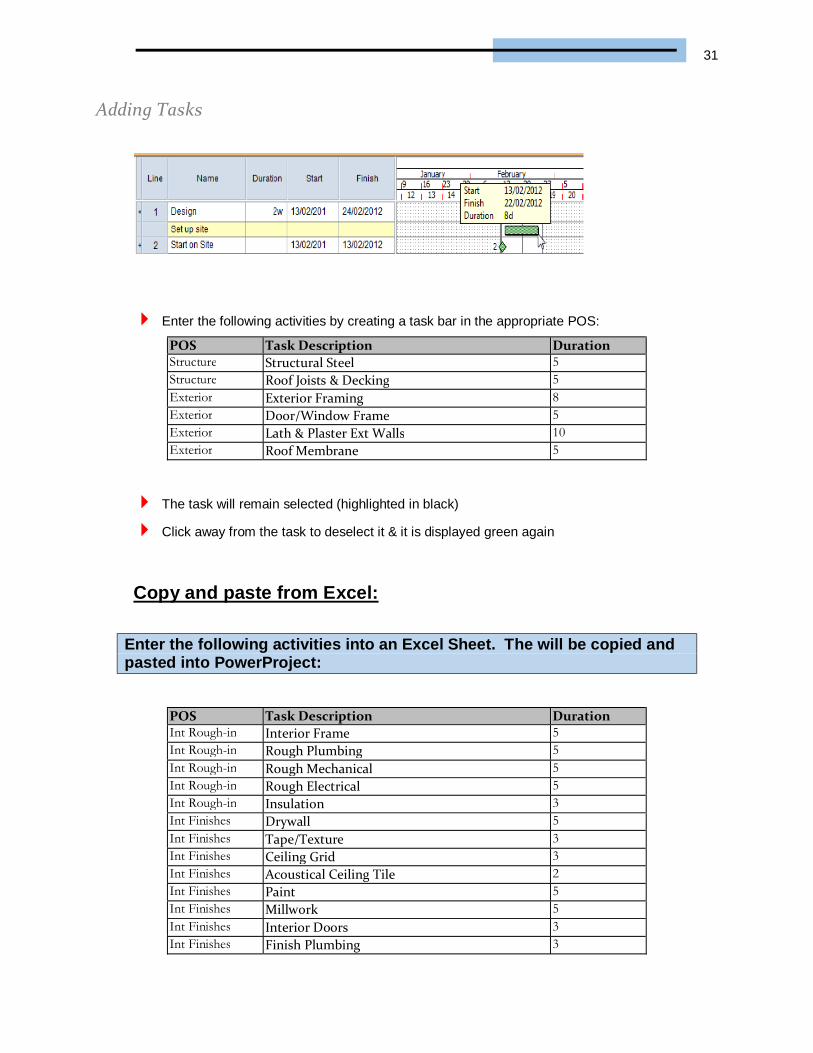
POS Task Description Duration Milestones Notice to Proceed 0 Milestones Substantial Completion 0 Design Prepare Final Design 5 Procurement Submittals 10 General Cond Mobilization 2 General Cond Trailer Setup and Fencing 3 General Cond Final Clean 5 Site Work Survey and Staking 2 Site Work Excavate and Grade 7 Substructure Layout and Grade Pad 5 Substructure Underground Utilities 5 Substructure Form/Pour Footings 3 Substructure Form/Rebar/ Pour Slab 4 Substructure Cure Slab 3
To create tasks on the Bar Chart:
� Place the mouse cursor in the Bar Chart on the line for the task, the cursor will now be a cross
� Left click and drag the mouse to the right
A pop up box displays the duration of the task
� Release the mouse button when the task is 5d:
31
Adding Tasks
� Enter the following activities by creating a task bar in the appropriate POS:
POS Task Description Duration Structure Structural Steel 5 Structure Roof Joists & Decking 5 Exterior Exterior Framing 8 Exterior Door/Window Frame 5 Exterior Lath & Plaster Ext Walls 10 Exterior Roof Membrane 5
� The task will remain selected (highlighted in black)
� Click away from the task to deselect it & it is displayed green again
Copy and paste from Excel:
Enter the following activities into an Excel Sheet. The will be copied and pasted into PowerProject:
POS Task Description Duration Int Rough-in Interior Frame 5 Int Rough-in Rough Plumbing 5 Int Rough-in Rough Mechanical 5 Int Rough-in Rough Electrical 5 Int Rough-in Insulation 3 Int Finishes Drywall 5 Int Finishes Tape/Texture 3 Int Finishes Ceiling Grid 3 Int Finishes Acoustical Ceiling Tile 2 Int Finishes Paint 5 Int Finishes Millwork 5 Int Finishes Interior Doors 3 Int Finishes Finish Plumbing 3
32
Adding Tasks
Int Finishes Finish Mechanical 5 Int Finishes Finish Electrical 7 Int Finishes Flooring 5 Int Finishes RR Partitions & Accessories 3 Int Finishes Test & Balance 5 Site Finishes Site Finish Grade 10 Site Finishes Base & Pave Parking Lot 5
� Format Excel and Asta columns to match.
o For example, if your Asta view includes a Unique Task ID, your Excel view should as well
o Asta can accept start and finish dates as well. Logic can be applied afterward as needed.
� Format Excel to include duration units days / weeks / months (d, w, m) in Excel.
o If you have a duration column with a number only (eg. 5) and do not have the duration unit (eg. d) then do the following:
o Add a column with appropriate duration (eg.d)
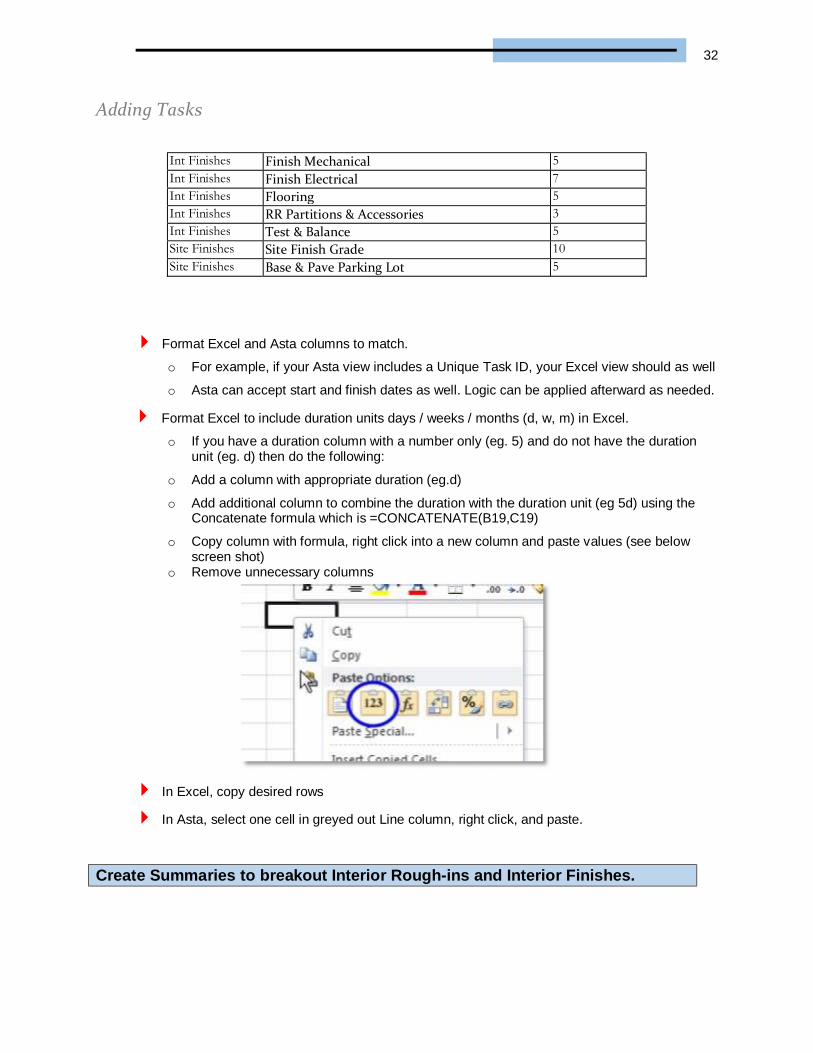
o Add additional column to combine the duration with the duration unit (eg 5d) using the Concatenate formula which is =CONCATENATE(B19,C19)
o Copy column with formula, right click into a new column and paste values (see below screen shot)
o Remove unnecessary columns
� In Excel, copy desired rows
� In Asta, select one cell in greyed out Line column, right click, and paste.
Create Summaries to breakout Interior Rough-ins and Interior Finishes.

33
Adding Tasks
Milestones
Milestones are used to display key dates or events in our project and have zero duration
To create a Milestone:
� Name the task in the normal way
� Enter 0 (zero) in the duration column. The 0 will not display as the default is to not show zeros, but a diamond symbol will now appear in the bar chart:
Milestones can either be a Start or Finish milestone. Start Milestones will show at the start of a working
day, whereas Finish milestones will show at the end of the working day, e.g. if a task is completed on
Friday afternoon, a Start Milestone will appear on Monday morning. A Finish Milestone will appear at
the end of Friday afternoon. By default, you will create a start milestone.
To change a Milestone into a Start or Finish Milestone depending on your requirements
� Right click on the Milestone in the Bar Chart
� Select Make Into > Start/Finish Milestone (keep in mind that the default milestone is Start)
Inserting bars
You can insert new lines into your project to put new tasks on or just to space exiting tasks for
formatting purposes:
� On the line number below where you want to insert your new line Right click and select Insert Bar or press insert on your keyboard
� A blank bar will be inserted above the currently selected bar

34
Adding Tasks
Creating Expanded Tasks
Expanded tasks allow you to organize your plan as a hierarchical tree of charts, gradually breaking the
project down further and further into more and more detail. These new Charts are clearly displayed in
the Project View. Tasks within the charts can be summarized to structure the work within each chart.
Any existing task can be converted into an expanded task or a new task can be created and made into an
expanded task.
To add more detail into our project without overly complicating our chart we will create a new task called
Landscaping within which further detail will be contained.
� Create a task by entering a task name and duration into the table e.g. Classroom Finishes
� In the bar chart, place the mouse over the task and right click on it:
� Select Make into > Expanded

35
Adding Tasks
The task becomes a new chart in the project hierarchy. To access the
new chart either:
� Left click on the new chart in the Project View
Or
� Double click on the expanded task on the bar chart
Create tasks and plan your work in this new chart as normal.
To return to the main ‘Program’ chart of the project:
� Select Program from the project view or select Up one level from the Quick Access Toolbar at the top your screen
At program level, the expanded task is displayed with a critical appearance. It takes its duration from the
tasks held within it and its position at the start date of the project.
The expanded task can now be linked into the project just like a normal task.
Task-per-line mode
In Asta PowerProject, it is possible to display more than one task on a bar. This is useful if you have
several tasks of the same type or you have a process made up of a number of single tasks. Asta
PowerProject can separate tasks that exist on the same line by dropping them down onto separate lines.
This is achievable by using Task-per-line mode
Option 1: Create multiple tasks on the same line:

36
Adding Tasks
� Using the cross hair cursor draw more than one task onto the same line in the Bar chart:
� Enter name for group of tasks (eg First Floor)
� You can now drop these tasks down onto separate lines by clicking the + symbol to the left of the line number you have drawn them on
� Enter names of each task and adjust durations accordingly
� Click on the + symbol to roll the tasks back up onto one line
Option 2: Roll up existing tasks:
There are also buttons which allow you to select a number of already pre-drawn tasks which were first
created on separate lines and now you wish to roll them up onto one line:
� Select the line numbers of the tasks you wish to place on one line
� On the Home tab, click the Roll up tasks command
� The process can be reversed using the Unroll task command

37
Adding Tasks
� Enter name for group of tasks (eg First Floor)
Moving and editing tasks
Tasks can be moved and edited using either the mouse or the Object Edit Toolbar
To edit your tasks on the Bar Chart:
� Place your cursor on the task in the Bar Chart you wish to edit
� Your cursor will change to one of these shapes:
Knickname Symbol Description
Candy Wrapper Select /move task: Place mouse cursor in the centre of a task. Left click & drag. While this cursor shape is showing an item can be selected or moved.
Left Bow & Arrow
Adjust start date of task: Place mouse cursor at start of a task. Left click & drag. While this cursor shape is showing the start date of a task can be moved without affecting the end date.
Right Bow & Arrow
Adjust end date of task: Place mouse cursor at the end of a task. Left click & drag. While this cursor shape is showing the end date of a task can be moved without affecting the start date.

38
Adding Tasks
To edit tasks on the Object Edit Toolbar:
� Select a task on the Bar Chart using the cursor as shown above
� The Object Edit Toolbar is now displayed at the foot of the screen:
Moving bars vertically
Once you have listed out your tasks, you are still able to change the order of those tasks at anytime
To move start on site to the top of your project:
� Left click on the line number for the task you want to move. Place your cursor on the task in the bar chart, you should see the cursor:
� Click and drag the bar to the new line above
To move date
position of
To change
start date of
To change
end date of
39
Adding Tasks
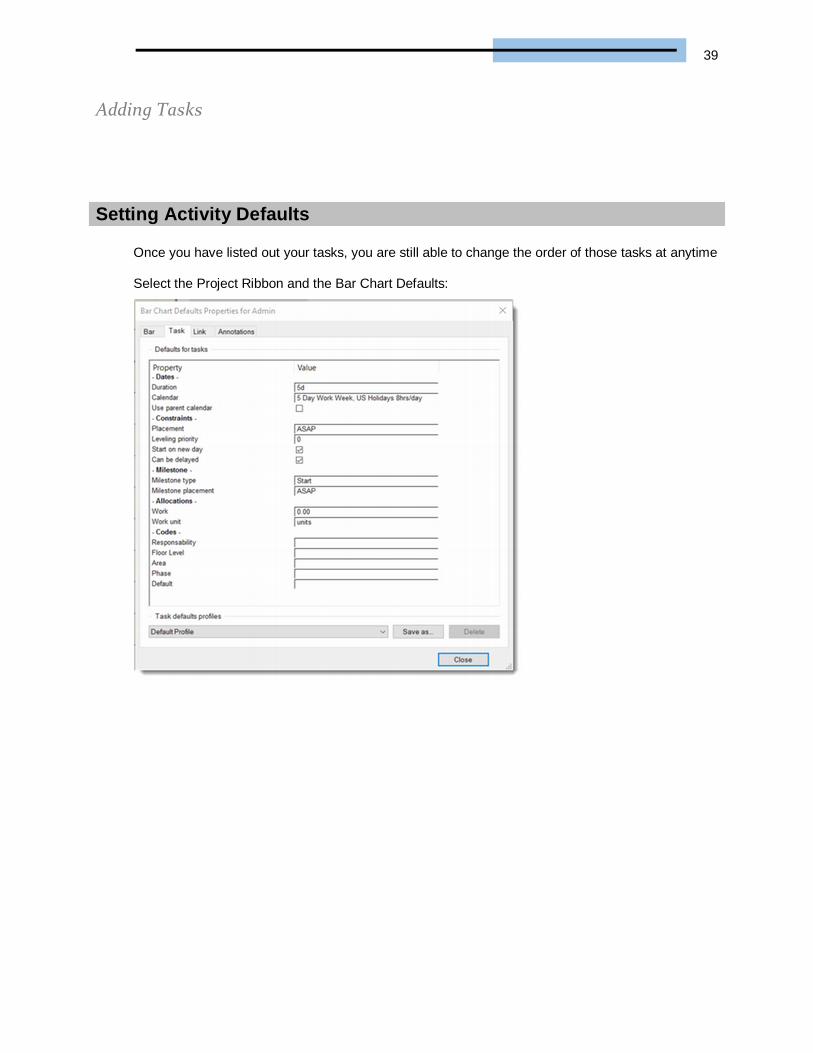
Setting Activity Defaults
Once you have listed out your tasks, you are still able to change the order of those tasks at anytime
Select the Project Ribbon and the Bar Chart Defaults:
40
Linking Tasks – Adding Logic
Chapter 6. Linking Tasks – Adding Logic
Once you have entered in your tasks you will need to consider the order that you wish to approach those
tasks. It is possible at this point to move the tasks into order by selecting the start and finish dates that
you wish to use
However, in order for the software to understand the order that you wish to work through your project, you
will need to link your tasks to indicate how they relate to each other
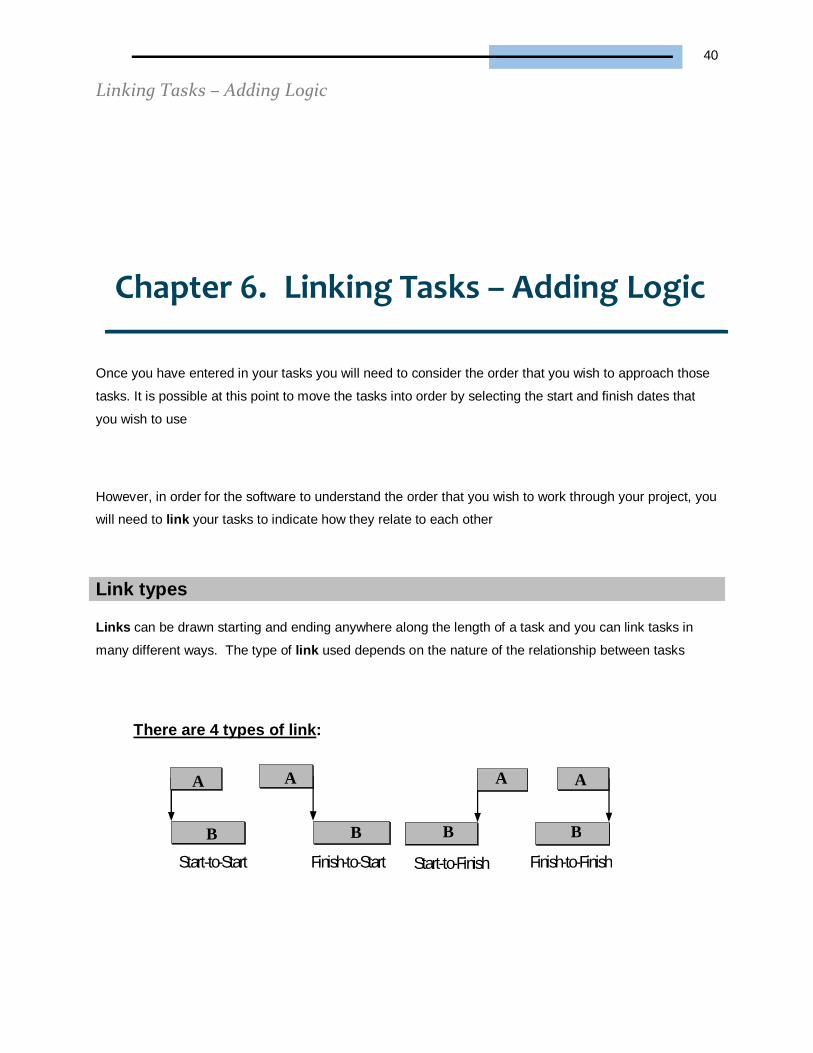
Link types
Links can be drawn starting and ending anywhere along the length of a task and you can link tasks in
many different ways. The type of link used depends on the nature of the relationship between tasks
There are 4 types of link:
Start-to-Start Finish-to-Finish Finish-to-Start Start-to-Finish
A
B
A A A
B B B

41
Linking Tasks – Adding Logic
In all cases, the direction of the arrow controls where the next task appears (A controls where B appears).
We do not recommend the use of Start-to-Finish relationships. Additionally, we caution using Start-to-
Start relationships since these result in open ends (or tasks where the finish may extend but would not
then impact any other activities). A best practices approach is to use Finish-to-Start relationships 80% of
the time so that the schedule is simple to understand and is more likely to be beaten.
Links are drawn between tasks using following cursor shapes:
End link Cursor:
This cursor shape indicates
that you are linking from / to
the end of a task
Start link Cursor:
This cursor shape indicates
that you are linking from / to
the start of a task
Mid-link Cursor:
This cursor shape enables you
to link from/to any midpoint
along the length of a task. A
pop up box will indicate your
exact position during the task,
e.g. 3 days into a 10 day task

42
Linking Tasks – Adding Logic
To draw a finish to Start link between 2 tasks:
� Place the mouse at the end and at the top or bottom corner of the first (predecessor) task to display the end link cursor
� Left click and drag to draw the link to the start of the corresponding (successor) task.
� Release the mouse when the Start Link cursor is displayed
A link is made between the 2 tasks. The link arrow is green. This means that the link is selected:
� Click elsewhere on the bar chart to deselect the link:
This now tells Asta PowerProject that task B cannot start before task A is finished
Sometimes it is necessary to show that tasks will happen simultaneously
To show this a link is drawn starting or ending somewhere along the length of a task known as a mid-
link.

43
Linking Tasks – Adding Logic
To draw a mid-link:
� Place the cursor at the start of the predecessor task. Without pressing move the cursor to the right so that the mid-link cursor is displayed
� A pop up box will indicate where during the task you are linking from
� Left click at the desired position and drag to move the pointer to the desired position on the successor task
� Release the mouse when the corresponding link cursor is displayed
Drawing links with lag time
There may be times when you need to insert a period of waiting or delay into your project, e.g. waiting for
paint or concrete to cure. We recommend inserting an actual activity that represents the lag (such as
Cure). This way there are not gaps or hidden delays in the schedule. That said, instructions follow to draw
links with lags.
LAG
Option 1:
� Draw a Finish to Start link
� Right click on the link and select Properties
� Click on the Link Start tab
� Enter the lead/lag time in days, e.g. 2d

44
Linking Tasks – Adding Logic
Option 2:
� Move the cursor to the bottom right hand corner of the predecessor task so that the end link icon appears, left click and keep the mouse button held down
� Press and hold the Shift button on the keyboard and with the mouse button still held down drag the cursor horizontally. A pop up box will appear displaying the lead/lag duration:
� Once you have reached the desired duration release Shift but keep hold of your mouse button and drag it over to where you want to end the link and let go:
Moving/Editing Links
If you have drawn a link incorrectly, you can simply ‘drag’ the link to the correct position, rather than
deleting & re drawing the link.
� Select the link (it will show as green)
� Hover the cursor over the end of the link you wish the move until a ‘cross’ cursor becomes visible:
� The link can now be dragged to the correct position
The link should have been
to the start of task 3
When the link is selected
the Drag/Move Cursor can
be displayed
Pull the link to the
correct position on the
task
Hold SHIFT
while drawing the

45
Linking Tasks – Adding Logic
Multiple links in a sequence can be highlighted by selecting the first link in the sequence, holding the
SHIFT key and selecting the last link in the sequence
Block linking
If you have more than 2 tasks to link together e.g. a whole section of work, the Add/Delete Links button
can be used:
� Select the tasks that you want to link
To link tasks that are next to each other on your chart click on the line number of the first bar. Left click &
drag downwards to select adjacent bars
To link tasks that are not next to each other on the chart hold the ctrl button on keyboard while clicking on
line number the task you want to link:
� Click the Add/Delete Links button on the Home tab and then ‘Link tasks’
Finish to Start links are placed between each of the tasks
� Note the short cut key Ctrl+F2
Link tasks mode
You can use Link Tasks mode to link tasks automatically as they are created, or as you select them one-
by-one in the bar chart. This saves you from having to create links separately by drawing them in the bar
chart.

46
Linking Tasks – Adding Logic
To link tasks automatically as they are drawn in the bar chart:
� On the Home tab, in the Schedule group, click the Add/Delete Links dropdown and select Link
Tasks Mode.
� The cursor changes shape to indicate that you are now in Link Tasks mode.
� Draw a task in the bar chart. Note that if a task was selected when you entered Link Tasks mode,
a link is drawn automatically from the selected task to the task that you have just drawn.
� Draw another task in the bar chart. As soon as you have finished drawing the task, a Finish-to-
Start link is drawn automatically from the first task to the second task
� As you draw further tasks, each new task is linked to the previous task automatically as long as
you remain in Link Tasks mode.
� To exit Link Tasks mode, on the Home tab, in the Schedule group, click the Add/Delete Links
dropdown and select Link Tasks Mode again, or press ESC.
To link tasks automatically as they are selected in the bar chart:
� On the Home tab, in the Schedule group, click the Add/Delete Links dropdown and select Link Tasks Mode.
The cursor changes shape to to indicate that you are now in Link Tasks mode.
� Click a task in the bar chart to select it. Note that if a task was selected when you entered Link Tasks mode, a link is drawn automatically from the selected task to the task that you have just selected.
� Click another task in the bar chart to select it. A Finish-to-Start link is drawn automatically from the first task to the second task:

47
Linking Tasks – Adding Logic
� As you select further tasks, each selected task is linked to the previously-selected task automatically as long as you remain in Link Tasks mode.
� To exit Link Tasks mode, on the Home tab, in the Schedule group, click the Add/Delete Links dropdown and select Link Tasks Mode again, or press ESC.
Cross Chart linking
Sometimes it is necessary to show logic links between tasks held in different charts in your project or
between the root chart of your project and tasks held in sub-charts. These links can be made by bringing
the tasks onto one screen to enable links to be drawn between them or by using the Link From/To
dialogue.
To display the tasks from different charts on one screen:
� Click on Program in the Project View
� Hold down the Ctrl key on the keyboard and also click on the expanded chart in the Project View
Tasks from both charts are now displayed on the same screen, and links have been drawn between tasks
as required.

48
Linking Tasks – Adding Logic
Alternatively, the Link From/To dialogue can be used. This is useful if the tasks are not near to each
other and links cannot easily be drawn between them.
� Right click on the required task in whichever chart of your project
� Select Linking > Add Link. The Link from/to dialogue appears.
� Enter the name of the task you are linking to in the ‘Task Name’ field and click Link
Linking tasks without drawing on the Bar Chart

49
Linking Tasks – Adding Logic
As well as drawing links directly onto the Bar Chart using the mouse, you can also link tasks by selecting
one or more tasks in the Bar Chart and specifying the task you want to link to by name. Creating links in
this way is an easy way to link tasks which are not close to each other in the Bar Chart
� Right click on a task or tasks on the Bar Chart
� Select Linking > Add Link:
The Link From/To dialogue box is displayed:
� Indicate whether you are linking from or to the selected task(s)
� Identify the task you are linking to
� Select the type of link
� Press Link and Close
The Wild Card

50
Linking Tasks – Adding Logic
� . By placing an asterix (SHIFT + ‘8’ on your keyboard) after the first few letters or words of the
task to which you are linking. This acts as a wild card and it will search for all tasks that begin
with those letters or words
� If it finds more than one task beginning with these letters or words it will give you the choice of
which task you want to link to
Reviewing links
Once tasks are linked, you may wish to add, remove, or change links/logic. You may also wish to trace
logic by jumping from one task to another using the links or view a task’s complete chain of predecessors
or successors.
Bar and Task Properties
� Right click on the grey line # or the bar itself
� Select Properties > Links tab
� Adjust as needed.
� To Go To / Jump to a predecessor/successor, double click on the task within the Properties > Links window

51
Linking Tasks – Adding Logic
Path to/from Task
Use this option to see all the incoming or outgoing tasks from the one in question. For example, if a
project contains a task that relates to the delivery of an item, you could use the Path from Task mode to
show the supplier how many taks would be affected by a delivery delay.
� Select one task
� Select View in the ribbon and Path to Task (or Path from Task) to Right click on the grey line # or the bar itself

52
Linking Tasks – Adding Logic
Exercise: Link activities in 3 Phases
� Link each activity in each Organizational Structure element; � Link the starting activity in each element to its predecessor in another
element; � Link the finish activity in each element to its appropriate successor in
another element.

53
Managing Tasks and Groups
Chapter 7. Managing Tasks and Groups
Once the project is underway, you should record its progress at regular intervals. Recording progress
ensures that your project is kept up to date and lets you see if work is progressing as planned or if there
are delays. It also ensures that you know how much work remains to be done to complete the project
and will also give you a projected program end date
Copy Tasks and Bars
To paste a bar or task into the active view, first cut or copy the bar or task to the Clipboard then do any of
the following:
� On the Home tab, in the Clipboard group, click the Paste dropdown and select Paste.
� Press CTRL V or SHIFT INSERT.
� Right-click the bar chart and select Paste.
When pasting bars, if a bar or task is selected in the view when you paste, then the bars on the Clipboard
are inserted into the view above the selected bar or task.
When pasting tasks, if a bar or task is selected in the view when you paste, then the tasks are pasted
onto that bar.
If there are no bars or tasks selected in the view, the bar or task on the Clipboard is pasted at the bottom
of the view.
If you right-click a blank area of a bar and select Paste, the bars or tasks on the Clipboard are inserted
above the bar on which you right-clicked, or at the bottom of the view.
You can copy a task, or a group of tasks, by CTRL-dragging it along the same bar or onto a different bar.

54
Managing Tasks and Groups
You can specify whether tasks that have been copied from external applications (rather than from within
the project itself) inherit code library assignments, calendar and the 'use parent calendar' setting, plus the
WBS code, from a neighbouring task or from the bar chart defaults. To do this:
1. Click the File tab, then click Options. The Options dialog appears.
2. Click the Edit tab.
3. Select the Inherit attributes from neighbouring task check box to specify that new tasks
should inherit these attributes from a neighbouring task where possible, or clear the check box to
specify that they should inherit these attributes (except WBS code) from the default settings that
have been defined on the Task tab of the Bar Chart Defaults Properties dialog.
4. Click OK.
When the selection you have copied includes one or more spreadsheet cells, selecting the Paste
command pastes the data values and any formatting that has been applied to the cells. If you want to
paste the data values without any formatting that has been applied to the cells, so that the pasted values
take the appearance of the default spreadsheet font, on the Home tab, in the Clipboard group, click the
Paste dropdown and select Paste Values.
Task Pools
Task pools will allow you to save ‘scopes of work’ such as those for a particular build type or
house plan or any tasks that are grouped together under summary bars (or in expanded tasks) to
form ‘phases’ of work in a project
These can then be copied through the program to show repeated work or used as a starting point
in new programs.

55
Managing Tasks and Groups
To create a new task pool:
� Where you have a group of tasks grouped together right click on the relevant summary bar on either the bar chart or the project view
� Select ‘Copy to task pool’
� The task pool will then display in the project view on the left hand side of the screen. It can be used again in the same project or saved into a project template for use in future projects
When you want to add this network of tasks into a project:
� Move your cursor over the task pools in the project view
� Click and drag the task pool to the position that you would like them to start in the project
You will then see the network of tasks copied into the project.
Copy and Paste Summary Tasks
Copy and Paste a Summarized group of tasks by selecting the Summary Task and with a right-click
select copy. The right-clicking again select Paste. The pasted group of tasks will appear above the
selected task.

56
Managing Tasks and Groups
Hammock Tasks
Use the notes below to create a Hammock Task for the Projects duration.
Hammocks are used to show an overview of related tasks that are not next to each other in the
project. Like summaries & expanded tasks, hammock tasks take their total duration from the tasks
within them. The hammock and its contents are displayed at the foot of your project.
� Select an empty bar of your project by clicking on the line number
� On the Home tab in the Insert section select Hammock
� Name the Hammock task
To add tasks to a Hammock:

57
Managing Tasks and Groups
� Right click on a task
� Select ‘Add to Hammock’ from the list
� Select the hammock if there is more than one and click OK
� Repeat to add additional tasks
A copy of each task is shown within the hammock:
To remove tasks from a Hammock:
� Right click on a task
� Select ‘Remove from Hammock’ from the list
Necking to show the location of subordinate tasks
You can change the appearance of your hammock and summary tasks by ‘necking’ or ‘pinching’ it to
show where the subordinate tasks are located.

58
Managing Tasks and Groups
� Right click on the Bar chart
� Select Format Bar chart from the Format tab on the ribbon or right click anywhere on the Bar chart & select Format Bar Chart from the list
� Select the Non-working tab, un-tick the On tasks check box under Draw non-working shading
� Then tick neck summary tasks to show where no tasks
This will now show necking in the summary bars and your hammocks. The necked areas show where
there are no tasks.
Buffer Tasks
Most projects will have a period of contingency planned into the program to allow for delays.
This could be hidden by being planned into the duration of each task. Alternatively, it could be marked by
using a finish constraint on the desired completion date, resulting in float throughout the program if tasks
finish earlier than the constrained date.

59
Managing Tasks and Groups
Buffer tasks can be used to collect the entire contingency of a plan, making it explicit. Buffer tasks protect
important dates and reduce excess float.
A buffer contributes to the Critical Path calculation, but when its start date is affected, it will shrink or
expand in duration without moving beyond its finish date or the start date of successor tasks, filling time
that may otherwise show as float on a project and thereby protecting the Critical Path.
This technique is often referred to as Critical Chain.
Consider the example below:
There are two types of buffer tasks:
� Feeder buffers – which sit within the project protecting key dates of successor tasks. If a task has an outgoing link, it is a feeder buffer.
� Project buffers – usually the last task in a project protecting a specified finish date. The task has no outgoing link and will have a deadline flag applied to it when created.
A
B
Without buffer –Design is changed
to 1 week and causes the project
With Buffer – Design is changed
to 1 week, although this affects
the project, the buffer increases

60
Managing Tasks and Groups
Buffer tasks will only move beyond their finish date, or delay the start of successor tasks, once they
are completely consumed, at which point they are turned automatically into finish milestones.
To create a Buffer:
� Create a new task of the required contingency duration or select an existing task within the project
� Link the task into the project and reschedule so that the task takes up the correct position within the project
� Right Click on the task and go to Make Into > Buffer Task
� If the task has no successors (project buffer) a deadline flag is applied to it
� If the task is within the project (feeder buffer) then the successor task will need to be constrained by a flag or by some other task within the project
� Reschedule
Hiding Tasks
Sometimes you may choose to hide certain tasks before printing. They can easily be put back onto
display at any time.
In order to hide specific bars or tasks, you must first mark them for
hiding.
� Right-click the bar or task and select Mark for Hiding from the menu that appears
� Once you have marked items you can hide them from view at any time by clicking the Hide/Show command on the Format tab. Clicking it again will unhide the tasks

61
Managing Tasks and Groups
To unmark the items so they are not hidden in future:
� Right click on the task/bar
� Select ‘Mark for Hiding’ again to unmark the items
62
Rescheduling a Project Schedule
Chapter 8. Rescheduling a Project
Schedule
When you have linked your tasks, you can Reschedule the project. The reschedule performs a series of
actions:
� Places the start of the first task at the beginning of the project
� Calculates the optimum start and end dates of all tasks according to the logical links applied
� Calculates whether a task has any float attached
� Shows whether a task is Critical (Critical Path Analysis)
� Identifies any constraints which have been exceeded
� Calculates the earliest project end date
To Reschedule the project
On the Home tab and click the Reschedule command or use the shortcut key F9.

63
Rescheduling a Project Schedule
� The critical path of the project is shown outlined in red
Changing the project start date
The start date of the project can be changed at any time. This will control when the first task in your
project will reschedule to.
To change the Start date:

64
Rescheduling a Project Schedule
� In the File tab, select Advanced Properties
� Change the Imposed Start to the new project start date
� Click Close
� Reschedule the project to see the new start date take effect

Glossary
Chapter 9. Assigning Constraints
Once the tasks have been linked and rescheduled, your project will be laid on the most logical order.
What we have yet to take into consideration are any fixed dates that will need to be adhered to, such as a
specific start on site date or a contract completion date
To show fixed dates in your project, and to show the impact they have on the rest of the tasks in your
project you will need to use Constraints on those tasks
Best practices have shown that use of Constraints should be limited. We recommend constraining
contractural milesones only with simple Start On / Finish On. By limiting the use of Constraints, the
network of linked tasks will change based on logic.
Adding a constraint
To add a constraint to a task:
� Select the task you wish to constrain and move it to the required date position
� On the Home tab click on the drop down arrow under the Constraint Flag command

Glossary
� Select the constraint you wish to impose on the task
� Once the constraint has been added to the task, an flag will appear in on the task. Additionally the date in the table will be followed by an asterisk.
Types of Constraint
Start on or after - RECOMMENDED
A soft constraint that will allow the task to move as it is
driven by logic. Total Float is then used to measure
progress against the desired target date. In addition, the
flag itself will remain fixed on the target date in bar chart
regardless of the position of the task.
Start on
A hard constraint which will fix the start of the task to a
constraint date
Finish on or before - RECOMMENDED
A soft constraint that will allow the task to move as it is
driven by logic. Total Float is then used to measure
progress against the desired target date. In addition, the
flag itself will remain fixed on the target date in bar chart
regardless of the position of the task.
Glossary
Deadline
A soft constraint which works as a warning but will allow the
project to move beyond the target deadline
Finish on
A hard constraint that will fix the end date of the task to the
constraint date
Work between
A soft constraint that will allow either the start or the end date to
be constrained between
Holding pin
A Constraint which will move with the task if the task is manually
moved
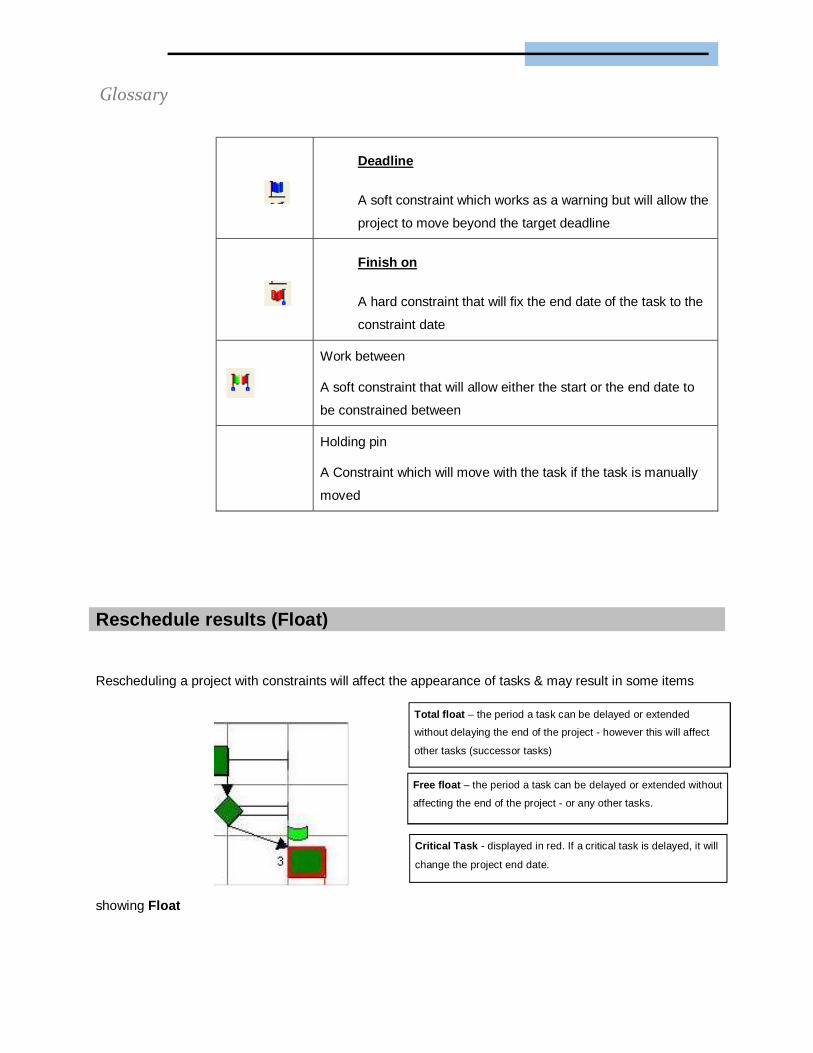
Reschedule results (Float)
Rescheduling a project with constraints will affect the appearance of tasks & may result in some items
showing Float
Critical Task - displayed in red. If a critical task is delayed, it will
change the project end date.
Total float – the period a task can be delayed or extended
without delaying the end of the project - however this will affect
other tasks (successor tasks)
Free float – the period a task can be delayed or extended without
affecting the end of the project - or any other tasks.

Glossary
Run a Filter for the Critical Path
From the View Ribbon select the Filter, Tasks, Longest Path.
Now you can make final adjustments to your Project Duration.