Embed Size (px)
Citation preview
Economics
Introduction to Basis, Cash Forward Contracts, HTA
Contracts and Basis Contracts
UK Grain Marketing Series January 19, 2016
Todd D. Davis
Assistant Extension Professor
Economics
Outline
• What is basis and how can we use basis in marketing decisions?
• Using Cash Forward Contracts (CFC), basis contracts and Hedge-to-Arrive (HTA) contracts
• Update on January WASDE reports • Commodity Challenge update
Economics
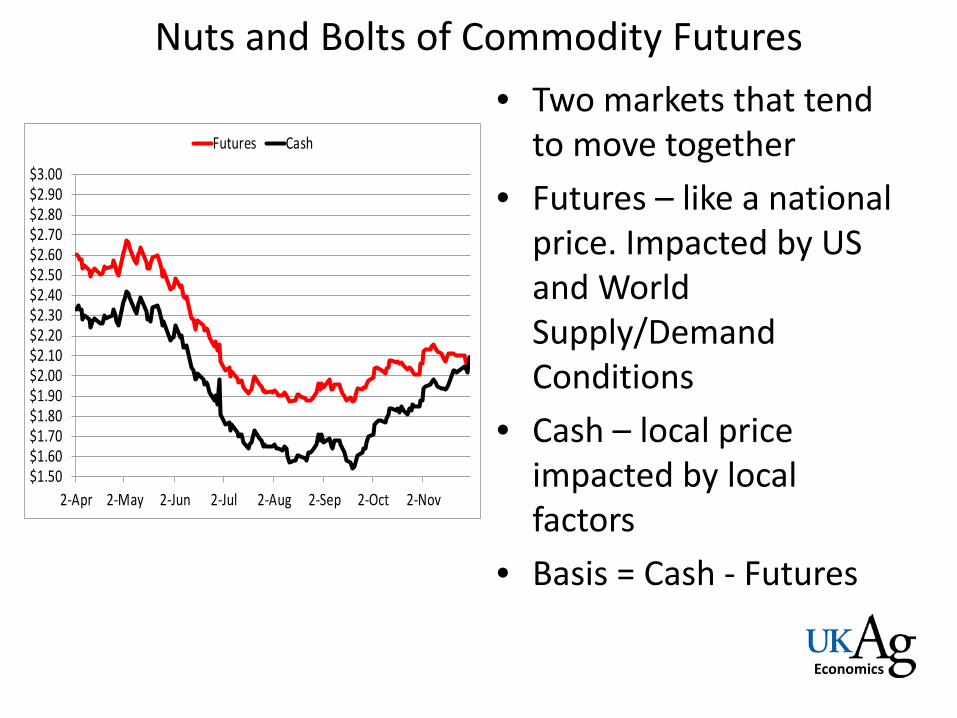
Nuts and Bolts of Commodity Futures • Two markets that tend
to move together • Futures – like a national
price. Impacted by US and World Supply/Demand Conditions
• Cash – local price impacted by local factors
• Basis = Cash - Futures
$1.50$1.60$1.70$1.80$1.90$2.00$2.10$2.20$2.30$2.40$2.50$2.60$2.70$2.80$2.90$3.00
2-Apr 2-May 2-Jun 2-Jul 2-Aug 2-Sep 2-Oct 2-Nov
Futures Cash

Hedging - Review • Sell futures when you have commodity to
sell in the future • Sell contract month nearest when you
intend to deliver or the next one after • Offset (buy) futures position when you sell
commodity • If prices fall, we gain on futures • If prices rise, we gain in cash market
Economics
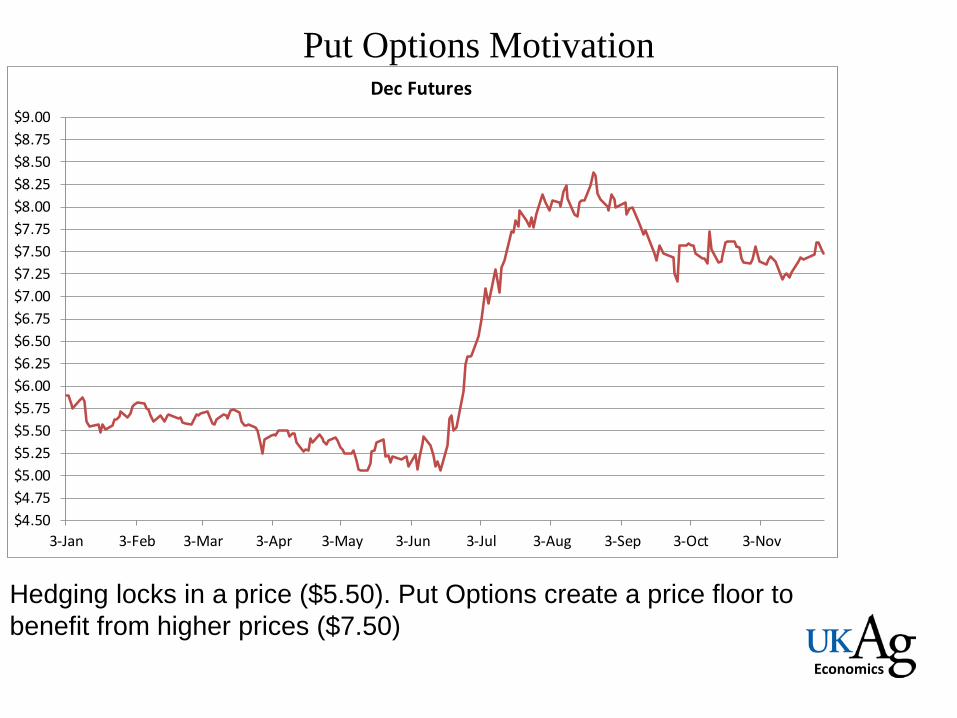
Put Options Motivation
$4.50$4.75$5.00$5.25$5.50$5.75$6.00$6.25$6.50$6.75$7.00$7.25$7.50$7.75$8.00$8.25$8.50$8.75$9.00
3-Jan 3-Feb 3-Mar 3-Apr 3-May 3-Jun 3-Jul 3-Aug 3-Sep 3-Oct 3-Nov
Dec Futures
Hedging locks in a price ($5.50). Put Options create a price floor to benefit from higher prices ($7.50)
Economics
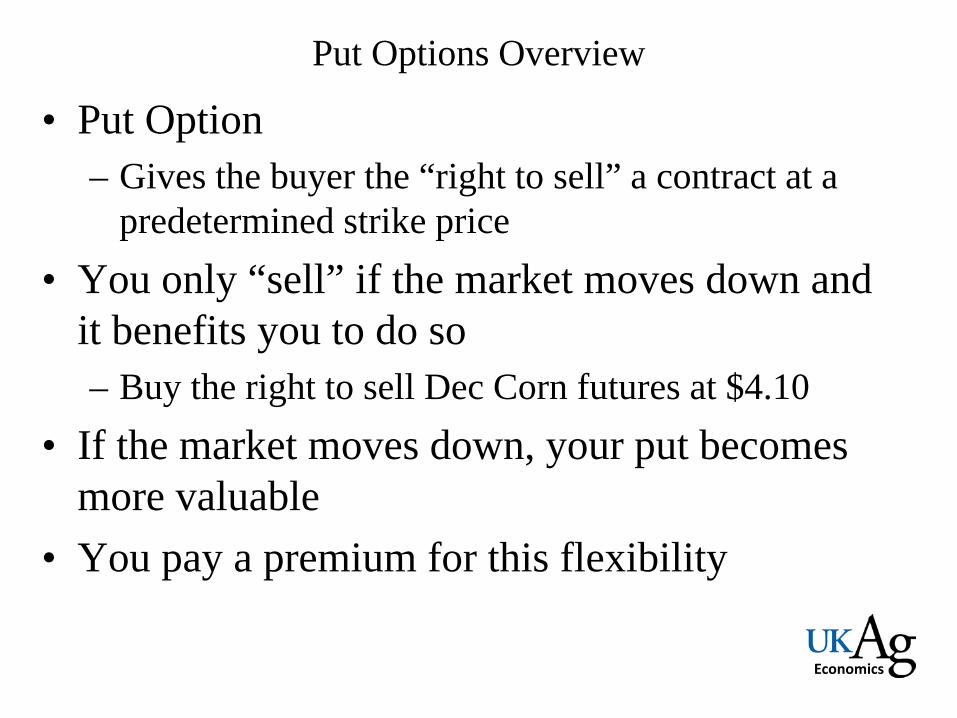
Put Options Overview
• Put Option – Gives the buyer the “right to sell” a contract at a
predetermined strike price • You only “sell” if the market moves down and
it benefits you to do so – Buy the right to sell Dec Corn futures at $4.10
• If the market moves down, your put becomes more valuable
• You pay a premium for this flexibility
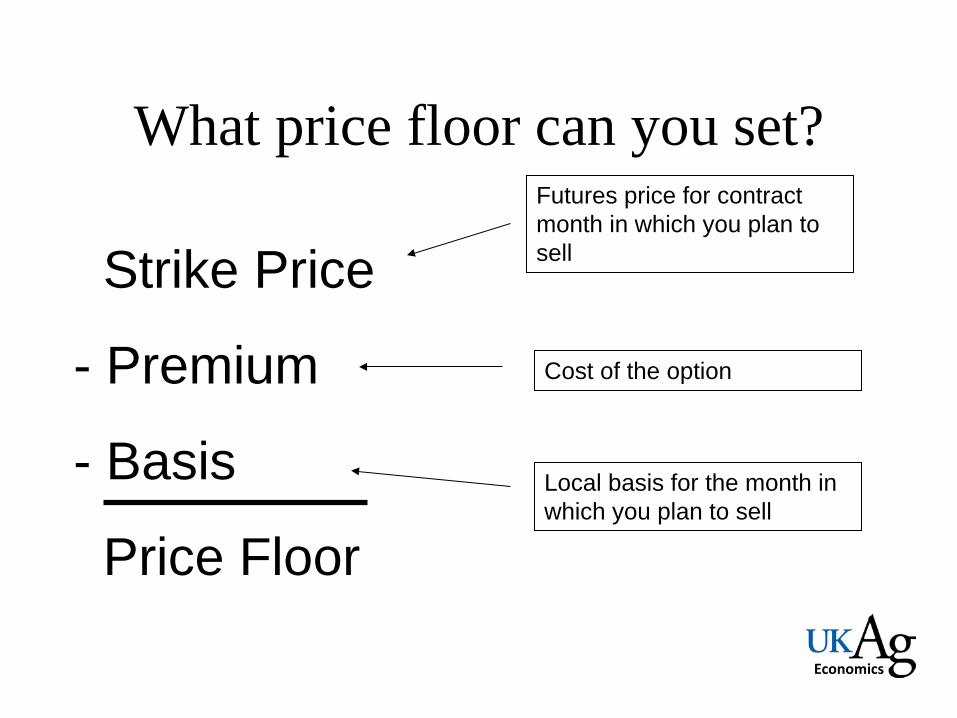
What price floor can you set?
Strike Price
- Premium
- Basis
Price Floor
Futures price for contract month in which you plan to sell
Local basis for the month in which you plan to sell
Cost of the option
Economics
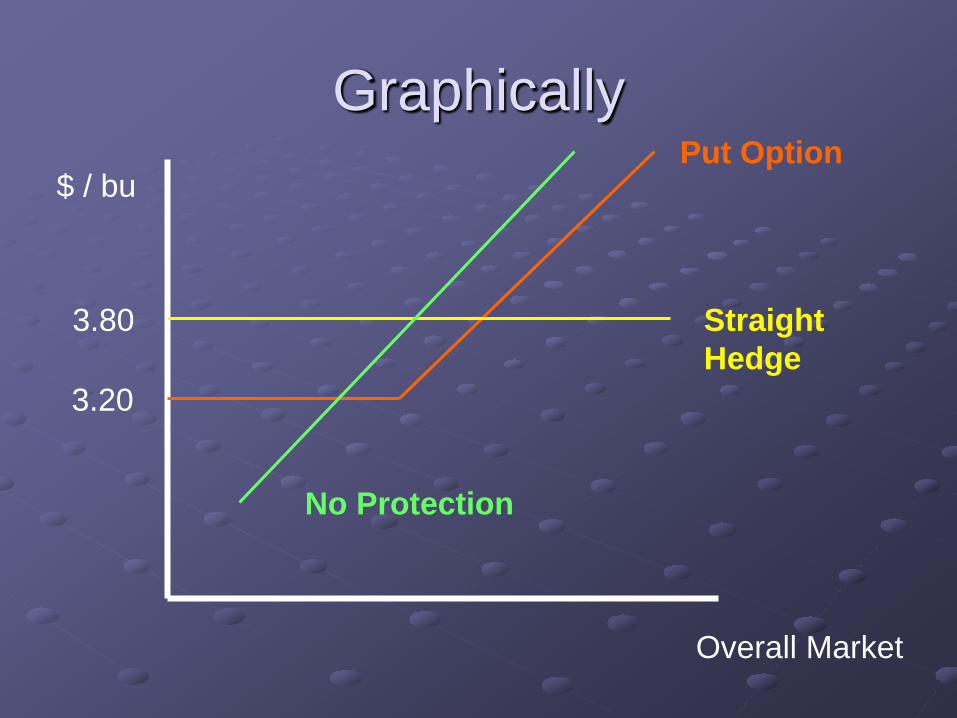
Graphically
3.20
3.80
Put Option
Straight Hedge
Overall Market
$ / bu
No Protection

What is basis? • The difference between local cash prices
and the futures price • cash price – futures price = BASIS
– Cash price is local price – Futures is a national price – Basis localizes the Futures price
• Negative basis sometimes expressed as “under” – “New crop corn bids are $0.30 under the
December board” Economics
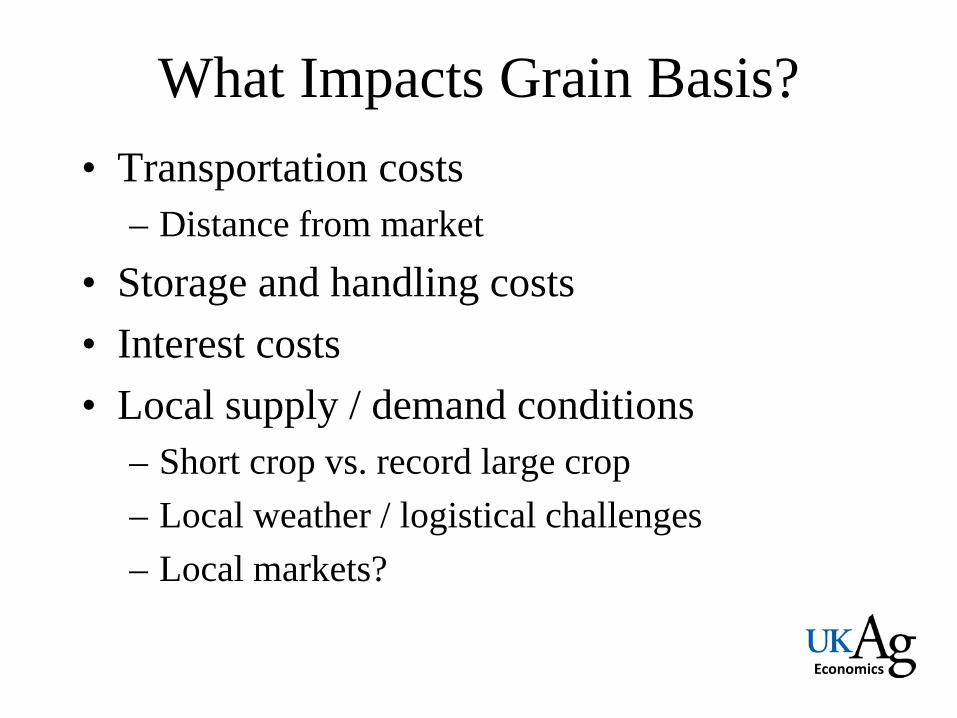
What Impacts Grain Basis? • Transportation costs
– Distance from market • Storage and handling costs • Interest costs • Local supply / demand conditions
– Short crop vs. record large crop – Local weather / logistical challenges – Local markets?
Economics
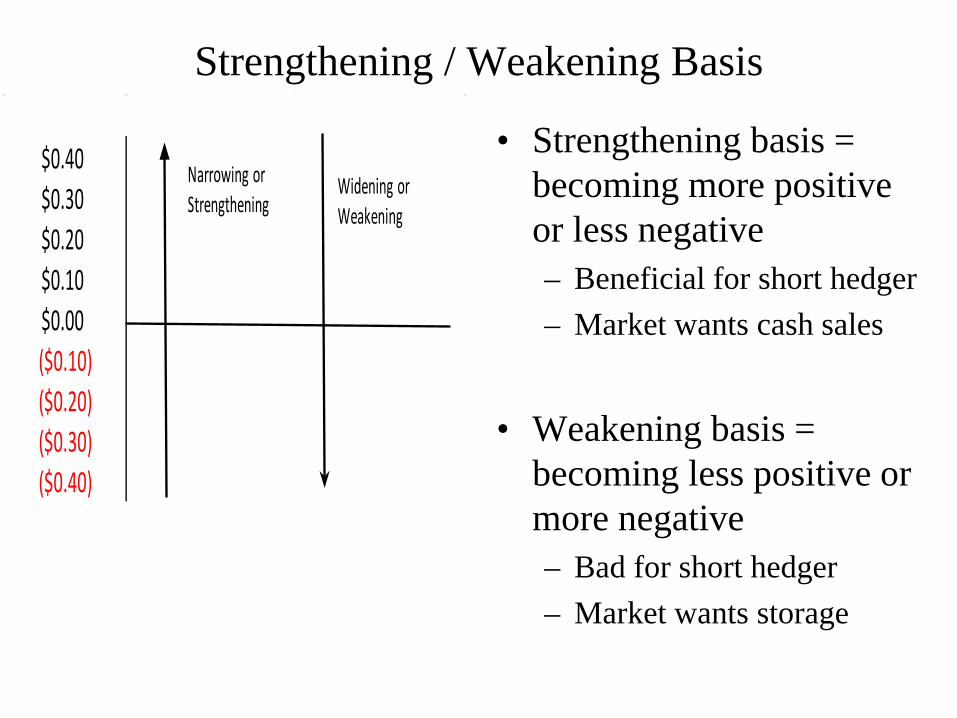
Strengthening / Weakening Basis
• Strengthening basis = becoming more positive or less negative – Beneficial for short hedger – Market wants cash sales
• Weakening basis =
becoming less positive or more negative – Bad for short hedger – Market wants storage
$0.40$0.30$0.20$0.10$0.00($0.10)($0.20)($0.30)($0.40)
Narrowing orStrengthening
Widening orWeakening
Economics
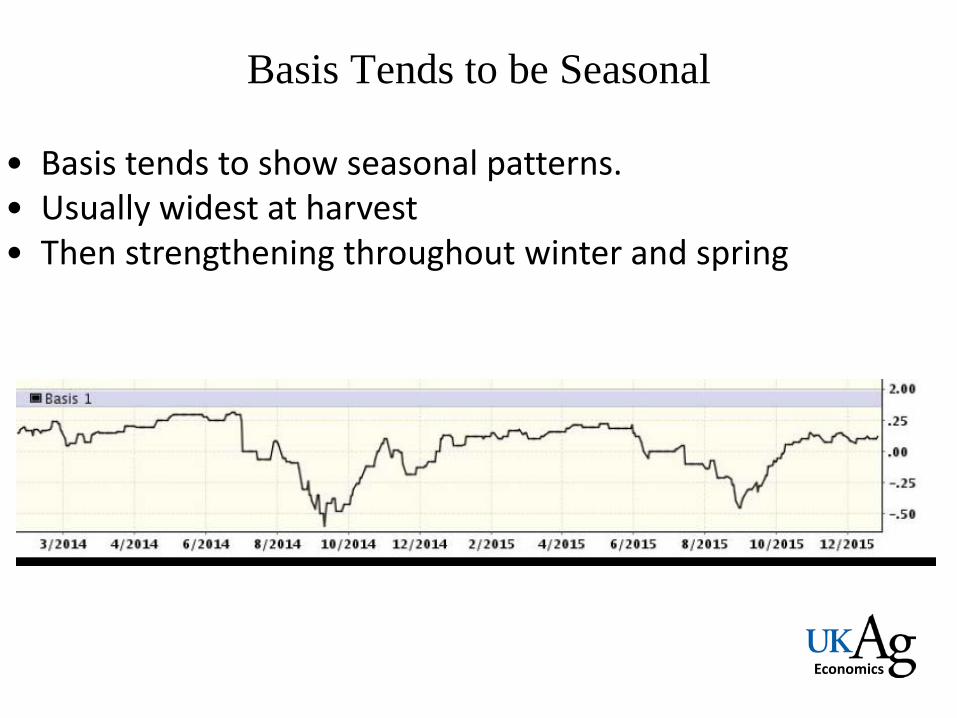
Basis Tends to be Seasonal
• Basis tends to show seasonal patterns. • Usually widest at harvest • Then strengthening throughout winter and spring

Economics
Using Basis to Forecast Price • Basis = Cash – Futures
• If you know expected basis (Average of 3-5
years), you can use that with current futures price to forecast a cash price
• EX: If Basis @ harvest averages -$0.25 / DEC in October, Current DEC Futures = $3.75. Expected cash is $3.50
Economics
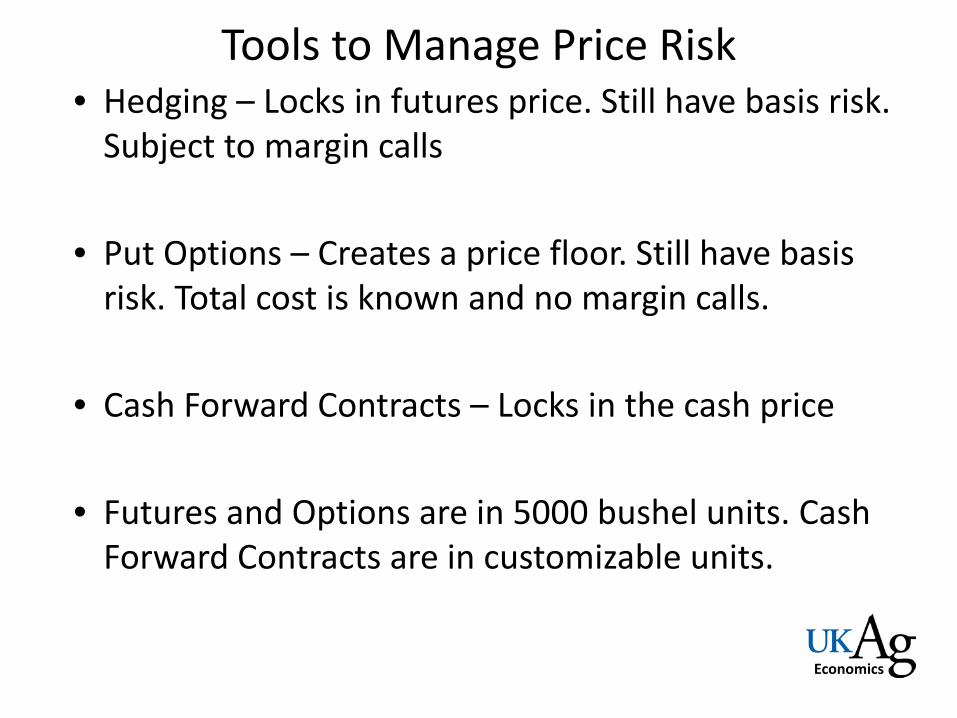
Tools to Manage Price Risk • Hedging – Locks in futures price. Still have basis risk.
Subject to margin calls
• Put Options – Creates a price floor. Still have basis risk. Total cost is known and no margin calls.
• Cash Forward Contracts – Locks in the cash price
• Futures and Options are in 5000 bushel units. Cash Forward Contracts are in customizable units.
Economics
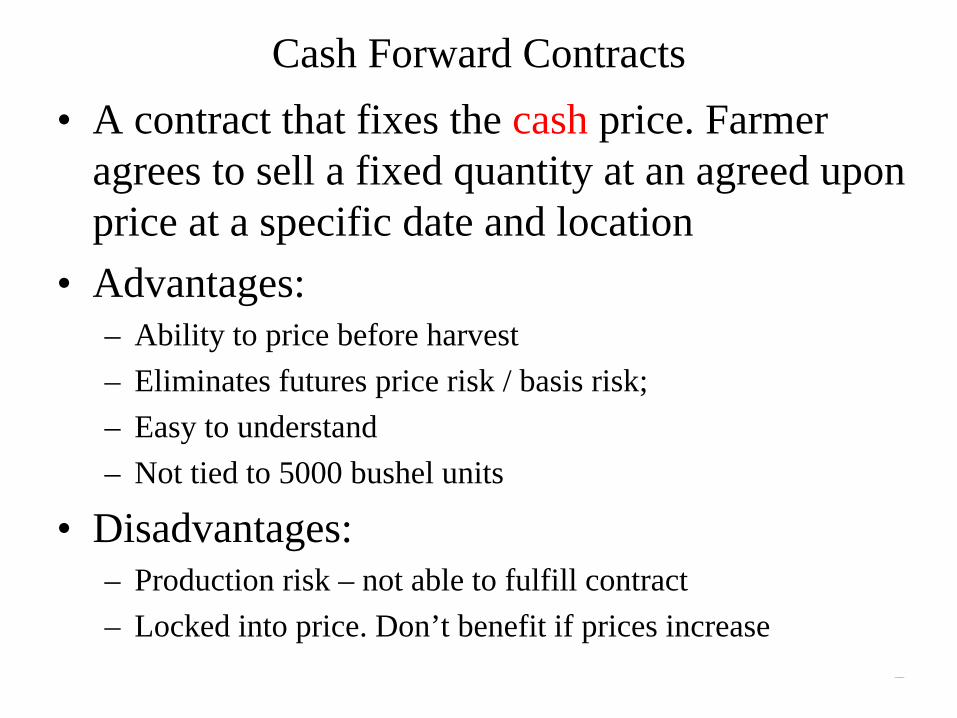
• A contract that fixes the cash price. Farmer agrees to sell a fixed quantity at an agreed upon price at a specific date and location
• Advantages: – Ability to price before harvest – Eliminates futures price risk / basis risk; – Easy to understand – Not tied to 5000 bushel units
• Disadvantages: – Production risk – not able to fulfill contract – Locked into price. Don’t benefit if prices increase
Cash Forward Contracts

Economics
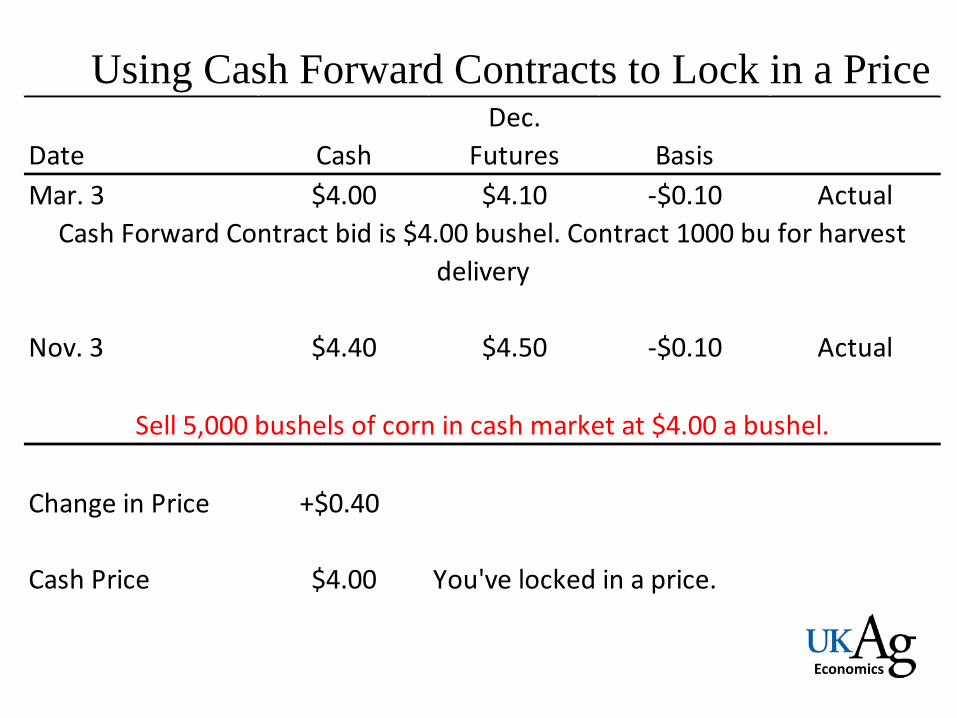
Using Cash Forward Contracts to Lock in a Price
Dec.Date Cash Futures BasisMar. 3 $4.00 $4.10 -$0.10 Actual
Nov. 3 $3.80 $3.90 -$0.10 Actual
Change in Price -$0.20
Cash Price $4.00 You've locked in a price.
Cash Forward Contract bid is $4.00 bushel. Contract 1000 bu for harvestdelivery
Sell 5,000 bushels of corn in cash market at $4.00 a bushel.
Economics
Using Cash Forward Contracts to Lock in a Price Dec.
Date Cash Futures BasisMar. 3 $4.00 $4.10 -$0.10 Actual
Nov. 3 $4.40 $4.50 -$0.10 Actual
Change in Price +$0.40
Cash Price $4.00 You've locked in a price.
Cash Forward Contract bid is $4.00 bushel. Contract 1000 bu for harvestdelivery
Sell 5,000 bushels of corn in cash market at $4.00 a bushel.
Economics
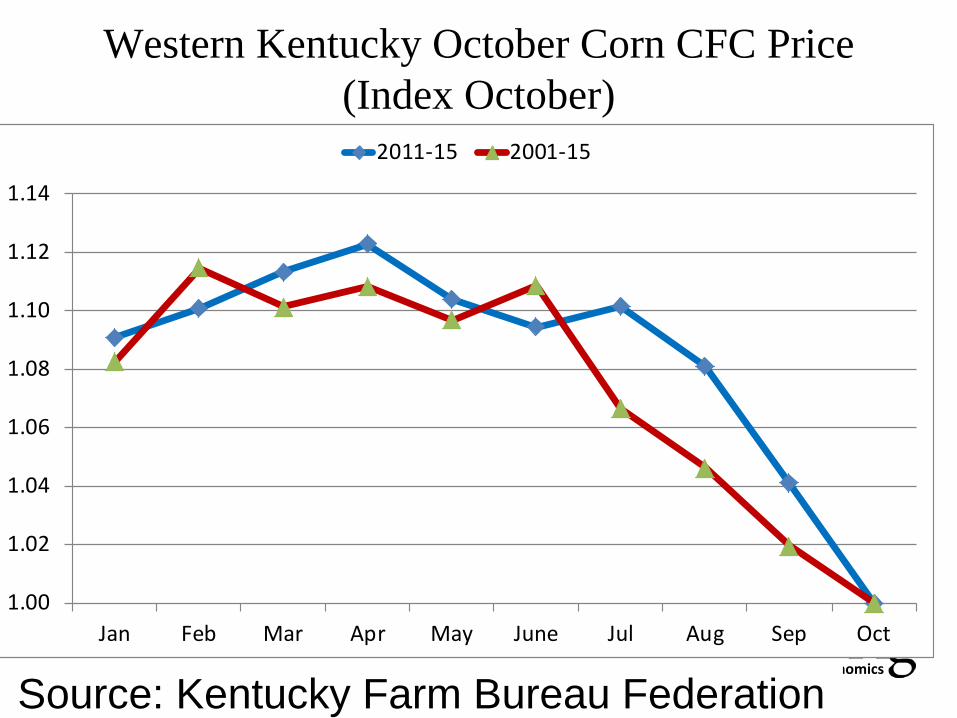
Western Kentucky October Corn CFC Price (Index October)
Source: Kentucky Farm Bureau Federation
1.00
1.02
1.04
1.06
1.08
1.10
1.12
1.14
Jan Feb Mar Apr May June Jul Aug Sep Oct
2011-15 2001-15

Economics
Change in October CFC Corn Price from April to October
-$0.22
$0.51
-$0.02
-$1.24
-$0.48
$0.44
-$0.02
-$1.93
-$0.31
$1.53
$0.05
$2.18
-$1.05
-$1.89
-$0.15
-$2.50
-$2.00
-$1.50
-$1.00
-$0.50
$0.00
$0.50
$1.00
$1.50
$2.00
$2.50
2001 2002 2003 2004 2005 2006 2007 2008 2009 2010 2011 2012 2013 2014 2015
Western Kentucky Spot price in October is lower 67% of the years. The average decrease is $0.73 / bushel.
Economics
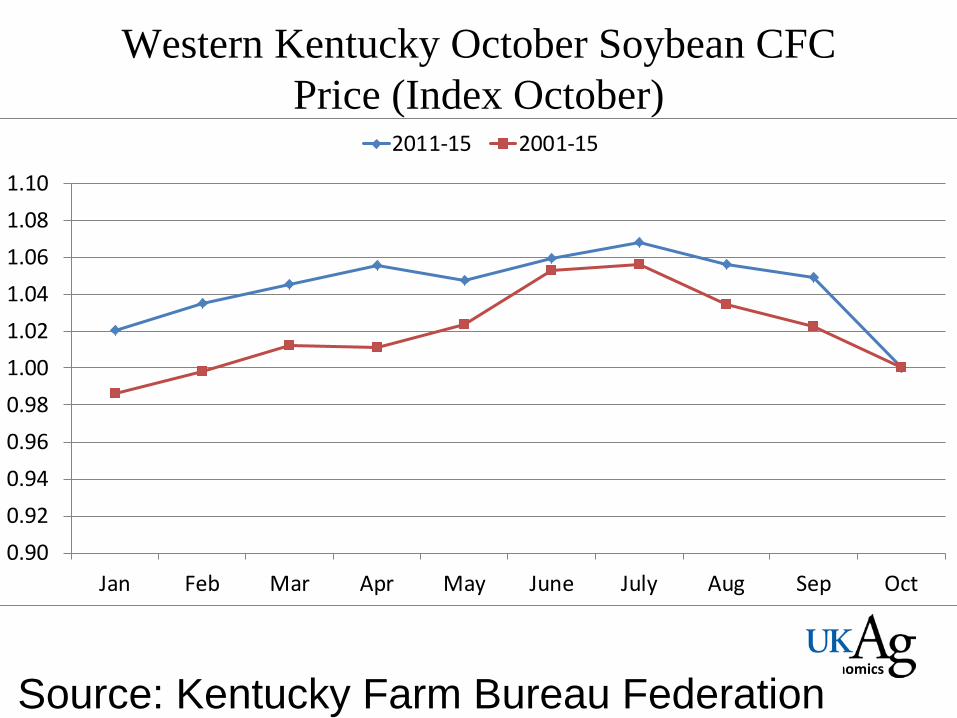
Western Kentucky October Soybean CFC Price (Index October)
Source: Kentucky Farm Bureau Federation
0.900.920.940.960.981.001.021.041.061.081.10
Jan Feb Mar Apr May June July Aug Sep Oct
2011-15 2001-15
Economics
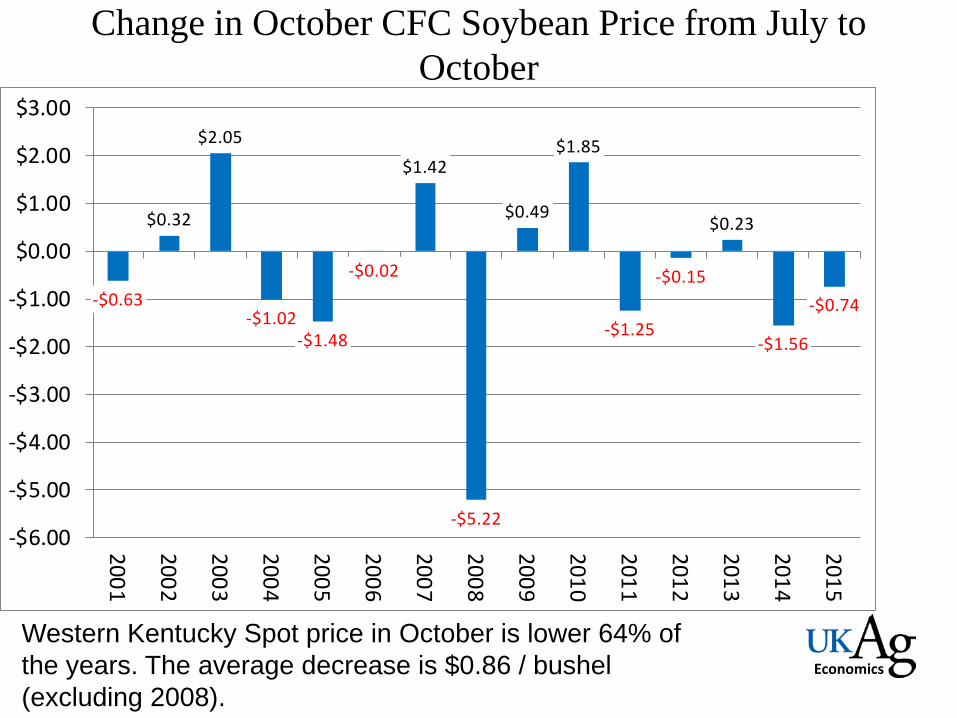
Change in October CFC Soybean Price from July to October
Western Kentucky Spot price in October is lower 64% of the years. The average decrease is $0.86 / bushel (excluding 2008).
-$0.63
$0.32
$2.05
-$1.02-$1.48
-$0.02
$1.42
-$5.22
$0.49
$1.85
-$1.25
-$0.15
$0.23
-$1.56
-$0.74
-$6.00
-$5.00
-$4.00
-$3.00
-$2.00
-$1.00
$0.00
$1.00
$2.00
$3.00
2001
2002
2003
2004
2005
2006
2007
2008
2009
2010
2011
2012
2013
2014
2015
Economics
Hedging vs. Cash Forward Contracting (CFC) • Both lock in price:
– Hedging locks in Futures / CFC locks in cash • Hedging allow flexibility to select final delivery
point • Hedging allows easier flexibility to reverse
decision. CFC’s may not be easy to change your mind without penalty payments
• Hedging allows for basis speculation (hope of strengthening vs. fear of weakening).
• Hedging allows for longer marketing as Futures contracts are available 18 to 24 months in advance.
Economics
Advantages of CFC • Forward contracting – know the final price with
certainty • Forward contracting is simpler as don’t need
broker or understanding futures • Forward contracting doesn’t require margin
accounts or margin calls for cash flow problems • Forward contracting isn’t in 5000 bu lots. Can
customize to meet needs.
Economics
Basis Contracts • Allows to lock in basis for grain when basis is acceptable but
futures price is unacceptable and believe there will be higher future prices
• Have deadline to fix the futures price. At decision-time, can fix futures price or roll into another contract month (after paying a fee)
• Advantages: – Basis is locked and can’t widen (weaken) – Can benefit from rallies in the futures market
• Disadvantages – Can’t benefit from strengthening (narrowing) basis – Exposed to future price risk – If roll the contract, subject to market spreads and fees to roll
between contract months.
Economics
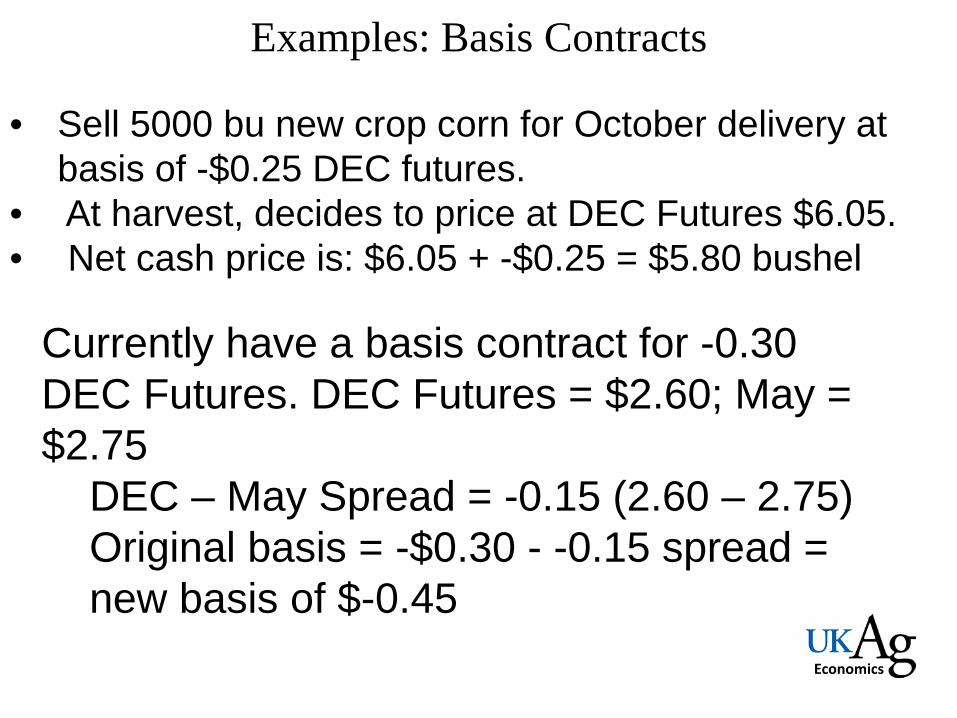
Examples: Basis Contracts
• Sell 5000 bu new crop corn for October delivery at basis of -$0.25 DEC futures.
• At harvest, decides to price at DEC Futures $6.05. • Net cash price is: $6.05 + -$0.25 = $5.80 bushel
Currently have a basis contract for -0.30 DEC Futures. DEC Futures = $2.60; May = $2.75
DEC – May Spread = -0.15 (2.60 – 2.75) Original basis = -$0.30 - -0.15 spread = new basis of $-0.45
Economics
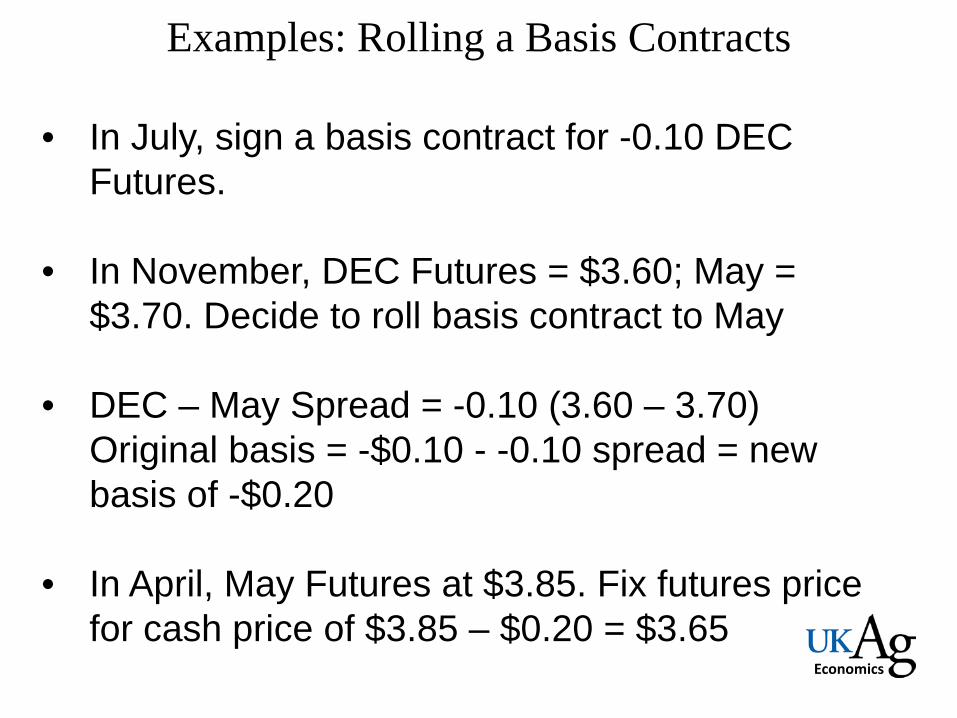
Examples: Rolling a Basis Contracts
• In July, sign a basis contract for -0.10 DEC Futures.
• In November, DEC Futures = $3.60; May = $3.70. Decide to roll basis contract to May
• DEC – May Spread = -0.10 (3.60 – 3.70) Original basis = -$0.10 - -0.10 spread = new basis of -$0.20
• In April, May Futures at $3.85. Fix futures price for cash price of $3.85 – $0.20 = $3.65
Economics
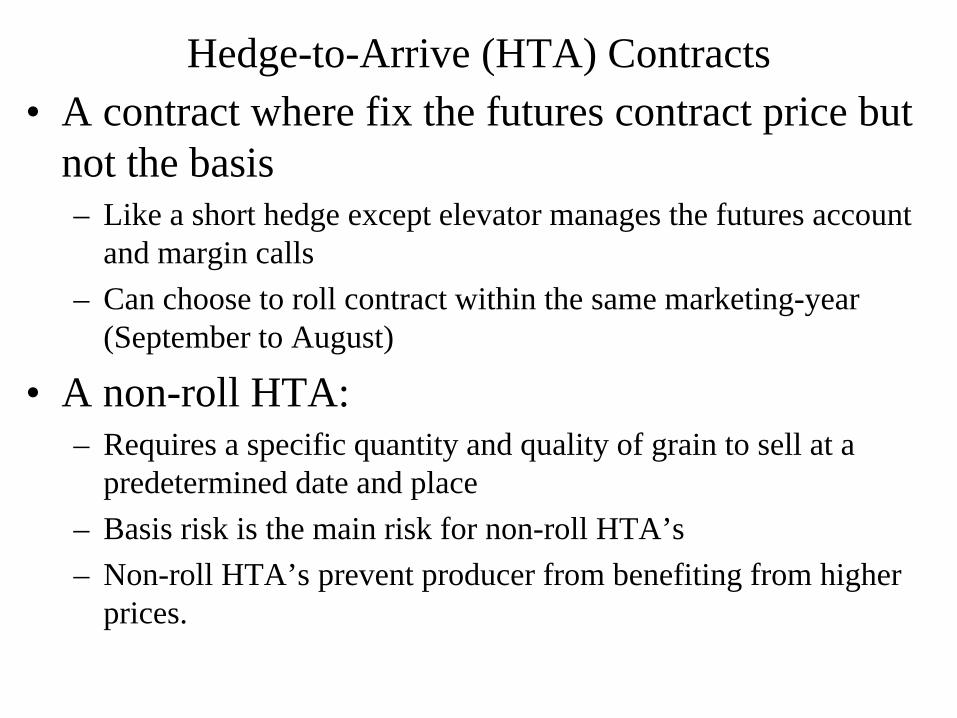
Hedge-to-Arrive (HTA) Contracts • A contract where fix the futures contract price but
not the basis – Like a short hedge except elevator manages the futures account
and margin calls – Can choose to roll contract within the same marketing-year
(September to August)
• A non-roll HTA: – Requires a specific quantity and quality of grain to sell at a
predetermined date and place – Basis risk is the main risk for non-roll HTA’s – Non-roll HTA’s prevent producer from benefiting from higher
prices.
Economics
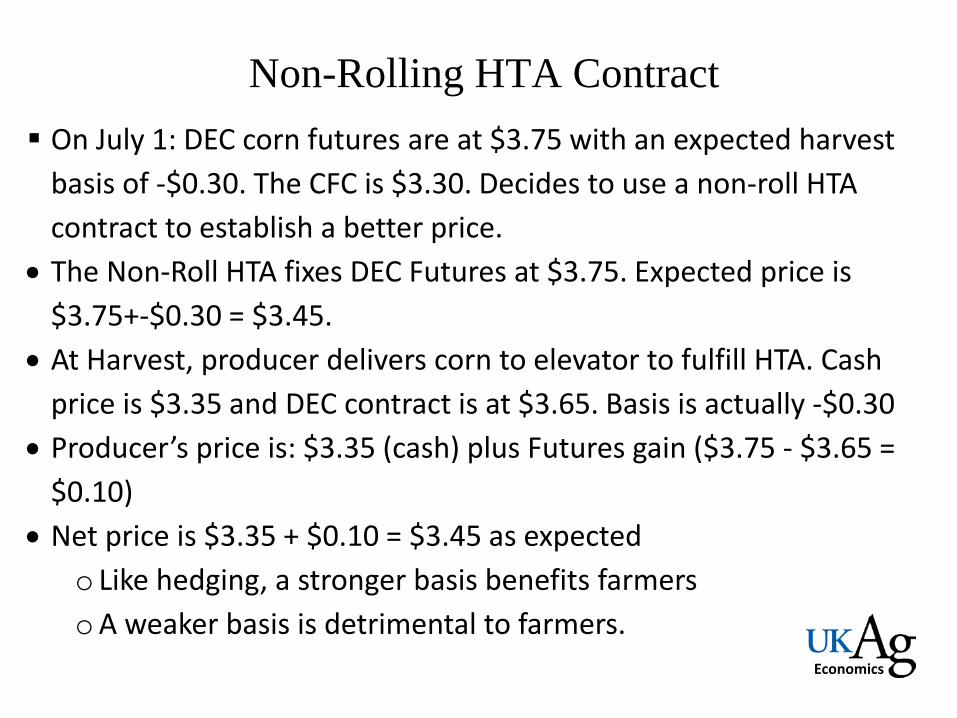
Non-Rolling HTA Contract On July 1: DEC corn futures are at $3.75 with an expected harvest
basis of -$0.30. The CFC is $3.30. Decides to use a non-roll HTA contract to establish a better price.
• The Non-Roll HTA fixes DEC Futures at $3.75. Expected price is $3.75+-$0.30 = $3.45.
• At Harvest, producer delivers corn to elevator to fulfill HTA. Cash price is $3.35 and DEC contract is at $3.65. Basis is actually -$0.30
• Producer’s price is: $3.35 (cash) plus Futures gain ($3.75 - $3.65 = $0.10)
• Net price is $3.35 + $0.10 = $3.45 as expected o Like hedging, a stronger basis benefits farmers oA weaker basis is detrimental to farmers.
Economics
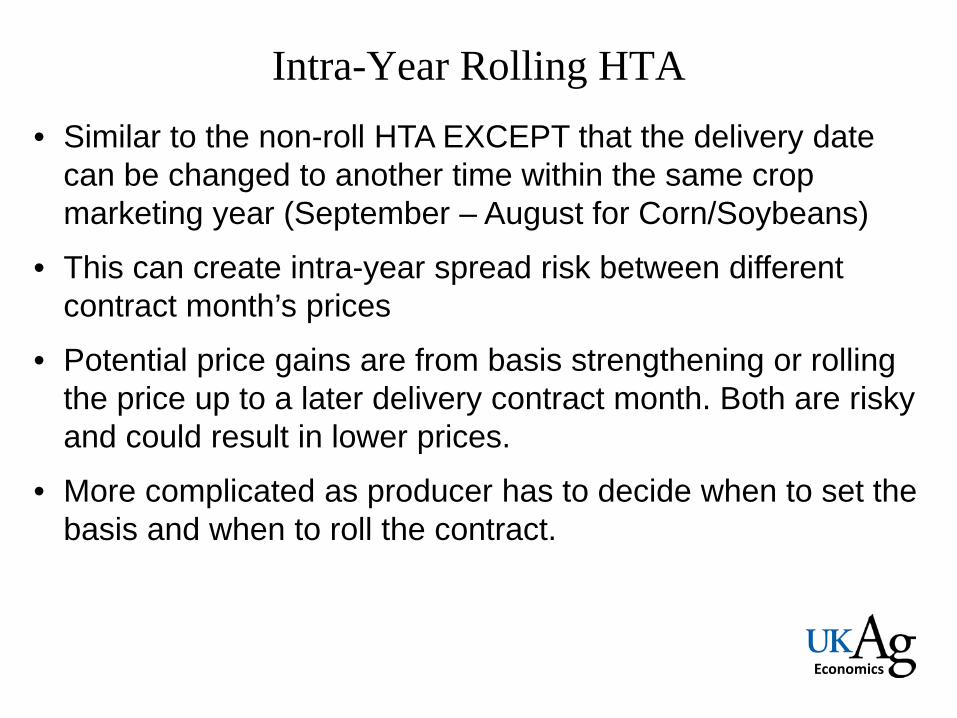
Intra-Year Rolling HTA • Similar to the non-roll HTA EXCEPT that the delivery date
can be changed to another time within the same crop marketing year (September – August for Corn/Soybeans)
• This can create intra-year spread risk between different contract month’s prices
• Potential price gains are from basis strengthening or rolling the price up to a later delivery contract month. Both are risky and could result in lower prices.
• More complicated as producer has to decide when to set the basis and when to roll the contract.
Economics
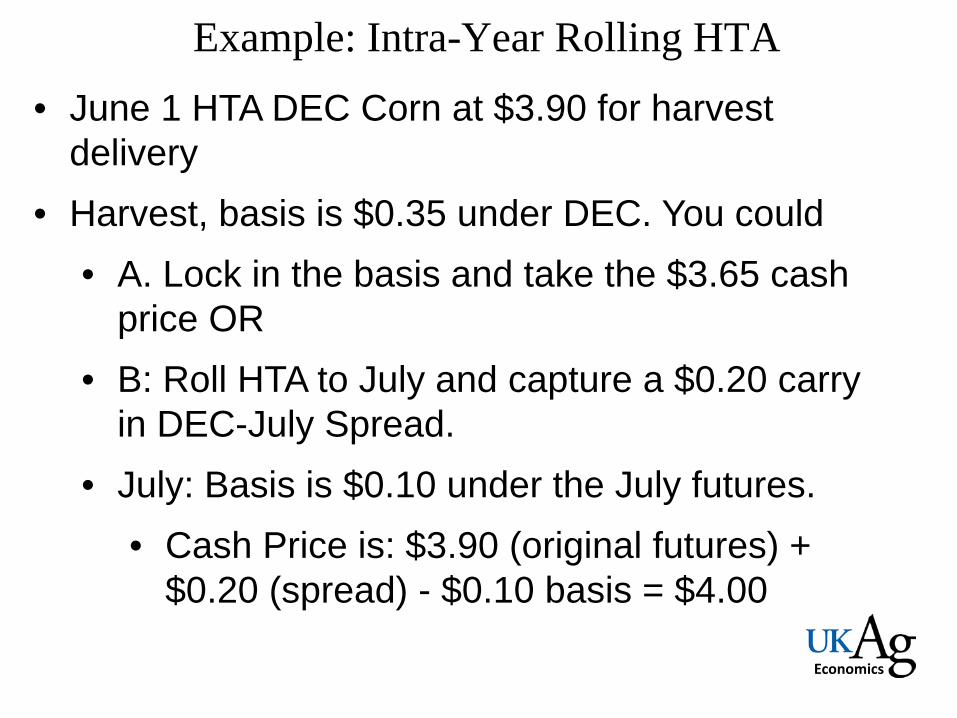
Example: Intra-Year Rolling HTA • June 1 HTA DEC Corn at $3.90 for harvest
delivery • Harvest, basis is $0.35 under DEC. You could
• A. Lock in the basis and take the $3.65 cash price OR
• B: Roll HTA to July and capture a $0.20 carry in DEC-July Spread.
• July: Basis is $0.10 under the July futures. • Cash Price is: $3.90 (original futures) +
$0.20 (spread) - $0.10 basis = $4.00
Economics
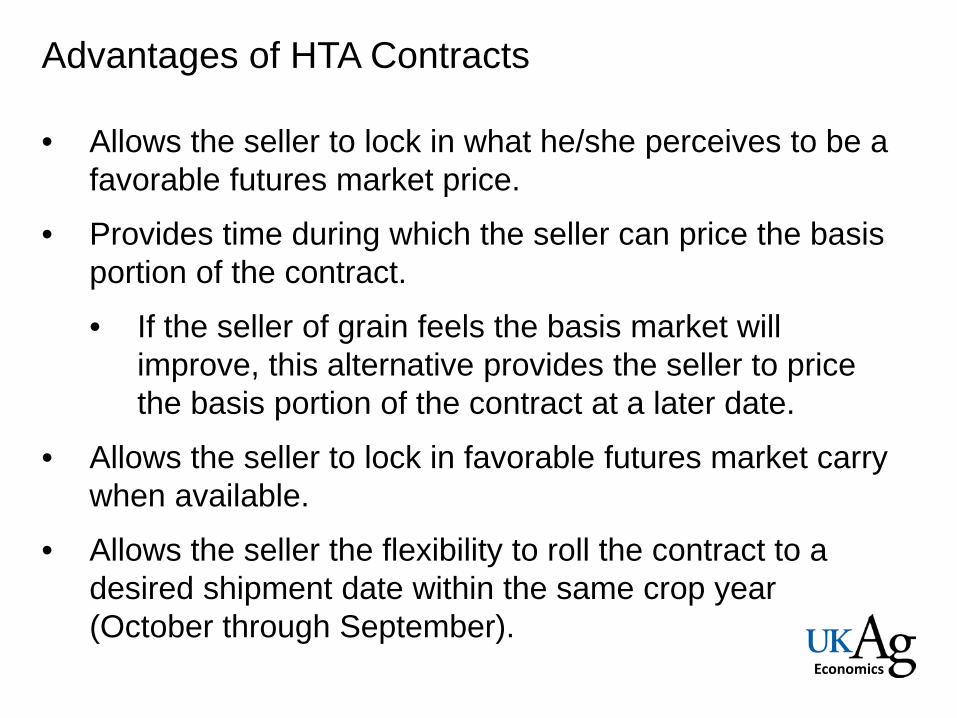
Advantages of HTA Contracts • Allows the seller to lock in what he/she perceives to be a
favorable futures market price.
• Provides time during which the seller can price the basis portion of the contract.
• If the seller of grain feels the basis market will improve, this alternative provides the seller to price the basis portion of the contract at a later date.
• Allows the seller to lock in favorable futures market carry when available.
• Allows the seller the flexibility to roll the contract to a desired shipment date within the same crop year (October through September).
Economics
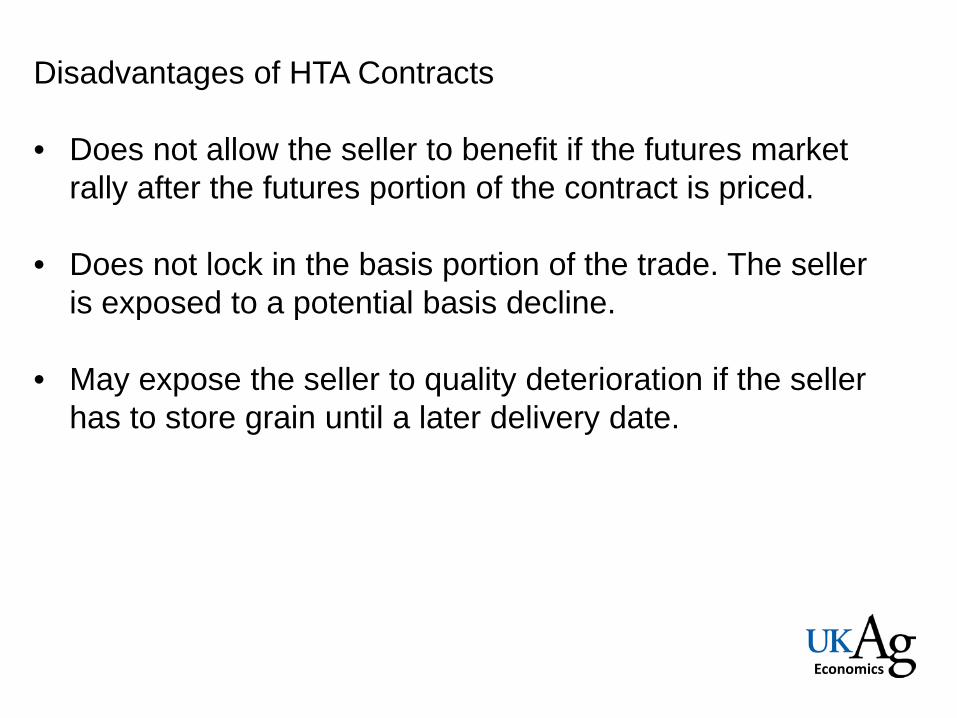
Disadvantages of HTA Contracts • Does not allow the seller to benefit if the futures market
rally after the futures portion of the contract is priced.
• Does not lock in the basis portion of the trade. The seller is exposed to a potential basis decline.
• May expose the seller to quality deterioration if the seller has to store grain until a later delivery date.
Economics
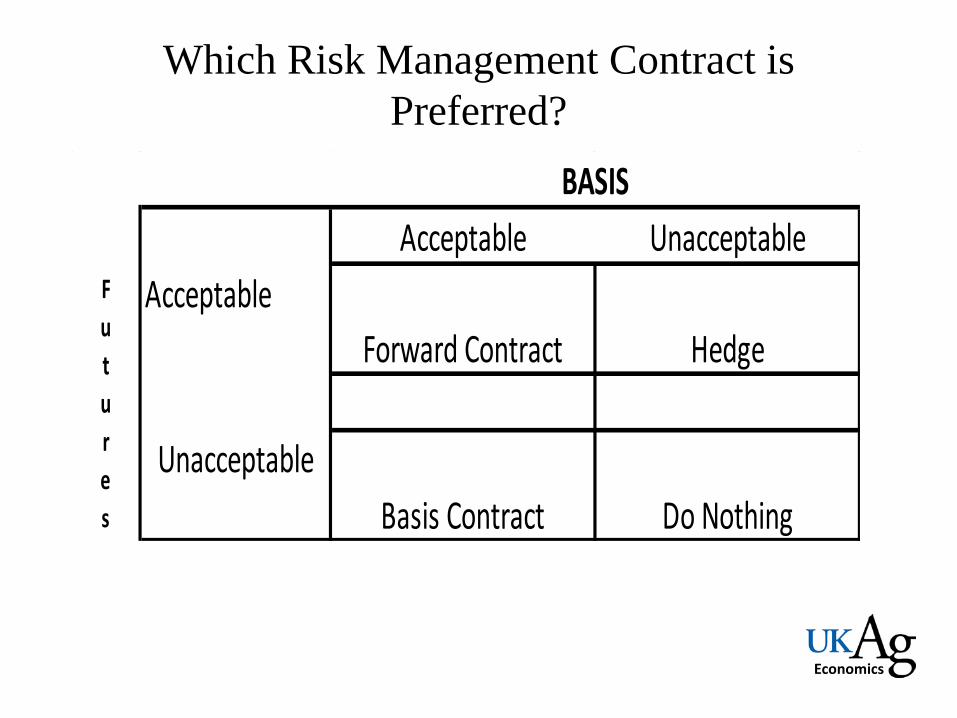
Which Risk Management Contract is Preferred?
Acceptable UnacceptableAcceptable
Unacceptable
BASIS
Forward Contract Hedge
Basis Contract Do Nothing
Futures
Economics
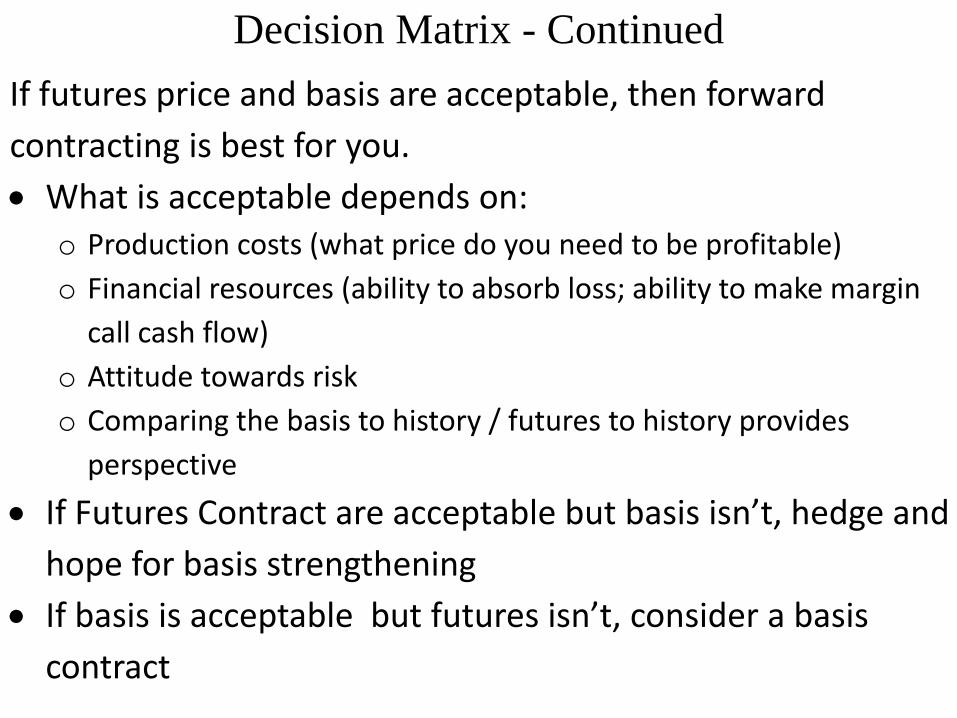
Decision Matrix - Continued If futures price and basis are acceptable, then forward contracting is best for you. • What is acceptable depends on:
o Production costs (what price do you need to be profitable) o Financial resources (ability to absorb loss; ability to make margin
call cash flow) o Attitude towards risk o Comparing the basis to history / futures to history provides
perspective • If Futures Contract are acceptable but basis isn’t, hedge and
hope for basis strengthening • If basis is acceptable but futures isn’t, consider a basis
contract

Economics
Considerations for Contracting • Know and understand everything in the contract
• If you don’t understand, don’t sign contract
• Know how the net price you receive will be determined
• Know what happens if you have a production problem and can’t fulfill the contract
• Evaluate the contract under various and extreme price and yield risk to know the potential outcome
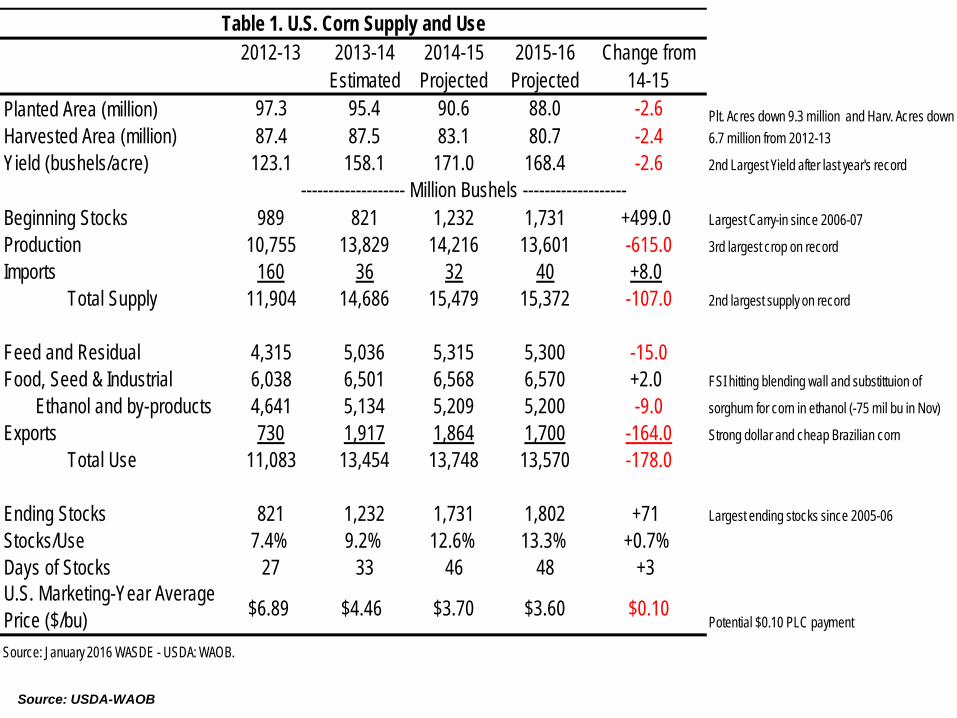
Source: USDA-WAOB
2012-13 2013-14 2014-15 2015-16 Change fromEstimated Projected Projected 14-15
Planted Area (million) 97.3 95.4 90.6 88.0 -2.6Harvested Area (million) 87.4 87.5 83.1 80.7 -2.4Yield (bushels/acre) 123.1 158.1 171.0 168.4 -2.6 2nd Largest Yield after last year's record
Beginning Stocks 989 821 1,232 1,731 +499.0 Largest Carry-in since 2006-07
Production 10,755 13,829 14,216 13,601 -615.0 3rd largest crop on record
Imports 160 36 32 40 +8.0 Total Supply 11,904 14,686 15,479 15,372 -107.0 2nd largest supply on record
Feed and Residual 4,315 5,036 5,315 5,300 -15.0Food, Seed & Industrial 6,038 6,501 6,568 6,570 +2.0 FSI hitting blending wall and substittuion of
Ethanol and by-products 4,641 5,134 5,209 5,200 -9.0 sorghum for corn in ethanol (-75 mil bu in Nov)
Exports 730 1,917 1,864 1,700 -164.0 Strong dollar and cheap Brazilian corn
Total Use 11,083 13,454 13,748 13,570 -178.0
Ending Stocks 821 1,232 1,731 1,802 +71 Largest ending stocks since 2005-06
Stocks/Use 7.4% 9.2% 12.6% 13.3% +0.7%Days of Stocks 27 33 46 48 +3U.S. Marketing-Year Average Price ($/bu) $6.89 $4.46 $3.70 $3.60 $0.10
Potential $0.10 PLC payment
Source: January 2016 WASDE - USDA: WAOB.
Table 1. U.S. Corn Supply and Use
------------------- Million Bushels -------------------
Plt. Acres down 9.3 million and Harv. Acres down 6.7 million from 2012-13
Economics
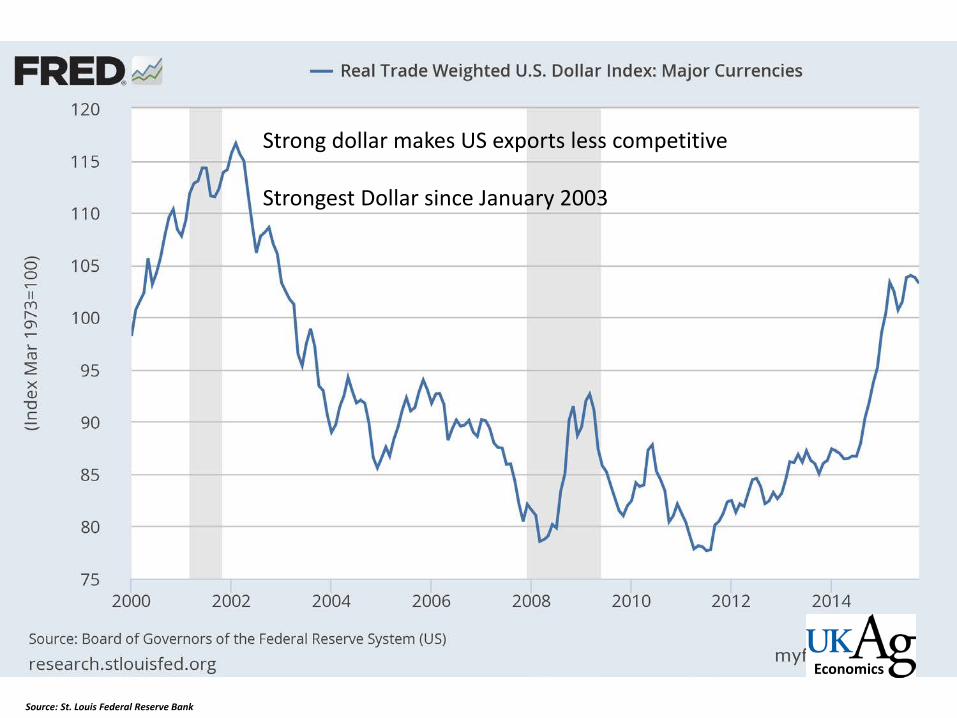
Strong dollar makes US exports less competitive Strongest Dollar since January 2003
Source: St. Louis Federal Reserve Bank

Economics Source: WAOB
US & World Ending Stocks -- Corn
42%
44%
46%
48%
50%
52%
54%
56%
0
50
100
150
200
250
2012 2013 2014 2015
Chin
a Sh
are
(%)
Endi
ng S
tock
s (M
MT)
US ROW China %
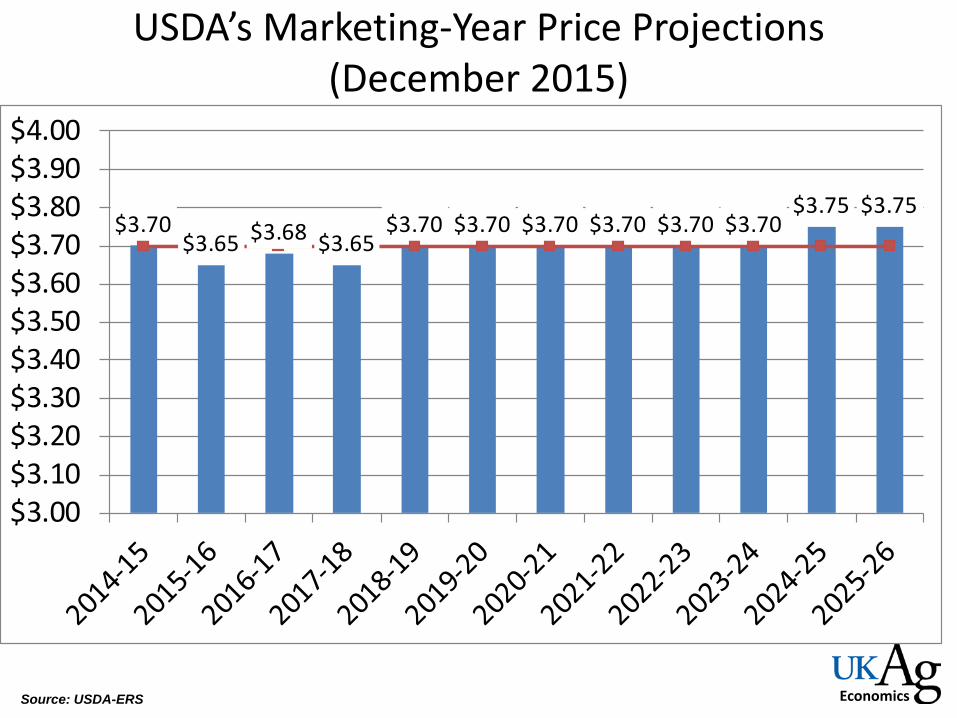
Economics Source: USDA-ERS
USDA’s Marketing-Year Price Projections (December 2015)
$3.70$3.65 $3.68 $3.65
$3.70 $3.70 $3.70 $3.70 $3.70 $3.70$3.75 $3.75
$3.00$3.10$3.20$3.30$3.40$3.50$3.60$3.70$3.80$3.90$4.00

Source: USDA-WAOB
Economics
2012-13 2013-14 2014-15 2015-16 Change fromEstimated Projected Projected 14-15
Planted Area (million) 77.2 76.8 83.3 82.7 -0.6Harvested Area (million) 76.1 76.3 82.6 81.8 -0.8Yield (bushels/acre) 40 44 47.5 48.0 +0.5 Record Soybean Yield, if Realized
Beginning Stocks 169 141 92 191 +99.0 Largest Carry-in Since 2011-12
Production 3,042 3,358 3,927 3,930 +3.0 Larvest Crop on Record, if realized
Imports 41 72 33 30 -3.0 Total Supply 3,252 3,570 4,052 4,150 +98.0 Largest Supply on Record
Crushings 1,689 1,734 1,873 1,890 +17.0 Largest crushing demand on record
Exports 1,317 1,647 1,843 1,690 -153.0 Strong Dollar and South American Competition
Seed 89 97 96 92 -4.0Residual 16 0 49 39 -10.0 Total Use 3,111 3,478 3,862 3,711 -151.0
Ending Stocks 141 92 191 440 +249.0 Largest Ending-Stocks since 2006-07
Stocks/Use 4.5% 2.6% 4.9% 11.9% +6.9%Days of Stocks 17 10 18 43 +25.2U.S. Marketing-Year Average Price ($/bu) $14.40 $13.00 $10.10 $8.80 -$1.30
Source: January 2016 WASDE - USDA: WAOB.
2nd largest Planted and Harvested Area on record
Bad recipe of declining demand in the face of increasing supply
------------------- Million Bushels -------------------
Table 2. U.S. Soybean Supply and Use

Economics Source; WAOB
US & World Ending Stocks -- Soybeans
18%
18%
19%
19%
20%
20%
21%
21%
22%
22%
23%
0
10
20
30
40
50
60
70
2012 2013 2014 2015
Chin
a Sh
are
(%)
Endi
ng S
tock
s (M
MT)
US ARG BRZ ROW China %
Economics Source: USDA-ERS
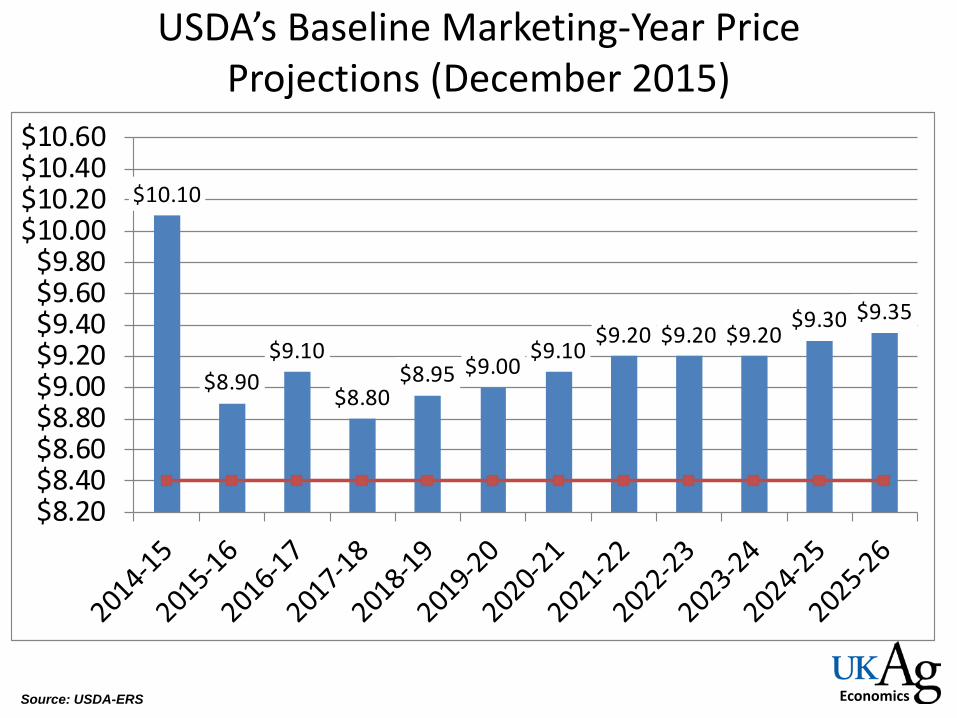
USDA’s Baseline Marketing-Year Price Projections (December 2015)
$10.10
$8.90$9.10
$8.80$8.95 $9.00
$9.10$9.20 $9.20 $9.20
$9.30 $9.35
$8.20$8.40$8.60$8.80$9.00$9.20$9.40$9.60$9.80
$10.00$10.20$10.40$10.60
Economics
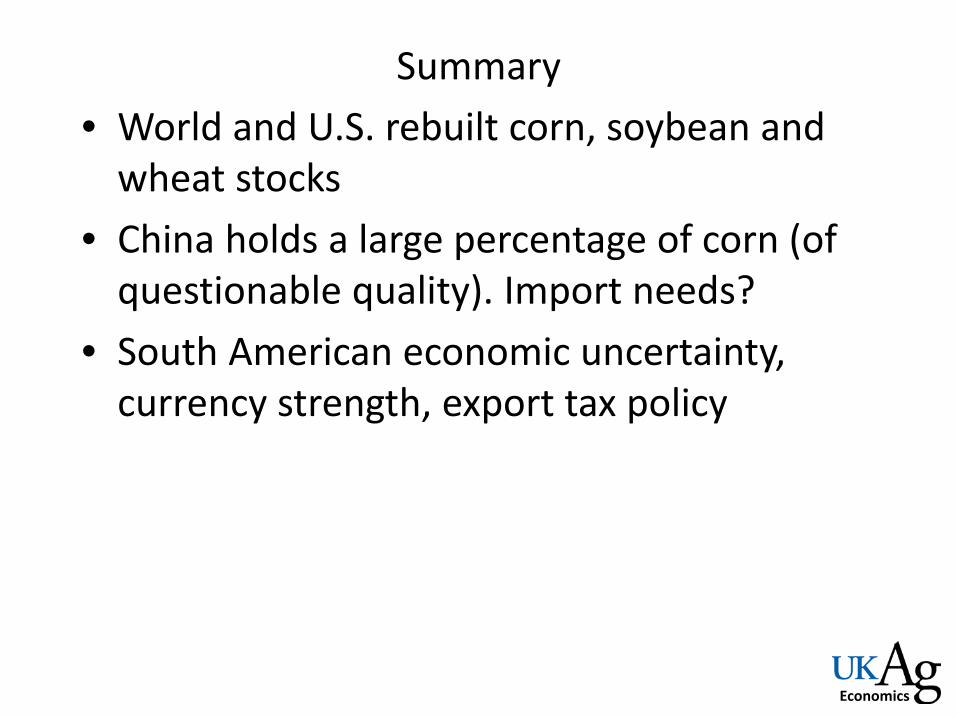
Summary • World and U.S. rebuilt corn, soybean and
wheat stocks • China holds a large percentage of corn (of
questionable quality). Import needs? • South American economic uncertainty,
currency strength, export tax policy