Embed Size (px)
Citation preview
Briefingby the National Audit Office
HM Treasury, UK Financial Investments, UK Asset Resolution
Introduction to asset-backed securities
NOVEMBER 2016

Our vision is to help the nation spend wisely.
Our public audit perspective helps Parliament hold government to account and improve public services.
The National Audit Office scrutinises public spending for Parliament and is independent of government. The Comptroller and Auditor General (C&AG), Sir Amyas Morse KCB, is an Officer of the House of Commons and leads the NAO, which employs some 785 people. The C&AG certifies the accounts of all government departments and many other public sector bodies. He has statutory authority to examine and report to Parliament on whether departments and the bodies they fund have used their resources efficiently, effectively, and with economy. Our studies evaluate the value for money of public spending, nationally and locally. Our recommendations and reports on good practice help government improve public services, and our work led to audited savings of £1.21 billion in 2015.
The National Audit Office study team consisted of: Gregor Botlik, Leanne Stickland and Imran Qureshi, under the direction of Simon Reason.
This report can be found on the National Audit Office website at www.nao.org.uk
For further information about the National Audit Office please contact:
National Audit Office Press Office 157–197 Buckingham Palace Road Victoria London SW1W 9SP
Tel: 020 7798 7400
Enquiries: www.nao.org.uk/contact-us
Website: www.nao.org.uk
Twitter: @NAOorguk
Contents
Introduction 4
Part OneIntroduction to securitisation 5
Part TwoSecuritisation in Europe and the UK 12
Appendix OneGranite Securitisation 26
Links to external websites were valid at the time of publication of this report. The National Audit Office is not responsible for the future validity of the links.

4 Introduction Introduction to asset-backed securities
Introduction
1 This paper was prepared by the National Audit Office during fieldwork for our report, The £13 billion sale of former Northern Rock assets.1 It is a factual briefing intended to provide the reader with an overview of the securitisation process and market data on securitisation in the UK and Europe.
2 The briefing is structured as follows:
• Part One provides an introduction to securitisation; and
• Part Two includes market data on securitisation in the UK and Europe.
3 The appendix provides further information about the Granite securitisation vehicle, which represented more than 90% of the asset value sold in the transaction.
1 Comptroller and Auditor General, The £13 billion sale of former Northern Rock assets, Session 2016-17, HC 513, National Audit Office, July 2016.

Introduction to asset-backed securities Part One 5
Part One
Introduction to securitisation
1.1 Securitisation is a financial process by which an owner of an asset, such as a portfolio of loans, receives cash upfront in exchange for the future cash flows from the asset without selling the asset in a normal contractual sales agreement. This process entails pooling the cash flows and selling them to investors via a special purpose vehicle (SPV), effectively turning ‘illiquid’ assets that cannot be sold easily into a ‘liquid’ asset that is tradable. If the income is ‘backed’ by underlying assets the securities are called ‘asset-backed securities’ (ABS).
1.2 There are two main reasons for carrying out a securitisation: 1) to obtain funding, because selling the cash flows allows the seller to bring forward the future income of the assets and use it for immediate reinvestment; and 2) to move assets off the balance sheet.
1.3 In principle, any asset with associated cash flows can be securitised, for example mortgages or loans such as credit cards, commercial loans and student loans. Depending on the underlying asset, the securities carry different names as shown in Figure 1.
Figure 1Types of securities
Security name Description
Residential mortgage-backed security (RMBS)
Backed by mortgages for the purchase of residential real estate. Includes ‘prime’ mortgages, where borrowers have strong credit histories, ‘buy to let’ mortgages, or ‘non-conforming’ mortgages.
Commercial mortgage-backed security (CMBS)
Backed by mortgages for the purchase of commercial property.
Consumer asset-backed security (Consumer ABS)
Backed by personal financial assets such as auto loans, credit cards, student loans and other consumer loans.
Corporate asset-backed security (Corporate ABS)
Backed by the cash flows from receivables such as leases on aircraft or other corporate equipment, small and medium enterprise (SME) loans, trade receivables. Also includes ‘whole business’ securities (WBS) based on the cash flows of an entire business unit, such as franchise or brand royalties.
Collateralised debt obligation (CDO)
Backed by a mixture of loans/receivables and/or asset-backed securities. Also includes ‘collateralised loan obligations’ (CLO) backed by loans, often to medium-sized corporates.
Source: National Audit Offi ce

6 Part One Introduction to asset-backed securities
1.4 The assets used in a securitisation can be either ‘performing’ or ‘non-performing’. A performing asset involves underlying loans which are making payments as outlined in the contractual agreements. In relation to securitisations of mortgages, these transaction are sometimes called ‘prime mortgages’, especially if the borrowers under the mortgage have a strong credit quality (for example, no historic bankruptcy, arrears or County Court judgments). A non-performing asset means the underlying asset is either in default or close to being in default. The market generally considers an asset as non-performing if payments are more than three months in arrears. Once an asset becomes non-performing, the probability that it will be repaid in full is substantially lower, and therefore it negatively affects the value of the asset. The recent £13 billion sale of former Northern Rock assets mainly included performing assets.
1.5 The UK government owns financial assets that could be securitised. It owns these assets as a result of either financial intervention, such as the nationalisation of Northern Rock or Bradford & Bingley, or through government schemes such as Student Loans or Help to Buy. Figure 2 lists some of these assets.
Figure 2Government-owned assets that could be securitised
Category
Residential mortgages UK Asset Resolution Limited (UKAR) holds £42.3 billion of assets as of May 2016. These are predominantly owner-occupier and buy-to-let type mortgages. UKAR has been actively reducing the assets on its balance sheet since 2014, for example:
• the recent £13.3 billion sale of former Northern Rock assets which included securitised loans; and
• a £2.7 billion sale of loans in 2014 which did not include a securitisation. The new owner subsequently used these loans in two securitisations.
Consumer loans The Department for Business, Energy & Industrial Strategy owns £56.9 billion of Higher and Further Education loans as of March 2016 (carrying value).
Corporate loans The British Business Bank supports £2.3 billion of finance to more than 40,000 smaller businesses and a further £2.9 billion of finance for small mid-cap businesses.1
Note
1 British Business Bank annual report 2015. Not all of these assets may qualify for securitisations.
Source: National Audit Offi ce

Introduction to asset-backed securities Part One 7
1.6 In relation to each of these assets, the owner (‘originator’/‘issuer’ in Figure 3 overleaf) of the asset has the following choices:
• Hold the asset and do nothing. The owner is exposed to the risk of the assets and in return receives income until the loans are either fully repaid by the borrowers or written off.
• Sell the assets. The owner receives cash from the sale, which allows it to pay off debt or use it for other purposes. It reduces the owner’s exposure to risk but stops it receiving any income it previously enjoyed from the assets.
• Securitise the assets and sell the securities to investors. The owner receives cash from the securitisation process and income on the stake it retains in the securitisation over the life of the instrument. It retains legal ownership but does not achieve ‘off-balance sheet’ treatment on the stake it retains.
• If the owner inherited assets that are already securitised, as with Granite, its immediate option to achieve off-balance sheet treatment is a sale of the SPV and subsequent sale of the legal ownership.2 Alternatively, it can buy back all the securities from the investors and ‘unwind’ the securitisation to open up the other options explained above.
Simplified securitisation structure
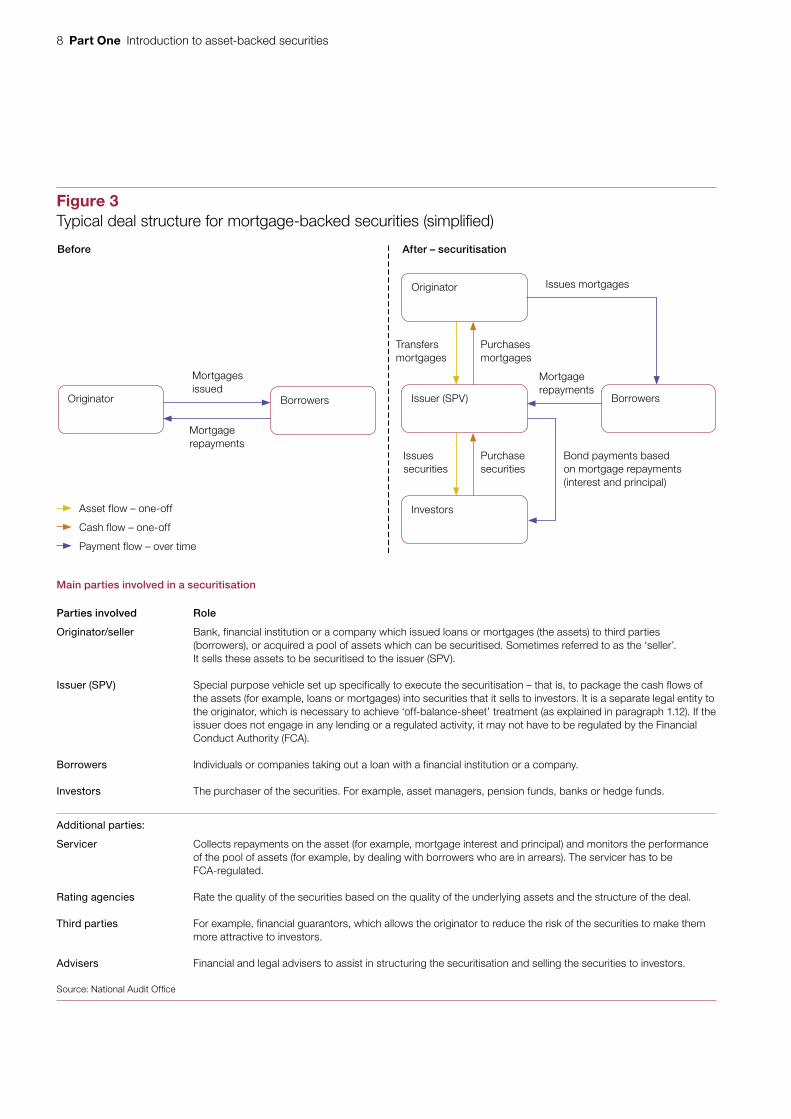
1.7 Figure 3 shows a typical securitisation deal structure and the different parties involved, using mortgages as an example. A company (‘originator’) sells a pool of assets (mortgages), which it has either originated itself or bought from a third party, to an SPV. The SPV funds this purchase by issuing securities (bonds) to investors. The return to investors on those securities is directly linked to the cash flows on the underlying assets – namely the principal and interest repayments of the mortgages.
Tranching of securitisations
1.8 The pool of assets in a securitisation generates a cash flow to investors. The cash flow is divided into ‘tranches’, where each tranche has a different level of priority in the payment of interest and repayment of principal. Each tranche usually requires a credit rating to ascertain the risk associated with the tranche. The structure of the tranches make up the capital structure of the securitisation vehicle.
2 For Granite, this had to be done by selling Northern Rock Asset Management (NRAM), the legal owner of the SPV.
8 Part One Introduction to asset-backed securities
Figure 3Typical deal structure for mortgage-backed securities (simplifi ed)
Before After – securitisation
Mortgages issued
Mortgagerepayments
Transfers mortgages
Purchases mortgages
Originator Borrowers
Originator
Issues securities
Issues mortgages
Purchase securities
Investors
Issuer (SPV)
Mortgage repayments
Bond payments based on mortgage repayments (interest and principal)
Asset flow – one-off
Cash flow – one-off
Payment flow – over time
Borrowers
Main parties involved in a securitisation
Parties involved Role
Originator/seller Bank, financial institution or a company which issued loans or mortgages (the assets) to third parties (borrowers), or acquired a pool of assets which can be securitised. Sometimes referred to as the ‘seller’. It sells these assets to be securitised to the issuer (SPV).
Issuer (SPV) Special purpose vehicle set up specifically to execute the securitisation – that is, to package the cash flows of the assets (for example, loans or mortgages) into securities that it sells to investors. It is a separate legal entity to the originator, which is necessary to achieve ‘off-balance-sheet’ treatment (as explained in paragraph 1.12). If the issuer does not engage in any lending or a regulated activity, it may not have to be regulated by the Financial Conduct Authority (FCA).
Borrowers Individuals or companies taking out a loan with a financial institution or a company.
Investors The purchaser of the securities. For example, asset managers, pension funds, banks or hedge funds.
Additional parties:
Servicer Collects repayments on the asset (for example, mortgage interest and principal) and monitors the performance of the pool of assets (for example, by dealing with borrowers who are in arrears). The servicer has to be FCA-regulated.
Rating agencies Rate the quality of the securities based on the quality of the underlying assets and the structure of the deal.
Third parties For example, financial guarantors, which allows the originator to reduce the risk of the securities to make them more attractive to investors.
Advisers Financial and legal advisers to assist in structuring the securitisation and selling the securities to investors.
Source: National Audit Offi ce

Introduction to asset-backed securities Part One 9
1.9 Figure 4 sets out a typical ‘tranching’ structure where each tranche has a specific risk profile to appeal to investors with different risk appetites. The risk of each tranche is given a credit rating based on the likelihood of payment. All tranches are backed by the same pool of assets, but generally tranche AAA (the lowest risk) gets paid first, tranche AA is paid second and so on, provided there is enough money left after paying the previous tranche. The bottom piece of the capital structure is the ‘excess spread’, which is the difference between the overall interest rate received on the underlying assets and what is paid out to investors on all tranches. It represents the first buffer against losses for the entire capital structure. This repayment schedule is referred to as the ‘waterfall’ structure. It is applied to both interest and principal payments.
Figure 4Illustration of a typical tranching structure
Notes
1 Higher-grade securities are said to be of ‘investment grade’.
2 Lower-grade securities – for example, C grade – can be issued if there is interest from investors.
Source: National Audit Offi ce
Lower risk
Tranching is the different risk and return for different investors
Higher risk
Paid first – lower expected yield
Paid last – higher expected yield
Last loss
First loss
Investment grade
AAA/Aaa
AA/Aa
A/A
BBB/Baa
BB/Ba
B/B
Excess spread
Risk Principal and interest payments
Losses
10 Part One Introduction to asset-backed securities
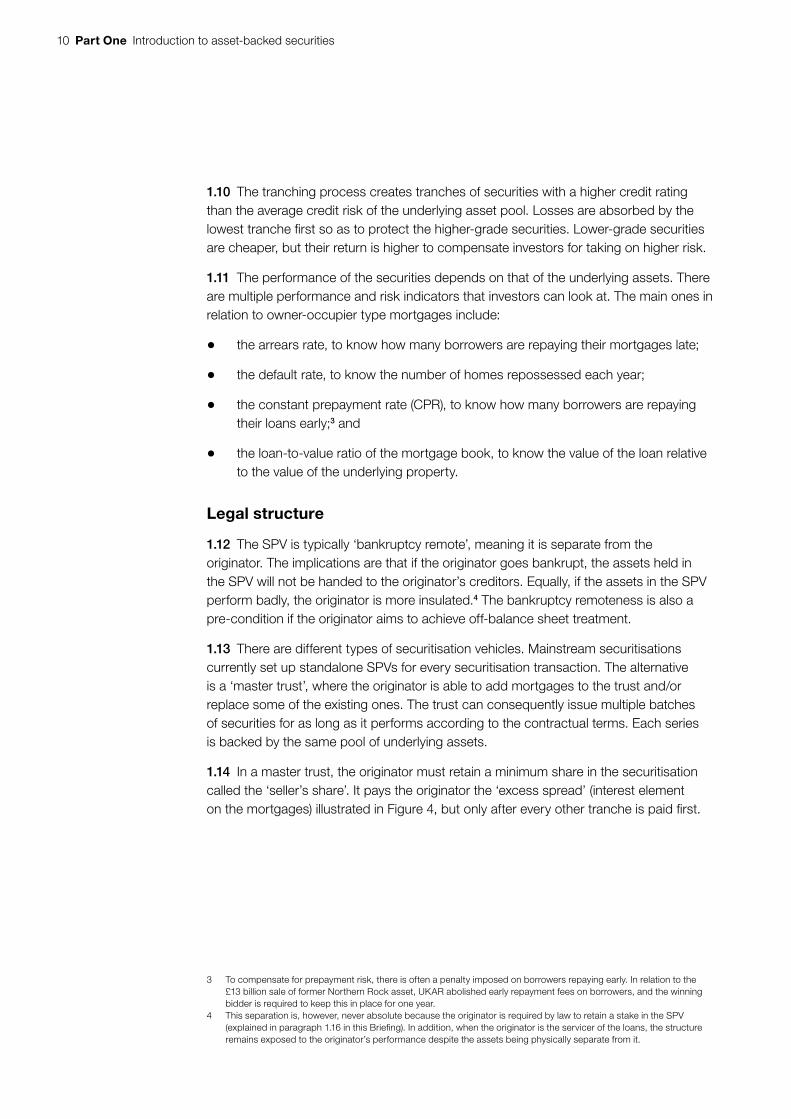
1.10 The tranching process creates tranches of securities with a higher credit rating than the average credit risk of the underlying asset pool. Losses are absorbed by the lowest tranche first so as to protect the higher-grade securities. Lower-grade securities are cheaper, but their return is higher to compensate investors for taking on higher risk.
1.11 The performance of the securities depends on that of the underlying assets. There are multiple performance and risk indicators that investors can look at. The main ones in relation to owner-occupier type mortgages include:
• the arrears rate, to know how many borrowers are repaying their mortgages late;
• the default rate, to know the number of homes repossessed each year;
• the constant prepayment rate (CPR), to know how many borrowers are repaying their loans early;3 and
• the loan-to-value ratio of the mortgage book, to know the value of the loan relative to the value of the underlying property.
Legal structure
1.12 The SPV is typically ‘bankruptcy remote’, meaning it is separate from the originator. The implications are that if the originator goes bankrupt, the assets held in the SPV will not be handed to the originator’s creditors. Equally, if the assets in the SPV perform badly, the originator is more insulated.4 The bankruptcy remoteness is also a pre-condition if the originator aims to achieve off-balance sheet treatment.
1.13 There are different types of securitisation vehicles. Mainstream securitisations currently set up standalone SPVs for every securitisation transaction. The alternative is a ‘master trust’, where the originator is able to add mortgages to the trust and/or replace some of the existing ones. The trust can consequently issue multiple batches of securities for as long as it performs according to the contractual terms. Each series is backed by the same pool of underlying assets.
1.14 In a master trust, the originator must retain a minimum share in the securitisation called the ‘seller’s share’. It pays the originator the ‘excess spread’ (interest element on the mortgages) illustrated in Figure 4, but only after every other tranche is paid first.
3 To compensate for prepayment risk, there is often a penalty imposed on borrowers repaying early. In relation to the £13 billion sale of former Northern Rock asset, UKAR abolished early repayment fees on borrowers, and the winning bidder is required to keep this in place for one year.
4 This separation is, however, never absolute because the originator is required by law to retain a stake in the SPV (explained in paragraph 1.16 in this Briefing). In addition, when the originator is the servicer of the loans, the structure remains exposed to the originator’s performance despite the assets being physically separate from it.

Introduction to asset-backed securities Part One 11
1.15 There are two main ways in which a master trust can go wrong:
• Breach of the ‘asset trigger’
This trigger is breached when the performance of the underlying loans falls below a threshold. When this happens, both the investors and the seller (through the seller share) see their interest and principal payments adjusted down on a pro rata basis.
• Breach of the ‘non-asset trigger’
This happens when default events occur which are unrelated to the performance of the assets in the securitisation. For example, insolvency of the issuer, absence of servicer, or breach to maintain the minimum seller’s share. In this case, the originator irreversibly loses rights to its share of the principal repayments until the investors are entirely repaid. This is to say that the seller’s share of principal repayments is deferred but preserved. Additionally, if the originator breaches its seller share, it loses the ability to sell additional mortgages to the SPV to issue more securities. When this occurs, the securitisation is said to be in ‘pass through’ mode.
1.16 Regulations introduced following the financial crisis legally require originators of a securitisation to retain a minimum 5% share of risk in it. This risk retention ratio applies to all SPV structures and is designed to align incentives between the originator and the investors.
12 Part Two Introduction to asset-backed securities
Part Two
Securitisation in Europe and the UK
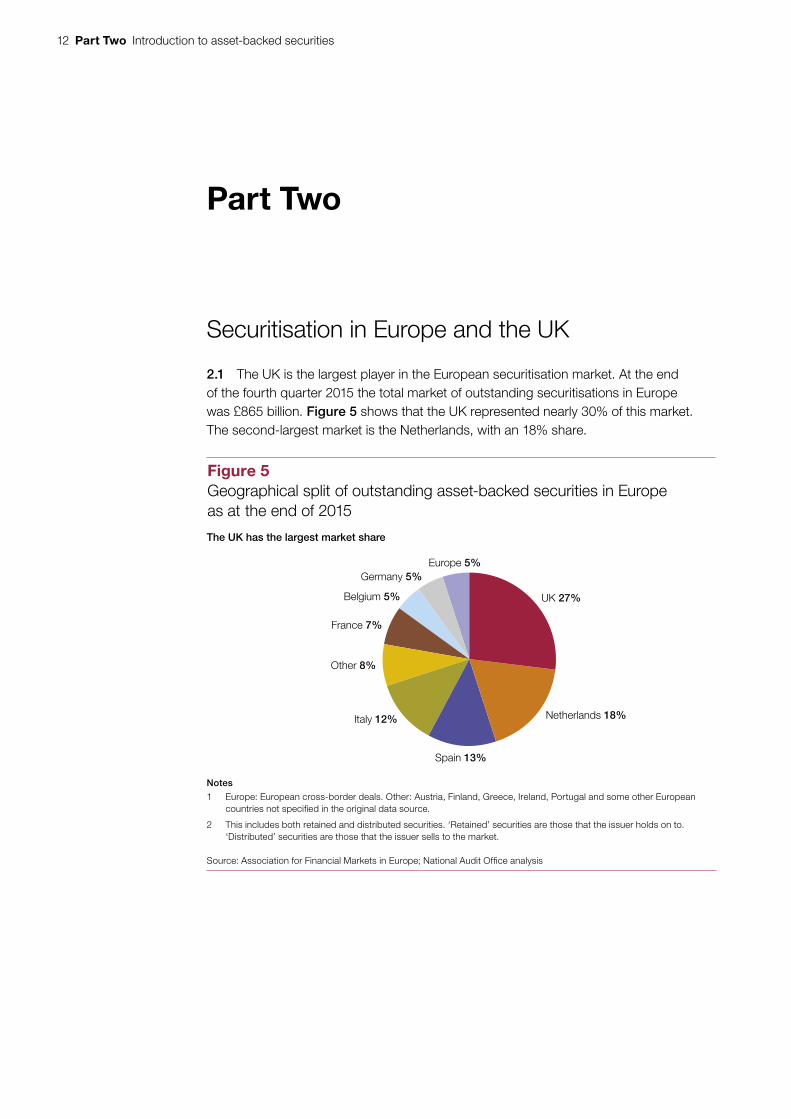
2.1 The UK is the largest player in the European securitisation market. At the end of the fourth quarter 2015 the total market of outstanding securitisations in Europe was £865 billion. Figure 5 shows that the UK represented nearly 30% of this market. The second-largest market is the Netherlands, with an 18% share.
Figure 5Geographical split of outstanding asset-backed securities in Europe as at the end of 2015
UK 27%
Netherlands 18%
Spain 13%
Other 8%
Italy 12%
Belgium 5%
France 7%
Germany 5%Europe 5%
Notes
1 Europe: European cross-border deals. Other: Austria, Finland, Greece, Ireland, Portugal and some other European countries not specified in the original data source.
2 This includes both retained and distributed securities. ‘Retained’ securities are those that the issuer holds on to. ‘Distributed’ securities are those that the issuer sells to the market.
Source: Association for Financial Markets in Europe; National Audit Office analysis
The UK has the largest market share

Introduction to asset-backed securities Part Two 13
2.2 Retail mortgage-backed securities (RMBS) make up the largest part of the market. They constitute 60% of Europe’s market as a whole, and 47% of the UK’s, as shown in Figure 6. Other large categories are ‘whole business securitisation’ (WBS) and commercial mortgage-backed securities (CMBS).
Figure 6Composition of the asset-backed securities outstanding in theUK as at the end of 2015
RMBS 47%
WBS 21%
CMBS 15%
ABS 12%
CDO 3%SME 2%
Notes
1 This includes both retained and distributed securities. ‘Retained’ securities are those that the issuer holds on to. ‘Distributed’ securities are those that the issuer sells to the market.
2 WBS stands for ‘whole business securitisation’, where the cash flows of an entire business are used in the securitisation process.
Source: Association for Financial Markets in Europe; National Audit Office analysis
Retail mortgage-backed securities make up 50% of the UK market

14 Part Two Introduction to asset-backed securities
Issuance
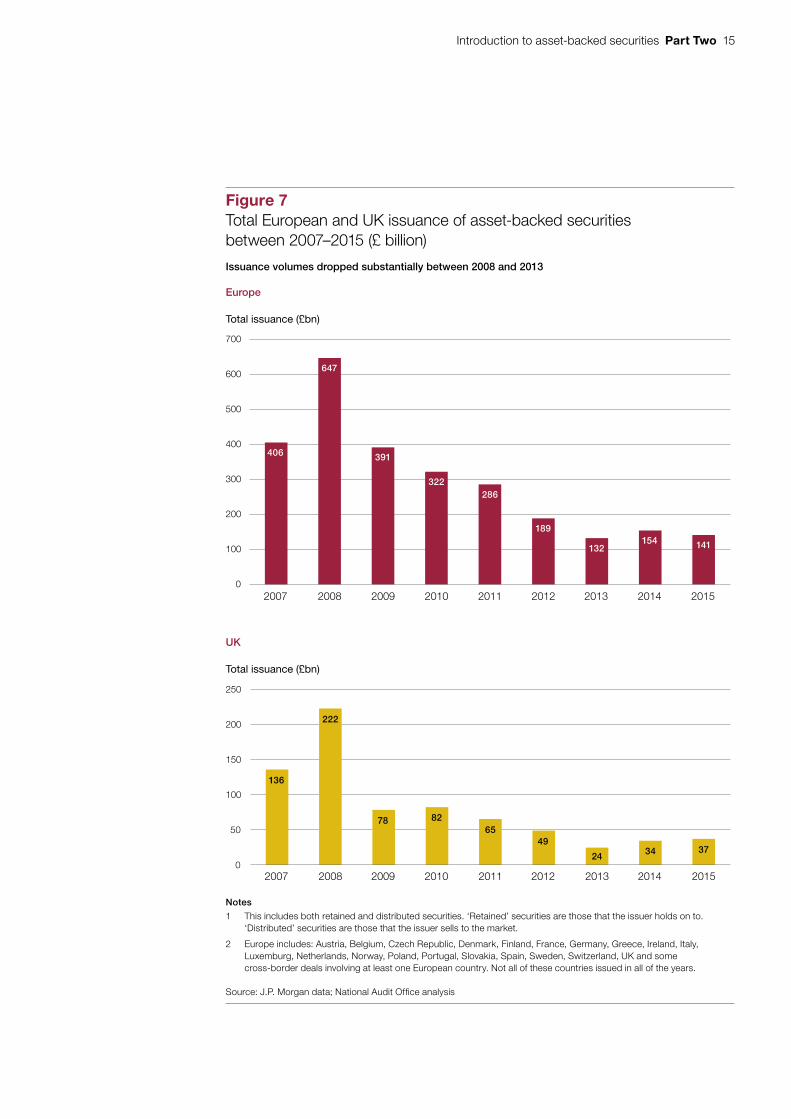
2.3 The issuance of securities is still very low compared to pre-financial crisis levels. Figure 7 shows that there was a significant slow-down in the market after the crisis, reaching a low point in 2013. 2014 and 2015 fared better, but just marginally. In 2015, a total of £141.4 billion of securities were issued in Europe.
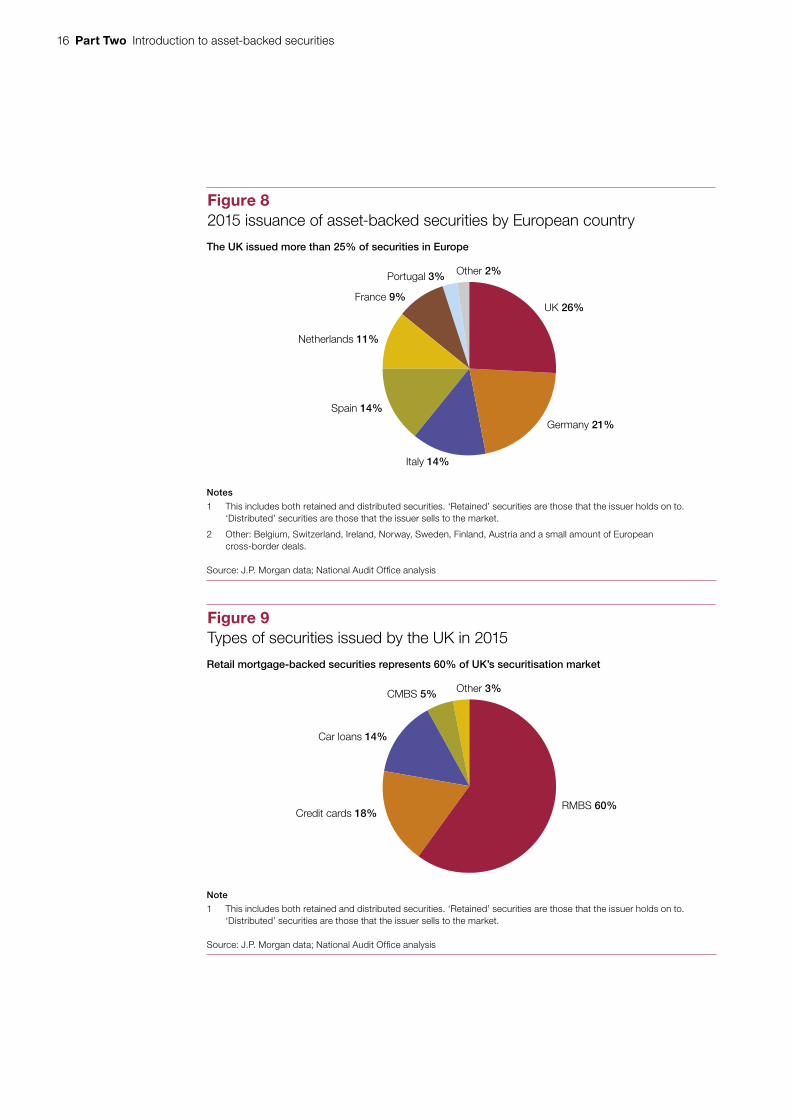
2.4 The UK was the largest issuer in 2015, issuing £36.8 billion of securities. It also ranked highly in previous years. Figure 8 on page 16 shows that Germany was the second-largest player in 2015, mainly owing to large issuances from car manufacturers.
2.5 The majority of the UK’s activity was focused on RMBS, as shown in Figure 9 on page 16. This focus was also the case for the majority of the other countries in Europe.
2.6 Since 2013, the average size of European transactions of RMBS has been increasing, as shown in Figure 10 on page 17. The Granite sale contributed to a substantial part of the Quarter 1 2016 increase as Cerberus issued £6.2 billion of notes through the securitisation vehicle Towd Point; £6.2 billion is more than three times larger than the average size of other deals in that period.
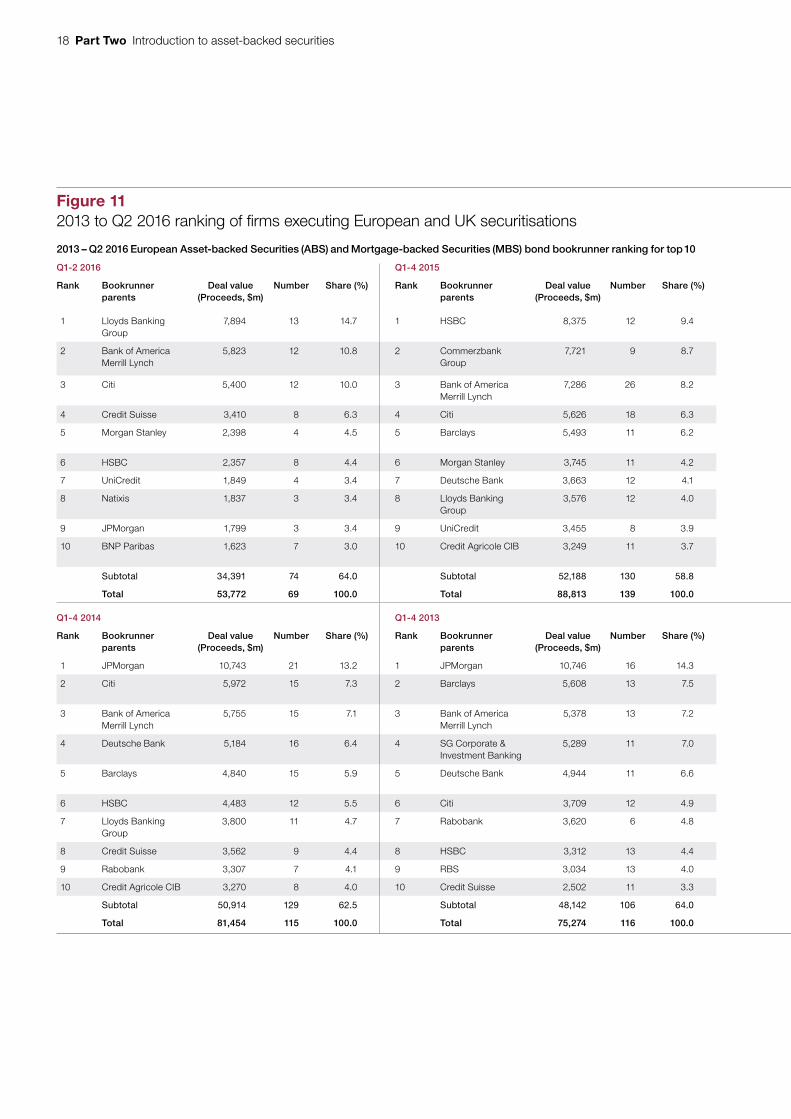
2.7 Figure 11 on pages 18 to 21 shows the main financial advisers involved in a lead role (‘bookrunner’) in European securitisations, ranked by the volume of issuance by year. Credit Suisse advised on the sale of Granite.
Introduction to asset-backed securities Part Two 15
Figure 7Total European and UK issuance of asset-backed securitiesbetween 2007–2015 (£ billion)
Total issuance (£bn)
Issuance volumes dropped substantially between 2008 and 2013
Europe
Total issuance (£bn)
UK
Notes
1 This includes both retained and distributed securities. ‘Retained’ securities are those that the issuer holds on to. ‘Distributed’ securities are those that the issuer sells to the market.
2 Europe includes: Austria, Belgium, Czech Republic, Denmark, Finland, France, Germany, Greece, Ireland, Italy, Luxemburg, Netherlands, Norway, Poland, Portugal, Slovakia, Spain, Sweden, Switzerland, UK and some cross-border deals involving at least one European country. Not all of these countries issued in all of the years.
Source: J.P. Morgan data; National Audit Office analysis
0
100
200
300
400
500
600
700
201520142013201220112010200920082007
141
406
154
647
132
391
322286
189
0
50
100
150
200
250
201520142013201220112010200920082007
136
222
78 8265
49
24 34 37
16 Part Two Introduction to asset-backed securities
Figure 82015 issuance of asset-backed securities by European country
UK 26%
Germany 21%
Italy 14%
Spain 14%
France 9%
Netherlands 11%
Other 2%Portugal 3%
Notes
1 This includes both retained and distributed securities. ‘Retained’ securities are those that the issuer holds on to. ‘Distributed’ securities are those that the issuer sells to the market.
2 Other: Belgium, Switzerland, Ireland, Norway, Sweden, Finland, Austria and a small amount of European cross-border deals.
Source: J.P. Morgan data; National Audit Office analysis
The UK issued more than 25% of securities in Europe
Figure 9Types of securities issued by the UK in 2015
RMBS 60%Credit cards 18%
Car loans 14%
Other 3%CMBS 5%
Note
1 This includes both retained and distributed securities. ‘Retained’ securities are those that the issuer holds on to. ‘Distributed’ securities are those that the issuer sells to the market.
Source: J.P. Morgan data; National Audit Office analysis
Retail mortgage-backed securities represents 60% of UK’s securitisation market

Introduction to asset-backed securities Part Two 17
Figure 10Average size of European retail mortgage-backed securities deals
Average deal size (£bn)
Average deal size increased since 2013
Notes
1 This includes both retained and distributed securities. ‘Retained’ securities are those that the issuer holds on to. ‘Distributed’ securities are those that the issuer sells to the market.
2 This includes both prime, buy-to-let and non-conforming mortgages.
3 Each transaction can be made up of several tranches issued as part of the same series.
Source: J.P. Morgan data; National Audit Office analysis
2.50
2.00
1.50
1.00
0.50
0.002013
1.23
2014
1.39
2015
1.64
Q1 2016
2.21
18 Part Two Introduction to asset-backed securities
Figure 112013 to Q2 2016 ranking of fi rms executing European and UK securitisations
2013 – Q2 2016 European Asset-backed Securities (ABS) and Mortgage-backed Securities (MBS) bond bookrunner ranking for top 10 2013 – Q2 2016 UK ABS and MBS bond bookrunner ranking for top 10
Q1-2 2016 Q1-4 2015 Q1-2 2016 Q1-4 2015
Rank Bookrunnerparents
Deal value (Proceeds, $m)
Number Share (%) Rank Bookrunner parents
Deal value (Proceeds, $m)
Number Share (%) Rank Bookrunner parents
Deal value (Proceeds, $m)
Number Share (%) Rank Bookrunner parents
Deal value (Proceeds, $m)
Number Share (%)
1 Lloyds Banking Group
7,894 13 14.7 1 HSBC 8,375 12 9.4 1 Lloyds Banking Group
6,962 12 29.1 1 Bank of America Merrill Lynch
5,280 17 19.3
2 Bank of America Merrill Lynch
5,823 12 10.8 2 Commerzbank Group
7,721 9 8.7 2 Bank of America Merrill Lynch
3,157 7 13.2 2 Barclays 3,790 5 13.8
3 Citi 5,400 12 10.0 3 Bank of America Merrill Lynch
7,286 26 8.2 3 Credit Suisse 2,903 5 12.1 3 Citi 3,548 12 13.0
4 Credit Suisse 3,410 8 6.3 4 Citi 5,626 18 6.3 4 Citi 2,379 7 9.9 4 Morgan Stanley 2,888 9 10.5
5 Morgan Stanley 2,398 4 4.5 5 Barclays 5,493 11 6.2 5 Morgan Stanley 2,015 3 8.4 5 Lloyds Banking Group
2,192 7 8.0
6 HSBC 2,357 8 4.4 6 Morgan Stanley 3,745 11 4.2 6 Natixis 1,774 2 7.4 6 Goldman Sachs 1,853 3 6.8
7 UniCredit 1,849 4 3.4 7 Deutsche Bank 3,663 12 4.1 7 HSBC 1,054 4 4.4 7 Deutsche Bank 1,566 5 5.7
8 Natixis 1,837 3 3.4 8 Lloyds Banking Group
3,576 12 4.0 8 Barclays 874 3 3.7 8 Credit Suisse 1,276 3 4.7
9 JPMorgan 1,799 3 3.4 9 UniCredit 3,455 8 3.9 9 Deutsche Bank 656 2 2.7 9 RBS 806 3 2.9
10 BNP Paribas 1,623 7 3.0 10 Credit Agricole CIB 3,249 11 3.7 10 Wells Fargo Securities
500 1 2.1 10 JPMorgan 762 3 2.8
Subtotal 34,391 74 64.0 Subtotal 52,188 130 58.8 Subtotal 22,275 46 93.0 Subtotal 23,961 67 87.5
Total 53,772 69 100.0 Total 88,813 139 100.0 Total 23,961 25 100.0 Total 27,385 40 100.0
Q1-4 2014 Q1-4 2013 Q1-4 2014 Q1-4 2013
Rank Bookrunner parents
Deal value (Proceeds, $m)
Number Share (%) Rank Bookrunner parents
Deal value (Proceeds, $m)
Number Share (%) Rank Bookrunner parents
Deal value (Proceeds, $m)
Number Share (%) Rank Bookrunner parents
Deal value (Proceeds, $m)
Number Share (%)
1 JPMorgan 10,743 21 13.2 1 JPMorgan 10,746 16 14.3 1 JPMorgan 6,113 6 22.6 1 Barclays 3,684 6 23.6
2 Citi 5,972 15 7.3 2 Barclays 5,608 13 7.5 2 Lloyds Banking Group
2,600 7 9.6 2 Deutsche Bank 1,772 4 11.4
3 Bank of America Merrill Lynch
5,755 15 7.1 3 Bank of America Merrill Lynch
5,378 13 7.2 3 Bank of America Merrill Lynch
2,524 7 9.3 3 Lloyds Banking Group
1,708 7 11.0
4 Deutsche Bank 5,184 16 6.4 4 SG Corporate & Investment Banking
5,289 11 7.0 4 Deutsche Bank 2,461 7 9.1 4 RBS 1,191 6 7.6
5 Barclays 4,840 15 5.9 5 Deutsche Bank 4,944 11 6.6 5 Citi 2,111 5 7.8 5 Bank of America Merrill Lynch
1,131 5 7.3
6 HSBC 4,483 12 5.5 6 Citi 3,709 12 4.9 6 Credit Suisse 2,089 6 7.7 6 Credit Suisse 1,073 4 6.9
7 Lloyds Banking Group
3,800 11 4.7 7 Rabobank 3,620 6 4.8 7 HSBC 1,889 5 7.0 7 JPMorgan 914 3 5.9
8 Credit Suisse 3,562 9 4.4 8 HSBC 3,312 13 4.4 8 RBS 1,061 3 3.9 8 Morgan Stanley 849 3 5.5
9 Rabobank 3,307 7 4.1 9 RBS 3,034 13 4.0 9 Barclays 827 3 3.1 9 Goldman Sachs 643 2 4.1
10 Credit Agricole CIB 3,270 8 4.0 10 Credit Suisse 2,502 11 3.3 10 Goldman Sachs 823 2 3.0 10 Santander 522 2 3.4
Subtotal 50,914 129 62.5 Subtotal 48,142 106 64.0 Subtotal 22,498 51 83.0 Subtotal 13,487 42 86.5
Total 81,454 115 100.0 Total 75,274 116 100.0 Total 27,096 41 100.0 Total 15,585 28 100.0

Introduction to asset-backed securities Part Two 19
Figure 112013 to Q2 2016 ranking of fi rms executing European and UK securitisations
2013 – Q2 2016 European Asset-backed Securities (ABS) and Mortgage-backed Securities (MBS) bond bookrunner ranking for top 10 2013 – Q2 2016 UK ABS and MBS bond bookrunner ranking for top 10
Q1-2 2016 Q1-4 2015 Q1-2 2016 Q1-4 2015
Rank Bookrunnerparents
Deal value (Proceeds, $m)
Number Share (%) Rank Bookrunner parents
Deal value (Proceeds, $m)
Number Share (%) Rank Bookrunner parents
Deal value (Proceeds, $m)
Number Share (%) Rank Bookrunner parents
Deal value (Proceeds, $m)
Number Share (%)
1 Lloyds Banking Group
7,894 13 14.7 1 HSBC 8,375 12 9.4 1 Lloyds Banking Group
6,962 12 29.1 1 Bank of America Merrill Lynch
5,280 17 19.3
2 Bank of America Merrill Lynch
5,823 12 10.8 2 Commerzbank Group
7,721 9 8.7 2 Bank of America Merrill Lynch
3,157 7 13.2 2 Barclays 3,790 5 13.8
3 Citi 5,400 12 10.0 3 Bank of America Merrill Lynch
7,286 26 8.2 3 Credit Suisse 2,903 5 12.1 3 Citi 3,548 12 13.0
4 Credit Suisse 3,410 8 6.3 4 Citi 5,626 18 6.3 4 Citi 2,379 7 9.9 4 Morgan Stanley 2,888 9 10.5
5 Morgan Stanley 2,398 4 4.5 5 Barclays 5,493 11 6.2 5 Morgan Stanley 2,015 3 8.4 5 Lloyds Banking Group
2,192 7 8.0
6 HSBC 2,357 8 4.4 6 Morgan Stanley 3,745 11 4.2 6 Natixis 1,774 2 7.4 6 Goldman Sachs 1,853 3 6.8
7 UniCredit 1,849 4 3.4 7 Deutsche Bank 3,663 12 4.1 7 HSBC 1,054 4 4.4 7 Deutsche Bank 1,566 5 5.7
8 Natixis 1,837 3 3.4 8 Lloyds Banking Group
3,576 12 4.0 8 Barclays 874 3 3.7 8 Credit Suisse 1,276 3 4.7
9 JPMorgan 1,799 3 3.4 9 UniCredit 3,455 8 3.9 9 Deutsche Bank 656 2 2.7 9 RBS 806 3 2.9
10 BNP Paribas 1,623 7 3.0 10 Credit Agricole CIB 3,249 11 3.7 10 Wells Fargo Securities
500 1 2.1 10 JPMorgan 762 3 2.8
Subtotal 34,391 74 64.0 Subtotal 52,188 130 58.8 Subtotal 22,275 46 93.0 Subtotal 23,961 67 87.5
Total 53,772 69 100.0 Total 88,813 139 100.0 Total 23,961 25 100.0 Total 27,385 40 100.0
Q1-4 2014 Q1-4 2013 Q1-4 2014 Q1-4 2013
Rank Bookrunner parents
Deal value (Proceeds, $m)
Number Share (%) Rank Bookrunner parents
Deal value (Proceeds, $m)
Number Share (%) Rank Bookrunner parents
Deal value (Proceeds, $m)
Number Share (%) Rank Bookrunner parents
Deal value (Proceeds, $m)
Number Share (%)
1 JPMorgan 10,743 21 13.2 1 JPMorgan 10,746 16 14.3 1 JPMorgan 6,113 6 22.6 1 Barclays 3,684 6 23.6
2 Citi 5,972 15 7.3 2 Barclays 5,608 13 7.5 2 Lloyds Banking Group
2,600 7 9.6 2 Deutsche Bank 1,772 4 11.4
3 Bank of America Merrill Lynch
5,755 15 7.1 3 Bank of America Merrill Lynch
5,378 13 7.2 3 Bank of America Merrill Lynch
2,524 7 9.3 3 Lloyds Banking Group
1,708 7 11.0
4 Deutsche Bank 5,184 16 6.4 4 SG Corporate & Investment Banking
5,289 11 7.0 4 Deutsche Bank 2,461 7 9.1 4 RBS 1,191 6 7.6
5 Barclays 4,840 15 5.9 5 Deutsche Bank 4,944 11 6.6 5 Citi 2,111 5 7.8 5 Bank of America Merrill Lynch
1,131 5 7.3
6 HSBC 4,483 12 5.5 6 Citi 3,709 12 4.9 6 Credit Suisse 2,089 6 7.7 6 Credit Suisse 1,073 4 6.9
7 Lloyds Banking Group
3,800 11 4.7 7 Rabobank 3,620 6 4.8 7 HSBC 1,889 5 7.0 7 JPMorgan 914 3 5.9
8 Credit Suisse 3,562 9 4.4 8 HSBC 3,312 13 4.4 8 RBS 1,061 3 3.9 8 Morgan Stanley 849 3 5.5
9 Rabobank 3,307 7 4.1 9 RBS 3,034 13 4.0 9 Barclays 827 3 3.1 9 Goldman Sachs 643 2 4.1
10 Credit Agricole CIB 3,270 8 4.0 10 Credit Suisse 2,502 11 3.3 10 Goldman Sachs 823 2 3.0 10 Santander 522 2 3.4
Subtotal 50,914 129 62.5 Subtotal 48,142 106 64.0 Subtotal 22,498 51 83.0 Subtotal 13,487 42 86.5
Total 81,454 115 100.0 Total 75,274 116 100.0 Total 27,096 41 100.0 Total 15,585 28 100.0

20 Part Two Introduction to asset-backed securities
2013 – Q2 2016 European Residential Mortgage-backed Securities (RMBS) bond bookrunner ranking for top 10 2013 – Q2 2016 UK RMBS bond bookrunner ranking for top 10
Q1-2 2016 Q1-4 2015 Q1-2 2016 Q1-4 2015
Rank Bookrunner parents
Deal value (Proceeds, $m)
Number Share (%) Rank Bookrunner parents
Deal value (Proceeds, $m)
Number Share (%) Rank Bookrunner parents
Deal value (Proceeds, $m)
Number Share (%) Rank Bookrunner parents
Deal value (Proceeds, $m)
Number Share (%)
1 Lloyds Banking Group
5,956 8 20.9 1 Barclays 4,256 7 13.5 1 Lloyds Banking Group
5,956 8 31.9 1 Barclays 3,790 5 22.3
2 Bank of America Merrill Lynch
4,331 6 15.2 2 Bank of America Merrill Lynch
3,822 14 12.1 2 Bank of America Merrill Lynch
2,796 5 15.0 2 Bank of America Merrill Lynch
3,141 11 18.5
3 Citi 3,046 6 10.7 3 Citi 2,866 8 9.1 3 Morgan Stanley 2,015 3 10.8 3 Morgan Stanley 2,402 7 14.2
4 Morgan Stanley 2,015 3 7.1 4 Morgan Stanley 2,674 8 8.5 4 Natixis 1,774 2 9.5 4 Citi 2,195 7 12.9
5 JPMorgan 1,799 3 6.3 5 Rabobank 2,172 4 6.9 5 Credit Suisse 1,753 2 9.4 5 Deutsche Bank 1,115 3 6.6
6 Natixis 1,774 2 6.2 6 Credit Suisse 1,705 4 5.4 6 Citi 1,511 5 8.1 6 Credit Suisse 1,002 2 5.9
7 Credit Suisse 1,753 2 6.2 7 Deutsche Bank 1,598 5 5.1 7 HSBC 909 3 4.9 7 Lloyds Banking Group
825 5 4.9
8 Banco de Sabadell SA
1,535 1 5.4 8 JPMorgan 1,483 6 4.7 8 Deutsche Bank 656 2 3.5 8 RBS 712 2 4.2
9 Rabobank 1,449 3 5.1 9 UniCredit 1,437 4 4.5 9 Barclays 475 2 2.5 9 HSBC 542 2 3.2
10 HSBC 909 3 3.2 10 RBS 1,270 4 4.0 10 BNP Paribas 332 2 1.8 10 Banco deSabadell SA
278 1 1.6
Subtotal 24,568 37 86.4 Subtotal 23,283 64 73.6 Subtotal 18,179 34 97.5 Subtotal 16,001 45 94.3
Total 28,446 20 100.0 Total 31,616 39 100.0 Total 18,926 14 100.0 Total 17,185 19 100.0
Q1-4 2014 Q1-4 2013 Q1-4 2014 Q1-4 2013
Rank Bookrunner parents
Deal value (Proceeds, $m)
Number Share (%) Rank Bookrunner parents
Deal value (Proceeds, $m)
Number Share (%) Rank Bookrunner parents
Deal value (Proceeds, $m)
Number Share (%) Rank Bookrunner parents
Deal value (Proceeds, $m)
Number Share (%)
1 Rabobank 2,682 5 18.9 1 JPMorgan 8,711 8 34.7 1 HSBC 733 2 13.3 1 JPMorgan 914 3 16.5
2 JPMorgan 1,874 5 13.2 2 Rabobank 2,164 5 8.6 2 JPMorgan 715 2 12.9 2 Barclays 896 3 16.2
3 RBS 1,338 4 9.4 3 Deutsche Bank 1,776 3 7.1 3 Barclays 567 2 10.3 3 RBS 794 3 14.3
4 Citi 970 2 6.8 4 ING 1,640 2 6.5 4 RBS 494 2 8.9 4 Deutsche Bank 744 2 13.4
5 Barclays 856 3 6.0 5 RBS 1,543 6 6.2 5 Lloyds Banking Group
425 3 7.7 5 Lloyds Banking Group
464 3 8.4
6 Natixis 788 4 5.6 6 SG Corporate & Investment Banking
1,403 3 5.6 6 Deutsche Bank 367 2 6.6 6 Credit Suisse 448 2 8.1
7 ABN AMRO Bank 749 2 5.3 7 Barclays 1,209 4 4.8 6 Bank of America Merrill Lynch
367 2 6.6 7 National Australia Bank
209 1 3.8
8 HSBC 733 2 5.2 8 Lloyds Banking Group
980 5 3.9 6 Santander 367 2 6.6 8 Natixis 191 1 3.5
9 Lloyds Banking Group
645 4 4.5 9 Morgan Stanley 813 2 3.2 9 UniCredit 352 1 6.4 9 Bank of America Merrill Lynch
189 1 3.4
10 Deutsche Bank 620 3 4.4 10 Citi 749 3 3.0 10 UBS andBNP Paribas
448 2 8.2 9 Santander 189 1 3.4
Subtotal 11,255 34 79.3 Subtotal 20,988 41 83.7 Subtotal 4,835 20 87.5 Subtotal 5,038 20 90.9
Total 14,200 19 100.0 Total 15,585 28 100.0 Total 5,527 9 100.0 Total 5,699 12 100.0
Figure 11 continued2013 to Q2 2016 ranking of fi rms executing European and UK securitisations
Notes
1 ABS and MBS include RMBS, CMBS, mortgage-backed agencies, commercial mortgages, CDOs and CLOs including consumer loan type securitisations. UK RMBS excludes CMBS. Transactions where issuer and investor are related parties are included subject to Dealogic’s discretion.
2 Where appropriate we have rounded totals. Total row takes into account all deals, subtotals are for top 10 only.
Source: Data from Dealogic

Introduction to asset-backed securities Part Two 21
2013 – Q2 2016 European Residential Mortgage-backed Securities (RMBS) bond bookrunner ranking for top 10 2013 – Q2 2016 UK RMBS bond bookrunner ranking for top 10
Q1-2 2016 Q1-4 2015 Q1-2 2016 Q1-4 2015
Rank Bookrunner parents
Deal value (Proceeds, $m)
Number Share (%) Rank Bookrunner parents
Deal value (Proceeds, $m)
Number Share (%) Rank Bookrunner parents
Deal value (Proceeds, $m)
Number Share (%) Rank Bookrunner parents
Deal value (Proceeds, $m)
Number Share (%)
1 Lloyds Banking Group
5,956 8 20.9 1 Barclays 4,256 7 13.5 1 Lloyds Banking Group
5,956 8 31.9 1 Barclays 3,790 5 22.3
2 Bank of America Merrill Lynch
4,331 6 15.2 2 Bank of America Merrill Lynch
3,822 14 12.1 2 Bank of America Merrill Lynch
2,796 5 15.0 2 Bank of America Merrill Lynch
3,141 11 18.5
3 Citi 3,046 6 10.7 3 Citi 2,866 8 9.1 3 Morgan Stanley 2,015 3 10.8 3 Morgan Stanley 2,402 7 14.2
4 Morgan Stanley 2,015 3 7.1 4 Morgan Stanley 2,674 8 8.5 4 Natixis 1,774 2 9.5 4 Citi 2,195 7 12.9
5 JPMorgan 1,799 3 6.3 5 Rabobank 2,172 4 6.9 5 Credit Suisse 1,753 2 9.4 5 Deutsche Bank 1,115 3 6.6
6 Natixis 1,774 2 6.2 6 Credit Suisse 1,705 4 5.4 6 Citi 1,511 5 8.1 6 Credit Suisse 1,002 2 5.9
7 Credit Suisse 1,753 2 6.2 7 Deutsche Bank 1,598 5 5.1 7 HSBC 909 3 4.9 7 Lloyds Banking Group
825 5 4.9
8 Banco de Sabadell SA
1,535 1 5.4 8 JPMorgan 1,483 6 4.7 8 Deutsche Bank 656 2 3.5 8 RBS 712 2 4.2
9 Rabobank 1,449 3 5.1 9 UniCredit 1,437 4 4.5 9 Barclays 475 2 2.5 9 HSBC 542 2 3.2
10 HSBC 909 3 3.2 10 RBS 1,270 4 4.0 10 BNP Paribas 332 2 1.8 10 Banco deSabadell SA
278 1 1.6
Subtotal 24,568 37 86.4 Subtotal 23,283 64 73.6 Subtotal 18,179 34 97.5 Subtotal 16,001 45 94.3
Total 28,446 20 100.0 Total 31,616 39 100.0 Total 18,926 14 100.0 Total 17,185 19 100.0
Q1-4 2014 Q1-4 2013 Q1-4 2014 Q1-4 2013
Rank Bookrunner parents
Deal value (Proceeds, $m)
Number Share (%) Rank Bookrunner parents
Deal value (Proceeds, $m)
Number Share (%) Rank Bookrunner parents
Deal value (Proceeds, $m)
Number Share (%) Rank Bookrunner parents
Deal value (Proceeds, $m)
Number Share (%)
1 Rabobank 2,682 5 18.9 1 JPMorgan 8,711 8 34.7 1 HSBC 733 2 13.3 1 JPMorgan 914 3 16.5
2 JPMorgan 1,874 5 13.2 2 Rabobank 2,164 5 8.6 2 JPMorgan 715 2 12.9 2 Barclays 896 3 16.2
3 RBS 1,338 4 9.4 3 Deutsche Bank 1,776 3 7.1 3 Barclays 567 2 10.3 3 RBS 794 3 14.3
4 Citi 970 2 6.8 4 ING 1,640 2 6.5 4 RBS 494 2 8.9 4 Deutsche Bank 744 2 13.4
5 Barclays 856 3 6.0 5 RBS 1,543 6 6.2 5 Lloyds Banking Group
425 3 7.7 5 Lloyds Banking Group
464 3 8.4
6 Natixis 788 4 5.6 6 SG Corporate & Investment Banking
1,403 3 5.6 6 Deutsche Bank 367 2 6.6 6 Credit Suisse 448 2 8.1
7 ABN AMRO Bank 749 2 5.3 7 Barclays 1,209 4 4.8 6 Bank of America Merrill Lynch
367 2 6.6 7 National Australia Bank
209 1 3.8
8 HSBC 733 2 5.2 8 Lloyds Banking Group
980 5 3.9 6 Santander 367 2 6.6 8 Natixis 191 1 3.5
9 Lloyds Banking Group
645 4 4.5 9 Morgan Stanley 813 2 3.2 9 UniCredit 352 1 6.4 9 Bank of America Merrill Lynch
189 1 3.4
10 Deutsche Bank 620 3 4.4 10 Citi 749 3 3.0 10 UBS andBNP Paribas
448 2 8.2 9 Santander 189 1 3.4
Subtotal 11,255 34 79.3 Subtotal 20,988 41 83.7 Subtotal 4,835 20 87.5 Subtotal 5,038 20 90.9
Total 14,200 19 100.0 Total 15,585 28 100.0 Total 5,527 9 100.0 Total 5,699 12 100.0
Figure 11 continued2013 to Q2 2016 ranking of fi rms executing European and UK securitisations
Notes
1 ABS and MBS include RMBS, CMBS, mortgage-backed agencies, commercial mortgages, CDOs and CLOs including consumer loan type securitisations. UK RMBS excludes CMBS. Transactions where issuer and investor are related parties are included subject to Dealogic’s discretion.
2 Where appropriate we have rounded totals. Total row takes into account all deals, subtotals are for top 10 only.
Source: Data from Dealogic
22 Part Two Introduction to asset-backed securities
Performance
2.8 Figure 12 shows the performance of the UK RMBS market compared with the other largest player in the market, the Netherlands. Specifically, it shows the spreads of AAA retail mortgage-backed securities. The spread is the interest rate of an asset over and above a benchmark cost of borrowing. Spreads are inversely correlated to the price. An increase in spread reflects worsening market conditions as it means the investors are asking for higher compensation compared to a benchmark rate (a higher rate of interest) to take on risk. Conversely, a low spread reflects that investors are asking for less compensation to take on risk, which means they are more confident in the market so will pay more for it. Figure 12 shows that conditions for MBS dramatically worsened during the financial crisis, peaking at the end of 2008. They subsequently improved but remained high until 2012 with a high level of volatility. From early 2012, the spreads decreased further, reaching a new low since the crisis at the end of 2014. However, during the second half of 2015 market conditions slightly worsened again due to a decline in commodity prices and softer economic growth and currency devaluation in China.
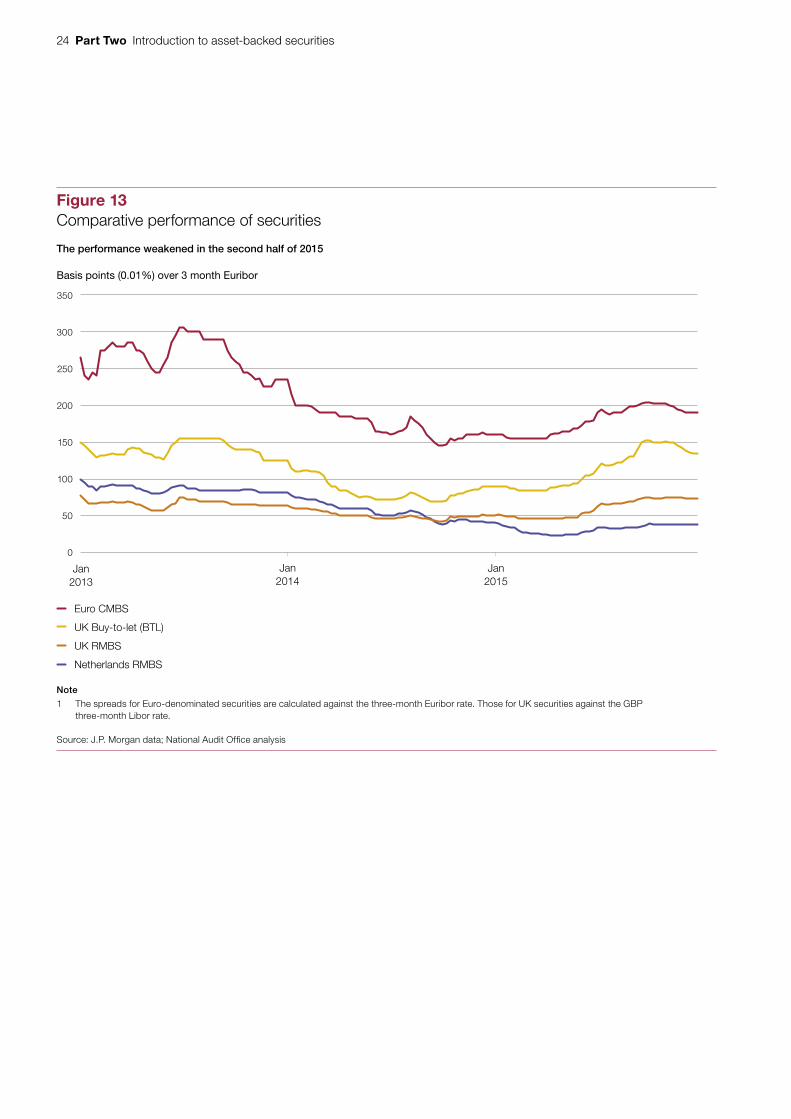
2.9 Figure 13 on page 24 shows that other types of assets performed similarly in recent years – namely conditions were improving until the second half of 2015, at which point they started worsening again with the exception of the Dutch RMBS market. Riskier securities such as those backed by commercial property and buy-to-let mortgages worsened more than the RMBS market.
2.10 Figure 14 on page 25 shows that Granite securities also followed a similar pattern. Triple A and B tranches of Granite outperformed the market until mid-2014, followed by some increase in volatility until the end of the first quarter of 2015. In the second half of 2015 spreads worsened again due to the weaker overall market conditions.

Introduction to asset-backed securities Part Two 23
Figure 12Comparative performance of AAA retail mortgage-backed securities between 2007 and 2015
Basis points (0.01%) over 3 month Euribor
450
400
350
300
250
200
150
100
50
0
Jan2007
Jan2008
Jan2009
Market conditions for mortgage-backed securities dramatically worsened during the financial crisis but have recovered since
Jan2010
Jan2011
Jan2012
Jan2013
Jan2014
Jan2015
Note
1 The spreads for Euro-denominated securities are calculated against the three-month Euribor rate. Those for UK securities against the GBP three-month Libor rate.
Source: J.P. Morgan data; National Audit Office analysis
Netherlands RMBS
UK RMBS
24 Part Two Introduction to asset-backed securities
Figure 13Comparative performance of securities
Basis points (0.01%) over 3 month Euribor
350
300
250
200
150
100
50
0
Jan2013
The performance weakened in the second half of 2015
Jan2015
Jan2014
Note
1 The spreads for Euro-denominated securities are calculated against the three-month Euribor rate. Those for UK securities against the GBP three-month Libor rate.
Source: J.P. Morgan data; National Audit Office analysis
Euro CMBS
UK Buy-to-let (BTL)
UK RMBS
Netherlands RMBS

Introduction to asset-backed securities Part Two 25
Figure 14Performance of Granite securities compared to the UK RMBS market
Basis points (0.01%) over 3 month Euribor
180
160
140
120
100
80
60
40
20
0
Jan 2013
Granite securities slightly outperformed the market
Jan 2014 Jan 2015
Granite AAA UK RMBS AAA
350
300
250
200
150
100
50
0
Jan 2013 Jan 2014 Jan 2015
Granite BBB UK RMBS BBB
Note
1 The Granite spreads are for the Euro-denominated tranches so they are calculated against the three-month Euribor rate. The UK RMBS spreads are calculated against the three-month GBP Libor rate.
Source: J.P. Morgan data; National Audit Office analysis
Basis points (0.01%) over 3 month Euribor

26 Appendix One Introduction to asset-backed securities
Appendix One
Granite Securitisation
Introduction
1 ‘Granite Master Trust’ is the SPV that Northern Rock set up in 2001 to issue ‘Granite’ securities from a pool of underlying residential mortgages. As a master trust, it was able to issue several batches of securities across the years. Prior to the nationalisation of Northern Rock, Granite would buy mortgages from Northern Rock using funds raised from issuing securities. The investors would then be paid using the interest and principal repayments on the mortgages held within Granite.
2 Northern Rock obtained regular payments from Granite through its seller’s share. However, in November 2008, it failed to keep up its seller’s share at the appropriate level, causing it to breach the ‘non-asset trigger’ (explained in paragraph 1.15). Consequently, Granite moved into ‘pass-through’ mode, meaning that Northern Rock Asset Management would not receive principal repayments until 2020.5 When Northern Rock was nationalised in 2008, the UK government inherited this seller’s share. As at 30 June 2015, the seller’s share percentage was 36.37%.
Overview of the Granite assets
3 In 2015, UKAR sold 270,808 loans totalling nearly £13.3 billion, which was reported on by the National Audit Office in The £13 billion sale of former Northern Rock assets.6 Of the value of the portfolio, 91% was made up of Granite mortgages from the Granite securitisation vehicle, as shown in Figure 15.
4 The performance of the Granite mortgages has improved since the end of 2012. They performed better on average than other NRAM (Northern Rock Asset Management) assets held by UKAR but worse than the market average calculated by the Council of Mortgage Lenders (CML).7 Typically, a mortgage is considered to be in arrears if the borrower is behind with repayments by three months or more. At as 30 June 2015, 2.94% of the mortgages were in arrears by three months or more. Figure 16 on page 28 shows the trend over time, including repossessions (0.05% of properties had been repossessed in the month of June).
5 Assuming the investors continue to be paid off at the current rate.6 Comptroller and Auditor General, The £13 billion sale of former Northern Rock assets, Session 2016-17, HC 513,
National Audit Office, July 2016.7 The market average includes new lending, which NRAM, B&B and Granite are not allowed to do.

Introduction to asset-backed securities Appendix One 27
Figure 15Composition of the £13.3 billion portfolio sold
Granite 63%
Unsecured loans 25%
Terms & Conditionloans 12%
Notes
1 Data from 30 June 2015.
2 The Granite mortgages are ‘secured loans’ because they are backed by an asset, namely residential property. Unsecured loans are not backed by any assets.
Source: National Audit Office analysis
Breakdown of the number of loans in the portfolio 270,808 loans made up of:
Granite 91%
Unsecured loans 5% Terms & Condition loans 4%
Breakdown of the value of the portfolio £13.26 billion made up of:
Granite made up 60% of the number of loans in the portfolio and made up 90% of the loans by value

28 Appendix One Introduction to asset-backed securities
Figure 16Historic payment arrears of the market versus Granite
Percentage of loan more than 3 months in arrears
8
7
6
5
4
3
2
1
0
Jun
Payment arrears in Granite improved substantially over time
Sep
2010
Dec Mar Jun Sep Dec Mar Jun Sep Dec Mar Jun Sep Dec Mar Jun Sep Dec Mar Jun Sep Dec
NRAM 3m+
Granite 3m+
B&B 3m+
CML 3m+
Notes
1 CML: Council of Mortgage Lenders. This includes new lending, which NRAM, B&B and Granite are not allowed to do.
2 The NRAM and B&B (Bradford & Bingley) loans are also owned by UKAR.
Source: UK Asset Resolution (UKAR) analysis
2011 2012 2013 2014 2015
Introduction to asset-backed securities Appendix One 29
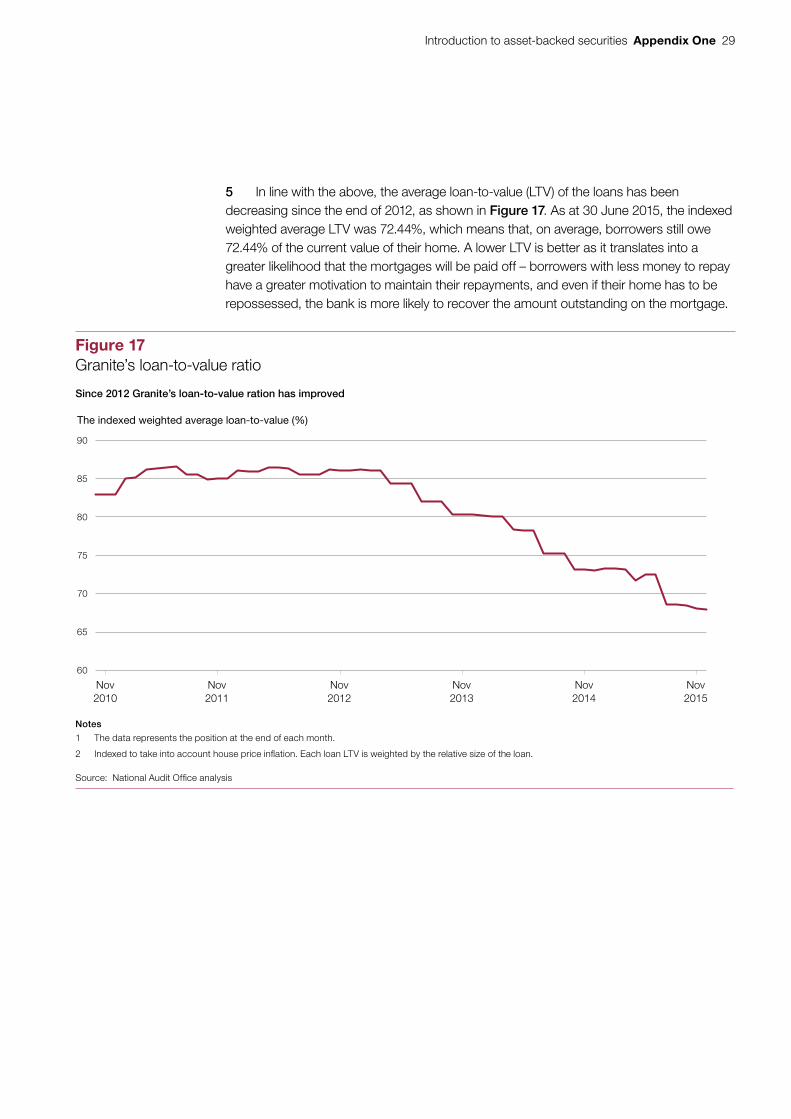
5 In line with the above, the average loan-to-value (LTV) of the loans has been decreasing since the end of 2012, as shown in Figure 17. As at 30 June 2015, the indexed weighted average LTV was 72.44%, which means that, on average, borrowers still owe 72.44% of the current value of their home. A lower LTV is better as it translates into a greater likelihood that the mortgages will be paid off – borrowers with less money to repay have a greater motivation to maintain their repayments, and even if their home has to be repossessed, the bank is more likely to recover the amount outstanding on the mortgage.
Figure 17Granite’s loan-to-value ratio
The indexed weighted average loan-to-value (%)
90
85
80
75
70
65
60
Nov2010
Nov2011
Nov2012
Nov2013
Nov2014
Since 2012 Granite’s loan-to-value ration has improved
Nov2015
Notes
1 The data represents the position at the end of each month.
2 Indexed to take into account house price inflation. Each loan LTV is weighted by the relative size of the loan.
Source: National Audit Office analysis

Design and Production by NAO External Relations DP Ref: 11267-001