Embed Size (px)
Citation preview

12/13/2011
1
2012‐2013 Budget WorksessionRadnor Township School District
December 13, 2011
Introduction
Radnor Township School District, like school d h l h d hdistricts across the Commonwealth and the nation, continues to bear the responsibility of balancing the limits imposed by Act 1 with the Radnor tradition of providing an excellent educational program.p g

12/13/2011
2
Goal 4.1
Review and revamp where necessary the entire budget procedure from initial distribution of budget
k b ildi d d h h fi lpackets to buildings and departments through final adoption by the Board of School Directors (January 2011).
The goal in every budget decision was and remains tocontinue to provide a Radnor Education for all studentscontinue to provide a Radnor Education for all students.
Basic Education
• Core subject areas• Reading/English
• Math
• Science
• Social studies
• Health and physical education
• Federal and state mandates
G d i i• Graduation requirements
• Special services
4
12/13/2011
3
Co‐teaching
A Radnor Education
World language options
5
RADtv
Process Changes Recap
Prior Practice Revamped Procedure
Principals reviewed needs and developed budget request
Budget Calendar developed and presented after Act I
March 2011 ‐ Principals and department heads reviewed their budgets by line item with Superintendent and Business Administrator
June 2011 – Budget l d d l dindex was announced,
usually September
calendar developed, reviewed by Finance Committee and adopted by Board vote

12/13/2011
4
Process Changes Recap
Prior Practice Revamped Procedure
Current budget rolled forward
Anticipated costs added
Budget books distributed to each department and school
November 2011 ‐ Budget justification meetings held Department heads and
i i l id dprincipals provided justification for each budget request
Process Changes Recap
Prior Practice
Current employee costs
Revamped Procedure
Actual 2012 2013 salary Current employee costs rolled forward with contractual costs added
Health care costs‐ estimated figure based on first look
Total budget cost presented to board
Actual 2012‐2013 salary contained in the budget
Health care costs ‐estimated figure based on first look
Budget developed to level f h i d Budget reduced in line with
Board direction/Items not contained within the budget identified
of the index
Items not contained within the budget identified

12/13/2011
5
Enrollment History and Projections
Year Elementary Middle School High School Totals
2006‐2007 1 558 882 1 211 3 6512006 2007 1,558 882 1,211 3,651
2007‐2008 1,526 857 1,209 3,592
2008‐2009 1,569 840 1,231 3,640
2009‐2010 1,612 830 1,239 3,681
2010‐2011 1,543 844 1,196 3,583
2011‐2012 1,575 866 1,169 3,610
2012‐2013* 1,540 838 1,165 3,543*
* Projected – based on current enrollment
Class Size Recommendations
• K 3: Preferably below 20 no higher than 21• K‐3: Preferably below 20, no higher than 21• 4‐5: Average of 22, no higher than 25• 6‐8: Average of 22, no higher than 25• 9‐12: Minimum of 15:1 student/teacher ratio • Average of 22• Maximum of 28

12/13/2011
6
RTSD’s Budget History
Year Act 1 Index Tax Increase Budget Reduction Final Budget
FY ‐ 2009 3.9 % 7 % $599,000 $72,021,781
FY ‐ 2010 4.1 % 3.9 % $1,450,000 $74,528,474
FY ‐ 2011 2.9 % 2.9 % $3,702,313 $75,945,788
FY ‐ 2012 1.4 % 1.4% 0 $76,613,114
FY ‐ 2013 1.7%
Addressing the Economic Challenge
We created a five‐year forecasting model to inform current decisions and recognize future impact to budget
E th h b d t ll l d i i h Even though we budget annually, yearly decisions have future implications
We have been examining expenditure areas to identify:
Student impact
Staff/services impact
Benefits
Use of resources
Outsourcing

12/13/2011
7
Expenditure Drivers 2012‐2013
Health insurance
Salary increase for staff
Special education
Funding of initiatives and capital projects
Employer PSERS rate projected to increase from 8.65% to 12.19% for 2012‐13 (HB2497).
News Flash: As of December 9 rate increased to News Flash: As of December 9, rate increased to 12.36% per PSERS board of trustees action. This results in $63,500 in additional retirement contributions for RTSD not currently budgeted.
Budget Workshop Format
Each office presents relevant information using a similar format
Background information is identified with a “ “
The background information is for reference and will not be addressed during the budget workshop
The format is as follows:
Historic Overview
Budget Budget
Achievement
Alignment of 2011 Goals
The 2012‐2013 budget presentation follows

12/13/2011
8
2012‐2013 Budget Assumptions
2012‐2013 budget assumes a 1.7% tax increasel d b f b d Salaries and benefits are based on current
employee contracts Health benefits budgeted at 10% increase per the “first look” provided by Independence Blue Cross
Assumes state subsidies will remain at 2011‐12 levels pending the Governor’s budget address inlevels pending the Governor s budget address in Feb. 2012
Curriculum, Instruction, Assessment and Professional Development
12/13/2011
9
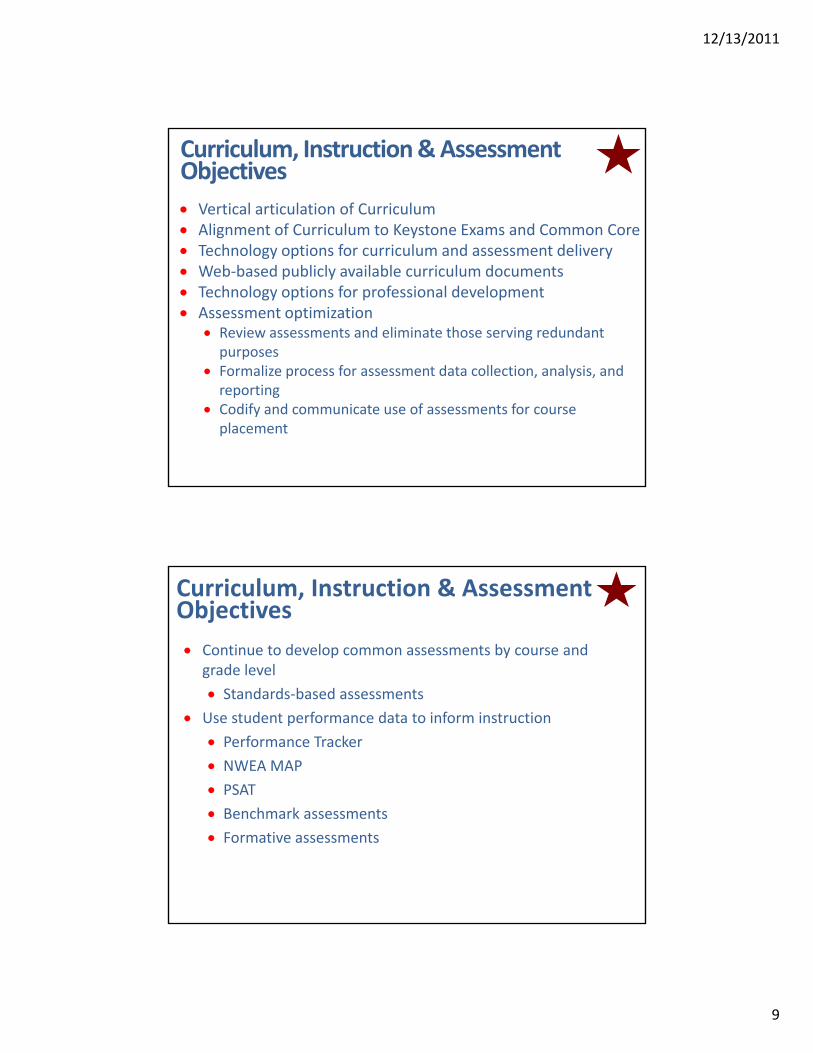
Curriculum, Instruction & Assessment Objectives
Vertical articulation of Curriculum Alignment of Curriculum to Keystone Exams and Common Core
T h l ti f i l d t d li Technology options for curriculum and assessment delivery Web‐based publicly available curriculum documents Technology options for professional development Assessment optimization
Review assessments and eliminate those serving redundant purposesF li f t d t ll ti l i d Formalize process for assessment data collection, analysis, and reporting
Codify and communicate use of assessments for course placement
Curriculum, Instruction & Assessment Objectives
Continue to develop common assessments by course and grade level
Standards‐based assessments
Use student performance data to inform instruction
Performance Tracker
NWEA MAP
PSAT
Benchmark assessments
Formative assessments

12/13/2011
10
Professional Development Objectives
Continue professional development in the areas of:
Common assessments Common assessments
Assessment data to inform instruction NWEA
PSAT Keystones Benchmark assessments
Instructional technology
Historical Overview
2009‐2010 2010‐2011 2011‐12
All historical data uploaded to Performance Tracker
Ongoing training for all staff on Performance Tracker
Routine recording of assessment data in Performance Tracker
In‐service days used to populate Curriculum Connector
Curriculum Connector & Syllabi combined for revision and alignment for Keystone Exams
Vertical Curriculum Teams continue K‐12 Curriculum alignment to Keystone Exams
English/language arts curriculum mapping
English/language arts curriculum review
New elementary reading, writing, vocabulary program implementation.
Implementation of NWEA MAP Assessment for elementary gifted students
Year I implementation of NWEA MAP assessment (three‐year rollout)
Year II implementation ofNWEA MAP assessment, condensed rollout grades 1‐8; PSAT grades 9‐11
Classroom Diagnostic Tools field test
Classroom Diagnostic Tools and Keystone Exams fieldtest
Algebra I Keystone Exam administration

12/13/2011
11
Achievements
AYP achievement – all schools, every year since inception
Standards‐based, online elementary report card is live
Elementary core reading, writing and vocabulary program identifiedElementary core reading, writing and vocabulary program identified and implemented
Above grade‐level reading materials for advanced elementary and middle school students identified, purchased, available
Vertical Curriculum Teams established and working on k‐12 curriculum, Keystones, and Common Core Standards alignment
Pilot mentoring program for gifted RMS students
Elementary Math and Literacy Benchmark Assessment System fully Elementary Math and Literacy Benchmark Assessment System fully integrated in Performance Tracker
Instructional technology pilot programs using iPads and netbooks
Diagnostic assessment of incoming kindergarten students
State and Federal Grants/Subsidies
Description 2010‐2011 2011‐2012 2012‐2013*
Title I 158,358 149,597 104,158
Title II 107,458 91,620 82,778
Title III 21,291 65,162 0
Accountability Block Grant 81,776 30,129 30,129
Safe and Drug Free 0 0 0
ARRA Stimulus Funds 200,000 0 0
IDEA 489,414 498,374 521,685
ACCESS 320,000 200,000 200,000
Special Education 1 242 978 1 248 430 1 248 430Special Education 1,242,978 1,248,430 1,248,430
Medical 122,000 122,000 124,375
Charter/Cyber School 20,000 0 0
*Assumption based on estimates. Subject to revision as actual grant/subsidy amounts become known

12/13/2011
12
Goals 2011‐2012 Goal 1
To complete the K‐12 curriculum alignment to reflect Radnor community values; to prepare our students for Keystone Exams and other high stakes assessments; and to provide them with a world class education that will maximize their options for post‐secondary pursuits.
Goal 2 To create a system for retrieving, analyzing, reporting, and providing instructional responses to assessment data.
Goal 3To extend our use of instructional technology to include options that increase educational efficacy and student achievement while exposing our students to state‐of‐the art devices and software that provide the best return on district investment.
Goal 4To establish an ongoing mechanism for providing in‐depth information to public stakeholders in an interactive format that is perpetually accessible online.
Goal 5
To provide a continuum of curricular and instructional services that are consistent across our schools to meet the needs of our advanced and gifted students.
Student Services
12/13/2011
13
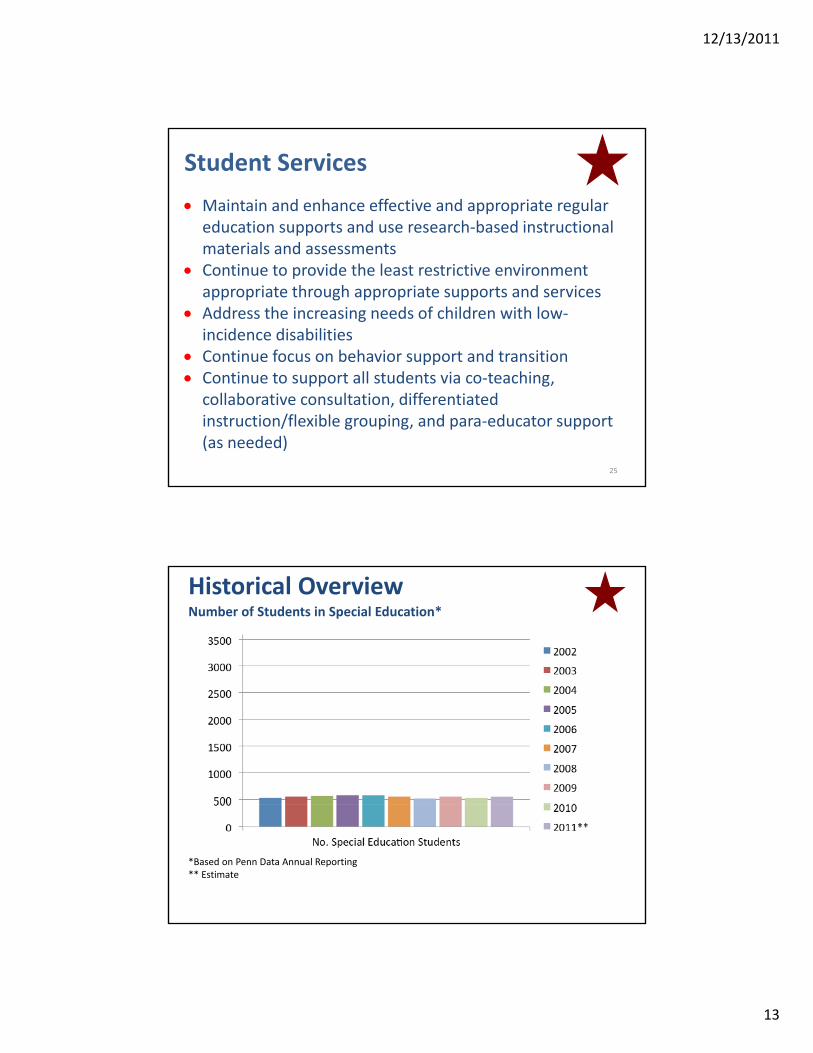
Student Services
Maintain and enhance effective and appropriate regular education supports and use research‐based instructional materials and assessmentsmaterials and assessments
Continue to provide the least restrictive environment appropriate through appropriate supports and services
Address the increasing needs of children with low‐incidence disabilities
Continue focus on behavior support and transition Continue to support all students via co‐teaching, collaborative consultation, differentiated instruction/flexible grouping, and para‐educator support (as needed)
25
Historical Overview Number of Students in Special Education*
*Based on Penn Data Annual Reporting** Estimate
12/13/2011
14
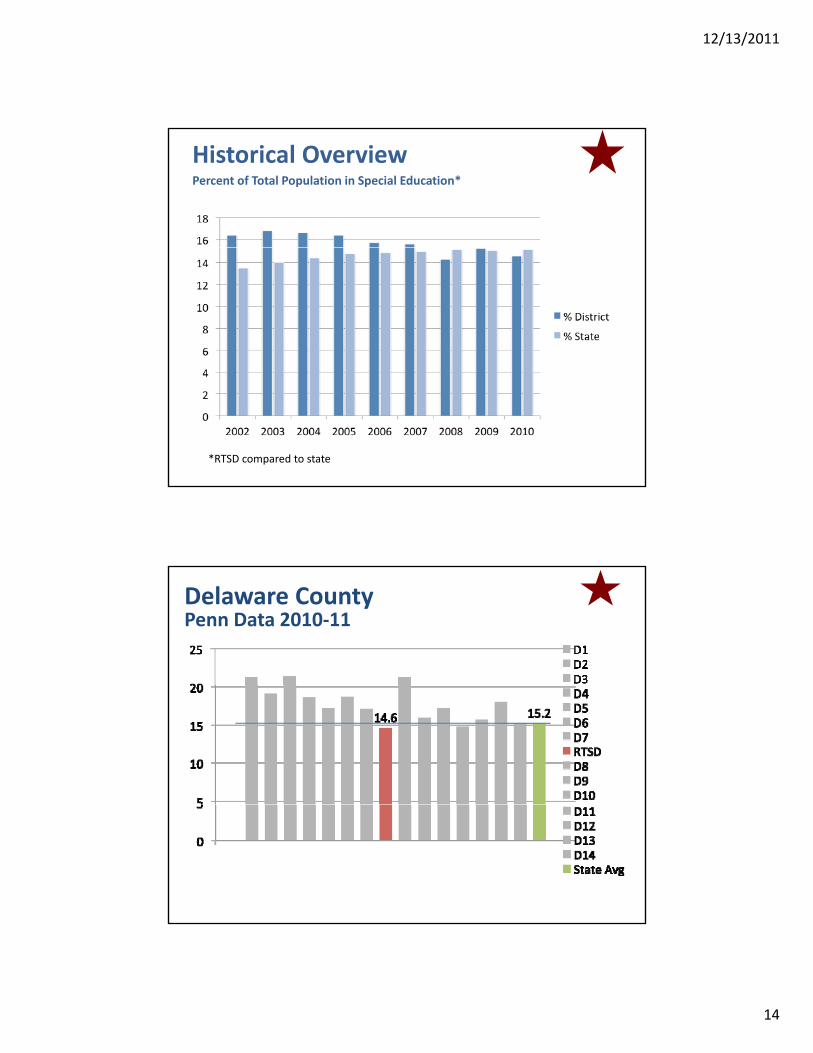
Historical OverviewPercent of Total Population in Special Education*
*RTSD compared to state
Delaware CountyPenn Data 2010‐11
12/13/2011
15
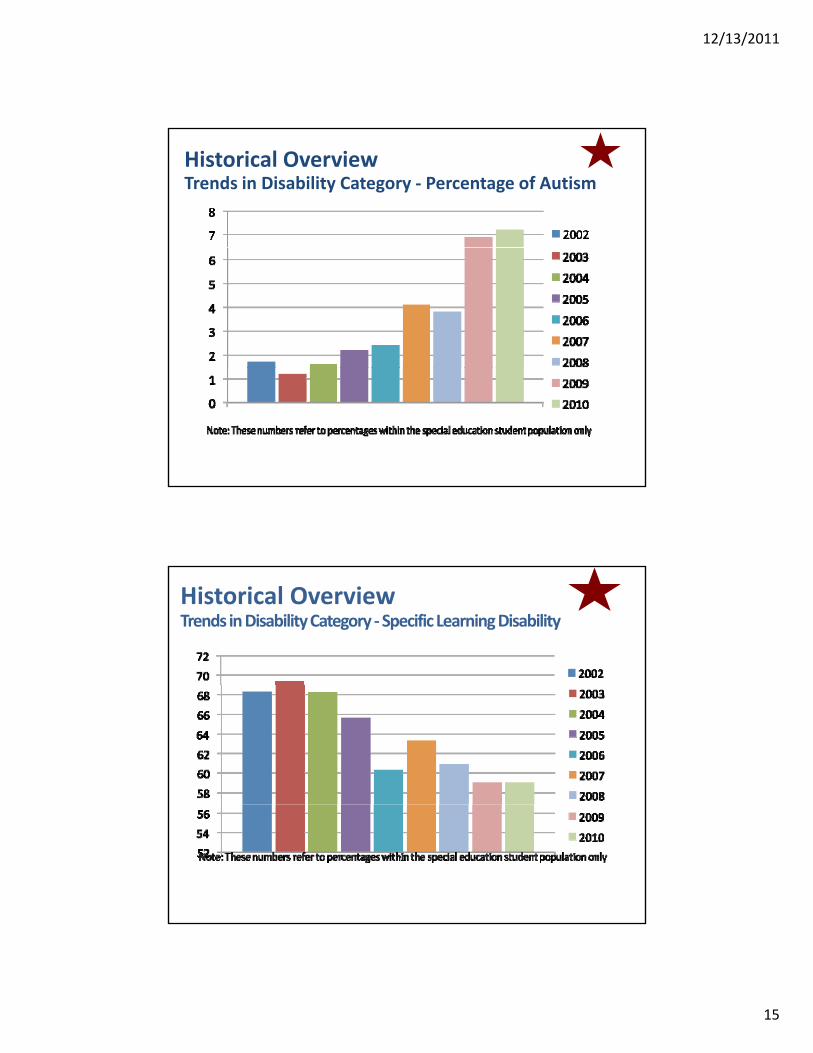
Historical OverviewTrends in Disability Category ‐ Percentage of Autism
Historical Overview Trends in Disability Category ‐Specific Learning Disability

12/13/2011
16
Historical OverviewTrends in Disability Category ‐Emotional Disturbance
Special EducationReferrals/Evaluations

12/13/2011
17
Student ServicesTrends
Low incidence/complex disabilities Continued obligation to educate nonresident students in institutions from St. Edmunds Home for Children and Presbyterian yChildren’s Village (24 P.S. Section 13‐1306)
Stress‐related illnesses (migraine headache, anxiety, school phobia, depression)
Substance abuse that impacts school performance Unilateral out of state/residential placement with parent requests for fundingS d i i i f l i i h Students transitioning from Early Intervention with significant service demands and complex needs
Support for behavioral and mental health issues (K‐12) Requests for funding of private placements Legal challenges
Student Services
Acct Description 2010‐2011 2011‐2012 2012‐2013*
322 Services Purchased from IU 1,602,174 1,742,339 2,121,336
330 Professional Services 126 500 169 920 224 028330 Professional Services 126,500 169,920 224,028
340 Technical Services 808,000 825,969 855,516
390 Fair Share 199,097 199,097 198,150
530 Postage 1,200 1,200 N/A
561 Tuition to other LEAs – PA 18,000 17,475 202,000
563 Tuition to Non‐Public Schools 425,000 430,070 748,000
567 Tuitions to Approved Priv. Schools 350,000 350,000 600,000
/ /568 Tuition PRRI/Atl Ed/Detn 0 0 0
580 Travel ‐ Conferences 5,840 5,820 12,759
581 Travel ‐Mileage 4,500 3,250 2,800
*Much of the additional costs are recoverable from other LEAs.

12/13/2011
18
Acct Description 2010‐2011 2011‐2012 2012‐2013
599 R d I i 0 0 0
Student Services
599 Record Imaging 0 0 0
610 Supplies 89,516 88,945 86,425
640 Books/Periodicals0
14,418 18,408
648 Ed Software & License0
3,000 0
810 Dues/Fees 370 30,205 10,650
Total 3,633,697 3,881,708 5,080,072
% Change 6.48% 30.87%
Accomplishments
Medical Access Program: $1,738,995 raised since 2004
Online credit recovery and remediation solution (PLATO) Online credit recovery and remediation solution (PLATO)
Drug and alcohol services at high school and middle school
Yearly state report reflects excellent compliance with mandates and least restrictive environment
Research‐based remedial/instructional and assessment materials available district‐wide for all students
Collaboratively exploring technology supports for students with complex learning needs
36

12/13/2011
19
Instructional Technologygy
Instructional Technology Objectives
Curriculum, Instruction and Professional Development
Support the development of curriculum and assessmentassessment
Provide professional development
Continuation of ACTS program (108 teachers to date)
Technology integration using effective resources d b t tiand best practice
Website development for instruction and communication
Technical staff training

12/13/2011
20
Instructional Technology Objectives
Hardware and Software
Mount LCD projectors in every classroom Mount LCD projectors in every classroom
Evaluate, upgrade, replace, and/or add classroom computers, laptops and other devices to support instructional applications
Continue to review instructional software in search of online options to increase access at homeof online options to increase access at homeand school, where appropriate and cost effective
Historical Overview2009‐2010 2010‐2011 2012‐2013
eMinders become Web‐based eMinder registration for all parents
Standards for teacher web pages
Increased use of Synergy and Use of Synergy by to track iPad pilots:Edu20 portal to share online documents
Professional Development ACTS (Watershed, Elementary Music); Special Education
Introduction of wireless netbooks in Grade 3
Completion of elementary wireless upgrade
5th grade word processors/responders
Addition of wireless laptop cart for World Language Middle School
Addition of additional laptops for RMS science
Addition of middle school laptops for each grade level
Library upgrade to Destiny online circulation card catalog
Increased use of Smartboards in elementary classrooms
Smartboards installed in a total of 150 classrooms; 10 trainingonline circulation, card catalog
and resourcesin elementary classrooms of 150 classrooms; 10 training
sessions, 90 attendees
Pilot of Assist online tech request system with technical staff
Introduction of Audacity to improve fluency
Upgrade of Radnor High School TV Studio; RMS virtual classroom
Support for increased online testing: Classroom Diagnostic Field Tests, Keystone Exams
Introduction of technology to record students’ oral reading to improve fluency
Begin replacement of CFF laptops
12/13/2011
21
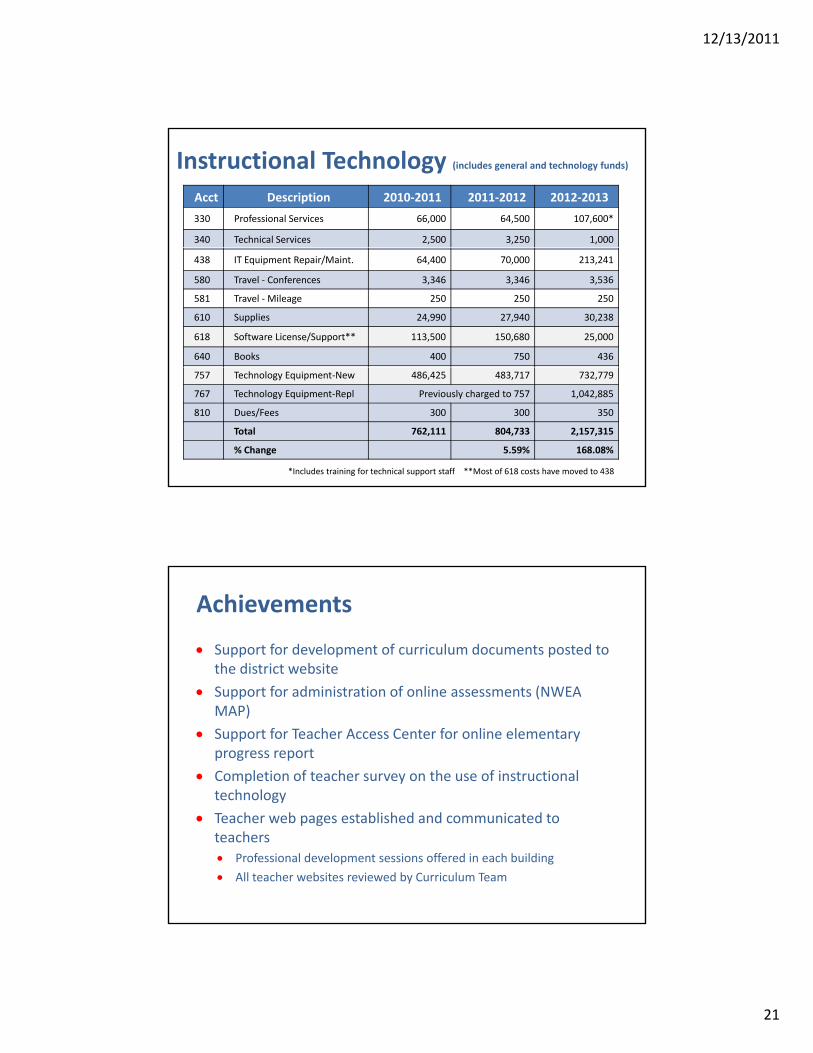
Instructional Technology (includes general and technology funds)Acct Description 2010‐2011 2011‐2012 2012‐2013
330 Professional Services 66,000 64,500 107,600*
340 Technical Services 2,500 3,250 1,000
438 IT Equipment Repair/Maint. 64,400 70,000 213,241
580 Travel ‐ Conferences 3,346 3,346 3,536
581 Travel ‐Mileage 250 250 250
610 Supplies 24,990 27,940 30,238
618 Software License/Support** 113,500 150,680 25,000
640 Books 400 750 436
757 Technology Equipment‐New 486,425 483,717 732,779
767 Technology Equipment‐Repl Previously charged to 757 1,042,885
810 Dues/Fees 300 300 350
Total 762,111 804,733 2,157,315
% Change 5.59% 168.08%
**Most of 618 costs have moved to 438*Includes training for technical support staff
Achievements
Support for development of curriculum documents posted to the district website
Support for administration of online assessments (NWEA MAP)
Support for Teacher Access Center for online elementary progress report
Completion of teacher survey on the use of instructional technology
Teacher web pages established and communicated to teachers Professional development sessions offered in each building
All teacher websites reviewed by Curriculum Team
12/13/2011
22
Operations
District Policy 704
Regular program of facilities repair and Regular program of facilities repair and conditioning
Critical parts inventory
Equipment replacement program
Long‐range plans for building modernizationLong range plans for building modernization and conditioning

12/13/2011
23
Historical Overview
Maintain ongoing repair and preventive maintenance work order systemsmaintenance work order systems
Increase energy efficiency and energy cost containment
Shared oversight of transportation, fixed assets, facilities rentals and infrastructure wiring
Maintain rigorous capital improvement plan Maintain ADA and code compliance Maintain facilities conducive to learning Reduced staffing levels department wide
Capital Plan Review Major Projects Completed 2011‐12
District Bus Replacements $536,200
RHS Backstage Curtains $14,000
WES Gym Lighting $7,000
WES Gym Matting/Curtain (Donation) $14,000
Resurfaced Play Areas $53,000
Replaced RHS Hot Water Heater $10,000
Door Frame Replacement $8,000p $ ,
Carpet Replacements $60,000
Replaced Diving Boards at RHS $6,000
Phase 1 Wayne Elementary HVAC $7.3 Mil.

12/13/2011
24
Capital Plan ReviewMajor Projects Planned 2012‐13
WES HVAC Phase 2 $7.3 Mil.
Bus Replacements $410,000
Carpet Replacement $136,000
Pool Dehumidifier $65,000
WES Library Upgrades $60,000
Remove WES/IES Modulars $55,000
D Wi i $45 000 Data Wiring $45,000
Replace District Phone System $500,000
Replace Trans roof $180,000
Operations
Acct. Description 2010‐2011 2011‐2012 2012‐2013
330 Professional Services 81,000 114,120 98,000
411 Disposal Services 63,382 63,382 65,582
414 Lawn Care 180,000 276,000* 200,000
422 Electricity 1,170,300 1,170,300 1,200,300
424 Water/Sewage 92,400 92,400 118,550
431 Building Repairs/Maint. 150,000 150,000 180,000
432 Equipment Repairs/Maint. 51,000 68,433 162273
433 Vehicle Repairs 6,500 28,100 37,400
460 Extermination Services 7,500 7,500 6,200
530 Postage 700 700 400
550 Printing/Binding 400 400 618
580 Travel /Training 1,500 1,500 1,000
*Includes local service tax offset

12/13/2011
25
Operations
Acct. Description 2010‐2011 2011‐2012 2012‐2013
581 Travel mileage 250 1,750 1,550
610 Supplies 338,677 336,412 338,095
621 Natural gas 220,234 220,234 192,000
624 Bulk oil 5,000 15,000 10,000
640 Books/periodicals 0 0 109
751 New equipment 0 0 16,350
761 Replacement equip. 16,350
810 Dues/fees 6,700 8,200 7,000810 Dues/fees 6,700 8,200 7,000
Total 2,375,543 2,554,431 2,651,777
% Change 7.53% X%
Transportation
Acct. Description 2010‐2011 2010‐2012 2012‐2013
330 Professional services 5,100 2,500 3,200
415 Laundry services 2,300 2,300 2,300
432 Equipment repair/maint. 3,100 3,100 3,100
433 Vehicle repair/maint. 20,000 20,000 20,000
513 Contracted carriers/sports 35,000 35,000 26,000
515 Public carriers 1,000 1,000 1,000
530 Postage 2,300 2,300 2,500
550 Printing/binding 500 500 550
580 Travel/conferences 1,500 1,500 1,700
581 Travel/mileage 800 800 900
610 Supplies 112,968 109,024 111,054
618 Software maint./ support 4,700 6,200 8,054

12/13/2011
26
Transportation
Budget No. Description 2010‐2011 2011‐2012 2012‐2013
624 Bulk Oil 6,700 6,700 6,700
626 Bulk Gasoline 31,200 31,200 38,400
627 Diesel Fuel 202,024 225,000 258,220
810 Dues/Fees 1,000 1,000 935
Total 430,192 448,124 484,613
% Change 4.17% 8.14%
Achievements Provide for necessary fiscal changes by adapting existing resources
Persist in achieving lower than benchmark energy consumption in an area of high energy costs
Provide exemplary learning spaces and react immediately to staff needs
Plan contingencies for unforeseen impact to programs
Provide 24/7 emergency response to facilities and Provide 24/7 emergency response to facilities and community
Cited as leading entity in green building development and education

12/13/2011
27
Facilities Goals 2011‐2012 Goal 1
Review Outsourcing ‐ Done
Goal 2 Monitor Funding Sources for Upgrades – Examples QSC Bonds, PECO Smart Incentives
Goal 3WES Renovation Project – Phase 1 complete, $50,000 under budget
Goal 4Monitor Capital Improvement Plan – Ongoing
Goal 5Maintain Safety Committee – Done Monthly
Goal 6 Goal 6Evaluate Modular Classroom Disposition – Approved for removal summer 2012
Goal 7Review Facilities Rental Guidelines – In Committee Process
Goal 8Evaluate alternatives for RHS Parking/Traffic – In Committee Process
Information Technology

12/13/2011
28
Objectives Driving Information Technology
Maintain administrative and support staff access to Maintain administrative and support staff access to information resources
Provide technology support for all departments
Maintain and update a high‐speed, secure, digital infrastructure
E i ll i i l i h h d Equip all instructional areas with necessary hardware infrastructure to facilitate learning initiatives
Historical Overview
2009‐2010 2010‐2011 2011‐2012
Secure wireless guest access and user authentication
Install NetAPP 8TB SAN storage solution
Launch of elementary TAC/HACand progress reports
Deploy new firewall and content filtering systems
Install redundant core systems for disaster recovery
Expanded SAN to 20TB (usable) and disaster recovery between Admin, RHS, and RMS
Move to RCN as Internet service provider
Install and deploy BigFixnetwork management solution
Microsoft agreement for All MS SW for students and staff usage.
Roll out employee access center, and new food service point of sale systems
Install data cabling and access points to increase wireless access at IES, RES, and WES
Installed new virtual Windows domain controller servers district‐wide
Began Infrastructure upgrades (replacement of core data switches)
Continue infrastructure data switch deployment and network data cabling upgrade planning
Installed new HP data switch infrastructure at RHS, IES, WES, and RES
Meet expanded PIMsrequirements
Begin implementation of information archiving
Testing of group policies for computer management
Migration from ClearTrack to SunGard IEPPLus
Replace failing computers in school and administrative offices
Testing push out of virtual desktops and virtual applications

12/13/2011
29
Informational Technology (includes general and technology funds)
Acct Description 2010‐2011 2011‐2012 2012‐2013
330 Professional Services 2,500 7,500 54,530
340 Technical Services 237 215 237 215 190 966340 Technical Services 237,215 237,215 190,966
432 Equipment Repair/Maint. 12,500 12,500 0
438 IT Equipment Repair/Maint. 67,898 67,898 91,807
580 Travel – Conference 2,845 5,050 10,015
581 Travel ‐Mileage 1,500 1,500 5,000
610 Supplies 33,177 21,322 9,733
618 Software License/Support 115,477 119,477 33,065
640 Books 1 000 1 000 1 635640 Books 1,000 1,000 1,635
757 Technology Equipment‐New 0 0 216,006
767 Technology Equipment‐Repl 0 0 46,910
810 Dues/Fees 700 1,200 1,200
Sub Total 474,812 474,662 630,867
% Change ‐0.03% 32.91%
Achievements
Significant infrastructure improvements of:• New core virtual domain controller severs in each building • Group policy deployment for managing users and computers
T ti h t f i t l li ti d d kt• Testing push out of virtual applications and desktops
Increased usable NetApp Storage Area Network (from 8 TB to 20 TB of usable redundant storage for disaster recovery)
Expanded disaster recovery for district core servers with off‐site fail over between Admin and RES
Completed installation of new network switch equipment in RHS, RES, IES, and WES. (currently working on Admin building)
Access to all Microsoft software desktop and server software for pdistrict student and staff use
Expanded hosted management software via SunGard for elementary TAC/HAC and progress reporting
Continued system and data refinement for compliance with additional PIMS requirements

12/13/2011
30
Human Resources
Staff Comparison by Employee Group2009‐2012
Employee group 2009‐2010 2010‐2011 2011‐2012 % Change
Administrators 29 27 27 0%
Teachers 327.55 306.1 309.5 1%Clerical/Para‐educators 146 130 134 3%
Maintenance 20 19 19 0%
Custodians 32 32 32 0%
Transportation 66 64 64 0%
Security 13 (part time) 13 (part time) 13 (part time) 0%

12/13/2011
31
Human Resources Highlights
2009‐2010 2010‐2011 2011‐2012
Successfully negotiated new collective
Successfully negotiated new collective bargaining
Currently negotiating the new collective bargaining
bargaining agreement with custodians and cafeteria workers unions
agreement with maintenance workers union
agreements for bothRESPA and RSEA
Launched new human resources Web site page from district Web site
Established annual HMS(employee assistance program) visits to every district site
Successfully filled all professional and support staff vacancies for the start of the 2011‐2012 school year
Implemented employee exit interview protocols
Absorbed workers’ compensation responsibilities
Implemented modified hiring process timeline for 2012‐2013 vacancies
Historical Overview of Class Size
In 1990, class size recommendations were established cooperatively with RTSD and RTEA
K‐3: Preferably under 20; no higher than 21
4‐5: Reasonable avg. of 22; no higher than 24
6‐8: Reasonable avg. of 22; no higher than 25
9‐12: Min of 15; avg. 22; no higher than 28
12/13/2011
32
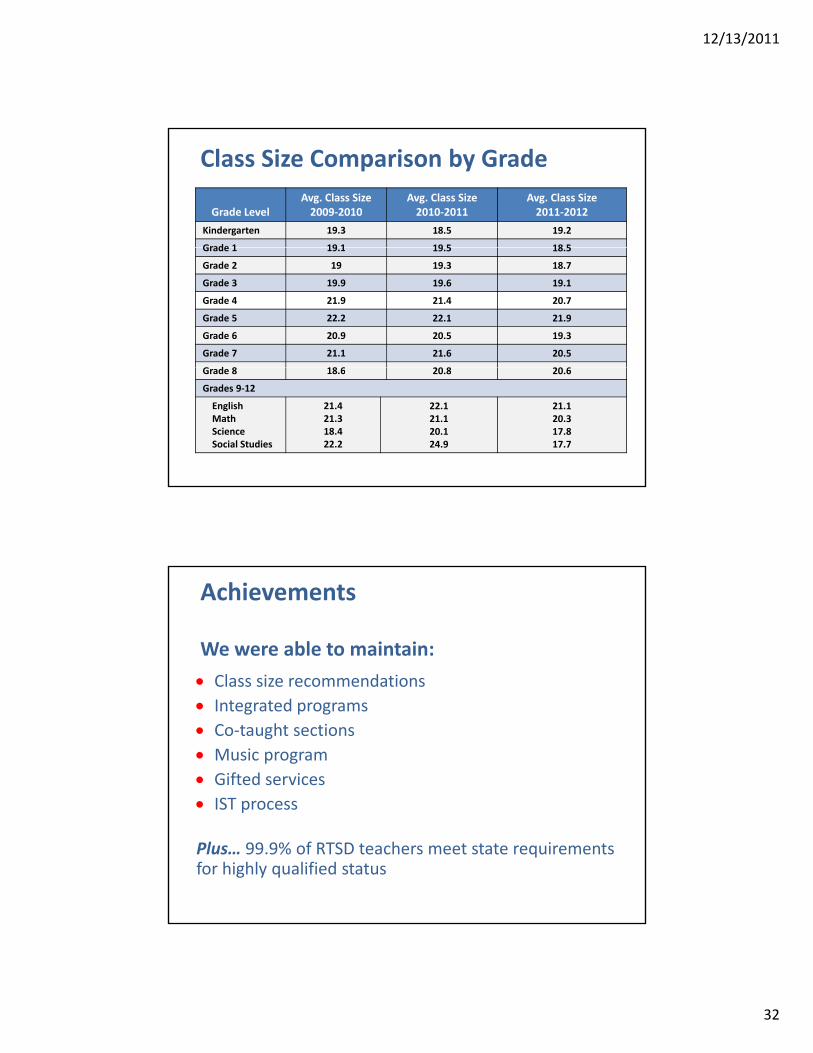
Class Size Comparison by Grade
Grade LevelAvg. Class Size 2009‐2010
Avg. Class Size 2010‐2011
Avg. Class Size 2011‐2012
Kindergarten 19.3 18.5 19.2
Grade 1 19 1 19 5 18 5Grade 1 19.1 19.5 18.5
Grade 2 19 19.3 18.7
Grade 3 19.9 19.6 19.1
Grade 4 21.9 21.4 20.7
Grade 5 22.2 22.1 21.9
Grade 6 20.9 20.5 19.3
Grade 7 21.1 21.6 20.5
G d 8 18 6 20 8 20 6Grade 8 18.6 20.8 20.6
Grades 9‐12
EnglishMathScienceSocial Studies
21.421.318.422.2
22.121.120.124.9
21.120.317.817.7
Achievements
Class size recommendations
We were able to maintain:
Class size recommendations
Integrated programs
Co‐taught sections
Music program
Gifted services
IST process IST process
Plus… 99.9% of RTSD teachers meet state requirements for highly qualified status

12/13/2011
33
Human Resources
Acct. Description 2010‐2011 2011‐2012 2012‐2013
330 Contracted Prof Services 0 21,500 12,000
340 Technical Services 14,700 12,000 6,000
432 Equipment Rpr/Maint 400 2,030 15,500
530 Postage 0 0 0
540 Advertising 2,135 9,750 8,000
550 Printing 415 1,500 1,500
580 Travel/Conference 792 1,339 1,250
581 Mileage 267 500 500
610 Supplies 11 630 3 907 8 000610 Supplies 11,630 3,907 8,000
640 Books 1,175 1,000 1,000
751 Equipment‐New 0 0 0
810 Dues/Fees 2,365 2,000 2,000
Total 33,879 54,626 55,750
% Change 61.24% 2.06%
Communications

12/13/2011
34
Goals 2012‐2013
G l 1 Goal 1To communicate effectively with the public
Goal 2 To communicate effectively with the school board
ObjectivesTo integrate district communications across multiple platforms for the optimal engagement of internal and external stakeholders.
Increase engagement of external media for district coverage
Improve website usability and layout
Develop protocols for district coverage of school events
Facilitate balanced coverage of schools to build sense of community among all district stakeholders
Utilize social/new media to modernize communications
Bolster media monitoring to ensure constant awareness of issues Bolster media monitoring to ensure constant awareness of issues affecting district
Engage and empower internal and external stakeholders to aid in coverage of school events
Regularly evaluate communication plan and progress

12/13/2011
35
Recent Overview
Date Accomplishment
Ongoing Website improvements, redesign
Ongoing Develop and maintain communications with stakeholders about pressing district issues
Ongoing Integrate all media for optimal engagement of stakeholders
Ongoing Investigate, implement social/new media (Twitter, YouTube, podcasts)
2011 Online streaming of board meetings
2011 Redesigning eMinders format and streamlining production
2011 Providing easier access to board and other materials2011 Providing easier access to board and other materials
2011 Bolstering Photo Gallery and Radnor Proud webpages
2011 Placing district stories in local and regional news outlets
2011 Growing relationships with local and regional news reporters
2011 Involving district students, parents in coverage of district events
Achievements
Website – Revamped with enhanced graphics; robust, timely and diverse content; and URL integration that increases usability and appeal. Alterations provide improved resource for parents, staff and the community.
eMinders – Redesigned for clarity and navigability.
Media Relations – Continued media outreach to obtain coverage for district and school activities and achievements. Increased exposure equates to increased credibility for the district and schools.
Enhanced Photo Gallery – Provides visual evidence of quality of schools.
Enhanced Radnor Proud webpage – Easier navigability and streamlined format improve ability to learn about district and student accomplishments.
Event Coverage – Involvement of students and parents in event coverage leads to more vested stakeholders and diverse viewpoints.
Communications Committee – Resumed Communications Committee.
Community Bulletin Board – Connects non‐school related organizations to our schools; maintains and establishes mutually beneficial relationships.

12/13/2011
36
2012‐2013 Budget
Stakeholder Takeaways
The increase in real‐estate assessed values impacts tax levy by $421,012
Overall federal and state subsides are declining; Overall federal and state subsides are declining; mandates are increasing
Community engagement and participation are critical in order to ensure the long‐term educational and financial success of our school district
Beyond 2012‐2013, there will be pressure on di t i t t id tif t ffi i i th tour district to identify even greater efficiencies that
offset the costs of state pension increases, facility upgrades, and possible further declines in property values
72

12/13/2011
37
Ten‐Year History of Tax and Expenditure Budget Increases
Year Tax Increase Budget Increase
2001‐2002 4.6% 6.3%
2002‐2003 5.0% 7.0%
2003‐2004 5.3% 5.3%
2004‐2005 4.8% 5.1%
2005‐2006 4.9% 7.1%
2006‐2007 5.8% 6.8%
2007‐2008 5.0% 6.4%
2008‐2009 7.0% 3.5%
2009‐2010 3.9% 3.5%
2010‐2011 2.9% 1.9%
2011‐2012 1.4% 0.9%
73
1600000
1800000
History of District Interest Earnings
600000
800000
1000000
1200000
1400000
74
0
200000
400000
2005‐06 2006‐07 2007‐08 2008‐09 2009‐10 2010‐11 �2011‐12 Budget �2012‐13 Budget
12/13/2011
38
8000000
9000000
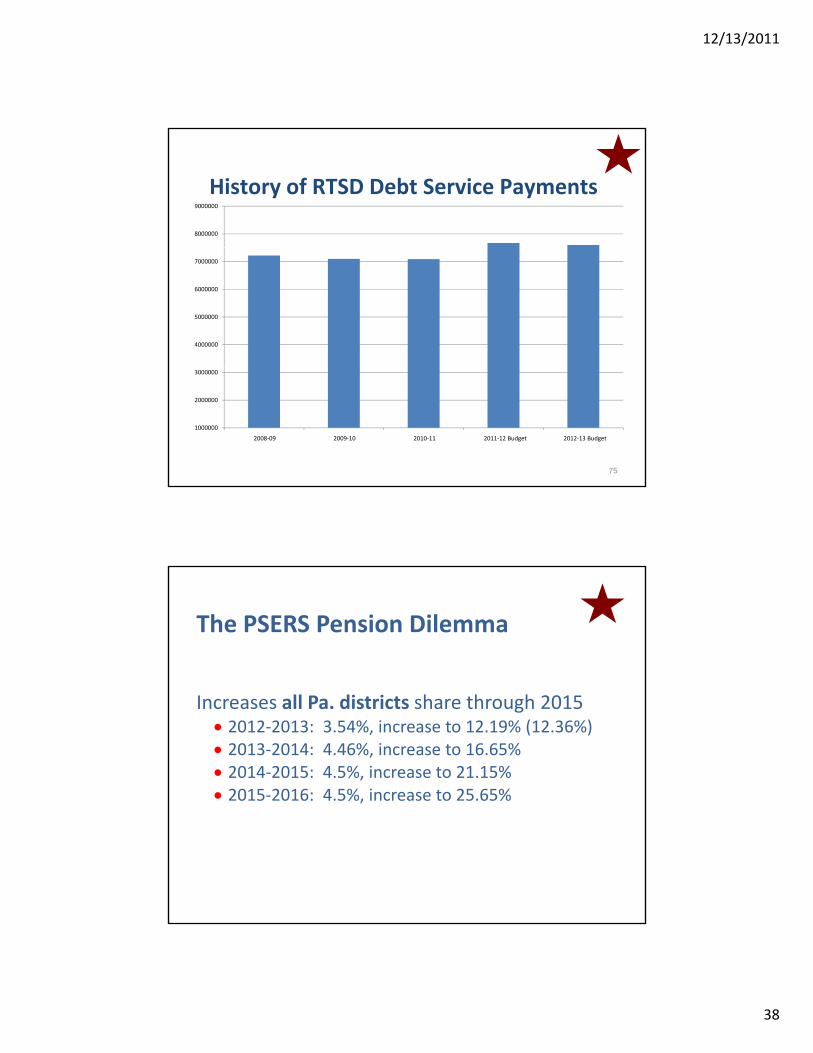
History of RTSD Debt Service Payments
4000000
5000000
6000000
7000000
75
1000000
2000000
3000000
2008‐09 2009‐10 �2010‐11 �2011‐12 Budget �2012‐13 Budget
The PSERS Pension Dilemma
Increases all Pa. districts share through 2015 2012‐2013: 3.54%, increase to 12.19% (12.36%) 2013‐2014: 4.46%, increase to 16.65% 2014‐2015: 4.5%, increase to 21.15% 2015‐2016: 4.5%, increase to 25.65%

12/13/2011
39
Radnor’s PSERS Pension Dilemma
Increases for Radnor through 2016 2012‐2013: 12.19% = $1,257,664* 2013‐2014: 16.65% = $1,820,469 2014‐2015: 21.15% = $1,922,833 2015‐2016: 28.65% = $2,015,047
Districts must budget 100% of the expenditure and receive 50% back as revenue annually
*Increase to 12.36% adds $63,500
Five‐Year Budget Projection

12/13/2011
40
Five Year Budget Projection
Assumptions‐Revenues
Real Estate Revenues Increase each year assuming a 1 7% Real Estate Revenues Increase each year assuming a 1.7% increase in the Act 1 Index
Remaining local, state and federal revenues remain constant from 2013‐14 through 16‐17
Anticipated current revenues for the year are subtotaled in the projection before any use of fund balance is factored in
Use of fund balance for 13‐14 and beyond is based on the assumption that a contribution of $615,000 per year will be made toward non‐recurring capital projects and 25% of the annual increase in the retirement contribution will come from the Retirement Escrow Fund
Five Year Budget Projection
Assumptions‐Expenditures
Salaries will increase 2 5% each year Salaries will increase 2.5% each year
Medical benefits will increase at 10% per year. All other benefits, with the exception of retirement, will increase at 2.5% per year
Retirement rate will increase per 2010 legislation through 2015 16 Assumption was made that thethrough 2015‐16. Assumption was made that the rate will level off at the 2015‐16 percentage of 25.65% for 2016‐17

12/13/2011
41
Five Year Budget Projection
Assumptions‐Expenditures (cont) Expenses associated with contracted and purchased
i b k li d tiliti i t dservices; book, supplies and utilities; equipment; and dues and fees will increase at 2.5% each year
Debt service will remain level through 2016‐17 per the exact amounts shown
Transfer to other funds assumes an annual i i h C i l F d f $300 000appropriation to the Curriculum Fund of $300,000,
,and fluctuating amounts for capital reserve and technology funds per the five year plans through 2016‐17
Instructional Technology5 Year ProjectionsAcct Instructional 2011‐12 2012‐13 2013‐14 2014‐15 2015‐16 2016‐17
330 Professional Services 64,500 107,600 109,214 110,852 111,961 111,961
340 Technical Services 3,250 1,000 2,200 2,200 2,200 2,200
438 Repair/Maintenance 70,000 213,241 175,000 155,000 155,000 155,000
580 Travel ‐ Conference 3,346 3,536 3,536 3,536 3,536 3,536
581 Travel ‐Mileage 250 250 250 250 250 250
610 Supplies 27,940 30,238 31,000 28,500 28,500 28,500
618 Software 150,680 25,000 25,000 20,000 20,000 20,000640 Books 750 436 436 436 436 436757 Tech Equip ‐ new 483,717 732,779 600,200 595,200 595,200 595,200
767 Tech Equip ‐ repl 1,042,885 646,237 375,800 375,800 375,800
810 Dues and Fees 300 350 350 350 350 350Total $804,733 2,157,315 1,457,437 1,292,124 1,293,233 1,293,233
*** Does not include Technology Fund replacements of $722,651
12/13/2011
42
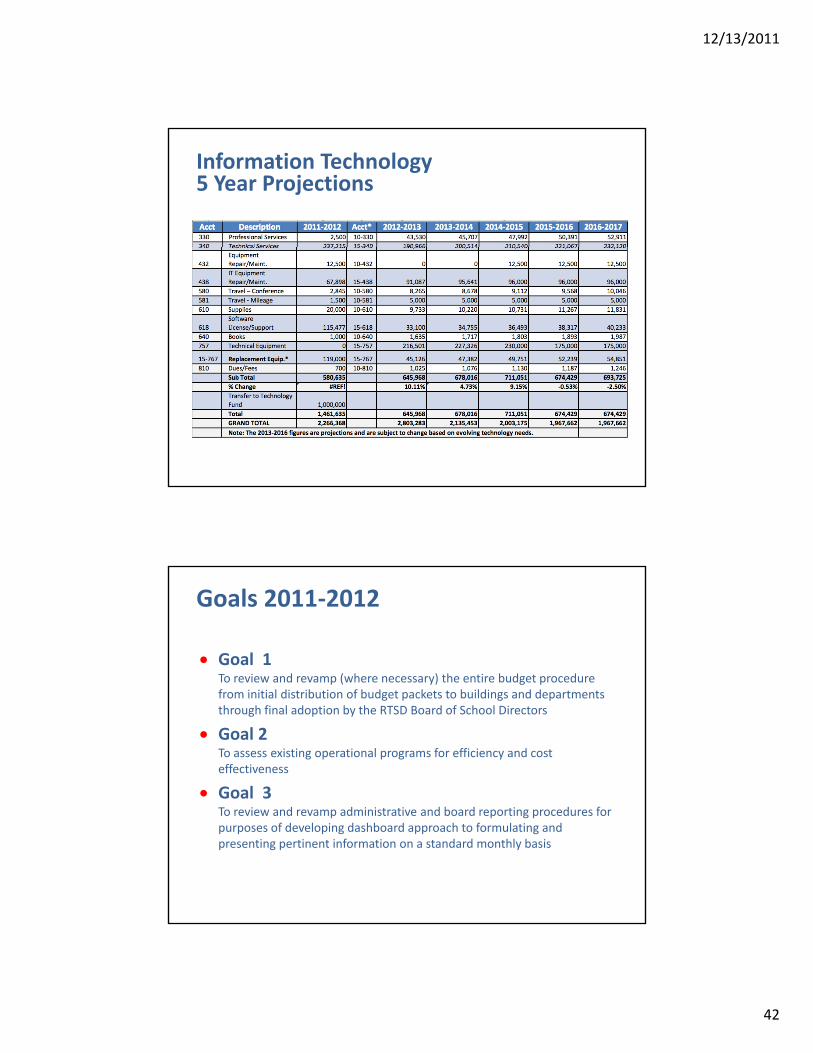
Information Technology5 Year Projections
Goals 2011‐2012
Goal 1To review and revamp (where necessary) the entire budget procedure from initial distribution of budget packets to buildings and departments through final adoption by the RTSD Board of School Directors
Goal 2 To assess existing operational programs for efficiency and cost effectiveness
Goal 3To review and revamp administrative and board reporting procedures for purposes of developing dashboard approach to formulating and presenting pertinent information on a standard monthly basis
12/13/2011
43
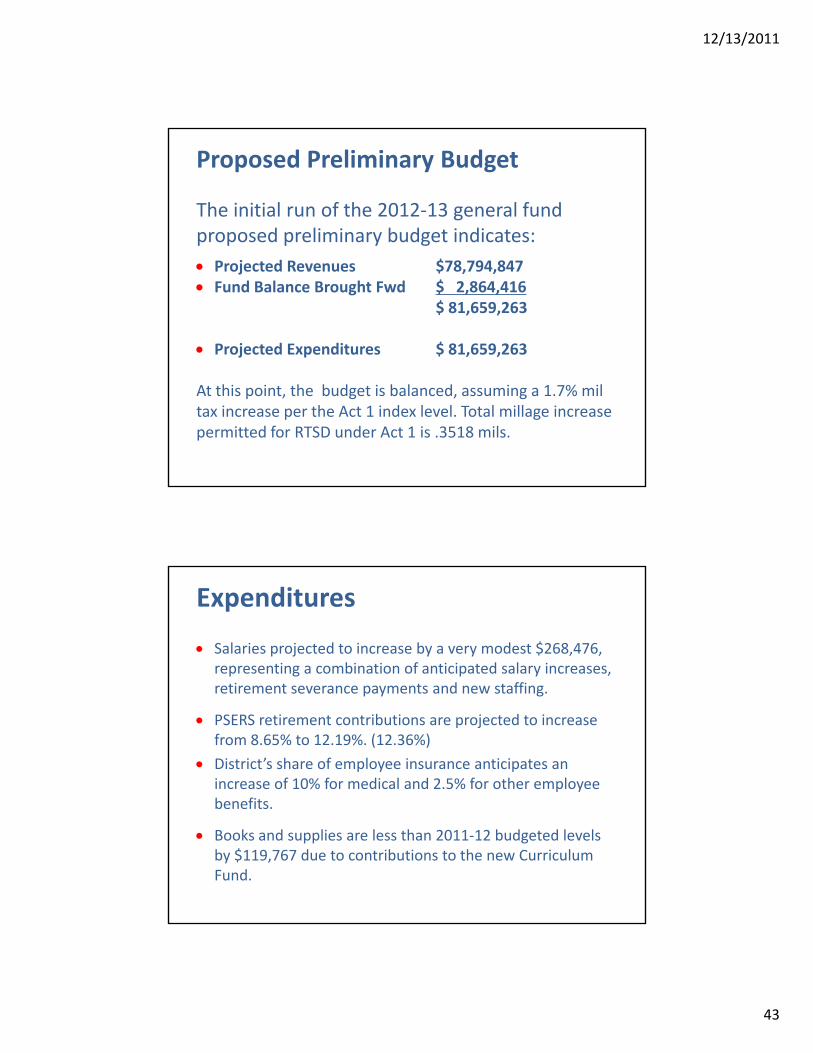
Proposed Preliminary Budget
The initial run of the 2012‐13 general fund proposed preliminary budget indicates:
Projected Revenues $78,794,847 Fund Balance Brought Fwd $ 2,864,416
$ 81,659,263
Projected Expenditures $ 81,659,263
At this point, the budget is balanced, assuming a 1.7% mil tax increase per the Act 1 index level. Total millage increase permitted for RTSD under Act 1 is .3518 mils.
Expenditures
Salaries projected to increase by a very modest $268,476, representing a combination of anticipated salary increases, ti t t d t ffiretirement severance payments and new staffing.
PSERS retirement contributions are projected to increase from 8.65% to 12.19%. (12.36%)
District’s share of employee insurance anticipates an increase of 10% for medical and 2.5% for other employee benefitsbenefits.
Books and supplies are less than 2011‐12 budgeted levels by $119,767 due to contributions to the new Curriculum Fund.

12/13/2011
44
Expenditures
Operations and transportation utility and fuel requests are budgeted to increase by just $64,636.
Fund transfers of $4,526,498: Capital requests represent a combination of fund balance ($1,000,000) and the 2012‐13 operating budget ($557,800)
The request for technology funding was set at $2.706 million and contribution to the new curriculum fund is $262,566
Use of fund balance for a portion of the capital reserve and technology transfers is in compliance with GAAP (Generally Accepted Accounting Principles) based on the fact that they represent non‐recurring expenses
Expenditures
Debt service obligations fall slightly below 2011‐12 budgeted levels by $72,809, largely due to the refinancing and defeasance of existing debt in December 2011.
Expenditures for DCIU programs are increasing by $378,997 in recognition of the gross costs of the program. Traditional offsets from reimbursement from other districts for payments made on their behalf are now being budgeted on the revenue side.
Overall 2012‐2013 expenses are increasing by $4,964,1419 (6.47%) over the existing 2011‐2012 budget due largely to initiatives and capital expenditures rather than general operating expenses.

12/13/2011
45
�S l i
�Other Purchased Svcs.3677762
5%
�Supplies1925300
2%
Equipment1537160%
Dues/Fees4937071
6%
�Debt Svc/Transfers7581977
9%
2012‐13 Expenditures by Object
�Salaries39255364
48%
�Purchased Professional Svcs.4670379
6%
�Maintenance Svcs.2393971
3%
�Benefits17063723
21%
�Salaries
�Benefits
�Purchased Professional Svcs.�Maintenance Svcs.
�Other Purchased Svcs.
�Supplies
12/13/2011
46
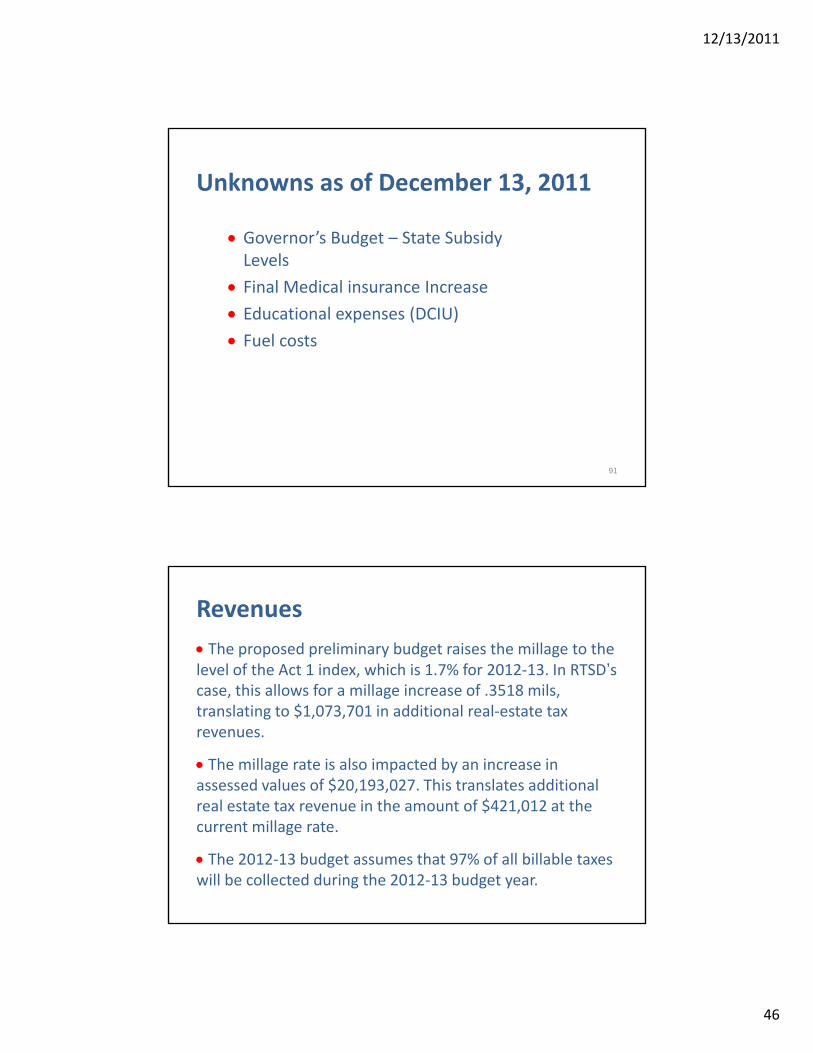
Governor’s Budget – State Subsidy
Unknowns as of December 13, 2011
Levels
Final Medical insurance Increase
Educational expenses (DCIU)
Fuel costs
91
Revenues
The proposed preliminary budget raises the millage to the level of the Act 1 index, which is 1.7% for 2012‐13. In RTSD’s
hi ll f ill i f 3518 ilcase, this allows for a millage increase of .3518 mils, translating to $1,073,701 in additional real‐estate tax revenues.
The millage rate is also impacted by an increase in assessed values of $20,193,027. This translates additional real estate tax revenue in the amount of $421 012 at thereal estate tax revenue in the amount of $421,012 at the current millage rate.
The 2012‐13 budget assumes that 97% of all billable taxes will be collected during the 2012‐13 budget year.

12/13/2011
47
Revenues
Budgeted revenues for 2012‐13 were changed to better reflect the decrease in receipt levels due to the economic downturn we have experienced over the past several years.
Thi ill b i it d l t i th th f llThis will be revisited later in the year as the full picture of the impact becomes fully known.
Revenues
State subsidy revenue was estimated in the absence of the governor’s proposed budget, which will not be released
il F buntil February.
As a result the proposed preliminary budget assumes that state subsidy levels will remain at 2011‐12 levels based on early press releases from Commonwealth sources
State subsidy projections are very conservative and will be y p j yadjusted once the governor announces his budget proposals in February 2012. Unfortunately, this is AFTER the Board is required to adopt a proposed preliminary budget. That deadline is January 25, 2012.

12/13/2011
48
� State Sources, 8024166, 10%
� Federal Sources, 649186, 1%
� Other Sources, 2864416, 3%
2012‐13 Revenue Sources
� Local Sources
� State Sources
� Federal Sources
� Other Sources
� Local Sources, 70121495, 86%
($65,605,318 of which is real estate
RecapRealities of the 2012‐2013 Budget
The Act I index is 1.7%, which will yield e c de s %, c y e dapproximately $1.073 million in additional revenue
The decline in state and national economies has resulted in unprecedented reductions to public education funding and is expected to continue under the Corbett administration
Expenses are increasing at a rate that exceeds declining revenues
96

12/13/2011
49
Budget to Level of Index Scenario 1
2011‐2012 2012‐2013 Prop. Prelim. Budget
Budget = $76 695 122 Budget = $81 659 263 Budget = $76,695,122
Value of a mil = $3,032,435
No. mils in place = 21.1439
Tax increase = 1.4%
Expenditure increase = 0.69% over prior year 10‐11
Budget $81,659,263
Value of a mil = $3,002,057
No. mils in place = 21.4957
Tax increase = 1.7%
Expenditure increase = 6.47%
Budget gap = $0.00 with the recommended use of $2.864 million in fund balance
97
Not in the 1.7% Index Budget
Basics Initiatives
No contingency dollars for watch positions in the event enrollment results in the need for additional staffing
Curriculum Review – in preparation for Keystone
(
Communication initiatives
Full day Kindergarten
Data initiatives
New teacher evaluation system
Exams (Comp, Literature, Biology)
Professional Development beyond the basics

12/13/2011
50
Exceptions A school district that adopts a preliminary budget with real‐
estate taxes that exceed its index may seek approval for referendum exceptions to increase tax rates by more than its adjusted index.adjusted index.
2011 amendments to Act 1 reduces the number of potential 10 exceptions from 10 to 3: three must be approved by the Pa. Dept. of Education by February 29, 2012.
For the 2012‐2013 budget, Radnor it appears that may be eligible for exceptions in the areas of:
Retirement contributions ($601,499)
Special Education ($557,805)
Maintenance of local revenue or actual instruction expense ($1,331,323)
Estimated total: $1,159,304
99
Budget to Level of Index + ExceptionsScenario 2
2011‐2012 2012‐2013 plus exceptions
Budget = $76,695,122 Budget = $82,659,263Budget $76,695,122
Value of a mil = $3,032,435
No. mils in place = 21.1439
Tax increase = 1.4%
Expenditure increase = 0.69% over prior year 10‐11
Value of a mil = $3,002,057
No. mils in place = 21.8288
Provides for an estimated$1,000,000 in additional real‐estate tax revenues if approved(for shortfalls in state revenues resulting in the governor’s g gproposed budget and/or additional initiatives & contingencies)
Budget gap = $0.00 with the recommended use of $2.864 million in fund balance
100

12/13/2011
51
Budget with 0% Tax Increase Scenario 3
2011‐2012 2012‐2013 Proposed Prelim. Budget
B d $76 695 122 B d $80 585 562 Budget = $76,695,122
Value of a mil = $3,032,435
No. mils in place = 21.1439
Tax increase = 1.4%
Expenditure increase = 0.69% over prior year 10‐11
Budget = $80,585,562
Value of a mil = $3,002,057
No. mils in place = 21.1439
Tax increase = 0%
Budget gap = $1,073,701 with the recommended use0.69% over prior year 10 11 with the recommended use of $2.864 million in fund balance
Summary
Tax IncreaseScenario 1
1.7%Scenario 2
1.7% + ExceptionsScenario 3
0%
Expense Budget $81,659,263 $82,659,263 $81,659,263Expense Budget $81,659,263 $82,659,263 $81,659,263
Revenue Budget $81,659,263* $82,659,263†* $80,585,562*
Gap $0 $0 $1,073,701
*Includes the use of $2.864 million in fund balance for non‐recurring expenses
102
expenses
†Includes the addition of $1 million in Act 1 exceptions to contingency for potential shortfalls in state revenues and discretionary initiatives
12/13/2011
52
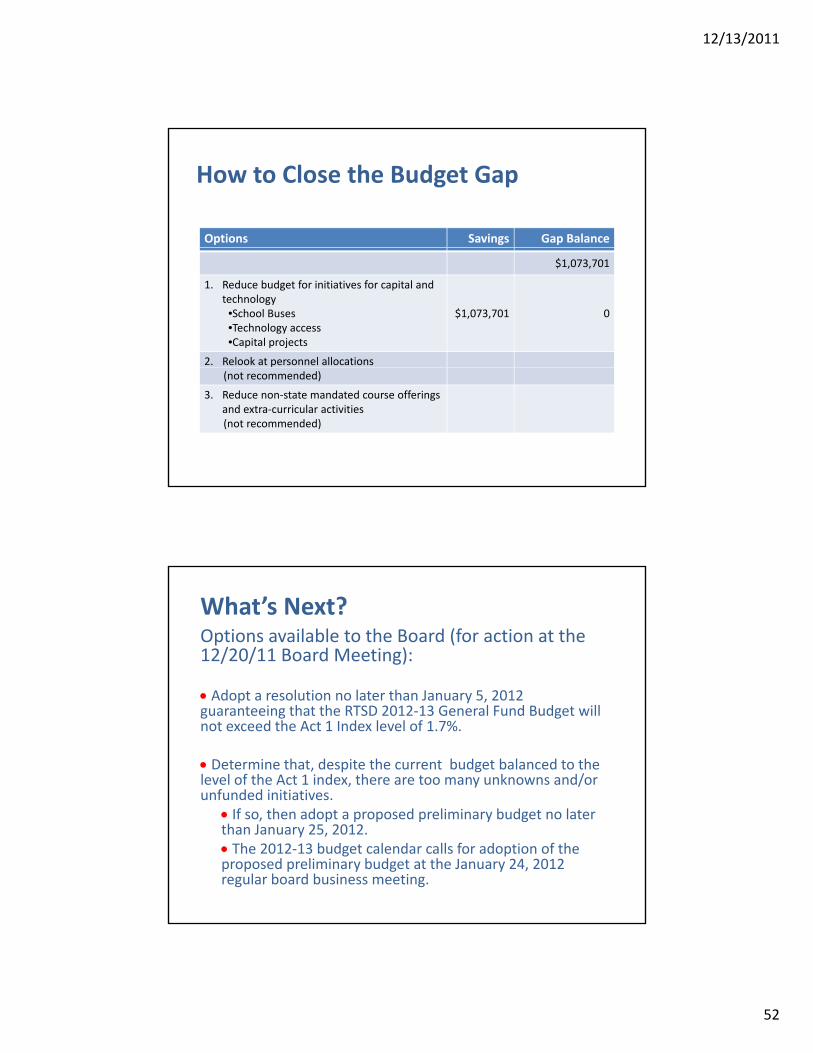
How to Close the Budget Gap
Options Savings Gap Balance
$1,073,701
1. Reduce budget for initiatives for capital and technology•School Buses•Technology access•Capital projects
$1,073,701 0
2. Relook at personnel allocations (not recommended)
3. Reduce non‐state mandated course offerings and extra‐curricular activities(not recommended)
What’s Next?Options available to the Board (for action at the 12/20/11 Board Meeting):
Adopt a resolution no later than January 5, 2012 guaranteeing that the RTSD 2012‐13 General Fund Budget will not exceed the Act 1 Index level of 1.7%.
Determine that, despite the current budget balanced to the level of the Act 1 index, there are too many unknowns and/or unfunded initiatives.
If so, then adopt a proposed preliminary budget no later than January 25, 2012. The 2012‐13 budget calendar calls for adoption of the proposed preliminary budget at the January 24, 2012 regular board business meeting.


