Embed Size (px)
Citation preview

CHAPTER 10 – HEAVY-DUTY ENGINES & VEHICLES 10-1
As such, fuel economy tends to be a much larger concern for trucks than for passenger cars. In this sense, trucks are designed for application- specific uses to conduct a job as efficiently as pos-sible, with the lowest total cost of ownership. A single car is typically purchased for multiple needs, including commuting, hauling small loads, driving periodically on long trips, maneuvering through city streets, etc. Passenger cars are typically purchased based upon their interior passenger and cargo vol-ume. By contrast, trucks tend to be selected for a specific duty cycle, which tends to dominate their day-to-day activity. Truck applications are diverse, ranging from the well-known “18-wheeler” Class 8 line-haul truck, to dump trucks, delivery trucks, construction vehicles, buses, and a long list of niche applications. The majority of trucks are powered by diesel engines, which are both more efficient and longer lasting than gasoline engines.
The duty cycle diversity across different applica-tions requires that fuel efficiency be measured in a way that considers both the miles traveled per gal-lon and the work being done while traveling. One typical unit of measurement that considers this complexity is ton-miles per gallon. This is an impor-tant distinction when evaluating technologies for work trucks, especially line-haul trucks, and when comparing across vehicle types. For example, the 6 miles per gallon (mpg) fuel economy of a line-haul truck seems paltry compared to 40 mpg pas-senger vehicles. However, when the fuel consumed to move payload is considered, a new perspective emerges. Consider a large tractor-trailer carrying a 42,000-pound payload and achieving 6 mpg of fuel economy. This 6 mpg translates to 126 ton-miles per gallon. That is, a fleet of such vehicles could carry 126 tons of freight for one mile, using a single gallon of fuel. By contrast, a typical passenger car
INTRODUCTIONOverview
Although there are far fewer heavy-duty (HD) trucks than cars on the road, HD trucks are a significant factor in overall transportation-
energy consumption. HD trucks, defined as on-road vehicles in Class 3 through 8, consume over 20% of the fuel used in transportation in the United States.1 That share is expected to grow to almost 30% by 2050, based on extrapolations of the Energy Information Administration’s (EIA) Annual Energy Outlook 2010 (AEO2010). This chapter studies the energy consumption of HD trucks, and reviews a wide variety of technologies to increase fuel economy with a specific focus on liquid fuels. As such, it is a companion chapter to Chapter Nine, “Light-Duty Engines & Vehicles,” as well as Chapter Fourteen, “Natural Gas.”
There are many differences between light-duty (LD) vehicles (passenger cars) and HD vehicles, which requires that they be considered separately. An important difference between passenger cars and HD vehicles is the purchase decision. Passen-ger cars are purchased under many of the same considerations as consumer goods, whereas HD vehicles often are purchased as capital goods for the purpose of helping a company or government entity conduct business and/or perform a spe-cific, dedicated task. Because trucks are used in the context of a business operation, cost tradeoffs are considered explicitly in a purchase decision. Fuel costs are typically the second highest operat-ing cost for a trucking company, which provides competitive incentive to increase fuel economy.
1 AEO2010 Base Case.

10-2 ADVANCING TECHNoLoGY foR AmERICA’S TRANSPoRTATIoN fUTURE
Framework This chapter examines technologies that can
lead to improved GHG emissions, energy security, and economics related to on-highway HD vehicles. The chapter focuses on three areas, as shown in Figure 10-1.
y Engine technologies – technologies that improve the fuel economy of the vehicle’s engine
y Vehicle technologies – technologies that either reduce frictional energy losses, such as aerody-namic improvements, or emissions of the vehicle
y Vehicle operations – technologies that either reduce the demand to drive or improve the pro-ductivity of fleets.
Different technologies can have very different impacts across the application space. In order to appropriately address these differences, this chap-ter evaluates the technology impact separately across the following applications.
y Class 8 line-haul trucks
y Class 7&8 vocational trucks
y Buses
y Class 3-6 medium-duty (MD) trucks.
Figure 10-2 illustrates the sources of energy loss for a Class 8 truck and the effect of duty cycle on the balance of energy losses across the various catego-ries of loss.
As indicated by Figure 10-2, the greatest oppor-tunities to improve the energy efficiency of com-mercial vehicles will come from enhancements to the engine and exhaust system, rolling resistance of the tires, and aerodynamics of the vehicle. Technol-ogies such as combustion optimization, idling tech-nology, hybrids, advanced gasoline engines, waste heat recovery, and exhaust after-treatment will all be discussed as means to improve the fuel economy and GHG emissions of engines used in commer-cial vehicles. Although wide-base single tires and proper tire maintenance do not improve the energy efficiency of the vehicle as greatly as the engine technologies, they are less expensive than many engine-based technologies and more conducive to being retrofitted to the vehicle. Also, a selection of aerodynamically enhanced body fittings and the expected gains in fuel economy will be discussed
may carry 500 pounds of payload, in the form of passengers, luggage, etc. If such a passenger car obtains 40 mpg while carrying 500 pounds of pay-load, it has achieved only 10 ton-miles per gallon, or less than 10% of the fuel economy of the HD truck.
Because cars and trucks are built for different jobs, different fuel economy metrics are appropri-ate. Mpg is a common and accepted metric for the passenger car, and work-based ton-miles per gal-lon is the right metric for HD trucks. When trans-lated to greenhouse gas (GHG) regulation, the work-based metric becomes grams of CO2 per ton-mile. Although the ton-mile per gallon metric is not explicitly used in the AEO2010 report, it is used in this discussion and analysis.
ScopeThe focus of the Heavy-Duty Engines & Vehicles
Subgroup was to analyze HD vehicles using liquid fuels and summarize studies assessing the fuel economy benefits and costs for a range of future engine and vehicle technologies. Included were: a range of spark ignition and compression ignition engine technologies; alternative combustion tech-nologies; improved transmissions; vehicle enablers such as low rolling resistance tires, improved aerodynamics, and mass reduction; and a range of hybridization options. Also included was an inves-tigation of how alternative fuels, or changes in fuel properties, can improve vehicle efficiency and how alternative fuels impact driving range and refuel-ing time. This chapter focuses exclusively on HD trucks and buses—defined as Classes 3 through 8—and specifically on liquid fuels. Class 2b vehi-cles are addressed in Chapter Nine, “Light-Duty Engines & Vehicles.” The impact of improved truck fleet operations and driver behavior is also con-sidered, including technologies to improve overall system efficiency and reduce congestion. Finally, this chapter establishes a common vehicle base-line for evaluating vehicle technologies included in this study to ensure equitable treatment and evaluation of all the vehicle and propulsion system technologies.
Technologies that are out of scope because they are covered elsewhere in the study include engines operating on gaseous fuels (including liquefied natural gas), plug-in electric vehicles, fuel cells, and free-piston engines.

CHAPTER 10 – HEAVY-DUTY ENGINES & VEHICLES 10-3
Figure 10-1. Vehicles by Class/Segment
LARGE CAR
SMALL CAR
VEHICLES
PICKUP
SMALL SUV
LARGE SUV
LIGHT DUTY
HEAVY DUTY
MEDIUM DUTY
BUSES
CLASS 3-6
LONG-HAULTRUCKS
CLASS 7&8VOCATIONAL
ENGINETECHNOLOGY
VEHICLE TECHNOLOGY
VEHICLE OPERATIONS
N/A
N/A
N/A
N/A
N/A
N/A
N/A
N/A
N/A
N/A
N/A
N/A
N/A
N/A
N/A
PRIORITY AREA FOR TECHNOLOGY
FOCUS AREA OF DISCUSSION
Figure 10-2. Energy “Loss” Range of Vehicle Attributes for a Class 8 Truckas Impacted by Duty Cycle, on a Level Road
ENGINE LOSSESURBAN 58–60%INTERSTATE 58–59% AERODYNAMIC LOSSES
URBAN 4–10%INTERSTATE 15–22%
DRIVETRAINURBAN 5–6%INTERSTATE 2–4%
INERTIA/BRAKINGURBAN 15–20%INTERSTATE 0–2%
AUXILIARY LOADSURBAN 7–8%INTERSTATE 1–4%
ROLLING RESISTANCEURBAN 8–12%INTERSTATE 13–16%
Source: National Research Council of the National Academies, Technologies and Approaches to Reducing the Fuel Consumption of Medium- and Heavy-Duty Vehicles, 2010.
Figure 10-1. Vehicles by Class/Segment
Figure 10-2. Energy “Loss” Range of Vehicle Attributes for a Class 8 Truck as Impacted by Duty Cycle, on a Level Road

10-4 ADVANCING TECHNoLoGY foR AmERICA’S TRANSPoRTATIoN fUTURE
in the Vehicle Technologies section. Although the other sources of energy loss shown in Figure 10-2 do not offer the same level of benefit, they still rep-resent important areas where gains can be made in some duty cycles and will be discussed as well.
Industry Structure Before examining the various technology oppor-
tunities, this section will first review the structure of the industry from low tier suppliers through end users. The nuances of this structure will shed light on factors like economic replacement cycles and critical component availability. The following dis-tinct parts of the value chain are examined:
y Fleets/end users
y Vehicle original equipment manufacturers (OEMs)
y Engine manufacturers
y Component suppliers
y Aftermarket service providers.
Fleets/End Users
Different applications tend to have different end user structures. According to the Transportation Energy Data Book, trucks move over 8.7 billion tons of freight annually in the United States, accounting for more than two-thirds of national freight trans-port.2 There are over 8 million Class 3–8 trucks on the road, according to the American Trucking Association. A significant share of trucking com-panies are small businesses, with 96% operating fewer than 20 trucks and nearly 88% operating six trucks or less. Consequently, the trucking industry is a highly fragmented industry, resulting in intense competition and low profit margins.3
HD and MD trucks are used in every sector of our economy. It is estimated by the EIA that Class 3-6 trucks represent almost 4 million vehicles on the road today and, based on extrapolations of the AEO2010, will grow to over 11 million by 2050. Applications range from minibuses, step vans, and utility vans in Classes 2b and 3 to city delivery
2 Oak Ridge National Laboratory, Transportation Energy Data Book: Edition 29, June 2010. Prepared for U.S. Department of Energy, Office of Energy Efficiency and Renewable Energy.
3 American Trucking Association, American Trucking Trends 2009-2010, 2010.
trucks and buses in Classes 4, 5, and 6. These vehi-cles consume from as little as 1,000 gallons per year for some lighter, low-duty applications up to 7,000 gallons per year for some Class 6 applications. Class 3-6 trucks are used in the following applications: construction, agriculture, for hire, retail, leasing, wholesale, waste management, utilities, manufac-turing, food services, information services, and mining.
Class 7&8 trucks account for over 4.5 million units and, according to the EIA, are extrapolated to grow to over 7 million in 2050. Class 7 and Class 8a trucks include buses, dump trucks, trash trucks, and other hauling trucks. These trucks represent heavy working trucks consuming typi-cally 6,000–8,000 gallons of fuel per year for Class 7 and 10,000–13,000 gallons of fuel per year for Class 8a. Class 8b trucks are typically long-haul trucks weighing more than 33,000 pounds that have one or more trailers for flatbed, van, refrig-erated, and liquid bulk. Class 7 represents some 200,000 vehicles while Classes 8a and 8b consist of 430,000 and 1,720,000, respectively. These trucks consume typically 19,000–27,000 gallons of fuel per year and account for more than 50% of the total freight tonnage moved by trucks.
Figure 10-3 shows the number of Class 8 tractors owned by the nation’s largest fleets.
Vehicle OEMs
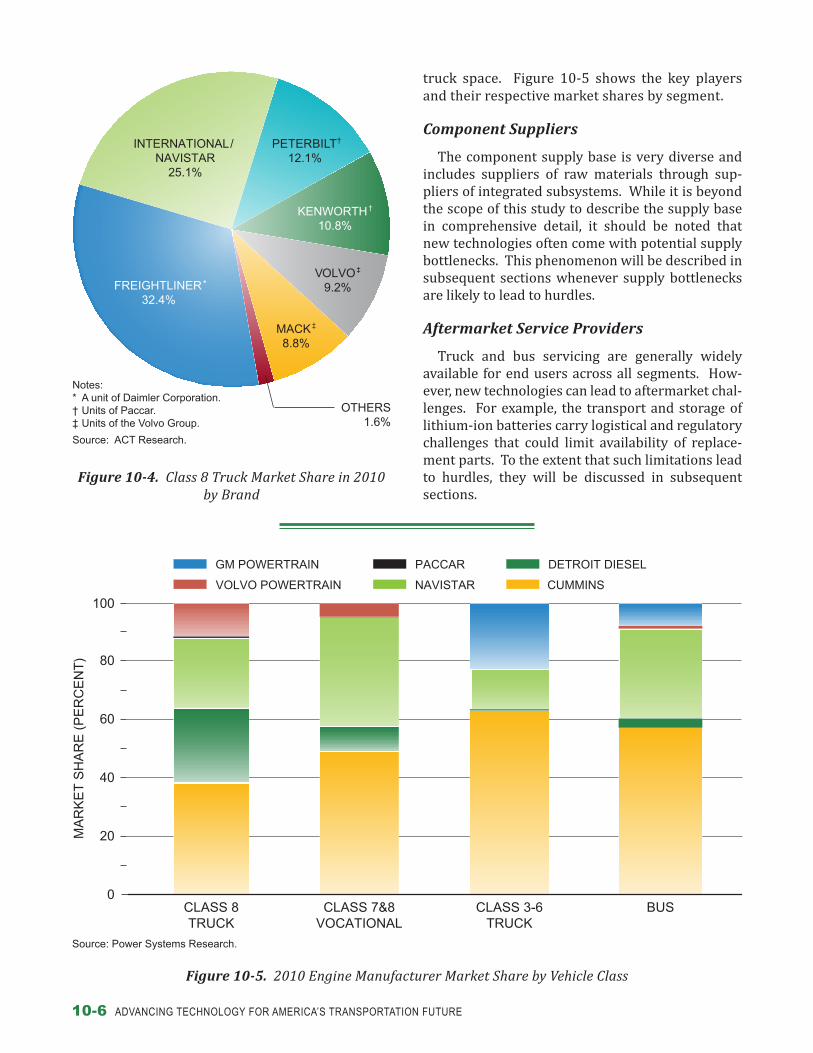
The vehicle OEM space is highly concen-trated in most segments. To illustrate, in Class 8 trucks, which includes both line-haul and heavy-vocational applications, the market is divided among six brands owned by four companies, as shown in Figure 10-4. Freightliner, International, Peterbilt, Kenworth, Volvo, and Mack control over 98% of the U.S. market for Class 8 trucks. Many of the same players compete in the Class 3-6 truck and bus markets.
Engine Manufacturers
Vehicle OEMs either develop their own engine platforms or source from independent engine manufacturers. All four segments are domi-nated by a small number of players with domi-nant market positions held by Cummins, Detroit Diesel, Navistar, and Volvo Powertrain, with GM Powertrain holding a key position in the Class 3-6

CHAPTER 10 – HEAVY-DUTY ENGINES & VEHICLES 10-5
5
10
15
TH
OU
SA
ND
S O
F C
LAS
S 8
TR
AC
TO
RS
20
25
AR
KA
NS
AS
BE
ST
CO
RP
.
CR
ST
INT
ER
NA
TIO
NA
L
SA
IA, I
NC
.
HA
LIB
UR
TO
N
AV
ER
ITT
EX
PR
ES
S
C.R
. EN
GLA
ND
KN
IGH
T T
RA
NS
PO
RT
AT
ION
GR
EA
TW
IDE
LO
GIS
TIC
S
PR
IME
INC
.
TR
AN
SF
OR
CE
US
FO
OD
SE
RV
ICE
CR
ET
E C
AR
RIE
R C
OR
P.
OLD
DO
MIN
ION
FR
EIG
HT
LIN
E
HE
AR
TLA
ND
EX
PR
ES
S
ES
TE
S E
XP
RE
SS
LIN
ES
UN
IGR
OU
P
WA
L-M
AR
T
WE
RN
ER
EN
TE
RP
RIS
ES
SY
SC
O
CO
CA
-CO
LA
LAN
DS
TA
R S
YS
TE
M
U.S
. XP
RE
SS
EN
TE
RP
RIS
ES
J.B
. HU
NT
TR
AN
SP
OR
T
PE
PS
ICO
SC
HN
EID
ER
NA
TIO
NA
L
CO
N-W
AY
UP
S
SW
IFT
TR
AN
SP
OR
TA
TIO
N
YR
C W
OR
LDW
IDE
FE
DE
X
CO
MP
AN
Y O
WN
ED
OR
LE
AS
ED
OW
NE
R-O
PE
RA
TO
R A
FF
ILIA
TE
OW
NE
D
Fig
ure
10-3
. N
umbe
r of
Hea
vy-D
uty
Tra
ctor
s O
wne
d by
the
Top
30 F
or-H
ire a
nd P
rivat
e F
leet
s
0
Sou
rce:
Tra
nspo
rt T
opic
s, 2
011.
Figu
re 1
0-3.
Num
ber o
f Cla
ss 8
Tra
ctor
s Ow
ned
by th
e To
p 30
For
-Hir
e an
d Pr
ivat
e Fl
eets
10-6 ADVANCING TECHNoLoGY foR AmERICA’S TRANSPoRTATIoN fUTURE
truck space. Figure 10-5 shows the key players and their respective market shares by segment.
Component Suppliers
The component supply base is very diverse and includes suppliers of raw materials through sup-pliers of integrated subsystems. While it is beyond the scope of this study to describe the supply base in comprehensive detail, it should be noted that new technologies often come with potential supply bottlenecks. This phenomenon will be described in subsequent sections whenever supply bottlenecks are likely to lead to hurdles.
Aftermarket Service Providers
Truck and bus servicing are generally widely available for end users across all segments. How-ever, new technologies can lead to aftermarket chal-lenges. For example, the transport and storage of lithium-ion batteries carry logistical and regulatory challenges that could limit availability of replace-ment parts. To the extent that such limitations lead to hurdles, they will be discussed in subsequent sections.
FREIGHTLINER*
32.4%
INTERNATIONAL/ NAVISTAR
25.1%
PETERBILT†
12.1%
KENWORTH†
10.8%
VOLVO‡
9.2%
MACK‡
8.8%
OTHERS1.6%
Figure 10-4. Class 8 Truck Market Share in 2010 by Brand
Notes: * A unit of Daimler Corporation.† Units of Paccar.‡ Units of the Volvo Group.
Source: ACT Research.
Figure 10-4. Class 8 Truck Market Share in 2010 by Brand
Figure 10-5. 2010 Engine Manufacturer Market Share by Vehicle Class
CLASS 8TRUCK
CLASS 7&8VOCATIONAL
CLASS 3-6TRUCK
BUS0
20
40
60
80
100
MA
RK
ET
SH
AR
E (
PE
RC
EN
T)
GM POWERTRAIN
VOLVO POWERTRAIN
PACCAR
NAVISTAR
DETROIT DIESEL
CUMMINS
Source: Power Systems Research.
Figure 10-5. 2010 Engine Manufacturer Market Share by Vehicle Class

CHAPTER 10 – HEAVY-DUTY ENGINES & VEHICLES 10-7
Trucking Industry RegulationsA variety of federal and state regulations impact
the fuel economy of the U.S. trucking fleet. Regu-latory issues for the industry have historically included highway safety and road surface durabil-ity issues, both of which are related to the allowable weight and equipment of heavy trucks. These regu-lations can have a substantial impact on fuel econ-omy. For example, today’s regulations are geared toward a standard gross vehicle weight rating (GVWR) of 80,000 pounds for an HD Class 8 tractor-trailer combination. A proposed shift to allow a standard 97,000 GVWR, and an associated shift to three-axle trailers, would improve fuel economy by 18%, according to industry analysis.4 The improve-ment comes not from increasing the fuel economy of a single truck, but by reducing the truck loads required to move the nation’s freight, i.e., improving ton-miles per gallon.
Other regulations that are germane to this indus-try regulate the quantity of emissions that can be emitted by trucks. Emissions limiting the so-called criteria emissions, including particulate matter and oxides of nitrogen, are well established and have been in force for many years. Other regula-tions likely to regulate CO2 emissions are under development as of the writing of this chapter. For the upcoming fuel economy standards as posed by the U.S. Environmental Protection Agency and now undergoing review, the unit of measure is defined as grams CO2 per ton-mile at the vehicle level, which is consistent with fuel efficiency measured as ton-miles per gallon.
ENGINE TECHNOLOGIESSeveral engine technologies have the potential
to contribute to reduced GHG emissions, increased energy security, and favorable economics. The fol-lowing are areas of focus for this study:
y Combustion optimization y Idling reduction y Hybrid technology y Advanced gasoline technologies
4 American Trucking Association, “Proposals for Reform of Federal Truck Size and Weight Regulations,” http://www.truckline.com/AdvIssues/HighwayInf_Fund/Size%20and%20Weight/Proposed%20Reforms%20to%20Federal%20Truck%20Size%20and%20Weight%20Limits.pdf.
y Emerging compression ignition technologies y Waste heat recovery technology y After-treatment technology.
This section examines each of these technologies in detail, describing their potential, associated costs, barriers to implementation, and potential enablers. The section concludes with a summary of these technology hurdles and their potential solutions.
Combustion Optimization Optimizing the combustion event can drive sig-
nificant improvement in fuel economy in many dif-ferent ways. Numerous technologies that increase the efficiency of the combustion event have already been deployed. Future technologies will continue these improvements.
The National Research Council (NRC) has identi-fied four major ways of optimizing the combustion event:
y Reduce heat transfer and exhaust losses. Higher injection pressure improves air-fuel mixing, and so enables lower air-fuel ratios and/or higher exhaust gas recirculation (EGR) rates (i.e., lower charge oxygen content in both cases). This in turn permits lower air-flow losses and combus-tion optimization for better efficiency and lower NOx and particulate levels. Industry norms for fuel injection pressure are 1,800–2,200 bar while cylinder pressures are 120–140 bar at the start of injection. Increasing fuel injection pressure up to 4,000 bar along with improvements in number of injections per cycle and rate shaping can improve fuel economy by 1–4%. Similar increases in cylin-der pressure can also yield a 1–4% fuel economy improvement. On-board diagnostics with associ-ated sensors and closed loop controls can com-plement these pressure increases yielding addi-tional benefits. In tandem, these mechanisms can lead to a 4–6% improvement in fuel economy at an incremental cost of $2,000 and $3,000 for 6–9 liter displacement engines and 9–11 liter displacement engines, respectively. While on-board diagnostics technology is scheduled to be mandated as of 2013, commercially available fuel systems peak at roughly 3,000 bar capability.
y Reduce gas exchange losses. Inefficiencies in the exchange of gases can lead to reduced fuel econ-omy. Several evolving technologies can lead to

10-8 ADVANCING TECHNoLoGY foR AmERICA’S TRANSPoRTATIoN fUTURE
(for example, to maintain air conditioning during hot weather) and convenience (for example, for a brief stop at a drop location). Multiple idle reduc-tion solutions exist today. Some of these stem from hybrid solutions and will be considered in the discussion on hybrid technology below. Oth-ers stem from auxiliary power units (APUs) and are discussed in the Vehicle Technologies section of this chapter. Additional solutions including auto-matic shut-down/start-up systems as well as fuel-operated or direct-fired heaters can generate fuel economy improvements of up to 3% at an incre-mental cost of about $3,000. These solutions are already commercially available.
Hybrid TechnologyHybrid power solutions provide a way to capture
energy that is typically lost in braking and other events as well as provide power to accessories not directly related to the powertrain, such as air con-ditioning. The latter of these can enable signifi-cant idle reduction (see section on idling reduction above). In some cases, hybrid solutions can also enable engine downsizing, which lead to indirect fuel economy improvements.
Hybrid technology is still evolving and has sev-eral manifestations. These different manifestations offer different value propositions that may appeal differently to different market segments based on duty cycles. They are summarized below:
y Hybrid hydraulic vehicle (HHV) vs. hybrid electric vehicle (HEV) systems. Hybrid systems can vary based on how energy is stored. HHV systems store energy by using brake energy to transfer hydraulic fluid from a low-pressure reservoir to a high-pressure accumulator. In contrast, HEV systems store brake energy electrically in a battery. HHVs have tremendous power capa-bility with more modest energy capability and are more suited for applications with frequent start/stops such as refuse trucks and some bus applications. HEVs, while also suitable for start/stop duty cycles, can also improve fuel economy through powering of auxiliary devices, thereby enabling engine shut-down. As such, HEVs are ideally suited for some bus and vocational appli-cations.
y Parallel systems vs. series systems. Hybrid sys-tems can also vary based on how the different
reduced gas exchange losses and therefore to improved fuel economy. Variable valve actuation, advanced low-temperature EGR, and improved intake boosting via turbocharging or supercharg-ing can lead to fuel economy improvements of 3–4% at an incremental cost in the range of $2,000. Variable valve actuation can enable advanced combustion strategies by controlling the intake and exhaust events in the optimal range, reduce in-cylinder pumping losses and assist with exhaust temperature control by using selective valve lift profiles. Supercharging can provide in-cylinder boost on demand for improv-ing vehicle performance while yielding similar exhaust emissions. These base technologies have all been developed and have been applied for select engine applications.
y Reduce parasitic and accessory loads. Reduc-ing the energy draw from accessory loads leads to improved fuel economy. Alternative power sources will be addressed in the Vehicle Tech-nologies section of this chapter. But incremen-tal improvements on traditionally powered accessories such as variable displacement pumps can yield fuel economy improvements as high as 2.5% for incremental costs in the range of $700.
y Reduce friction. Continued reduction of friction through improvements in lubricants and bear-ings can yield fuel economy improvements of up to 2% at incremental costs of around $500.
Combining this suite of technologies can yield fuel economy improvements of up to 12% across applications for combined incremental costs of $6,000 and $7,000 for MD and HD vehicles, respec-tively. All of these improvements can be realized through continued, incremental improvements on existing technologies; increasing fuel injection pressure to 4,000 bar is the most significant tech-nology hurdle.
Idling ReductionA study from the Oak Ridge National Laboratory
states that line-haul trucks typically spend more than 5% of their “engine on” time idling.5 The pur-pose of engine idling is typically for driver comfort
5 G. Capps et al., Heavy Truck Duty Cycle Project Final Report, Oak Ridge National Laboratory, 2008.

CHAPTER 10 – HEAVY-DUTY ENGINES & VEHICLES 10-9
Advanced Gasoline Technologies Relatively few commercial trucks are powered by
gasoline. Penetration of gasoline power in Class 3-6 trucks is in the range of 15 to 25%, with the rest of the MD fleet dominated by diesel power. Gasoline penetration above these classes is essentially zero.
Gasoline engines are generally less expensive than diesel engines, but they are also significantly less efficient and less durable. As soon as fuel costs and engine durability become a factor compared to first costs in the initial purchase decision, the buyer usually prefers diesel. To strike a better economic balance, gasoline engines can realize improved fuel economy through application of certain tech-nologies. For example, direct injection of gasoline can mitigate engine knock and enable significantly increased cylinder pressure. This increased cyl-inder pressure can increase power density and fuel economy. The addition of advanced intake boosting through turbocharging or supercharg-ing enables further increases in cylinder pressure which, in turn, enables engine downsizing. The NRC suggests that this combination of direct injec-tion, intake boosting, and engine downsizing can increase fuel economy by almost 15%. Adding additional technologies including variable valve actuation (variable lift, timing, duration, and/or cylinder deactivation) can increase fuel economy by an additional 5%.
Further efficiency improvements likely can be realized through continued improvement in engine knock limit and ignition systems. For example, injection of higher octane ethanol into the combus-tion chamber to mitigate engine knock may achieve parity with diesel fuel economy, corresponding to an increase of 25%. However, ethanol boost-ing requires an additional tank and ethanol fuel. And while gasoline turbocharged direct injection has been commercialized for many years, ethanol boosting remains in the laboratory.
Finally, reducing friction and parasitic and acces-sory loads can drive a further 3% improvement in fuel economy.
Emerging Compression Ignition Technologies
Additional work is being studied using more than one fuel on an engine. For example, in reactivity
components are configured and integrated. In parallel systems, both the energy storage device and the engine are connected to the transmission and both can provide energy to turn the wheels. In series systems, the energy storage system is the sole provider of energy to the wheels—the engine operates only to charge the energy stor-age device and cannot drive the vehicle mechani-cally. Each configuration offers unique benefits related to both fuel economy and general utility and the market preferences are still not clear.
The benefits of one type of hybrid system over another vary significantly by duty cycle. For exam-ple, in Class 8 line-haul applications, the NRC sug-gests that fuel economy improvements for HEV systems will be limited to single digit percentages; HHVs are not even entertained. In contrast, the expected fuel economy benefits for refuse trucks are 20% and 45% for parallel HEV and series HHV, respectively.
Hybrid systems are being developed and improved by many companies. Widespread com-mercial deployment of hybrid systems is limited primarily by cost. To illustrate, in the Class 3-6 Truck segment, estimated system costs range from $20,000 for a parallel HEV system to $50,000 for a series HHV system. With this cost hurdle, pro-jections for hybrid trucks remain low for several years at least.6 Part of the reason for this modest adoption is the fact that system producers find it difficult to reach manufacturing and develop-ment scale with current adoption rates, creating a “chicken-and-egg” scenario. Market research firm Global Insight suggests that while orders typically do not exceed 500–1,000 units, manufacturing scale is realized only when demand reaches 5,000–8,000 units per year. This “chicken-and-egg” sce-nario and absence of scale is further aggravated by the fact that different applications with different duty cycle demands tend to realize greater fuel economy benefit from different hybrid architec-tures. Further, energy storage (battery) technol-ogy is still evolving as the technology improves and industry migrates toward standards and con-tributes to prohibitively high costs. Finally, the high temperatures associated with power man-agement create challenges for the system’s power electronics.
6 See for example: SupplierBusiness, The Hybrid Commercial Vehicles Report, January 2010.

10-10 ADVANCING TECHNoLoGY foR AmERICA’S TRANSPoRTATIoN fUTURE
that proposed HD GHG and fuel economy regula-tions will lead to adoption of WHR for the line-haul sector in the next decade.
Additional benefits of WHR could be realized with the continued development of thermoelectric energy recovery. Advances in these technologies could lead to meaningful efficiency gains but carry enough risk that industry players will likely be hesitant to invest. Further advances in thermoelec-trics could lead to efficiency gains as high as 10% if coupled with improvements in vehicle heat rejec-tion capacity and improved working fluids with low global warming potential.
After-Treatment Technology After-treatment refers to any system or equip-
ment that exists “between the engine and the end of the tailpipe” that removes pollution. Many differ-ent versions of after-treatment exist and many have been commercially deployed for many years. For example, exhaust catalytic converters have been standard in passenger cars since the mid-1970s.
Over the past 20 years, regulations governing the emissions of certain “criteria” pollutants—oxides of nitrogen collectively known as “NOx,” unburned hydrocarbons, carbon monoxide, and particulate matter—have led to the widespread deployment of various after-treatment technolo-gies on diesel engines. These technologies have been deployed primarily to address criteria emis-sions rather than to realize a fuel economy benefit. In fact, heavy-truck fuel economy has declined over the last decade, as criteria pollutant controls have come into force. Looking forward, however, advanced control technologies for both diesel par-ticulate and NOx reduction can have a meaningful impact on fuel economy, both positively and nega-tively:
y Diesel particulate filters. DPFs remove particu-late matter from the engine exhaust. DPFs filter passively, but periodically require “regenera-tion” events in order to remove buildup of mat-ter that can restrict the flow of exhaust. These regeneration events can require temperatures that are achieved only through the release of fuel that causes a minor combustion (heating) event in the DPF. This adds to overall fuel consumption and can be a reliability concern if the tempera-tures are not carefully managed.
controlled compression ignition using gasoline and diesel on a single engine, gasoline is port injected while the diesel is used for the ignition source. Further, engines could use multiple fuels to enable engine technologies. Likewise, progress in other advance combustion strategies include homoge-neous charge compression ignition and premixed charge compression ignition.7
Waste Heat Recovery Technology A major thermal inefficiency is the loss of com-
bustion heat energy to the atmosphere as “waste heat,” which is not converted to useful work and exits the engine’s exhaust heat and through the engine cooling system. This inefficiency can be mitigated through various technologies known col-lectively as waste heat recovery (WHR). Once this waste heat is recovered, the resultant energy can be either used to power accessories or re-directed back to the powertrain, resulting in improved fuel economy.
WHR technologies exist in several forms, most of which are still under development. The simplest application is turbo compounding—either mechan-ical or electric—in which a turbine attached to the engine captures energy remaining in the exhaust. This technology has been available in the aviation and marine sectors for many years. Turbo com-pounding is being used on highway by a major manufacturer and is associated with a 5% fuel economy improvement, which is at the top of the 2.5–5% fuel economy improvement range identi-fied by the NRC.
More complex and sophisticated technologies including a thermodynamic bottoming cycle (steam cycle and organic Rankine cycle) could provide addi-tional fuel economy gains. Technologies involving these techniques are supported by Department of Energy funding and could yield fuel economy gains as high as 10%, according to the NRC. The incre-mental costs of these technologies are expected to range from $7,000 to $15,000 per vehicle and, as such, are expected to be commercially viable only for high fuel-consuming applications or in an aggressive GHG regulation scenario. It is expected
7 An in-depth exploration of these concepts and their working principles is contained in Topic Paper #6, “Low Temperature Combustion – A Thermodynamic Pathway to High Efficiency Engines,” on the NPC website.

CHAPTER 10 – HEAVY-DUTY ENGINES & VEHICLES 10-11
y Oxygenated fuel components, including the gen-eral category of fatty acid methyl esters (FAME); e.g., soy biodiesel.
Diesel engines may be operated normally on FAME biodiesel blends up to B5 with little effect on engine performance and up to B20 in most cases. The only notable exception is an effect on engine controls if the biodiesel blends have less energy content per unit volume than conventional diesel fuel. This effect is most prevalent with oxygenated biodiesel blends like FAME. Lower energy content requires more fuel to be injected for a given engine power level and therefore reduces the maximum power of the engine in proportion to the reduced energy content per gallon. This has the addi-tional effect of altering emissions of criteria pol-lutants, particularly NOx emissions, which may be increased or decreased depending on vehicle duty cycle and on design of the engine emission control system. Other possible effects of oxygenated diesel fuels include interaction with the combustion event itself.8
Summary of Engine TechnologiesTables 10-1 and 10-2 summarize the fuel econ-
omy improvement potential of the various tech-nologies as well as their associated incremental costs. These tables exclude the effects associated with APUs (discussed in the Vehicle Technologies section). Some of the benefits associated with idle reduction, hybrid technology, and even waste heat recovery are mutually exclusive of the benefits associated with APUs.
While some technologies are mutually exclusive of each other and provide independent fuel econ-omy benefits, many technologies overlap. In some cases, two separate and distinct technologies may each target the same source of inefficiency. In such cases, the fuel economy gains do not add in a neat and linear fashion; rather, the gain from using two technologies will be less than the sum of each indi-vidually.
As an illustrative example, consider waste heat recovery. While this technology can improve fuel economy by up to 10% in line-haul vehicles, it does so by capturing heat wasted by the engine.
8 For a summary, see W. Ecerkle et al., Effects of Methly Ester Biodiesel Blends on NOx Emissions, 2008.
y NOx reduction catalysts. NOx reduction sys-tems, like Selective Catalytic Reduction (SCR) remove engine exhaust NOx by converting it to nitrogen and water. There are various forms of NOx reduction catalysts including SCR, Lean NOx Traps (LNTs or NOx Absorbers), and Lean NOx Catalysts (LNCs). SCR involves combin-ing exhaust gas with ammonia reductant in a catalyst to reduce NOx. LNT involves storing exhaust NOx on a catalyst and regenerating it using diesel hydrocarbons and a catalyst much like the three-way catalyst technology applied commonly to gasoline engines. Likewise, LNC involves combining exhaust gas with diesel hydrocarbons in a catalyst to reduce NOx. All NOx reduction technologies require another constituent to react with the exhaust gas in the catalyst to reduce NOx.
Each of these after-treatment technologies is focused on controlling pollutants other than CO2 and, in isolation, will not positively impact fuel economy. However, NOx reduction catalysts, by providing relief on the level of NOx emissions from combustion, enables greater flexibility in the management of the combustion event and can lead to fuel economy improvements as high as 6%. This technology has already been deployed quite broadly and engine and truck manufacturers are reporting fuel economy improvements as high as 5%. It is expected that further increases in NOx conversion efficiency can lead to further fuel econ-omy improvements of 1–3% with no increase in equipment costs. Similarly, improvements in the operation of the DPF can also lead to fuel economy improvements of 1–1.5% through reductions in back pressure and passive regeneration solutions with no increase in equipment costs.
Biodiesel has the advantage of being a “retrofit technology” that can be applied to all vehicles in the fleet without waiting for fleet turnover to bring new technology into broad use. Biodiesel fuels are typically blended with conventional diesel fuel up to 20% by volume (B20).
Biodiesel fuels generally fall into two categories:
y Hydrocarbon fuel components with molecular characteristics identical to or very similar to con-ventional diesel fuel components. These may be employed as ordinary hydrocarbon blendstocks in the normal diesel pool.

10-12 ADVANCING TECHNoLoGY foR AmERICA’S TRANSPoRTATIoN fUTURE
VEHICLE TECHNOLOGIES
This section describes technologies for improv-ing truck fuel economy that are associated with the vehicle rather than the engine. This section covers a diverse range of topics, including the following:
y Transmission and driveline
y Aerodynamics
However, some combustion optimization measures work by reducing engine waste heat. In this exam-ple, one would not expect to see the full best-case benefit of combustion optimization AND waste heat recovery, because both rely on a single underlying concept, which can only be exploited once. As a practical matter, the norm is for the net gain from combining technologies to be less than the sum of its parts.
Technology Levers
Truck Categories and Operational Impact on Fuel Economy – % Improvement
Class 8 Line-Haul
Class 7&8 Non-Line-Haul
Bus Class 4, 5, 6
Idling Technology 2–6% X X X
Combustion Optimization
4.5–12% 4.5–12% 4.5–12% 4.5–12%
Hybrids 6–9% 42–53% 27–42% 20–50%
Advance Gasoline Engines for Trucks
X X X 0–20.5%
Waste Heat Recovery 2.5–10% X X X
After-Treatment 3–6% 3–6% 3–6% 4–6%
Source: National Research Council of the National Academies, Technologies and Approaches to Reducing the Fuel Consumption of Medium- and Heavy-Duty Vehicles, 2010.
Table 10-1. Potential Fuel Economy Improvements for Different Engine Technologies by Application
Technology Levers
Truck Categories and Operational Impact on Fuel Economy – Incremental Cost
Class 8 Line-Haul
Class 7&8 Non-Line-Haul
Bus Class 4, 5, 6
Idling Technology $1k–$8k X X X
Combustion Optimization
$0–$7k $0–$7k $0–$7k $0–$6k
Hybrids $30k–$45k $18k–$50k $200k $18k–$52k
Advance Gasoline Engines for Trucks
X X X $0–$7k
Waste Heat Recovery $2k–$16k X X X
After-Treatment $9k–$10k $9k–$10k $9k–$10k $7k–$8k
Source: National Research Council of the National Academies, Technologies and Approaches to Reducing the Fuel Consumption of Medium- and Heavy-Duty Vehicles, 2010.
Table 10-2. Incremental Costs Associated with Engine Technologies

CHAPTER 10 – HEAVY-DUTY ENGINES & VEHICLES 10-13
y Rolling resistance and tires
y Vehicle weight reduction
y APUs and other secondary power.
This section will examine each technology in detail, describing the potential of the technology, associated costs, barriers to implementation, and potential enablers. The section will conclude with a summary of these technology hurdles and their potential solutions.
Transmission and DrivelineOverview
Truck transmissions and drivelines transfer power from the engine to the wheels. From an effi-ciency standpoint, the mechanical transfer of power is a relatively efficient process; typically well over 90% for the full transmission and driveline com-bined when direct-drive gears are engaged. Inef-ficiencies arise from a variety of sources, including parasitic losses from pumps and other accessories, viscous drag from transmission oil in gears and torque converters, and dissipation of energy by sliding friction in right-angle gears.
However, the driveline’s major impact on fuel economy comes from its optimization, or lack thereof, of the engine’s performance to the needs of the application. A well-selected driveline that suits the intended application has a major impact on vehicle fuel economy by keeping the engine in its most efficient operating range as it does its work. These items and others are discussed below, start-ing with a discussion of transmission types.
TransmissionsManual Transmission
The predominant transmission type in vehicle Class 7&8 is the manual transmission. Typical man-ual transmissions come in 10-speed, 13-speed, and 18-speed variants for Class 7&8 trucks, and 6-speed variants for smaller trucks. Manual transmissions have been in use for many decades, and are highly reliable, with typical warranties of 250,000 miles or more. They are also highly efficient, transmit-ting over 99% of input shaft work to output shaft work. Manual transmissions are the most economi-cal transmissions to purchase. Due to these advan-tages, they have traditionally been the workhorse
of the HD trucking fleet. Manual transmissions accounted for 82% of line-haul truck transmission sales in 2008.9
The main disadvantage of the manual transmis-sion is the interruption of torque to the wheels of the vehicle during gear shifts. These interrupts are similar in principle to the torque interrupts in a manual-transmission car; but in a truck the torque interrupt may last 3–5 seconds before full engine power is re-applied. In long-haul applications with relatively small changes in road incline, gear shifts are infrequent and this issue is minor. How-ever, for many applications such as urban driving, vocational use, bus, etc., torque interrupts require excessive driver effort, increase emissions, and can negatively impact fuel economy.
Although manual transmissions have a dominant market share in heavy trucks, there is a slow but steady shift away from manuals, and into other cat-egories of transmission as discussed below. Manual transmissions require driver skill and training. Mis-takes can cause increased wear and tear on a vehi-cle and significantly affect fuel economy. Automatic and automated transmissions, which require little or no driver training, largely avoid these issues. These transmissions allow a higher degree of con-trol over driveline optimization in use because they use re-programmed decision making and not driver discretion to determine gear selection.
Automatic Transmission with Torque Converter
Competing with the manual transmission, the automatic transmission (with torque converter) employs a very different architecture. Automatic transmissions typically use 5–7 speeds with a plan-etary arrangement. As their name implies, they shift automatically between gears, freeing drivers from the chore of shifting gears, avoiding torque interrupts, and reducing wear and tear on the driveline in some cases. For these reasons, auto-matic transmissions are preferred in a wide variety of stop-and-go applications, including many Class 3-6 vehicles and heavy vocational applications where torque interrupts are problematic. Accord-ing to the NRC, automatic transmissions enjoy approximately 70% market share in MD trucks and near 100% share in applications like school buses,
9 Data from Freightliner as provided to the National Research Council.

10-14 ADVANCING TECHNoLoGY foR AmERICA’S TRANSPoRTATIoN fUTURE
where drivers are not expected to manually shift their vehicles through stop-and-go cycles. In voca-tional HD segments, automatics accounted for 24% of sales in 2008. Automatic transmissions with torque converters are very rare in line-haul trucks.
The two major disadvantages of automatic trans-missions are lower efficiency and higher mainte-nance requirements. Because automatics employ a viscous-coupling in the torque converter, their overall efficiency is lower than 90% during stop-and-go driving. This has a negative impact on fuel economy, particularly where speeds are low and variable, and the torque converter is engaged with differing input and output speeds. In higher speed operation, many torque-converters engage a lock-up mode, where shaft speeds are fixed to each other, and efficiency approaches that of a manual transmission. Reliability of automated transmis-sions is excellent; however, they require regular fluid maintenance approximately once per year.
Automatic transmissions are also have higher initial cost than manual transmissions. For HD Class 8 applications, an automatic transmission carries a cost premium of around $15,000 per unit over a manual transmission.10 For an MD 6-speed transmission, the cost premium for an automatic is between $2,000 and $4,000.11
Automated Manual Transmission
A third class of transmission is the automated manual transmission (AMT). This design is based on the manual transmission architecture, but employs electronic control actuators to move between gears, essentially replacing the driver’s input with that of an on-board computer. Because the computer can optimize shifts for fuel economy, the fuel economy of an average AMT-equipped truck exceeds that of a manual-transmission truck by 5–10%.12
Automated manuals today do not allow for con-tinuous power while shifting gears; like manual transmissions, they are accompanied by power
10 TIAX, LLC, Assessment of Fuel Economy Technologies for Medium- and Heavy-Duty Vehicles, Final Report to the National Academy of Sciences, September 2009.
11 Estimates taken from various trade publications; see for example “Spec’ing Medium Duty Powertrains for Optimum Performance,” Work Truck Magazine Online, November 2011, http://www.worktruckonline.com/Article/Print/Story/2011/11/Spec-ing-Medium-Duty-Powertrains-for-Optimum-Performance.aspx.
12 Estimate taken from discussion with Eaton engineering staff.
interrupts during shifting. They also are somewhat less reliable, and more costly to purchase, than a manual transmission. However, due to their advan-tages, their market share has grown to 18% of HD vehicle sales in 2008, according to the NRC.
Emerging Transmission Technologies
Two novel transmission designs are under devel-opment, though not deployed in mass production. One is the dual-clutch transmission, which seeks the advantages of the AMT, while eliminating the torque-interrupts associated with the manual archi-tecture. The dual-clutch transmission uses a stag-gered approach to clutching, with gears 1, 3, 5, etc., mated to one clutch, and gears 2, 4, 6, etc., mated to a second clutch. Shifting is automated, relieving the driver of manual clutch-and-shift events. The dual-clutch transmission has been introduced in several LD vehicles, but is still in development for truck applications.
Another class of transmission is the continuously variable transmission (CVT), a fully automated design that maintains torque transmission across its ratio range. Engine speed and load variability are matched by continuous variation of the ratio. With these designs, vehicle speed is less dependent on engine speed thus reducing the operating range needed from the engine. The potential benefits are maintaining engine operation closer to its efficiency “sweet spot” across vehicle speeds and reducing engine emissions created from torque interruptions as well as limiting the need to vary engine speed to vary vehicle speed. CVTs have been introduced in several LD vehicles, but are still in development for truck applications. A CVT might be fundamentally less efficient than a dual-clutch transmission or AMT at a component level; however, as a system the reduced engine operating requirements could be more efficient depending on the vehicle duty cycle.
Driveline
A truck driveline is a relatively simple and effi-cient mechanism in its own right. From the trans-mission, a driveshaft connects to one or more drive axles, which in turn split the shaft power to drive both wheels. Various differentials may be employed depending on application. Generally the axle efficiency is approximately 95%. However, proper gearing in the drive axle is critical to vehi-cle fuel economy. The specification of gear ratios,

CHAPTER 10 – HEAVY-DUTY ENGINES & VEHICLES 10-15
be associated with system-level vehicle benefits, obtained by vehicle hybridization for example.
AerodynamicsAerodynamics Background
Long-haul, over-the-road trucks consume most trucking fuel in the United States. A typical tractor-trailer vehicle has an aerodynamic drag coefficient of around Cd = 0.60 to 0.65, compared to a typical automotive drag coefficient of around 0.30 to 0.35. When running at speed on a level road, between 15% and 22% of fuel energy is dissipated as aero-dynamic loss. A more aerodynamic vehicle could lower this aerodynamic loss, and thus improve fuel economy. However, the base unit of transport is the commonly recognized rectangular freight trailer, which is not optimized for aerodynamic performance. To improve aerodynamics, improve-ments can be applied to the tractor or the trailer individually; or preferably, improvements will optimize the tractor and trailer as a system for the greatest effect.
Speed is the most important factor when con-sidering aerodynamics and fuel economy. The energy expended by aerodynamics can be calcu-lated using engineering estimates of aerodynamic characteristics, as estimated by several sources including the NRC study. The result is shown in Figure 10-6, comparing the aerodynamic power loss to the power required to overcome tire-rolling resistance. A vehicle traveling at 65 miles per hour (mph) requires more than double the power to overcome aerodynamic losses than a vehicle trav-eling at 50 mph. An important corollary is that lower speed vehicles are not substantially affected by aerodynamic losses. The issue is primarily a concern for long-haul trucks traveling at highway speeds. For a typical line-haul truck averaging 60 mph, aerodynamics are crucial; but for a delivery truck averaging 30 mph aerodynamics are not the major influencer for fuel economy.
Tractor Aerodynamics
Tractors designed with aerodynamics in mind have been on the market for almost 30 years. A rel-atively wide range of aero-related improvements have been implemented on modern truck tractors, which has substantially improved their fuel econ-omy. Figure 10-7 shows a summary of aerodynamic
which is still typically made by the truck fleet buyer, is a tradeoff between fuel economy (associated with “tall” gear ratios and lower average engine speeds) and torque capability needed for changes in speed or grade (associated with “short” gear ratios and higher average engine speeds). A truck fleet buyer will typically enter the purchase and specification process with a strong understanding of his needs for drivetrain gearing. In some cases, incorrect specification can lead to fuel economy penalties of several percent. However, this problem is one of specification and purchasing, and not technology per se.
Many line-haul trucks use tandem drive axles, where the driveshaft power is split to power two axles. This arrangement is helpful for traction and stability during maneuvers; however, it is not strictly necessary when powering a tractor-trailer over a long, low-grade road surface. To improve axle efficiency, some designs are emerging with decoupling mechanisms for one axle. By decou-pling one drive axle when possible, drivetrain effi-ciency can be improved by 1–2%.13
Transmission and Driveline Summary
A summary of future improvements in vehicle fuel economy, as cited by the NRC, is shown in Table 10-3. Potential for improvement in driveline efficiency is substantial, with projected improve-ments in fuel economy of over 7% in the next decade. Future improvements in driveline technol-ogy, beyond the 2020 time frame, will most likely
13 Estimated in discussion with Eaton and Navistar engineering staffs.
SegmentTimeframe
2013–2015 2015–2020
Line-Haul 5.0% 7.0%
HD Vocational 1.5% 4.0%
Bus Y Coach 1.5% 4.5%
Class 3-6 1.2% 4.0%
Source: Adapted from TIAX as reported to the National Research Council, 2009.
Table 10-3. Summary of Transmission and Driveline Potential Fuel Economy Improvement
Compared to a Typical Modern Truck

10-16 ADVANCING TECHNoLoGY foR AmERICA’S TRANSPoRTATIoN fUTURE
RA
TE
OF
EN
ER
GY
CO
NS
UM
PT
ION
(KIL
OW
AT
TS
)
MILES PER HOUR
Note: Calculations based on National Research Council assumptions. Parameters selected based on NRC guidance: CRR = 0.005; Cd = 0.65; A = 10.9m²; Weight = 80,000 lbs.
Figure 10-6. Power Required to OvercomeAerodynamic Resistance is Highly Nonlinear with Vehicle Speed, Showing that Aerodynamic Forces
Become Dominant at Highway Speeds
10 20 30 50 6040 70
TIRE ROLLINGRESISTANCE
AERODYNAMICDRAG
0
20
40
60
80
100
120
140
0
Figure 10-6. Power Required to Overcome Aerodynamic Resistance is Highly Nonlinear with Vehicle Speed, Showing that Aerodynamic Forces
Become Dominant at Highway Speeds
measures taken on truck tractors, as estimated for the 2012 time frame. Some measures, such as roof fairings and deflectors, have been widely adopted throughout the trucking industry, while others are less prevalent. Improvements in fuel economy on the order of 10% have already been documented, owing to a combination of tractor aerodynamic measures.
The importance of full vehicle aerodynamics is evidenced by development work in active aerody-namic systems, which modify the truck shape or stance during operation to optimize aerodynam-ics. The benefits from active aerodynamic systems have been long recognized; however, the cost of these more advanced systems kept them out of the realm of commercialization. The prospect of high fuel prices has renewed industry interest in active aerodynamics. Examples of active aerodynamic systems include the following:
y Grille shutters to close off the grille when active engine cooling is not needed.
y Deployable gap extenders that reduce the trac-tor-trailer gap at highway speeds.
y Active 5th wheels to reduce the tractor-trailer gap at highway speeds. This technology helps to maintain air flow from the tractor to the trailer reducing overall drag.
Figure 10-7. Typical Passive Aerodynamic Measures Implemented on Modern-Era Truck Tractors
AERO SIDE MIRROR
ROOF FAIRING
CABEXTENDER
AERO HOOD
AERO BUMPER
CHASSISFAIRING
FULL SIDEFAIRING
Figure is 42p x 17p
Figure 10-7. Typical Passive Aerodynamic Measures Implemented on Modern-Era Truck Tractors

CHAPTER 10 – HEAVY-DUTY ENGINES & VEHICLES 10-17
than those on the tractor. This is largely due to the different ownership models of tractors versus trailers. Tractors are specified meticulously, and represent a major investment for their owners. A trailer costs much less, and is often seen as an interchangeable commodity with substantial cost pressure. Further, trailers are far more numerous than tractors, by a factor of 4:1 in a typical fleet.14 Many trailers are therefore sitting idle at any given time; the net result is a much longer payback time for investments in trailer efficiency. And finally, in some cases, the trailer is not owned by the same entity that owns the tractor and pays for the fuel. This misalignment of incentives is a hurdle to more aggressive implementation of trailer aerodynamic measures.
Rolling Resistance and TiresRolling Resistance Background
Rolling resistance accounts for roughly one-third of the power required to move a heavy truck over a level road at highway speeds. Rolling resistance comes primarily from inelastic deformation of the tire as it rotates. This deformation is a complex function of the load level, tire materials, tire and tread design, inflation levels, and the road surface itself. Generally speaking, the resistive force is pro-portional to the weight of the vehicle. In terms of energy consumption, the impact of rolling resis-tance is directly proportional to vehicle speed. Opportunities for reducing tire resistance are highly dependent on application as discussed below.
Wide-Base Single Tires
In Class 8 line-haul applications, operation is exclusively on-road and most time is spent at higher speeds, which provides several opportuni-ties for optimization. The most significant develop-ment is the so-called “New-Generation Wide-Base Single” (NGWBS) tire, which employs a wider tread to replace two traditional truck tires with a single tire. Studies show fuel economy improvements in the range of 5 to 10% for the use of NGWBS tires in line-haul applications.15 These gains must be traded off against several downsides of such tires,
14 Estimate from discussions with trailer manufacturers Great Dane and Cummins.
15 Estimates from various sources as summarized in the 2010 National Research Council report, Technologies and Approaches to Reducing the Fuel Consumption of Medium and Heavy Duty Vehicles.
y Active ride height control to lower the tractor and trailer at highway speeds. This technology lowers the total vehicle by 0.75 to 1.0 inch, which reduced overall form drag by reducing frontal area.
y Deployable mirrors or in-cabin vision systems to take over mirror functionality at highway speeds when the mirrors would be stowed for improved aerodynamics. Current safety regulations, which require fixed mirrors, prevent this technology from being deployed.
Trailer Aerodynamics
Various trailer modifications have been proposed to reduce trailer aerodynamics losses. At the front of the trailer, the focus has been on reducing aero-dynamic flow disruption between the tractor and trailer. Various gap-reduction strategies have been proposed, including side shields on both trailer and tractor. These measures have been shown to improve fuel economy by between 1.3 and 2.2% according to TIAX. However, during the sharp turning maneuvers that are normal for most trucks, closing this gap entirely is impractical. Trailer side skirts, mounted under the trailer and deflecting airflow from sweeping the trailer underside, have been shown to have a substantial aerodynamic effect. Fuel economy improvements of between 3.8 and 5.2% have been reported for such devices. However, while aerodynamically compelling, these features cause a wide variety of problems for fleet operators. Service, inspection, tire storage, and tire maintenance are all hindered by lack of easy access to the trailer underside. And skirts are prone to damage and breakage in the harsh environment where trailers must operate. These include the conditions at work sites, around fork trucks, in ice and snow, at steep loading docks, and similar condi-tions.
The rear of the trailer can be optimized for low drag using a “boat-tail” or similar device to reduce the massive separation bubble that follows the trailer back surface. Improvements in fuel economy ranging from 2.9 to 5.0% have been reported. As with side skirts, however, such devices have been resisted by the truck-buying fleets due to practical concerns.
Generally speaking, aerodynamic improvements to trailers have been slower and less noticeable

10-18 ADVANCING TECHNoLoGY foR AmERICA’S TRANSPoRTATIoN fUTURE
portion of energy through their brakes, due to their stop-and-go duty cycles.
Weight reduction can come from a wide variety of design changes, which span the full breadth of the commercial truck industry. Options for weight reduction include:
y Material substitution in the tractor cab and struc-ture, including aluminum and high-strength steel
y Replacement of steel wheels with aluminum wheels
y Material substitution in body panels, e.g., using composites or fiberglass for vehicle hoods and cargo boxes
y Engine weight optimization through use of lighter-weight materials
y Trailer material substitution, e.g., using plastics to replace metal
y Downsizing or re-specification of major subsys-tems including engines, transmissions, and axles.
A view of the weight of each major vehicle sys-tem is shown in Figure 10-8. The benefit of lower weight has been studied for a wide class of vehicle types, with varying results. For line-haul trucks over level terrain, a benefit of between 0.4 and 1.0% in fuel economy is reported per 1,000 pounds of weight reduction. The benefit improves to 1.5–2.0% for uphill climbing routes, where more energy is invested in pulling the weight of the vehicle to higher elevation. Data on other types of vehicle are less consistent, with results generally in the low single-digits of fuel economy improvement, depending on vehicle class and duty cycle.
For a significant percentage of line-haul loads, the trailer is loaded to a maximum weight limited by regulation, and not by the size of the trailer. Such loads are said to “weigh-out,” as opposed to loads which “cube-out” by first filling the space of the trailer before reaching maximum allowable weight. For weighed-out loads, weight reduction in the vehicle itself improves fuel economy indirectly. A lower weight tractor, for example, combined with a fixed maximum GVWR means a lighter truck can haul more freight before reaching weighed-out condition. In the end, the loaded vehicle weighs the same and achieves the same fuel economy; but more freight is transferred in the load. This effect is seen in truck-level parameters such as vehicle ton-miles per gallon.
including an added capital cost of around $3,600 per vehicle, and a perception of reduced safety.
Traditionally, with the exception of front-axle tires for steering, tractor and trailer tires are com-bined four per axle, with two tires on each side of the vehicle. In addition to the load-carrying benefits of this arrangement, it provides a level of robust-ness in the case of rapid tire deflation (for example, through puncture, tread separation, etc.). In such an event, a truck can continue to the next service sta-tion for repair. (Though this practice is not strictly allowed, it is common practice and arguably safer to truckers than side-of-the-road repairs, which are time consuming for heavy vehicles). Though stud-ies show the NGWBS tire is as safe as its dual-tire competition, the perception of safety and service issues may slow adoption to some extent in the heavy truck sector.
Tire Inflation and Other Operational Factors
NGWBS tires are not the only means to reduce tire rolling resistance. Proper inflation and align-ment can also contribute to better fuel economy. Maintenance of proper inflation levels can be improved by tire pressure monitoring, and in some cases by the use of nitrogen gas in the place of air. The total effect of such changes is around 1.5 to 3%. However, with the exception of pressure monitor-ing, these modifications are very low-cost options, requiring only basic service and attention to the vehicle. The cost of such activity is estimated at only around $300 per vehicle, for both Class 3-6 vehicles and vocational Class 8 trucks. These improvements are particularly relevant for non-line-haul vehicles, where NGWBS tires are often not an option.
Vehicle Weight Overview
Vehicle weight is a significant factor in fuel econ-omy. It has an impact on the power required to accelerate, and the power dissipated in the form of braking. Vehicle weight also impacts such fac-tors as rolling resistance and transmission perfor-mance, so that weight is an ever-present factor in truck fuel economy. It is most prevalent for vehi-cles with frequent changes in speed, which tends to dissipate more energy braking than constant-speed vehicles. Buses in particular dissipate a high pro-

CHAPTER 10 – HEAVY-DUTY ENGINES & VEHICLES 10-19
Longer Combination Vehicles and Other Trailer Re-Configuration Strategies
A combination of state and federal regulation limits standard Class 8 freight trucks to a weight of 80,000 pounds including freight. However, there is some momentum in the industry to adopt larger and heavier trucks, often through the use of long trailers in combination (i.e., longer combina-tion vehicles or LCVs). This is primarily a strategy to improve fuel economy on a ton-mile per gal-lon basis. According to research by the American Transportation Research Institute (ATRI), a fleet of so-called “Rocky-Mountain Doubles,” so-called because they are allowed in many Western states but no Eastern states, loaded to 120,000 pounds GVWR, can move large amounts of freight with 17% higher fuel economy and 36% fewer vehicle miles traveled.16 The improvement is attributed to the reduction in the number of loads required to move a large amount of freight. Though the vehicle’s mpg
16 American Transportation Research Institute, Energy and Emissions Impacts of Operating Higher Productivity Vehicles, Update 2008, 2008.
is reduced with higher tonnage, it’s ton-miles per gallon is improved with higher tonnage.
This shift toward higher allowable weight limits is hindered by two factors. One is the perception that such trucks are less safe than today’s 80,000-pound trucks. This perception is countered by several studies showing that the accident rate for LCVs is lower than for conventional trucks. Higher weight vehicles also put more stress on roads, if measures are not taken to spread the load over more axles. Notably, however, the Ameri-can Trucking Association proposes the addition of axles to reduce per-axle weight, presumably reducing road damage. This complex tradeoff between weight, safety, road damage, and fuel usage will ultimately be made by regulators, as any change would require a change in federal reg-ulations regarding allowable truck weights. When considering fuel economy for this study, gains of 17% (as predicted by the ATRI study) are sub-stantial. Such a gain would be the outcome, not of any specific new technology, but rather from a revision of regulation and policy regarding truck weight allowances.
Auxiliary Power Units and Other Secondary PowerEngine Idling Background
Traditionally, line-haul truck engines spend many hours idling in a given 24-hour period. Engine idling is used for a variety of functions when the truck is stationary, such as powering air-conditioners, providing electrical power for TVs, laptops, kitchenettes, etc., providing cabin heat in cold temperatures, and maintaining engine tem-perature. Though an idling diesel engine is not effi-cient, it is a simple and easy way to provide these functions to the typical long-haul trucker.
Auxiliary Power Units
In recent years, the expense of fuel and the bur-den of new emissions regulations have fostered alternatives to engine idling—which are generally more fuel efficient than an idling engine. The alter-natives include APUs, typically employing a small diesel engine. Alternate power sources such as fuel cells are also of interest. And in some cases, func-tion-specific devices such as direct-fuel-fired heat-ers can meet some idle functions at lower cost.
Figure 10-8. Typical Weight Contribution ofMajor Subsystems of a Class 8 Line-Haul Truck
Source: National Research Council of the National Academies, Technologies and Approaches to Reducing the Fuel Consumption of Medium- and Heavy-Duty Vehicles, 2010.
MISC. ACCESSORIESAND SYSTEMS
3,060 LBS.
TRUCK BODYSTRUCTURE
3,200 LBS.
POWERTRAIN4,050 LBS.
DRIVETRAIN& SUSPENSION
2,890 LBS.
CHASSIS& FRAME2,040 LBS.
WHEELS & TIRES1,700 LBS.
Figure 10-8. Typical Weight Contribution of Major Subsystems of a Class 8 Line-Haul Truck

10-20 ADVANCING TECHNoLoGY foR AmERICA’S TRANSPoRTATIoN fUTURE
Summary of Vehicle Technologies
Tables 10-4 and 10-5 show a summary of expected improvements in fuel economy, as well as an esti-mated range of costs to implement the improve-ment, for various technologies and vehicle types. As expected, we see a wide range of cost-benefit tradeoffs for various applications and technologies. In the case of aerodynamic and tire improvements, there is substantial room for improvement in line-haul trucks. Other segments see less benefit from these technologies, due to much lower speeds and mileage in other segments. Idle reduction benefits are applicable only to the line-haul class, because it is the only class that generally spends significant time idling, although niches within other segments may idle in specific situations; e.g., hydraulic bucket trucks with lift gear powered by an idling engine. It is also notable that weight reduction, while not entirely negligible, tends to be relatively expensive per unit of fuel economy gain. By contrast, tires are relatively low-cost options for improving fuel econ-omy in all vehicle classes.
Most of the technologies below can be consid-ered separately, and their results superimposed to determine the combined effect of various technol-ogy measures. For example, aerodynamic gain is distinct and separate from the impact of tires; there is little or no shared benefit, or integration com-plexity, of these technologies. However, the major exception is in idle reduction technologies, which
Depending on the features required and the level of integration with the vehicle, improvements in fuel economy between 1 and 9% are feasible with idle-reduction systems. Such systems can cost any-where from less than $1,000 for a fuel-fired heater, to over $12,000 for a top-of-the-line emissions-equipped APU. The choice between options is a strong function of duty cycle and operator econom-ics, which vary widely between fleets. For example, an owner-operator driving an older truck in north-ern climates may choose a simple fuel-fired heater for minimal investment, whereas a fleet that runs nationwide may invest in a fully capable APU with all the features a driver would prefer.
Other Auxiliary Power Sources
Some trucks are custom-designed to provide additional functions or protections to their freight loads. Refrigerated trailers are the most common example. A refrigerated trailer uses a custom-designed auxiliary engine-powered refrigeration unit, mounted to the trailer, to keep the trailer and freight cool. This added engine represents added fuel use in the range of 0.5 to 1.0 gallons per hour. However, this amount varies widely with operating conditions, particularly the temperature of the unit and the external ambient temperature. Advances in the efficiencies of such systems, whether by engine and refrigeration unit, or in better insulation of the trailer, are expected to contribute to several per-centage points of fuel economy improvement.
Technology Levers
% Fuel Economy Improvement
Class 8 Line-Haul
Class 7&8 Non-Line-Haul
Bus Class 3-6
Tires 11% 1.5–2.5% 1.5–3.0% 2.4–3%
Aerodynamics 11.5–13.3% 1.4–1.6% 0–8% 6–9%
Weight/Chassis 1.25% 1% 4–6.25% 3.2–4.0%
Transmission & Driveline
7% 4% 3.5–5% 3.2–4.0%
APU & Other Secondary Power
4–8% X X X
Source: National Research Council of the National Academies, Technologies and Approaches to Reducing the Fuel Consumption of Medium- and Heavy-Duty Vehicles, 2010.
Table 10-4. Fuel Economy Improvement Associated with Various Vehicle Technology Efficiency Measures for Several Classes of Heavy Trucks

CHAPTER 10 – HEAVY-DUTY ENGINES & VEHICLES 10-21
are necessarily integrated with engine operation. The many means of idle reduction, such as hybrid-ization, electronic engine controls, APU, fuel-fired heater, etc., create a wide range of costs and ben-efits. While idle reduction may have a substantial impact in coming years, the details of this low-idle future are very difficult to predict.
OPERATION TECHNOLOGIESNumerous technologies may improve the effi-
ciency of fleet operations, specifically, fleet fuel economy. Telematics and road speed governors are prominent operation technologies that are increas-ingly popular in fleets.
Telematics Technology OverviewTelematics is an information technology sys-
tem that allows vehicle fleet managers to track the status of each of their vehicles on the road in real-time. At a minimum, a telematics system requires a device that interfaces and collects data from the vehicle’s electronics system, as well as a commu-nications device that either connects to a satellite or cellular network to transmit the data from the vehicle to the computer of the fleet manager.
Today, there are about 1 million long-haul trucks on the road, 40% of which use a telematics system in some capacity. On the other hand, there are over 18 million short-haul trucks on the road, and only
5% of them use telematics. Therefore, there is still a significant portion of the potential end users of telematics who are not employing the technology.
With specific regard to improving fuel economy and GHG emissions, telematics can be used to mini-mize engine idling time, monitor vehicle speeds, optimize logistics and routing, maintain accurate records, and provide proactive vehicle mainte-nance plans. Each of these aspects either directly or indirectly improves the fuel economy and GHG emissions of the fleet. There are other indirect ben-efits of a telematic system that may also benefit the fuel economy and GHG emissions of a fleet, as well as reducing accidents.
Direct Fuel Savings from Telematic Applications
Telematic systems provide information to fleet managers and truckers with the primary objective of improving fleet efficiencies and fuel economy. Idle reduction and route management are examples of telematic applications. Idle time can be reduced using telematics in multiple ways. For example, with real-time knowledge of truck location and route traffic, a fleet manager can direct drivers to nearby trucks stops with hotel-load capacity or sim-ilar idle-elimination capabilities. By using telematic technologies to keep trucks on-route, fewer loads are delayed through unplanned route changes, and more trucks arrive at their destination on-time
Technology Levers
Cost Per Vehicle to Implement
Class 8 Line-Haul
Class 7&8 Non-Line-Haul
Bus Class 3-6
Tires $3,600 $300 $1,080–$1,200 $300
Aerodynamics $5,650–$12,000 $5,650–$12,000 $4,500 $3,000–$3,500
Weight/Chassis $13,500 $3,000 $1,600 $4,770
Transmission & Driveline
$5,800 $2,700 $1,200–$2,250 $1,800
APU & Other Secondary Power
$5,000–$12,000 X X X
Source: National Research Council of the National Academies, Technologies and Approaches to Reducing the Fuel Consumption of Medium- and Heavy-Duty Vehicles, 2010.
Table 10-5. Initial Purchase Cost Impact of Various Vehicle Technology Efficiency Measures for Several Classes of Heavy Trucks

10-22 ADVANCING TECHNoLoGY foR AmERICA’S TRANSPoRTATIoN fUTURE
without overnight stops. These advantages can have a sizeable impact on fleet fuel economy. Reducing a single truck’s idling time by 15 minutes per day can save hundreds of dollars per year in fuel costs.
Telematic technologies are also instrumental in route management. This includes both planning of routes based on past history of truck routes and active real-time management of truck route follow-ing. A study conducted for a report by TIAX in 2009 found that route optimization software was able to reduce pick-up and delivery fleet mileage between 5 and 10% per year. For regional and line-haul fleets, which spend relatively less time in traffic, the fuel savings potential was approximately 1% per year according to the NRC.
Speed Governors and Cruise ControlVehicle speed is a major component of efficiency.
Most fleets must balance the need to move freight quickly against the fuel-use disadvantage of higher truck speeds. Typically, this leads to an optimal highway speed in the range of 60 to 70 mph.
Many fleets govern their vehicle speeds to a set point, using features available in most new-engine electronic control units. This setting is not manda-tory but rather a fleet management decision which can be adjusted across the fleet. No telematics or information technology system is required for this measure; so long as the engine is electronically con-trolled, it is straightforward to set a governed speed. Speed can also be adjusted and optimized in-route using cruise control technology. Traditional cruise control, setting the speed at a driver-defined level, is standard. Newer cruise-control technologies, rely-ing on telematics, accomplish more functions at a higher degree of cost and complexity. Two types of telematics-enabled cruise control are adaptive cruise control (ACC) and predictive cruise control (PCC).
An ACC senses the traffic ahead of a vehicle through the use of either radar or laser sensors that are mounted to the vehicle. As the vehicle with the ACC approaches another vehicle from the rear, which is moving at a slower speed, the vehicle with the ACC slows to the speed of slower vehicle through actuation of the throttle or mild braking. Then the vehicle proceeds at a driver-defined dis-tance behind the slower vehicle, which is dictated by the speed of that slower vehicle. Recent stud-ies estimate potential fuel savings in ACC-equipped
vehicles ranging from 1 to 10%, with potential annual fuel savings of $1,100 to $3,000. Predic-tive cruise control analyzes information based on upcoming topographical changes to the road in front of the vehicle. A GPS system calculates and controls the target cruise speed within an upper and lower limit based on the inclines and declines a vehicle is going to encounter. According to the NRC study, the cost of a PCC can range between $861 and $1,561, depending on the type of vehicle. Although these benefits would be negligible for trucks travel-ing on relatively flat roads, moderate fuel savings have been reported in hilly terrain. Another study done on 75,000-pound Class 8 trucks traveling in Oregon showed a 4–5% improvement in fuel econ-omy while only experiencing a 0.3–1.4% increase in travel time.
Intelligent Transportation SystemsIntelligent transportation systems (ITS) is
another example of a telematics-enabled technol-ogy; however, instead of system aimed at improv-ing a fleet manager’s capabilities, it is an autono-mous system looking to improve the flow of traffic through transportation infrastructure. Thus, these technologies help alleviate congestion on the infra-structure as a whole and are not specifically geared toward improving commercial vehicle fuel econ-omy or GHG emissions.
There are many examples of ITS already in place. All automated toll collection systems can be consid-ered intelligent transportation systems. Moreover, the dynamic message sign systems along the inter-state highways alert drivers about expected delays from congestion, allowing them time to choose a different route that may save them time on their trip. At present, ITS is mainly focused on urban areas, especially in regards to alleviating traffic congestion, with approximately 40% penetration.17 According to the U.S. Department of Transporta-tion, more research should help transition from experimental programs to practical and novel uses of technology. It is their view that technology is no longer the barrier; practical implementation of the
17 U.S. Department of Transportation (website), Research and Innovative Technology Administration, “Adopt a Long Term Perspective Identifying a Business Reason or an Operational Need for ITS Based Solutions and Embrace Performance Measures,” December 2009, http://www.itsbenefits.its.dot.gov/its/benecost.nsf/ID/FF584FCE0E28B013852576B9006ADD8E?OpenDocument&Query=LLFocusArea.

CHAPTER 10 – HEAVY-DUTY ENGINES & VEHICLES 10-23
highway, while PCC is only applicable to line-haul trucks and regional buses and cooling system con-trol is only applicable to line-haul trucks.
More expensive and difficult to implement are telematic technologies; however, if leveraged prop-erly they can provide significant fuel economy and GHG emission benefits to the fleet. A full system consisting of hardware and software packages can start at over $10,000, and then scale upward by $750 to $1,200 per vehicle. Furthermore, while they can theoretically be applied to any commer-cial vehicle, they are best suited for vehicles deliv-ering either products or services to multiple loca-tions in a single day. Beyond the up-front cost of the system, other challenges to telematic adoption need to be overcome before widespread penetra-tion of the technology exists. A great deal of this challenge will fall on fleet managers. They will need to be champions of the technology; trained to not
technology is now key for further development of benefits from ITS.
Summary of Operations Technologies
Tables 10-6 and 10-7 show a summary of expected improvements in fuel economy, as well as an estimated range of costs to implement the improvement, for various technologies and vehi-cle types. Overall, there are many ways in which intelligent vehicle technologies and telematics can improve fuel economy and GHG emissions. The easiest and cheapest technologies to implement are speed governing devices such as ACC, PCC, and cooling system control; however, they are only applicable when the vehicle is traveling on a high-way. More specifically, ACC is the most versatile of the three and can be included in any vehicle on a
Technology Levers
Truck Categories and Operational Impact on Fuel Economy – Incremental Cost
Class 8 Line-Haul
Class 7&8 Non-Line-Haul
Bus Class 3-6
Adaptive Cruise Control
$1,100–$3,000 $1,100–$3,000 X $1,100–$3,000
Predictive Cruise Control
$860–$1,560 $860–$1,560 X $860–$1,560
Telematics* $400–$800 $400–$800 $400–$800 $400–$800
*Initial cost only; typically monthly service fees in the range of $20 to $40 are additional.
Source: National Research Council of the National Academies, Technologies and Approaches to Reducing the Fuel Consumption of Medium- and Heavy-Duty Vehicles, 2010.
Table 10-6. Incremental Costs Associated with Various Operations Technology Efficiency Measures for Several Classes of Heavy Trucks
Technology Levers
Truck Categories and Operational Impact on Fuel Economy – % Improvement
Class 8 Line-Haul
Class 7&8 Non-Line-Haul
Bus Class 3-6
Adaptive Cruise Control
1–10% 1–10% X 1–10%
Predictive Cruise Control
1–3% 1–3% X 1–10%
Telematics 1% 5–10% 5–10% 5–10%
Source: National Research Council of the National Academies, Technologies and Approaches to Reducing the Fuel Consumption of Medium- and Heavy-Duty Vehicles, 2010.
Table 10-7. Fuel Economy Improvement Associated with Various Operations Technology Efficiency Measures for Several Classes of Heavy Trucks

10-24 ADVANCING TECHNoLoGY foR AmERICA’S TRANSPoRTATIoN fUTURE
Figure 10-9. Technology Hurdles for Medium- and Heavy-Duty Vehicles
Also used as Fig. 4B-10
Optimized ultra-high-pressure fuel systems are an enabling feature for highly-optimized combustion
REQUIRED STATE FOR REACHING WIDE-SCALECOMMERCIALIZATION
RATING
IDLE REDUCTIONTECHNOLOGY/APU
MINIMAL/NO BARRIERS
SIGNIFICANT BARRIER OR HIGH RISK OR HIGH UNCERTAINTYOR REQUIRES BREAKTHROUGH OR INVENTION
WILL TAKE INVESTMENT AND TIME, BUT PATHWAY FOR SUCCESS HAS BEEN IDENTIFIED
PRIORITY FOCUSAREA TO ENABLEWIDE-SCALECOMMERCIALIZATION
GAS EXCHANGE
HCCI
FRICTIONREDUCTION
PARASITIC &ACCESSORY LOADS
IN-CYLINDERPRESSURE &
FUEL INJECTION
MANUFACTURINGSCALE
BATTERY COSTS
ADVANCEDGASOLINEENGINES
INTEGRATEDTRACTOR/TRAILER
APPROACHES
WASTE HEATRECOVERY
AFTERTREATMENT
TIRES
TRANSMISSION
TELEMATICSAND ROUTE
OPTIMIZATION
SPEEDMANAGEMENT/GOVERNORS
LCVs ANDEXTENDED GROSSVEHICLE WEIGHT
HURDLES
HYBRIDS
AERODYNAMICS
Robust & reliable, mass-manufactured fuel systems and valvetrains
Cost-effective reliable options to single turbocharging & fixed valve
Life, torque, and convenience of traditional diesel engines
Long-life, lead-free lubricants and bearings with proven long-term reliability
Highly-electrified trucks in mass-production
Cost-effective hybrid batteries with 1 million mile life in real-world conditions
Dominant electric architecture that builds synergies with automotive scale
Integrated and cost-effective, reliable Rankine cycle and/or thermoelectric device
Long-term reliability coupled with low total cost of ownership to compete with diesel
Wide availability of single-wide-base tires
Cost effective DCT, CVT, and AMTs with proven field reliability
Harmonized tractor/trailer logistics and value chains
Cost and convenience approaching the traditional idling approach for hotel loads
Federal law supporting higher GVW and/or nationwide LCVs
Cost, simplicity, and value proposition comparable to home-use GPS
Simple and effective speed control measures for fleet-manager application
Multiple technologies are in development including VVA, 2-stage turbo, EGR, supercharger, etc.
Largely confined to laboratory studies dueto controllability issues; may require specialty fuels/blends
Low-friction oils and bearings are available. Some barriers to adoption, including costand inertia
Electrification of accessories; some synergies with hybridization
Cost breakthrough required to enable cost competitiveness in heavier applications
Cost competitiveness is hindered by low volumes and several competing hybrid architectures (e.g., parallel, series, etc.)
Rapidly developing technology, scale adoption will be needed to drive down costs
Multiple technologies now on the market; cost and long-term reliability are still a major concern
Gasoline competes well on initial cost, but still must close a gap efficiency and reliability
Mis-alignment of incentives between tractor purchasers and trailer purchasers; trailer turnover is very slow and trailer fleet is much larger than tractor fleet
Super-single and low-friction options available; but safety perception hinders super-single adoption
Complex picture created by existing and emerging technologies (AMT, DCT, CVT, etc.)
Various technology options available (e.g., APU, engine controls, etc.) but not widely adopted
Safety and road-wear challenges currently under study
Widely adopted using conventional techniques; new telematics-based options now available
VEHICLES:
ENGINES:
FLEET OPERATIONS TECHNOLOGY:
High efficiency, long-life, low-cost controls for both NOx and PM
Tools to improve driver awareness & productivity; barriers to full adoption include cost and uncertainty of fleet buyers
COMBUSTIONOPTIMIZATION
COMMENTS
Note: Engine technologies relate to diesel engines unless otherwise noted.
Figure 10-9. Technology Hurdles for Medium- and Heavy-Duty Vehicles

CHAPTER 10 – HEAVY-DUTY ENGINES & VEHICLES 10-25
fuel has risen relative to gasoline. In MD vehicle segments, this has prompted a broader consid-eration of gasoline engines. Gasoline engines require improved durability and fuel economy to compete with diesel engines. However, the appli-cation of LD vehicle gasoline engine technologies (e.g., direct-injection, turbocharging, supercharg-ing & downsizing, etc.) to HD gasoline engines may achieve near diesel-like efficiency. Gasoline engine life remains a challenge, however.
y Aerodynamics – Integrated Tractor/Trailer Approaches. This hurdle reflects the challenge of implementing an integrated approach to tractor-trailer aerodynamics through integrated measures such as active trailer lowering, gap closure, etc. Trailers are built by different com-panies than tractors. And the purchase decision for trailers is separate and distinct from the trac-tor purchase. If integrated measures are to be developed, some coordinating mechanism must be developed.
y Hybrids – Battery Costs. This hurdle exists pri-marily due to the lack of maturity of the industry. Accelerated deployment of hybrid power solu-tions would likely lead to an acceleration of cost/price reductions as manufacturers realize expe-rience benefits and competing technologies are reconciled. This acceleration could be realized through a temporary incentive program that enables equipment buyers to justify purchases of hybrid-powered vehicles.
only analyze the data from the system to optimize the performance of the fleet but also communicate the benefits and purpose of the system of the driv-ers, whose performance would be inevitably moni-tored closer than ever.
TECHNOLOGY HURDLESFigure 10-9 summarizes the findings, identifying
the key technology hurdles. Each of these hurdles exists for different reasons and has different paths to resolution. Though the diagram lists a wide range of technologies and issues, some issues are seen as having higher end potential to impact truck fuel economy. These are highlighted in dark green on the hurdle chart. Each is summarized in brief here:
y Combustion Optimization. This is a broad cate-gory that contains many engine technology com-ponents, each at a different stage of development. Incrementally, each technology contributes a moderate degree of fuel economy. However, the sum of these parts is quite large, and will be among the leading factors impacting the future of truck fuel economy. There are still substantial efficiency gains to be made to diesel engines, and they will remain the power plant of choice for heavy trucking for decades to come.
y Advanced Gasoline Engines. In the last decade, the cost of diesel engines has gone up due to emis-sion control requirements, while the cost of diesel
AEA Technology and Ricardo. Reduction and Test-ing of Greenhouse Gas (GHG) Emissions from Heavy Duty Vehicles – Lot 1: Strategy, Final Report to the European Commission – DG Climate Action, February 22, 2011. http://ec.europa.eu/clima/ policies/transport/vehicles/docs/ec_hdv_ghg_strategy_en.pdf.
American Transportation Research Institute (web-site). Energy and Emissions Impacts of Operating Higher Productivity Vehicles: Update 2008. March 2008.
American Trucking Association. American Truck-ing Trends 2009-2010. 2010.
American Trucking Association. “Proposals for Reform of Federal Truck Size and Weight Reg-ulations.” 2009. http://www.truckline.com/AdvIssues/HighwayInf_Fund/Size%20and%20W e i g h t / P r o p o s e d % 2 0 R e f o r m s % 2 0 t o % 2 0 F e d e r a l % 2 0 T r u c k % 2 0 S i z e % 2 0 a n d % 2 0Weight%20Limits.pdf.
Capps, G., O. Franzese, B. Knee, M. B. Lascurain, and P. Otaduy. Heavy Truck Duty Cycle Project Final Report. Report ORNL/TM-2008/122, Oak Ridge National Laboratory, 2008.
Ecerkle W., E. Lyford-Pike, D. Stanton, L. LaPointe, S. Whitacre, and J. Wall. Effects of Methyl Ester Bio-diesel Blends on NOx Emissions. SAE Paper 2008-01-0078, 2008.
BIBLIOGRAPHY

10-26 ADVANCING TECHNoLoGY foR AmERICA’S TRANSPoRTATIoN fUTURE
rmi.org/Knowledge-Center/Library/T08-08_TransformationalTrucksEnergyEfficiency.
SupplierBusiness, An IHS Global Insight Company. The Hybrid Commercial Vehicles Report. 2010. (Available at SAE International.)
TIAX, LLC. Assessment of Fuel Economy Technologies for Medium- and Heavy-Duty Vehicles. Final Report to the National Academy of Sciences. September 2009.
U.S. Energy Information Administration, Annual Energy Outlook 2010 — With Projections to 2035, April 2010.
The National Research Council of the National Academies. Technologies and Approaches to Reduc-ing the Fuel Consumption of Medium and Heavy Duty Vehicles. 2010.
Oak Ridge National Laboratory. Transportation Energy Data Book, Edition 29. Prepared for U.S. Department of Energy, Office of Energy Efficiency and Renewable Energy, June 2010. http://info.ornl.gov/sites/publications/files/pub24318.pdf.
Rocky Mountain Institute. Transformational Trucks: Determining the Energy Efficiency Limits of a Class-8 Tractor Trailer. 2008. http://www.