Embed Size (px)
Citation preview


Introduction
Everything happens somewhere.
But in marketing does it make any difference where?
More often than not it does.
Stores, offices, and warehouses have locations. Customers have addresses, shopping patterns, and preferred travel modes. Sales representatives are assigned to geographic territories to service their accounts effectively and efficiently. Suppliers and intermediaries have distribution centers, transportation networks, and supply chains. Promotional media have geographic coverage areas. Even in cyber marketing, where transactions occur regardless of location, firms must ship purchased products, meet delivery schedules, and provide customer service. In addition, where online customers live can provide insight into their demographic characteristics, values, and shopping patterns.
Understanding the spatial dimension of marketing and marketing analysis can enhance a firm’s ability to serve its customers, improve firm performance, and create a competitive advantage. The three-pronged premise of this book is that: (1) virtually all aspects of marketing have a spatial dimension; (2) geographic information systems (GIS) provide valuable tools in managing this dimension; and (3) marketing managers who use these tools will be more successful.
This book provides a systematic path for learning GIS throughout most of your marketing courses. This will provide you a broad-based understanding of the technology and how to apply it in the real world.
What is GIS?
ESRI, developer of the ArcGIS software you will use in this book, offers the following definition of GIS.
“An integrated collection of computer software and data used to view and manage information about geographic places, analyze spatial relationships, and model spatial processes. A GIS provides a framework for gathering and organizing spatial data and related information so that it can be displayed and analyzed.”1
If you have ever used an interactive Web mapping service (such as Google Earth), there is much you will find familiar as you work within a GIS environment. But GIS is much more than digital mapping. As with any information system, you can use GIS to organize and store data, manipulate data, facilitate data analysis, and create data presentation formats such as tables, charts, and reports. Indeed, the ArcGIS personal geodatabase structure uses an MS Access format, allowing you to use familiar tools within the MS Office suite to work with GIS datasets.
That said, the distinctive power of GIS lies in its ability to organize, store, analyze, and represent geographic or spatial knowledge, most commonly presented in maps. Using GIS to address common business problems enables exciting approaches to making sound business decisions. You can geographically display virtually
1 A to Z GIS (Wade, Sommers, eds.). Redlands, CA: ESRI Press, 2006.
any data with a spatial component offering a fresh perspective on business information. You can also integrate that data with other spatial data to provide more comprehensive approaches to business problems. For example, integrating a map of possible sites for your new plant with work force, floodplain, and transportation maps can avoid costly mistakes.
GIS also provides tools for analyzing the spatial dimension of business information. Basic questions such as “Where are my stores? My customers? My distribution centers? My sales force? My competitors?” are inherently spatial and crucial to understanding the business enterprise. However, the greater value of spatial analysis lies in its role in answering more strategic questions such as, “Where should I place my next store to better serve customers? Where do our most attractive prospects live? How can we communicate with them? What is the most efficient structure for our sales territories?” Further, the inherently visual representation of this information in GIS creates strong communication capabilities as well, affording executives a more comprehensive basis for making business decisions.
What is ArcGIS?
The ArcGIS Desktop product is composed of two primary applications: ArcCatalog and ArcMap. ArcCatalog is the application you would use for managing your data. ArcMap is the application to use for displaying, navigating, and manipulating data. In this book you will only work with the ArcMap application.ArcGIS Desktop has three license levels: ArcView, ArcEditor, and ArcInfo. ArcEditor offers additional capabilities over ArcView, and ArcInfo offers the full extent of the software’s capabilities. This book is designed for the ArcView license, meaning every task can be accomplished by any ArcGIS user, no matter what license they have.
ArcGIS provides an impressive array of functionality. ESRI also provides additional applications, called extensions, that extend the capabilities of the system. They provide functionality that is vital for users in specialized fields. Many organizations use these extensions in facilities management, supply chain management, and customer service operations.
One such extension is Network Analyst, which you will use in tutorial 8 to determine the best route for a series of sales calls. Network Analyst is used extensively in routing applications for sales representatives, service technicians, repair crews, and emergency response teams.
Another extension, Business Analyst, is designed specifically for use as a tool for business and marketing planning. It includes a set of tools for customer profiling, market segmentation, market area analysis, and opportunity prospecting. Further, it incorporates a very extensive demographic data collection of the United States at levels of geography ranging from national and state levels to census block groups. Most of this data includes measures from the 2000 U.S. Census, updated estimates of current year values, and five-year projections. This dataset also contains Community Tapestry data for use in lifestyle segmentation analysis. Data on businesses and shopping centers is also provided for use in competitor analysis.
Many Business Analyst features build on the procedures, tools, and data you will use in this book. Indeed, the demographic and Community Tapestry data you will be using are from Business Analyst. Should you encounter this extension in your workplace, you will recognize many of the applications and be able to incorporate them into your workflow.
The role of GIS in marketing

Given this general definition of GIS and its usefulness in business decision making, what are the applications in marketing? Though the list of specific GIS tools and procedures is extensive, there are four essential capabilities that they provide:
1. Enhanced spatial insight into marketing data.2. Greater potential for visualization in marketing analysis.3. The addition of powerful spatial analysis tools to the marketer’s tool box.4. Enhanced communication capabilities in marketing reports and presentations.
Let’s explore each of these capabilities briefly.
Spatial insight
In many cases the spatial dimension of marketing data provides additional insight and understanding to the marketer. Consider the following example of World Treasures, an online store covered in tutorial 7. Using a list of electronic newsletter subscribers from its online store, the organization has identified high concentrations of users by ZIP Code in the state of New York. The table below lists the number of subscribers by ZIP Code.
[Insert SubscribersTable1.bmp graphic here]
This information is both relevant and actionable. By targeting these ZIP Codes in a direct mail campaign, the firm can increase its response rate. However, the table tells only part of the story. Consider the map below that displays New York ZIP Codes and shows where the segments are located
[Insert MapDocument1.bmp graphic here]

Subscriber SegmentsHigh
Low
None
Target ZIP Codes for World Treasures' Direct Mail Campaign
Souirce: World Treasures' Subscribers List ESRI BIS Data 2004
Submitted by: Firstname Lastname Date: Month ##, 20__
The highligted ZIP codes are in the High subscriber segment and have above average levels of income and education. ##% of World Treasures'electronic newsletter subscriberslive in these ZIP codes.
The ######### households inthese ZIPs will be targeted in World Treasures's direct mailcampaign
New York City Area
OBJECTID_1* Segment Cnt_Segment Ave_AVGDI_CY1 High 316 55595.80063291142 Low 697 44064.00717360113 None 574 37754.4101221641
While the geographic concentration of attractive ZIP Codes cannot be seen in the table, it is obvious on the map. This insight would allow WorldTreasures.com to support its campaign with promotional techniques targeted to these concentrations.
Visualization
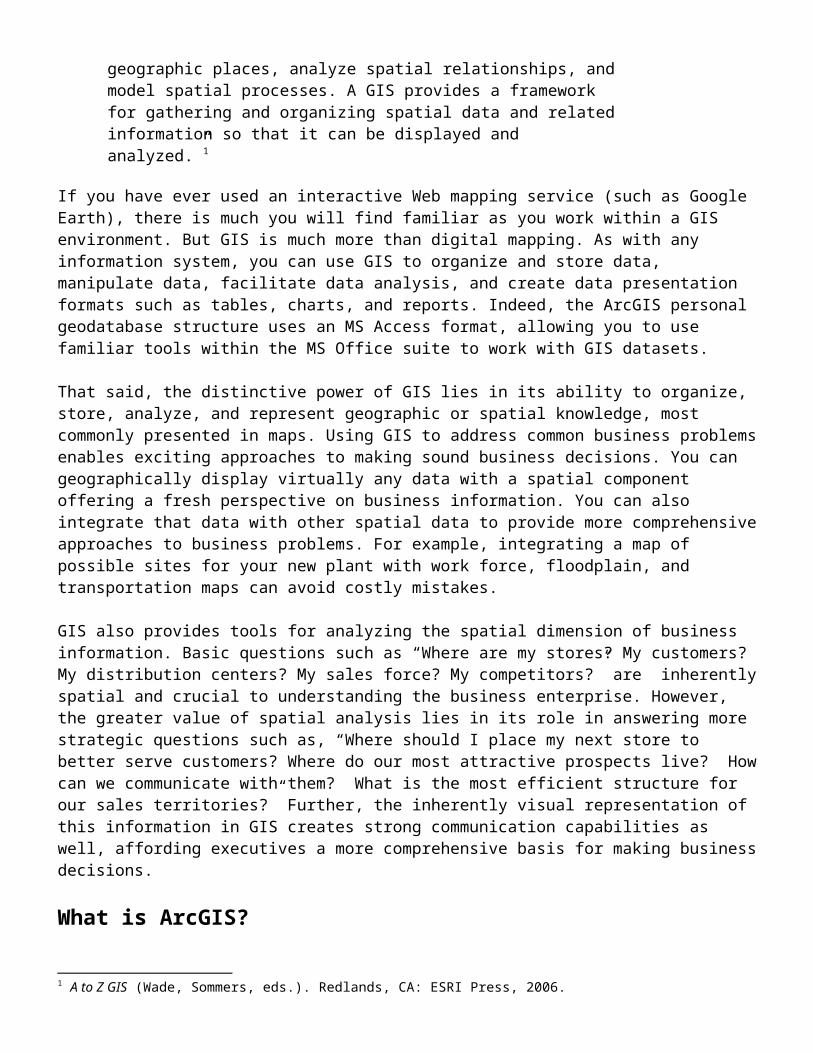
With some marketing decisions, spatial information does more than merely provide insight; it is a crucial component of the decision-making process. Consider the following situation from Meiers’ Home Furnishing, covered in tutorial 3. To understand the competitive environment for its Lombard location, the firm has developed a list of furniture stores in the Chicago area. The table below is a sample of that data.
[Insert StoreTable.bmp graphic here]

While the information in the table is important, its true significance is hard to assess without considering the spatial component. Which competing stores are closest and, therefore, present the greatest competition to the Lombard location? The map below provides that answer at a glance with its display of competitors relative to the Lombard store’s market area. The map’s visual representation makes the relevant information much clearer.
[Insert MeiersMA.bmp graphic here]
Spatial analysis
In some situations, the spatial dimension can be analyzed to derive valuable new information. Consider this example from the Outdoor Living company, covered in tutorial 2. The firm’s budget allows it to participate in four outdoor recreations shows in the Tampa, Florida area. The map below displays the stores that sponsor such shows and the geographic distribution of Outdoor Living’s target families across the city. Assuming that outdoor shows will typically draw new prospects from a two-mile radius, the challenge is to identify the four shows that best provide that opportunity to high concentrations of the firm’s targeted families. This problem is inherently spatial. Its solution requires the tools available in GIS.
[Insert OutdoorStoreAreas.bmp graphic here]
Communication
GIS tools can greatly enhance the communication value of marketing reports and presentations. This is an extension of the visualization value discussed above. The introduction of maps into marketing reports can effectively communicate the spatial dimension of marketing analyses. The integration of maps with text, tables, and charts allows researchers to communicate relationships and interactions within their studies more clearly.
Consider the following map from the Community Farm Alliance (CFA), covered in tutorial 4. One of CFA’s central goals is to increase the availability of locally produced foods to low-income consumers. When it targets grocery stores to carry its products, it must also consider the accessibility of these stores to low-income consumers. This map displays the ZIP Codes in Lexington, Kentucky with the highest percentages of families living below the poverty line (depicted in dark blue). The city’s grocery stores are displayed with orange dots representing their size. The light blue dots are grocery stores which have been targeted by CFA

and lie within the ZIP Codes with the highest levels of poverty. Listing these stores in a table does nothing to communicate their geographic distribution. However, the map instantly communicates where the grocery stores are in the area of interest.
[Insert GroceryPovertyMap.bmp here]
These are the major contributions of GIS tools to marketing analysis. You will gain firsthand experience with all of them as you progress through this book.
What will you learn in this exercise?
This book contains a series of tutorials that illustrate GIS applications in marketing. Two of the tutorials are general orientations: one to GIS software and the other to the Community Tapestry system, a lifestyle segmentation tool that is used extensively in developing marketing strategies. Each of the seven remaining tutorials is related to a marketing class in your curriculum. As you complete them you will broaden your understanding of the subject matter of each class while you learn to use GIS tools in that dimension of the marketing industry.
Developing a Targeted Promotional Campaign
Outdoor Living, a manufacturer of recreational and camping equipment, has introduced a new model designed to appeal to families with little camping experience. The firm has defined its target market segment

and must now tailor its promotional campaign to reach them. You will use GIS tools to focus three distinct components of that campaign on clusters of targeted families in Florida.
How will you learn?
This tutorial contains the following components, designed to help you understand the relevance of the tutorial for your marketing class and the contribution GIS brings to that area of marketing.
Marketing scenario
Each tutorial begins with a brief marketing scenario. These scenarios cover a range of organizations, geographic areas, and marketing problems. Each poses a common, real-world marketing situation and identifies the decisions and/or recommendations required in that situation. As you move through the project, you will use GIS tools to systematically construct an appropriate response to the central problem of the case.
Background information
This component relates the case situation to the content of the relevant course. It identifies the course concepts embodied by the case and their relationship with GIS technology.
GIS analysis
This is the most active section of each tutorial. In each project, you will perform five specific tasks with GIS tools. At the end of each task, you will answer a series of questions that lead to your final recommendations and are part of your formal written report.
Each task provides detailed instructions for performing the steps of the GIS analysis. As you complete each task, your understanding of the marketing situation will increase and you will use this knowledge to answer the questions associated with that task.
The final task always requires you to summarize your analysis and recommendations and to support them with a map document that communicates the essential conclusions of your analysis.
As you proceed, you will record your answers for the task questions in a Microsoft Word report template, which is discussed below. When you have answered all the questions and attached the map document from the final task in the template, you will have completed your formal report for the tutorial. Your course instructor may require you to submit this document for evaluation.
Advanced applications
The GIS tasks incorporated into these tutorials are designed to help you learn the basic skills relevant to marketing analysis. In each area, however, the capabilities of GIS go well beyond these basic skills. This section of each tutorial will provide a greater appreciation of those capabilities by describing specialized applications in the field as well as specific examples of organizations who have implemented GIS solutions to their advantage. Thus, this section will provide you a more complete sense of the potential role of GIS in the relevant field of marketing. Report template

Each tutorial is accompanied by a report template in the form of a Microsoft Word document that will help you prepare your final project report. Instructions for accessing the appropriate template are included in the tutorial task descriptions.
The report template document reproduces the task titles from the tutorial as well as the questions associated with that task. As you complete each task, you may record your answers to these questions in the body of the template, thus building your project report as your proceed.
In addition, each tutorial requires you to design one or more exhibits that include maps, graphs, and/or tables. The report template contains titles and placeholder texts for these exhibits that match the instructions in the tutorial tasks. As you complete these tasks, you will include these exhibits at the designated points in the template.
As you follow this approach, your report will take shape as you record your answers and insert required exhibits. This allows you to complete assigned tasks and prepare the report concurrently. As you work through several tutorials, you will become quite adept with the process. This will allow you to concentrate your attention on the GIS skills you are learning and report your results quickly, clearly, and efficiently.
How will you encounter GIS in your career?
Organizations are increasingly recognizing the value of GIS throughout their operations. As a result, they are developing enterprise level solutions that integrate GIS tools within their information infrastructures. As these technologies develop, GIS applications will become more integrated and widely distributed, but they will also be disaggregated. That is, select components, tools, or applications will be extracted from comprehensive GIS systems, integrated with other information technology tools in the enterprise suite, and distributed across the enterprise using application servers or, in many cases, the Web.
As a result, when you encounter GIS applications in your organization they might be in one or more of several forms. The most common are described below. The tutorials in this book will help you recognize and use GIS tools in whatever form you find them.
Desktop or networked GIS systems
If you use this book with the included software on your home system, you will be using ArcGIS as a stand-alone application in a desktop environment. If you work in a computer lab, you may be using a network installation of the same software, depending on the configuration and procedures at your institution. This may also be the configuration you use when you encounter GIS software in your career. This would be the case in firms that have licensed the ArcGIS product either as a standard component of their organizational software load, or as a network tool that can be accessed on demand by users on the organizational network. Either way, the interface, functions, and features of the system you will use closely resemble those covered in this book.
Specialized GIS applications based on the ArcGIS framework
You may encounter the GIS tools you work with here in the context of specialized software packages within your organization. The most common applications for these packages are market area analysis, site selection, real estate marketing, sales territory management, facilities management, and routing applications. Business
partners of GIS software companies developed many of these systems, which are built upon the standard software platforms of those companies. ESRI, for example, has several hundred business partners, many of whom build specialized applications as extensions of ArcGIS. Their users encounter the familiar ArcGIS interface, but have access to the specialized tools provided in the business partner’s system. In these systems the basic interface and tool set you use in this book will be augmented with functions and processes designed by the business partner to produce the specialized application. Several tutorials reference these specialized systems in their Advanced Applications section.
Integrated into enterprise information systems
This configuration can take two forms. In the first, users of desktop or networked GIS systems use standard tools to access data stored in enterprise databases and information systems. For example, ESRI’s ArcSDE server product provides multiple GIS users with direct access to very large relational databases containing shareable data. It is the gateway between GIS systems and facilitates the application of GIS analysis to a wide array of enterprise data. The World Treasures scenario presented in tutorial 6 simulates this type of integration with the electronic newsletter subscriber database imported from the firm’s Web server.
In the second type of configuration, you might encounter GIS tools integrated into your organization’s proprietary information systems. From a developer’s perspective, GIS systems are comprehensive collections of objects, or discrete chunks of programming code that perform specific tasks. In addition to integrated packages, GIS software firms also license direct access to these GIS objects. Developers within other organizations can then selectively use the objects they need within their own applications. For example, ESRI’s MapObjects system is a collection of GIS and mapping objects which developers can selectively embed in their applications to extend their spatial capabilities.
You might also encounter GIS applications in Web-based services which you access with a browser. For example, ArcGIS Server is a Web-based GIS which allows firms to distribute GIS functionality to both internal and external users with browser access. Thus a proprietary system for customer analysis within your organization may well include some of the GIS tools used in this book even though the full ArcGIS package is not available to you.
On-demand, Web-based applications
In this alternative, the user organization does not host the GIS tools, functions, and data, but rather obtains that on GIS software companies’ servers. In this configuration, firms contract for access to services hosted by GIS suppliers and integrate these tools into their own applications. In this scenario your encounter with GIS tools might occur in one of two ways.
In the first, you would directly access GIS software that has been configured for on-demand, Web-based access. ESRI’s Business Analyst system, discussed early in a desktop configuration, is also available as Business Analyst Online. This is a cost-effective option for firms whose need for Business Analyst’s capabilities is intermittent.
In the second, your organization would access Web-based GIS tools and data for use in its own applications. ESRI’s ArcWeb Services offers this capability by hosting both GIS applications and datasets. When client organizations develop their Web site, they access ArcWeb Services for GIS components. This arrangement frees clients from the time and expense of maintaining large datasets and updated software. If these services are deployed in your firm’s Intranet, they would be incorporated into the information technology tools available to you. If they are deployed through your organization’s Internet presence, they would be available to customers, suppliers, and the general public as well.