Embed Size (px)
Citation preview

1
INTRODUCTION
This chapter begins with giving an insight to the notion of Corporate Social
Responsibility (CSR), setting the background of the research, defining the problem
statement, identifying the research gap. The justification of study is also explained in
detail and the research gaps are identified followed by setting of the objectives of the
present study. The limitations are also stated.
1.1 Corporate Social Responsibility (CSR) - An Insight
Corporate Social Responsibility is not a mere business buzzword or a fad, rather one
of the most promising management topics of mounting significance for businesses
(Ribers 2010). Although, a huge amount of ambiguity and uncertainty about the real
meaning of corporate social responsibility and the drivers for the business to pursue
it, exists (Abiodun 2012), the theme is rapidly flourishing on the domestic and global
schema of the corporate sector (Khurana 2011) and has long existence in India. By
adopting sustainable actions, businesses have been playing an excellent role in
bringing a noteworthy transformation in the society by improving the people’s life
quality. (Berad 2011). (Ahamed et.al 2014) Corporate Social Responsibility (CSR)
as a common corporate practice has proven a foothold in nations which are
developing with businesses committing to advance the societal and economic
standing of numerous stakeholders by complying with all legal and economic
requirements (Krishnan and Balachandran 2010). CSR holds accountability for the
business’s actions and reassures a positive influence through its actions on the
environment and its stakeholders (Prateek and Chandan 2010), representing a

2
differentiating factor that may be used effectively by businesses to distinguish
themselves within their industries (Hill et al, 2006). It is vital for the corporate sector
to realise the triple bottom-line effect: profits, environment protection and fight for
social justice of every CSR activity. (Berad 2011). CSR is the DNA of a company as
a corporate decision responsible for its financial sustainability and value creation of
the operating business. Hence, the companies try to trim down the negative impacts
and maximize the positive impacts for their benefit and that of the society as well.
CSR, generally called philanthropy (Sharma 2011) by the corporate does not treat
welfare of the society and the growth of the company as a zero-sum game rather
focuses and voluntarily assumes doing well for the community, the society, the
environment and all other aspects (Singh 2010). CSR activities deliberate upon putting
together the corporate efforts (Berad 2011), (Kiran and Sharma 2011) as an attempt to
help the society through development projects. The term CSR conceptualizes analyzing
the interdependent relationships existing between economic systems, corporations and
the community (Uddin and Hassan 2008). For a long time, there has neither been an
accord on the model of corporate social responsibility, nor there exist an absolute
definition for CSR. (Qiu 2010). Industry leaders, policy makers and consumers each
may have their own concept - and opinion - but one thing is for sure; CSR is here to
stay and it should!
1.2 Background of the Study
The practice and content of the entrepreneurial economy worldwide is fast
progressing with capital being progressively centralized, as the market competition
strengthens. Corporations have to continue running just to stay in the same place.

3
The protection of interests of stakeholder groups has recently b e c o m e
increasingly common across the world with the emergence of concept of Corporate
Social Responsibility (CSR) three decades ago (Fauzi 2012). Socially responsible
businesses have to be proactive, not just reactive to actively apply new and positive
trends (Boyd and Gessner 2013). A significant amount of research has been steered on
sustainability and CSR in developed countries (Belal 2001) especially on developing
theories and models. However, in spite of many research studies, the association
between corporate financial performance and social responsibility has still not
acquired a universal consensus and is circumscribed with inconsistent evidence
(Zaborek 2014). The focus on integrating CSR into sustainability and understanding
CSR in a specific sector has been minimal. The corporate scandals and scams
drawing the public attention have highlighted the significance of CSR all the more
and the study of the concept has become of utmost importance for the corporate
worldwide. Corporate social responsibility is primarily measured as an idea of the
western countries, due to stringent standards, institutions and regulatory systems. The
feeble regulatory mechanisms (Chapple and Moon 2005), pose substantial challenge
to companies for performing CSR in Asian nations counting India (Mishra 2010).
Subsequently, Indian businesses have initiated altering their stance towards CSR by
eyeing beyond submissive philanthropy.
Proponents argue the existence of a robust CSR case, as the businesses profit in
numerous ways by functioning with a wider standpoint which goes beyond their short-
term earnings. Some critics contend that CSR sidetracks beyond the essential
economic role of companies; others opine that it is an artificial window-dressing;

4
others yet are of the belief that it’s an endeavor to forestall the character of watchdogs
by the governments over influential multinational corporations.
In the foreign studies studied till date, possibly the maximum studied facet of CSR
has been its linkage to Corporate Financial Performance (CFP). A lot of effort has
been put on gazing an insight into this linkage and a quantity of empirical findings
and theoretical revelations have been exposed in Indian studies also, however the
automotive sector has yet to be explored. Numerous pragmatic researches of the
relationship between CSR and CFP, by using measures of profitability has been
conducted and given varied results.
1.3 Problem Statement
The ripple effects of the recurring corporate scams, be it Enron in US or the Satyam
Fiasco in India have led to the collapse of not only small business entities but also the
so called world corporate giants’. A recent upsurge of illegal and ethical misconduct
incidents spanning the globe has intensified public scrutiny of corporate behavior. The
corporate are facing stress to advance policies, principles, and behaviours that
validate their sensitivity to stakeholder apprehensions (Brammer 2007). Stakeholder
expectations of the firms are ranging from maximum profits to strong levels of
corporate social responsibility. The effects of globalisation and liberalisation in the
Indian economy has led to a transcendent shift of corporate goals from a socio -
economic focus towards increasing Stockholders value to the benefit of various
stakeholders. These social demands characterize a move in the meaning of CSR and
smear a growing prominence on social impact (Forester 2009). More and more
5
businesses are instigating environmentally responsive practices into their professional
tactics. Even the government with its duty of shielding the benefits of the general
public would logically be leaning towards the companies which take care of the all
the stakeholders interests (Krishnan and Balachandran 2010).The genuine effect of
CSR performance and its link with financial performance of businesses have
undergone intensive studies over the last two decades in over a hundred researches, the
conclusions of which have been partly questionable and sometimes self-contradictory
(Nopanene 2013) (Paskert 2008) (Rowley and Berman 2000; Walsh, Weber and
Margolis 2003). An integrated conclusion about the CSR and CFP relationship has
not been reached. (Qui Yang 2012). Although wide-ranging research on CSR-CFP
has been conducted in countries that are developed, there is a paucity of such researches
in India (Tyagi 2012), especially in the automotive sector.
The evolution of the automotive sector also carries with it the challenges allied with
rapid depletion and the mounting cost of fossil fuels, the negative impact of vehicles
on the environment and climate change. These are areas of severe concern not only to
the Governments worldwide but also to industry experts and automotive leaders
across the globe.
Hence, CSR has become an progressively significant concept for business strategies in
the automotive industry. Today, the stakeholder groups not only demand companies
to be involved in activities related to social and environmental issues but also expects
to be communicated about the magnitudes of their processes (Daub 2007).
Corporate Social Disclosure is a vital instrument for connecting with stakeholders for
corporation’s social responsibility initiatives. Global surveys and comparative

6
researches specify a noteworthy gap between various countries in CSR disclosure
practices. (Hassan 2010).
This study aims at investigating two relationships:
1. The association between corporate social responsibility initiatives taken by the
companies and financial performance of companies in the automotive sector.
2. The association between corporate social responsibility disclosure level and
financial performance of companies in the automotive sector.
1.4 Research Gap
In India, among accessible literature, only few studies on CSR and CFP exists.
Therefore, the lack of authentic measures in Indian studies impelled a study with more
dependable measures and indicators, thereby crafting a rationale for conducting further
research and providing empirical evidence. The other research gaps that have been
identified are:
1. No research has been conducted till date that examines the degree of CSR
disclosure by companies in the Automotive Sector. Various researches have
been conducted to analyze CSP and CFP in mining companies, FMCG
Companies, textile companies, etc. establishing a negative or positive or a
neutral relation. But examining the association of CSR Initiatives and its
disclosure with the financial performance of the companies in automotive sector
has rarely been in the purview of the researches.

7
2. The CSR Disclosure has not been examined through a Self-Composed
Disclosure Index formed by considering both the Global Guidelines and Indian
Guidelines. The GRI-G-3 guidelines have been the basis of understanding the
CSR Reporting for many studies. Some studies had also considered ISO-
26000, AA-1000 and the Ministry of Corporate Affairs issued National
Voluntary Guidelines. No study has made an attempt to compare both the
global and Indian guidelines to establish the CSR Reporting dimensions.
3. India has a lot of scope for research in this area. CSR, known as the concept
of West, is deliberated to be more of a emerging activity in the Indian
commercial sector than a recognized trend in general. Although wide-ranging
research on CSR-CFP has been conducted in advanced and established
countries, there is a paucity of similar researches in India.
4. The new Companies Act 2013 has made CSR expenditure to be a mandate. It
becomes necessary to understand the perception of the employees of the
automotive companies towards the implementation of the new provisions.
1.5 Justification of Study
Traditional management practices and thoughts embrace that a corporate is
essentially a strong economic engine to drive stockholders wealth. This no longer
stands true in practice. Now, it is believed that the idea of economic progress and
social development should go hand in hand. The reliability and transparency about its
functioning to society can make possible to co-exist business with success, justifying

8
the emergence of corporate social responsibility and its disclosures in corporate
reporting (Goswami 2011). One important observation from the literature on social
performance and financial performance is that majorly studies are from developed
countries and a lack of evidence exists about emerging markets like India.
(Tyagi2012). Statistically examined, studies on CSP and CFP relationship taking the
regulatory guidelines, both Indian and global as a parameter of measuring CSR is
missing. There is a dearth of such literature and need for the study on CSP and CFP is
being deeply felt.
Current researches on CSR in India is mostly confined to assess the CSR expenses’
impact on the financial performance (Bedi 2010), examine the effect of CSR towards
primary stakeholders and its influence in performance of Indian firms using
perceptual data (Mishra and Suar 2010), assess the financial performance of Indian
firms with CSR using Market Value Added (MVA) and Economic Value Added
(EVA) (Mittal 2008) , study the effect of corporate governance performance of Indian
companies on their financial performance (Singhania 2011), (Banerjee 2009),
examine the social performance impact on shareholder returns by comparing
Environmental, Social and Governance (ESG) portfolio with Market portfolio of
Indian firms (Vasal 2009).The impact of CSR Disclosure on CFP has not been
explored in any of these studies.
Moreover the Automotive sector remains entirely untapped by the researchers. This
study is expected to make contribution to knowledge in the following areas: It aims at
giving insight about CSR, its need and significance in general and specifically in
relation to the Automotive Sector.

9
The study will provide information on the Corporate Social Responsibility initiatives
taken by the corporations in the automotive sector and the disclosure of the same for
the stakeholders. Further the study will analyse the relationship between the CSR
initiatives and CSR disclosure by the companies and their Financial Performance.
The understanding of the CSR provisions of latest Companies Act 2013 is also a
major aim of the research. The study is also directed to gauge the perception of the
employees of automotive sector regarding the execution of the latest provisions of
Companies Act 2013, relating to CSR
1.6 Research Objectives
1. To examine the Corporate Social Responsibility initiatives of the select
companies in Automotive Sector in India.
2. To analyse the relationship between Disclosure(s) of Corporate Social
Responsibility initiatives and the Financial Performance of the companies.
3. To examine the perception of employees regarding the implementation of the
new Companies Act 2013 provisions being followed by the companies.
4. To analyse the relationship between Corporate Social Responsibility
initiatives and the Financial Performance of the companies.
10
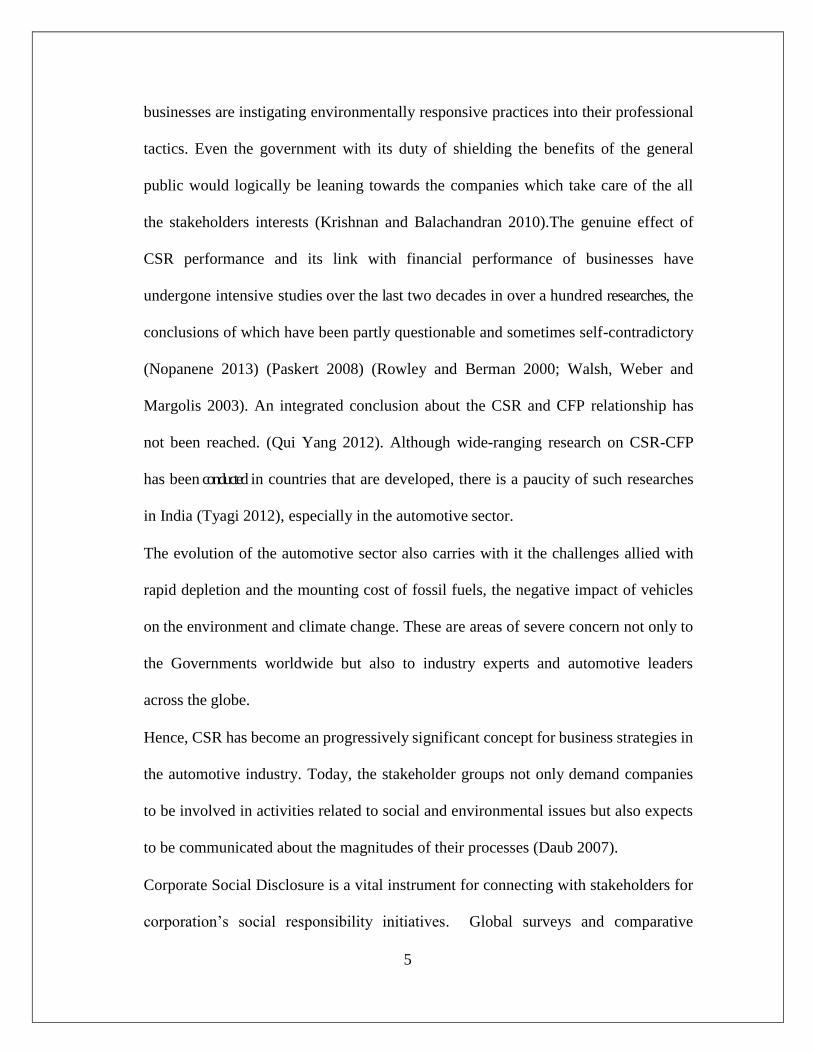
1.7 Significance of the Study
It is Indian industry‘s growing prominence as a social and economic actor in the
national and global arena that mandate an examination of its social responsibility.
This provides an impetus to CSR research and practice. Also, the progression of the
transportation sector in India transmits with it the challenges allied with quick
depletion and the mounting cost of fossil fuels, the effect of vehicles on the
environment and climate change. These are areas of severe concern to the
Government of India, industry experts and automotive leaders. Hence, CSR has
become a progressively significant concept for business strategies in the automotive
industry.
1.7.1 Theoretical Concern
1. Theoretically, the present study seeks to explore the extent to which CSR
initiatives have been taken by the companies in the automotive sector
highlighting the distinct areas in which the companies are contributing
regularly and those which are being ignored.
2. The study will help in understanding the extent of regulatory guidelines
followed by the companies for disclosing their CSR initiatives, which are
becoming of utmost significance to the stakeholders.
3. The findings of the study may help understanding the perceptions of
employees of the organisations towards implementation of the new
provisions towards CSR practices.
4. Since, not much research has been done in the field of CSR and its disclosure

11
in India, especially in the automotive sector, this study would be a
significant contribution to the existing body of knowledge.
1.7.2 Practical Concern
1. With this study the Indian companies’ managers can be acquainted with the
reporting guidelines followed internationally and the same can be followed to
make themselves globally competitive in the area of communal
responsibility.
2. The focus of thesis in understanding the impact of the disclosure of the
sustainability information by the automotive companies on their financial
performance will help these companies to take the essential step to enhance
their productivity and profitability.
3. The segregation of the sustainability factors into economic, social and
environmental factors will help companies in achieving the Triple Bottom
Line Effect, augmenting the stakeholders’ trust in the companies.
4. The study may promote the introduction of a strict and mandatory internal
policy for CSR contribution.
5. The study may result in the introduction of more counselling and
motivational programs in the companies to increase the awareness among
the employees about the significance of the CSR activities and its effect on
company’s profitability and public image.
6. The study of relationship between CSR and CFP may give an insight to the
companies to take a judicious decision regarding investment in CSR
initiatives.

12
1.8 Limitations
1. The study is focused on one sector (automotive sector) with relatively small
sample size.
2. The companies that have been selected for the study are on the basis of the
guidelines given by the Companies Act, for a business to invest in CSR
initiatives. The other businesses of the automotive sector are beyond the
room of the study.
3. CSR Disclosure Index prepared by self could not account for all the possible
dimensions to measure corporate social responsibility. The company’s
financial performance is affected by many other variables.
4. Studying the effect of CSR initiatives and its disclosure cannot be
considered as a sole parameter to study the effect on the CFP.
1.9 Organisation of Dissertation
The thesis structure is organized as follows:
Chapter 1- Introduction
The chapter begins with giving an insight to the notion of Corporate
Social Responsibility (CSR), setting the background of the research,
defining the problem statement, identifying the research gap. The
justification of study is also explained in detail and the research gaps are
identified followed by setting of the objects of the present study. The
limitations of the research are also stated.

13
Chapter 2- Literature Review
The chapter gives a detailed literature review: both historical and
contemporary. The historical perspectives of CSR are discussed followed
by the concept of Triple Bottom Line Reporting. The emerging theories
and models in India are detailed with emphasis on Stakeholder’s Theory
and Carroll’s Model. The literature related to Corporate Social
Responsibility and Corporate Social Performance, concept of CSR
Disclosure and finally the connection between CSR Disclosure and CFP
have been discussed, followed by the conclusion of the literature review
done.
Chapter 3- Theoretical Framework:
In this chapter, an insight to the concept is given including the definitions,
the related terminology, the need and significance and the committees of
CSR. The chapter further discusses the initiatives taken by the select
companies in the automotive sector in India. And finally, the chapter
explains the CSR disclosure guidelines both national and global, in detail.
Chapter 4- Research Methodology
The chapter starts with the development of the hypotheses of this research
study. After this, the data collection methods, selection of sample from the
target population, identification of independent, dependent and controlled
variables are discussed. Thereafter, the creation of CSR Disclosure Index is
detailed followed by the coding procedure for the content analysis. The
Questionnaire development procedure is explained in detail. Finally the
14
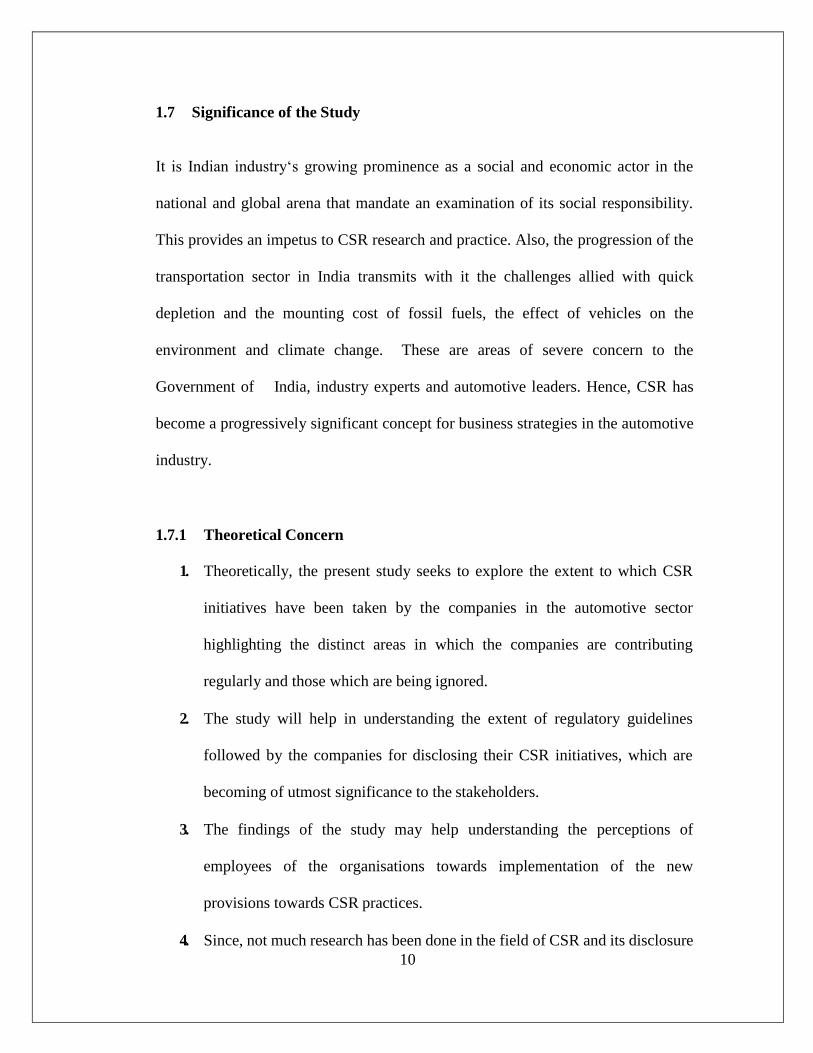
statistical techniques and tests used are discussed.
Chapter 5- Data Analysis and Interpretation
This chapter is separated into four sections. The first unit analyses the
guidelines followed by the sample companies for disclosing CSR
activities, followed by the year wise disclosure analysis of the CSR
activities. The second section analyses the relationship between CSR
Disclosure and the CFP using Multiple Regression Analysis. The third
section analyses the employees’ perception on the New Companies Act
2013 provisions followed by the corporate and the last section analyses
the association between Corporate Social Responsibility initiatives and the
Corporate Financial Performance using Factor Analysis and Structural
Equation Modelling.
Chapter 6- Findings, Conclusions and Recommendations: The last
chapter of the study gives the findings and conclusions of the study
followed by recommendations and scope of further research.

15
LITERATURE REVIEW
Chapter 1 highlighted the broad framework of the concept of Corporate Social
Responsibility and its rationale in automotive sector. The Disclosure Guidelines for
CSR reporting have also been elaborated. This chapter gives a detailed review of the
studies: both historical and contemporary. The purpose is to provide a background to
understand the focus area of the study and clarify the reason for the investigation of
the problem identified.
2.1. Historical Perspective of CSR Abroad and in India
Corporate social responsibility is a debatable term. Sheldon, first cited the concept of
corporate social responsibility (CSR) in 1924 and suggested the concept of CSR in
his book “The Philosophy of Management”. Since then, many different opinions on
this concept had been advanced by academics and organizations (Qui 2011). Bowen
(1950), usually taken as father of CSR (Carroll 1999), wrote a book “The Social
Responsibilities of business man” and opined CSR to dominate the society- business
interface (Singh, 2010). However, its conceptualization is still elusive (Shen 2006).
The necessity of CSR for all businesses has been acknowledged during the 1950‘s
and 60‘s by scholars (Carroll 1979) (Kantanen 2005) and occupational people. (Davis
1960) famous for his ―Iron Law of Responsibility, which detailed the social power of
capitalists should be equivalent to their communal responsibilities, considered CSR to
be a rather an ambiguous construct but still claimed it to be seen within the
management background. The more socially responsible business people are

16
expected to possess more social power. However, Milton Friedman‘s views stand
different from the mainstream society beliefs for CSR (Forester 2009). The late 1970s
witnessed a more structurally investigated and articulated four-part CSR definition
(Carroll 1979) signifying that companies have four responsibilities: economic, legal,
ethical, and philanthropic. Between 1970 and 1990, concepts related to environment
such as sustainable development came into existence (Marquina, 2007). The 1980‘s
upsurge a new era for CSR research. The stakeholder theory contributed significantly
to the development of CSR between the 1980s and 1990s, proposing that a firm is a
node of contracts between stakeholders (Putten 2005).The researchers still sustained
the development of investigating CSR concepts than putting an effort to narrowly
describe the construct towards the end of 1990. CSR as a concept has been identified
with various terminology like corporate social responsibility, corporate citizenship,
corporate philanthropy, global citizenship and corporate sustainability, to name a few
(Garriga and Melé 2004) (Kotler and Lee 2005). CSR institutes a robust commitment
to social responsibilities throughout the organizational culture, which highlights on
the implementation of the obligations towards the employees and containing them in
responsible accomplishments (Devi Sharma 2009).
Not only globally, CSR as a concept has its evolution and prominence in India also,
marked by a long custom of patriarchal philanthropy. The concept has been followed
since ancient times in the form of helping the poor and disadvantaged. In the pre-
industrial era, philanthropy with religion were the crucial CSR drivers. In the 19th
century, the business families, had a robust predisposition towards philanthropy and
other communal considerations. The merchant class in pre-industrial India had a

17
significant role to play in setting the cornerstones of philanthropy in their society
(Shrivastava and Venkateswaran 2000) by donating for construction of public
buildings like hospitals, libraries, and training institutes. The Birla mandir by famous
Marwaris- Birlas with the construction of public buildings like hospitals, libraries, and
training institutes and the Tata memorial hospital and Institute of fundamental research
by the Tatas, built in 1940s are the major landmarks of the beginning of philanthropic
activities in India.
Mahatma Gandhi’s Trusteeship Concept
Mahatma Gandhi introduced concept of ‘Trusteeship’ as an attainable norm for
business community in India to promulgate the idea that companies were like trustees
of the society’s wealth for its well-being (Mitra, 2007). In his social trusteeship
theory, Gandhi transmitted that God’s assets are for all God’s people, and is not for
egocentric spending by any individual and the private custody of property should
serve society’s best interests (Khan 2009). In the past, corporate houses have
remarkably donated in the form of old clothes, books, blood donation camps, donations
to orphanages, hospitals and homes for the elderly and scholarships for the feebler
sections of the society. Donations during disasters were another mode of philanthropy
(Sharma 2011) and the major cause behind these activities was to be in the good
books of the general public. Eventually, 1990 to 2001 was recognized as a period of
entrenching socially responsible principles into the corporate mission, strategy and
actions (Ocran2011). A move in attention from charity and customary charity towards
direct commitment of corporate in conventional expansion and understanding of the
underprivileged society groups (Bajpai 2001) has made CSR not just a green washing

18
activity but it actually has a positive impact to the surrounding environment and
community (Nopanen2013). A major challenge for CSR in India is the lack of
community participation in CSR activities. Little or no knowledge about CSR exists
within the local societies as people are not made aware of the relevance of this
concept (Berad 2011).
2.2. Some Previous Researches in CSR
The global development of the concept of CSR has led to more scholars pay their
consideration for CSR in the arena of business practices. Among these studies, the
major focus has been the association between corporate social responsibility and
corporate financial performance enabling corporate to fulfill the most fundamental
target of an organization i.e. to generate monetary benefits, and the most fundamental
social responsibility i.e. responsibility to stockholders (Qui Yang 2012) between
1971 and 2001, more than hundred published studies observed the relationship
between corporate social responsibility and financial performance (Margolis and
Walsh, 2002) with a negative relationship (Wright and Ferris, 1997) or a positive
relationship (Posnikoff 1997) or no relationship (Welch and Wazzan 1999) between
CSR and financial performance (Tsoutsoura 2004).
Ghosh Sumona (2015) conducted an analytical study which explored the design of
disclosures of corporate social responsibility (CSR) activities made by the private
sector corporations in the public documents. CSR participation was measured by
analyzing the companies’ websites for the period of two years and ‘number of
sentences’ was used as a measurement unit of. C o rrelation, multiple regression
19
analysis along with conjoint analysis was applied and it was determined that the major
contributing and favored CSR areas were education, health and environment.
Ahamed et.al (2014) examined three Malaysian firms for the period from 2007 to 2011
to understand if the CSR dimensions like environment, community, market place and
work place has positive, negative or neutral relationship with corporate financial
performance dimensions like Return on Asset (ROA) and Return on Equity (ROA).
The secondary data collected from corporate annual report was analysed using
content analysis and then the relationship was tested by using regression analysis.
The study concluded a positive relationship between CFP and CSR practices
collectively with size of the firm and revenue of the firm as control variable.
Moenna (2014) investigated the top fifty listed companies from the European Union
(E.U.) for the association of CSR with CFP using one accounting-based measure ROA
and one market-based measure EPS. Risk, firm size, industry, R and D intensity were
taken as the controlled variables. The relationship was analysed applying two
regression models and the results suggested a positive association between CSR and
CFP
Singh Shruti (2014) investigated the corporate social responsibility (CSR) disclosure
impact on the firm’s financial performance in three UK industries viz., crude
petroleum and natural gas, mining and pharmaceutical products manufacturing, over
five years ranging from 2008 till 2012. The CSR disclosures were measured in terms
of published CSR keywords in the annual reports of the firms and the financial
dimensions were return on assets (ROA) and total shareholder returns TSR). A
linear regression on the data validated no significant CSR disclosure impact on the

20
financial performance for the chosen industries in UK.
Valmohammadi Changiz (2014), in his study of 207 Iranian organisations provided
valid paradigms of CSR and a dimension instrument of the core subjects of ISO 26000
standard. The statistical analysis using structural equation modeling revealed number
of noteworthy relationships between organizational performance and CSR initiatives.
The practices like community participation and progress plays a significant role in
augmenting performance of organizations.
Zaborek Piotr (2014) explored the link between social responsibility involvement and
financial performance between Polish small and medium manufacturing companies in
food and cosmetics industries. A structural model was developed and tested on the
data from a survey of 187 managers. The outcomes suggested a weak and significant
positive correlation between the CSR construct and sales profit margin, no discernible
direct effect of CSR on ROA.
Aile and Bausy (2013) examined the relationship between CSR activities subdivided
in five categories (workplace, market place, environment, community and other CSR)
and firm financial performance measured through ROA in the Baltic States of Latvia,
Lithuania and Estonia. The content analysis methodology to measure CSR and
regressions are run and results showed that certain CSR categories had an impact on
ROA. CSR activities related to market place and environment seem to decrease firm
financial performance, while other CSR activities, like adherence to CSR standards
increase ROA. In the Baltic societies, people are apprehensive to pay more for products
delivered by socially responsible companies

21
Ghelli Caterina (2013) understood the existence of “industry effect” by examining the
direction of the correlation between CSR and CFP. The regression results confirm the
presence of a significant positive relationship between corporate social responsibility
and financial performance. This relationship focused both directions, as CSR is
influenced by the firms’ financial performance and at the same time influences it too.
Khan and Hassan (2013) engrossed on understanding a relationship between CSR and
CFP for Pakistani public companies. These annual reports were descriptively analysed
and it was observed that companies CSR activities cover at least two or three pages
and companies are involved in areas regarding these activities but not completely
covering the monetary aspect. The focus was on the association between quantity
consumed on CSR activities and association with the ROE and Net Income.
Abiodun (2012) examined the association between corporate social responsibility and
firms’ profitability in Nigeria. Ten (10) firms were randomly selected and their annual
reports between “1999-2008” were studied for the research. Ordinary least square
method was used for the analysis and it was showed that the investment by sample
firms to social responsibility is less than ten percent of their profits in a year. It was
also analysed that the variations in selected firms’ corporate social responsibility
(CSR) in Nigeria caused changes in performance (PAT).
Cahan et.al (2012) investigated a global sample of companies drawn from 22
countries to understand the connection between CSR disclosures and firm
performance. The results indicated no relation between the two which suggested that
these disclosures are uninformative. It was summarized that profits from CSR
activities are not realized with immediate effect. Hence, firms with not so good CSR
22
accounts might emulate the increased level of disclosures of great CSR performers,
lowering the significance of CSR disclosures.
Iqbal and Ahmad (2012) estimated the relationship of CSR, CFP, financial leverage
and market value of the share. They studied 156 companies listed on Karachi Stock
Exchange (KSE) from chemical, textile, tobacco and cement sectors for the period of
2010 and 2011. The study concluded that corporate social performance (CSP) has
negative effect on the share’s market value, no effect on corporate financial
performance (CFP) as well as D/E behavior.
Qui Yang (2012) used regression analysis on the accounting indicators of 839
Chinese listed companies in 2010 and measured the association between the
companies’ social responsibilities and their financial performance and established
that social responsibilities to employees had moderately positive influence on the
financial performance unlike that to other investors which do not significantly
influence the financial performance of Chinese listed companies. There is not so
optimistic CSR situation in China.
Raza et.al. (2012) using content analysis, aimed to examine connection between
corporate social responsibility (CSR) and corporate financial performance (CFP) from
1972 to 2012. They concluded the existence of a strong and positive relationship
between CSR and CFP. Tobin’s Q was used as a financial performance measure and
the study consented the other researches which found positive relationship between
CSR and CFP using ROA, ROE and ROS as financial performance measure. The
study differentiated from the studies which using stock market returns as financial
performance measures found relationship between CSR and CFP, which was negative.

23
Yin (2012) researched to comprehend CSR development in China over the last few
years and measured the CSR effects on performance of the firm by inspecting the CSR
reports for 2008-2009. With Chinese companies progressing in their CSR practices,
the research exhibited that the financial performance of the previous year is positively
connected to CSR disclosure and in the next year the CSR disclosure has a positive
noteworthy effect on the firm financial performance.
Esra Nemli Caliskan and Yusuf Ayturk (2011) examined the relationship between
financial performance and reputation of the businesses in Turkey for the period
between 2000 and 2010. The results of this research indicated that there is no causal
association between corporate reputation and corporate financial performance
measures of MBV and ROA. The results also indicated that ROE improves corporate
reputation but corporate reputation have no impact on ROE.
Montoya Monica (2011) conducted the study to inspect the effect of innovation on the
CSP-FP relationship. CSR data was collected from Sustainalytics (for 2008 and 2009)
and the financial data from Capital IQ (2007 and 2009) were used to carry out a
regression analysis. The analysis suggested that there is no effect of role of innovation on
the CSR-FP. Also, there does not exist statistical significance on relationships between
CSP, FP and innovation.
Singhania (2011) determined the influence of score of corporate governance on
financial performance of Indian corporate on Nifty 50 companies between the years
2000 and 2009. The study gauged the effect of corporate governance on performance
of firm by computing corporate governance score. The study also analyzed the influence
of the newly constructed corporate governance score and eight variables on financial

24
performance. The analysis highlights that corporate governance scores, when
controlled with other variables, significantly impacts Tobin‘s Q of Indian companies.
Choi and Kwak (2010) studied the connection between corporate social
responsibility (CSR) and corporate financial performance, empirically on 1222
Korean firms for the period of 6 years. The methods used were both an equal-
weighted CSR index and a stakeholder-weighted CSR index. Return on assets, return
on equity, and Tobin’s Q were variables used for measuring CFP. The relationship
between corporate financial performance and the stakeholder- weighted CSR index
were found to be positive and significant but not positive with the equal-weighted
CSR index.
Harpreet Singh Bedi (2010) examined for the financial year 2007-08, 37 companies
rated by Karmyog (Mumbai base NGO), using correlation and regression as a
statistical tool. The study revealed the existence of a positive relationship between CSR
and financial performance and the inferential measures showed the dependence of
Corporate social expenditure on the financial performance of the company. A
minimal and negligible spending on part of the companies’ social responsibilities was
observed.
Gamerschlag Ram et.al (2010) showed a positive association between CSR
disclosure and shareholder ownership arrangement. The company’s profitability and
firm size affects the CSR disclosure. It was observed that a higher level of
environmental disclosures was made by the ‘‘polluting industries’’ companies the
disclosure by small companies was less than that by big companies.

25
Mishra and Suar (2010) studied whether CSR towards primary investors had an
influence on the Financial Performance (FP) and the Non-Financial Performance
(NFP) of Indian firms. The CSR and NFP information was collected through a
questionnaire survey (6 CSR dimensions) from 150 senior level Indian managers and
the data related to financial variables of firms was sourced from secondary sources. It
was found that listed firms displayed better socially responsible practices and
financial performance than the firms which were not-listed.
Saleh Mustaruddin and Muhamad Rusnah (2010) using longitudinal data analysis,
examined the link of CSR to financial performance for Malaysian companies.
Although CSR disclosure concept is at a budding stage in Malaysia, still it was
established that CSR disclosure and financial performance are positively related. The
findings confirmed that the social activities by local firms help them achieve
advanced levels of financial performance.
Yang Fu-Ju, Lin Ching Wen and Chang Yung-Ning (2010) studied corporations
listed in the TSEC Taiwan 50 Index and using regression analysis analyzed the
connection between CSP and CFP. The study highlighted that former CSP impacted
ROA positively.
Sweeney L (2009) through semi structured interviews with some large firms and
SMEs in Ireland, found that CSR was established to have a strong association with
social reputation, motivation and retention, employee attraction and consumer
attraction and loyalty and with other business profits projected to result from CSR, a
weaker relationship

26
Rim Makni and Claude Francoeur (2008) assessed the causal association between
corporate social performance (CSP) and financial performance (FP) by applying
experiential analyses on 179 Canadian companies using the measures of CSP
provided for the period of two years. The study used ‘‘Granger causality’’ approach,
and it was examined that there exists a significant relationship between a firm’s CSP
and FP, excluding market returns. Nonetheless, individual parameters of CSP were
used and a substantial negative influence of the environmental dimension of CSP and
three parameters of FP, namely return on assets, return on equity, and market returns
was determined.
Beurden and Gössling (2008) attempted to elucidate the long discussion between
CSR and Firm Financial Performance (FFP) by conducting a detailed meta-analysis.
This study showed that the majorly (68%) of the researches examined a positive
relationship while 26% convinced of an insignificant association between CSP and
CFP. 6% studies highlighted a negative relationship between the two variables.
Vijaya Murthy (2008) in his study on 16 top Indian software firms concluded that
human resource was the most recurrently reported attribute which was followed by
community growth initiatives taken by the companies and the minimum reporting
initiatives were related to the protection of environment.
Ducassy and Jeannicot (2008) examined the impact of CSR information on the
behaviour of the investors. The study of three years period on a sample of fifty
companies investigated the reporting rankings produced by an independent
o r gan i sa t ion a l bod y for the CSR initiatives taken by the companies. The
companies with high rankings or the ones, which have regressed the most in rank
27
since the previous year, are in the priority list of the investors.
Lo´pez Victoria and Garcia Arminda (2007) examined the consequence of the
adoption of Corporate Social Responsibility (CSR) practices on business
performance. The relation was analysed and it was examined that there was
substantial alterations in indicators of performance between European firms which
have and have not adopted CSR. A group of 55 firms belonging to the DJSI and other
to Dow Jones Global Index (DJGI) but not on the DJSI were studied for the six-
years period. The study analysed that performance between firms belonging to the
different indices was differentiated according to the CSR practices.
Margarita Tsoutsoura (2004) explored and resulted over the period 1996-2000,
positive and statistically significant liaison between corporate social responsibility
and financial performance of most of the S&P 500 firms. This reinforced that socially
accountable business initiatives and activities can be connected with a series of benefits
related to people, profit and environment.
McWilliams and Siegel (2001) confirmed the association between CSR and CFP
with a regression model demonstrating the enclosure of a firm in the Domini 400
Social Index as the measure of social performance. Annual average values for 524
large U.S corporations for the period 1991-1996 was regressed. The model included
a dependent variable measured by financial performance and independent variables
measured by social performance, industry, and research expenditure as. Their
conclusions suggested that including research and development variables in the
model resulted the CSR variable to be insignificant, concluding a CSR-CFP linkage
may not exist.
28
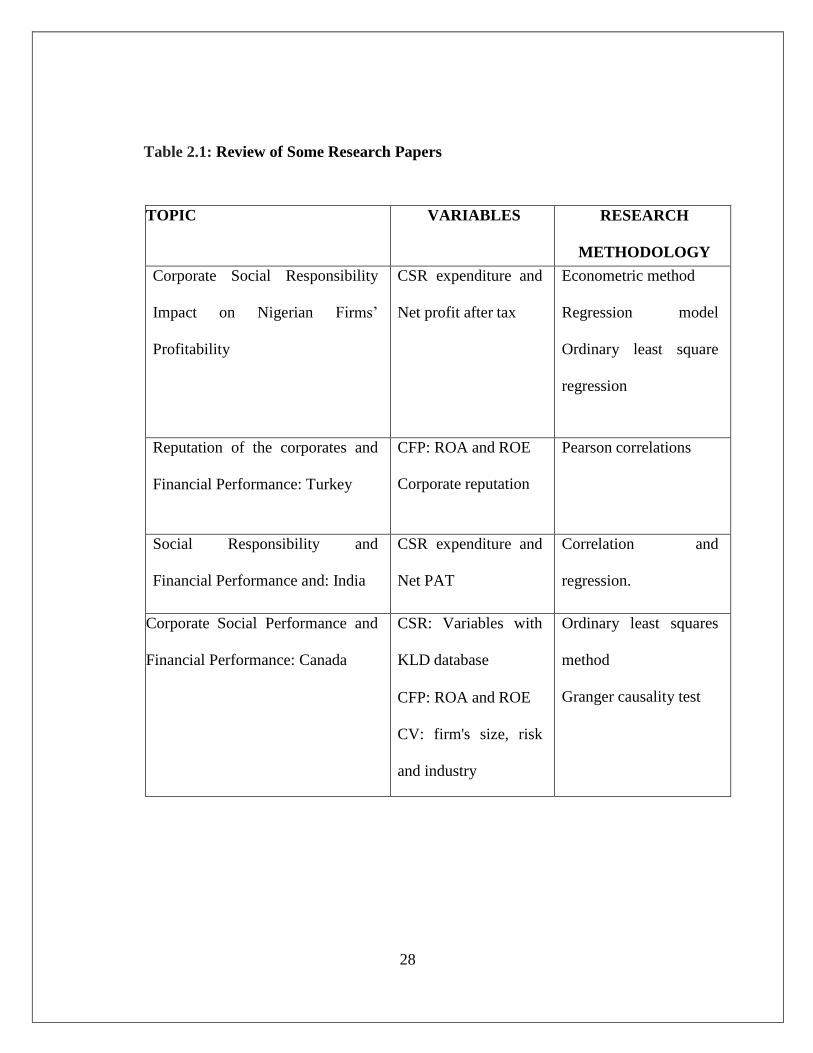
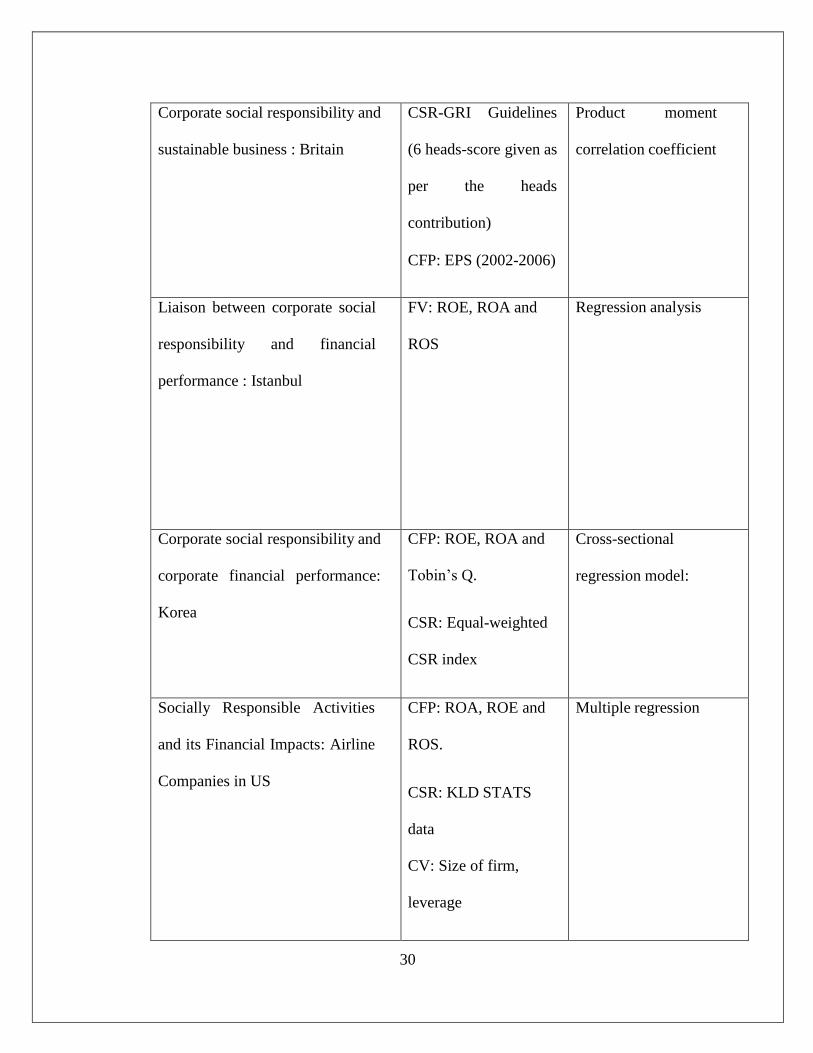
Table 2.1: Review of Some Research Papers
TOPIC VARIABLES RESEARCH
METHODOLOGY
Corporate Social Responsibility
Impact on Nigerian Firms’
Profitability
CSR expenditure and
Net profit after tax
Econometric method
Regression model
Ordinary least square
regression
Reputation of the corporates and
Financial Performance: Turkey
CFP: ROA and ROE
Corporate reputation
Pearson correlations
Social Responsibility and
Financial Performance and: India
CSR expenditure and
Net PAT
Correlation and
regression.
Corporate Social Performance and
Financial Performance: Canada
CSR: Variables with
KLD database
CFP: ROA and ROE
CV: firm's size, risk
and industry
Ordinary least squares
method
Granger causality test

29
Financial Performance and
Corporate Social Responsibility
CSR:KLD rating data
CFP: ROA,ROE,ROS
Cross-sectional time
series regression analysis
Relationship between Disclosure of
Corporate Social Responsibility and
Financial Performance: An
Empirical Examination: Malaysia
CSR:disclosure-
content analysis:
CFP: ROA, ROE and
ROS
Regression analysis
Corporate social performance
and corporate financial
performance : Taiwan
IV: CSP
DV: CFP
CV: size and R&D
Regression analysis
Corporate Social Responsibility in
India and its Corporate Reporting
Practices
CSR Disclosure Index Constructing CSR
Disclosure Index
Corporate Social Responsibility and
Financial Performance: Correlation
or Misspecification- Europe
CSP: Ranking by KLD
Index
CFP: ROA, R & D
Regression Analysis
Corporate financial performance
and Corporate social
responsibility: China
CSR: Survey (Likert 5
scale)
CFP: ROS, ROA and
GRS
Factor Analysis
Multi- regression
30
Corporate social responsibility and
sustainable business : Britain
CSR-GRI Guidelines
(6 heads-score given as
per the heads
contribution)
CFP: EPS (2002-2006)
Product moment
correlation coefficient
Liaison between corporate social
responsibility and financial
performance : Istanbul
FV: ROE, ROA and
ROS
Regression analysis
Corporate social responsibility and
corporate financial performance:
Korea
CFP: ROE, ROA and
Tobin’s Q.
CSR: Equal-weighted
CSR index
Cross-sectional
regression model:
Socially Responsible Activities
and its Financial Impacts: Airline
Companies in US
CFP: ROA, ROE and
ROS.
CSR: KLD STATS
data
CV: Size of firm,
leverage
Multiple regression

31
Superior Corporate Social
Performance and Improved
Financial Performance: Australia
CFP: ROA, ROE
and ROS.
CV: Total assets log
(size), P/B Ratio,
P/E Ratio.
Regression Analysis
Corporate Social Responsibility
(CSR) and CSR Web Reporting:
Asia
CSR Reporting on
website
Correlation
Corporate Social Responsibility :
Economic Dimensions : Fortune
Global 250 Reports
CSR: impact, size, link
DV: sector, region,
ROS, log sales
Correlation
Corporate economic and social
responsibility: A Trade-off:
Study across nations.
CSR and cultural
variables
CSR scale
Cross-national
invariance
Factor Analysis
Corporate Social Responsibility
Studies in S Africa: Critical
Analysis: Event Study
Abnormal stock prices
returns
Event study evaluation of
5 event studies
32
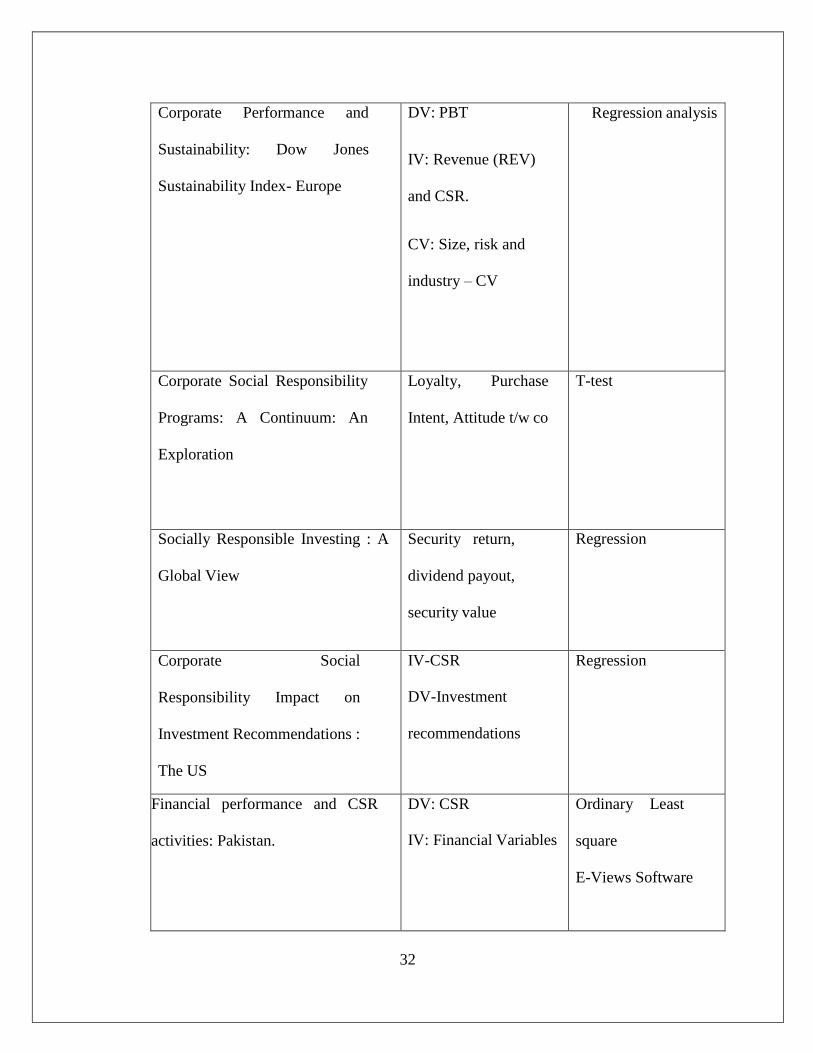
Corporate Performance and
Sustainability: Dow Jones
Sustainability Index- Europe
DV: PBT
IV: Revenue (REV)
and CSR.
CV: Size, risk and
industry – CV
Regression analysis
Corporate Social Responsibility
Programs: A Continuum: An
Exploration
Loyalty, Purchase
Intent, Attitude t/w co
T-test
Socially Responsible Investing : A
Global View
Security return,
dividend payout,
security value
Regression
Corporate Social
Responsibility Impact on
Investment Recommendations :
The US
IV-CSR
DV-Investment
recommendations
Regression
Financial performance and CSR
activities: Pakistan.
DV: CSR IV: Financial Variables
Ordinary Least
square
E-Views Software

33
Corporate social responsibility
activities’ Impacts on company
financial performance: North
America
Previous literature Previous literature
Corporate Social Responsibility and
access to finance (American firms)
CSR: social,
environmental and
corporate governance.
Cross sectional
analysis, regression
Corporate Social Responsibility
and Financial Performance :
Discontinuity Approach: The US
CFP: EBIT and ROA
CV: Size, Leverage
Regression Analysis
Corporate Social Responsibility
influence on Firm Performance of
Indian Companies
CFP: ROA
NFP: 12-item scale
CV-Oship, listing in
SE, size
Pearson correlations
Corporate Social Responsibility and
Financial Performance in Airport
Industry: Europe
CFP: Net Assets, Book
Value/EBITDA
Valuation
multiples (or peer
multiples)
34
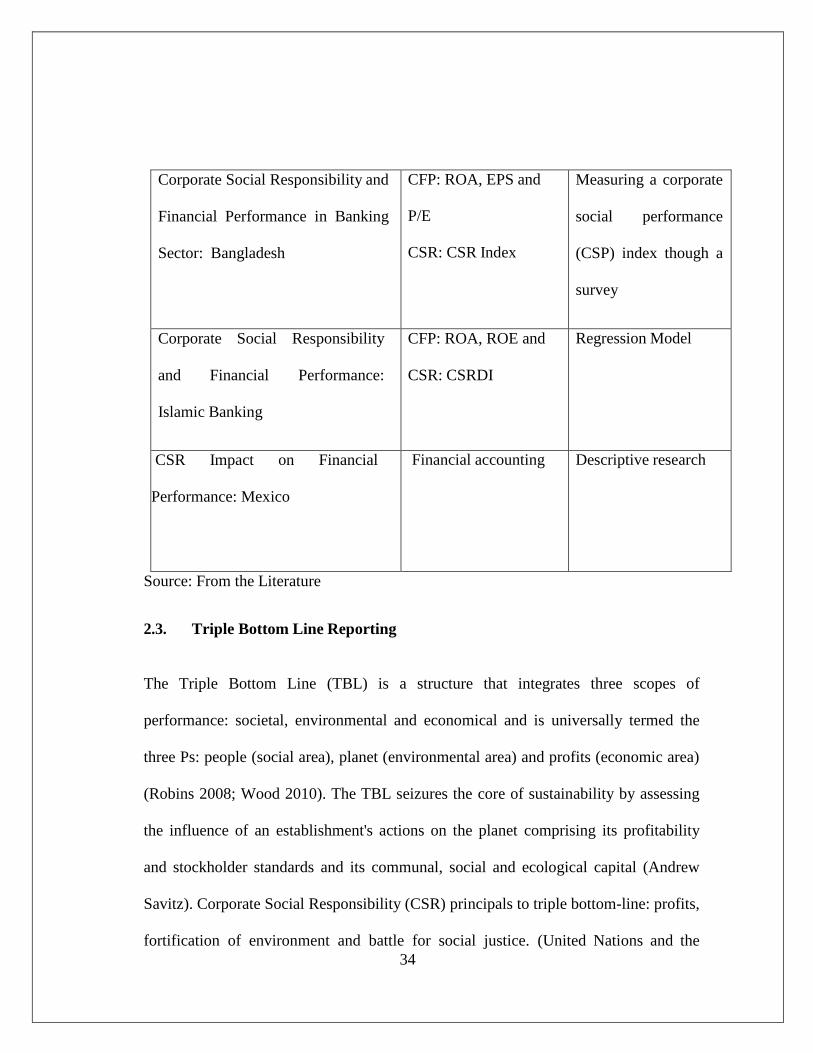
Corporate Social Responsibility and
Financial Performance in Banking
Sector: Bangladesh
CFP: ROA, EPS and
P/E
CSR: CSR Index
Measuring a corporate
social performance
(CSP) index though a
survey
Corporate Social Responsibility
and Financial Performance:
Islamic Banking
CFP: ROA, ROE and
CSR: CSRDI
Regression Model
CSR Impact on Financial
Performance: Mexico
Financial accounting Descriptive research
Source: From the Literature
2.3. Triple Bottom Line Reporting
The Triple Bottom Line (TBL) is a structure that integrates three scopes of
performance: societal, environmental and economical and is universally termed the
three Ps: people (social area), planet (environmental area) and profits (economic area)
(Robins 2008; Wood 2010). The TBL seizures the core of sustainability by assessing
the influence of an establishment's actions on the planet comprising its profitability
and stockholder standards and its communal, social and ecological capital (Andrew
Savitz). Corporate Social Responsibility (CSR) principals to triple bottom-line: profits,
fortification of environment and battle for social justice. (United Nations and the

35
European Commission) (Berad 2011). The concept and its core value of sustainability
has captivated the business world. Developed by John Elkington, the TBL concept has
changed the way profitable companies and non-profit organisations measure
sustainability by linking the ties between the social and environmental effect of
activities of an organization to its economic performance. As an extension of the
criteria used to measure organisational performance, the triple bottom line concept lay
emphasis on three criteria: economic, social and environmental. The easiest to
measure criteria of all the three is the financial or economic performance of a business.
The outflow and inflow of means from the corporate, commonly containing cash and
finances, assets, liabilities and other corporate incomes can be utilised to regulate the
monetary value of the orgnanisation. The net worth of the business can also be
assessed. The social standard of the TBL concept processes the influence that a
corporate has on employees and people outside the business (the community). The
basic premise is to act in a way that paybacks the community and confirm that the
business operations should not in any way oppress or threaten the individuals. Labor
utilization and wages, working conditions, employee benefit schemes are some of the
measures to be assessed under this criteria. Environmental performance is associated
with a corporates’ total influence on the natural environment. The concept aims to
improve the environment by limiting their negative impact on the environment caused
due to the environmental issues (like pollution, global warming etc.). Triple bottom
line reporting is gaining momentum globally not only amongst the large organisations
but also smaller ones. The commercial decisions and movements become more
transparent and people become more indulgent towards the business' level of corporate

36
social responsibility. The environmental, natural, economic, social, cultural and
political factors can be congregated into economic, societal and environmental areas
(TBL) to obtain sustainable development. The study has adopted Triple Bottom Line
as a base for measuring the CSR disclosures of the firm.
2.4. Emerging CSR Theories and Models in India
2.4.1. CSR Theories
2.4.1.1. Instrumental Theory /Utilitarian Theory
The theory considering the main objective of corporate to create profits for the
stockholders (Forester 2009) is the one in which the businesses are understood as
only a mechanism for wealth making, and its social undertakings are only a means to
accomplish economic outcomes. The theory considers CSR as a strategic device to
realize economic purposes, and eventually, wealth creation (Nam Yoonjae 2011).
These theories aim on increasing the benefit to stockholders (Friedman 1970),
strategize to attain competitive advantages (Porter and Kramer 2002), perform cause-
related marketing (Varadarajan Menon 1988) and fixating the economic feature of the
interactions between corporate and community. Utilitarian theory, taken together with
instrumental theories (Garriga and Mele 2004) (Jensen 2002) advises that the
business needs to assent social obligations and privileges to contribute in social co-
operation. Businesses with larger social performance incline to achieve better
economic results by enticing responsible customers (Choi and Kwak 2010) (Bagnoli
and Watts 2003), relieving the regulation threat (Lev et al., 2008), cultivating their
standing with consumers (Orlitzky et al 2003)

37
2.4.1.2 Political Theory/ Institutional Theory
Corporate social responsibilities come up to the corporation internally and these
responsibilities ascend from the social influence an organization enjoys. As per the
theory, the corporate is assumed as being like a citizen with contribution in the
community (Sharma 2011). As consequence the businesses accept communal duties
and rights or contribute in certain communal cooperation and do the necessary
disclosures. A type of political theory called the institutional theory consider the
disclosures’ legality, that can stimulates the stakeholders’ perceptions, of construct
greater trust and qualify the expansion of more lucrative corporate affiliations (Gray
2006) (Cho and Patten 2007). The firm has a ‘‘social contract’’ that necessitates it
and its managers to treat all stakeholders ethically and impartially in return for
creating and upholding this legal structure (Social Contract Theory). Institutional CSR
programs, and their all-inclusive approach to communal responsibility, can upkeep
firms meet their obligations and fulfill the social contract with all of the company’s
stakeholders (Pirsch and Gupta, 2006).
2.4.1.3 Ethical Theory/ Legitimate Theory
Ethical values are the basis of the relationship between business and society. This leads
to a CSR vision from an ethical viewpoint (Sharma 2011) that the firms must accept
social responsibilities as an ethical duty above any other contemplation (Yoonjae
2011). The hormonal relations between a company’s value system and value system of
the society makes the organization legitimate and the absence of the same lead to
absence of the company from the competitive market. The main standpoint

38
underlying this theory empowers companies to unveil the social responsibility
initiatives for the general public confirming that the activities of a organization are
desirable, correct, or suitable within some system of societal norms, values and
principles (Hassan 2010). Subsequently, CSR literature integrates legitimacy theory
when researchers are exploring the influences of social responsibility disclosures
(such as environmental disclosures) and fundamentally when systems of corporate
communication are under examination (Forseter 2009).
2.4.1.4 Integrative Theory/Stakeholder Theory
Business is dependent on society not only for its endurance and progress but also for
its existence itself (Yoonjae 2011). Hence, it has a societal responsibility and is ought
to integrate social demands. The integrative theories highlight the integration of business
demands (Garriga and Mele 2004). The society for business is not only narrowed down
to the direct stakeholders like employees, suppliers, stockholders, consumers, dealers,
but also the other significant stakeholders such as government, political groups, other
companies, and the society at large (Lee et.al.2009). Hence, Freeman’s stakeholder
idea has assisted to enlarge the opportunity of business responsibility by identifying
and protecting the different interests of various stakeholder groups (Anupam and
Chanda 2010). The fundamental notion of the stakeholder theory is that an
organization’s success depends on the degree to which the organization is proficient
of handling its relationship with all its stakeholders (Beurden and Gössling 2008).
After introduction of this theory by Freeman (1984) to CSR research area, the
stakeholders’ theory has become one of the core theories for CS Research (Qiu 2012),

39
specifically in CSR performance/CFP studies (Margolis and Walsh 2003). It is the
most influential framework (Donaldson and Preston 1995) to understand the real
interdependence of corporate and community (Porter and Kramer 2006).The theory
asserts that the efficiency of the organizations and the financial performance can be
increased by bring into line the corporate to meet the stakeholders’ desires (Palmer
2012) and broaden their objectives to comprise other goals along with profit
maximization (Ribera 2010). This theory and the CSR concept have been interrelated
(Ullmann 1985) by confirming that the relationship between communal disclosure
and societal and economic performance comprises of three dimensions: stakeholder
influence, the firm’s strategic locus, and the company’s historical and current
economic performance (Pirsch and Gupta 2006). The incorporation of stakeholder
theory is the most relevant framework for assessing CSP, based on the theoretical
development of CSP research (Ribera 2010). While the study of CSR is concerned
with what social responsibility of corporations is, stakeholder theory focuses on how
and to whom the social responsibility should be applied.
Slack Resource Theory
The resources needed by the company to successfully acclimatize are slack in nature.
Slack resource is any accessible or free and actual or potential resource (financial and
other organisation resource) used to attain the company’s certain goal (Tyagi 2012) that
is used as a buffer of companies to familiarize to internal burden or external
environment. The theory is founded on the opinion that a corporation is able to carry
out its doings because of the means owned by the company dedicated to the
predefined activities. Businesses with economic difficulties generally apportion their
40
resources in project with a short horizon. Better financial performance perhaps marks
the accessibility of slack resources providing the companies with the opportunities to
capitalize communal performance spheres such as public relations, employee
relations or environment (Waddock and Graves 1997). Supplementary slack
resources consequence in better financial performance, which would eventually
forecast better CSP.
2.4.2. CSR Carroll’s Model
Social receptiveness is the philosophy, system, or approach behind corporate
(managerial) response to communal responsibility and societal issues (Carroll 1979).
Corporate Social Performance is a multidimensional concept, with behaviours
fluctuating across assorted inputs like investments in controlling pollution or other
environmental tactics, internal performances or procedures like protection of
minorities and women, relationship with clients and outputs like communal relations
and philanthropic programs (Waddock and Graves, 1997).Carroll (1991) viewed the
1980s as a swing to more empirical exploration applying his predictable four-
dimensional pyramid model. Society not only necessitates corporations to accomplish
their economic assignment, but also to conform the law, price the ethics, and do
philanthropy work. He proposed four kinds of dimensions of CSR: economic, legal,
ethical and philanthropic (Uddin and Hasan 2008). All these four dimensions are not
mutually exclusive but these four dimensions pursued simultaneously by a company
mark it as socially responsible. The pyramid model suggests that the corporate houses

41
have different expectations to encounter at different stages in relation to corporate
social responsibility. Economic responsibilities being the core ones are followed by
compliance with the law. When the two most fundamental needs are met, the
companies need to meet the moral and ethical opportunities and finally they are
expected to contribute their energies to society, and make considerable contributions.
Figure 2.1: The Carroll’s Model
Source: Adapted from Carroll (1991)
The economic responsibility is the most central and vital responsibility of a business,
which imitates the spirit of business as a profitable entity. Companies have a
commitment to earn and offer profits to Stockholders; guarantee and secure their
interests in the corporations and institute a good association with them (Qiu 2012). This
dimension displays all the other layers, to accentuate the pre-eminence of this purpose
on the others without which it would not be possible to yield other responsibilities.
Philanthropic (Be a good corporate
citizen)
Ethical Responsibilities (Be Ethical)
Legal Responsibilities (Obey the law)
Economic Responsibilities (Be profitable)

42
The legal responsibility goes parallel with the economic responsibility as the
companies are expected to chase their economic objectives within the agenda of the
law (Carroll1991). In a free enterprise system, corporation must abide by the law and
play by the rules throughout its operations.
The ethical responsibility is the understanding and acceptance of the standards,
norms, or expectations that is regarded as fair and just by the consumers, employees,
Stockholders and the community (Carroll 1991). These responsibilities represent the
actions and practices that people expects (or prohibits) from an association, even if
they are not arrayed into law (Ghelli 2013).
The philanthropic responsibilities are discretionary. These are the corporate actions
that are in reaction to people’s anticipation that companies be good corporate citizens.
This comprises active engagement in deeds or agendas to encourage human welfare
or reputation (Carroll, 1991). There is a confusion between the concept of
philanthropy and CSR but as already discussed in the model that these
responsibilities are part of CSR (Fazio 2006). All these classes of duties have
occurred to some degree, but it has only been lately that ethical and humanitarian
purposes have been entitled to a noticeable place.
2.5 CSR and Financial Performance
The relationship between CSR and CFP has been studied intensively since the 1970s
and likewise reviews of numerous studies have been published for the past forty
years. For the past fifteen years, the workings of (Griffin and Mahon 1997),
(Orlitzky et al. 2003), (Margolis and Walsh 2001; 2003), (Allouche and Laroche 2005)

43
and (Margolis et al. 2007) were among the well cited and quoted (Nopanen 2013).
One of the first researches in the area of the impact of CSR on economic performance
is the work of Milton Moskowitz in 1972 (Jana 2014), the result of which confirmed
the positive result CSR had on the economic performance of the company
(Moskowitz 1972 and Kukačka, 2008). Vance (1975) followed up on the research of
Moskowitze and correlation analysis of the CSR and the growth of prices of shares.
In this case, a negative correlation was found between these two listed units. The
premise of the studies being whether a company’s financial performance will
progress or not if it performs more communal responsible i.e. does there exist an
association between corporations’ SR and its financial performance (Chen and Wang
2011). The association has been empirically scrutinized by many researches and many
theoretical discussions and debates have been happening regarding the positive
connection between corporate social performance and corporate financial
performance (Aras and Crowther 2007). Though, the causal relation of this linkage has
not been recognized and various empirical studies have established inconsistent
outcomes (Iqbal and Ahmad 2012). The different perspectives for the concept:
positive, negative or no relationship between CSR and firm’s financial performance
existed (Lee and Park 2012) with a plausible elucidation for the results that there have
been diverse types of studies on the relationships in which many different variables
were used to analyze the constructs (Ribera 2010) (Williams and Siegel 2000).
(Waddock and Graves 1997) deliberated the empirical link between financial and
societal performance and established a positive connection between CSR and prior
financial performance (Aras and Aybars 2010). Using ratings given by Fortune

44
magazine on corporate reputations many, studies analyzed the associations and
established that a company's previous performance, evaluated by both accounting
measures and market measures, was more accurately related to corporate social
responsibility than was subsequent performance (Uddin and Hasan 2008). One of the
prominent studies was the study that included meta-analysis of the past 30 years of
empirical studies on the CSP-CFP link (Ribera 2010). (Orlitzky, Schmidt and Rynes
2003) also supported the idea of the existence of a socially responsible and
financially profitable corporation. Researchers were able to justify the positive
relation (Chen and Wang 2011). The initial result that CSR will benefit the
corporation’s profitability and financial performance (Van der Laan et al. 2008) (Wu
2006) was followed by analyzing the data of 197 samples applied multiple
regressions, and it was concluded that there was a substantial correlation between
CSR and CFP. Further justification for the association was that CFP can motivate a
corporation to take CSR, as the business with good financial performance had more
potential to deal with communal difficulties (Mc Guire et al., 1988). A causal
connection between financial performance and CSR actions a firm undertakes was
recognized by traditional statistical tools, when businesses used time series fixed
approach, concluding a feebler association between the two (Khan and Hassan, 2013).
Even the longitudinal effects of CSR on CFP was examined in some researches by
encompassing a cumulative measure of CSR based on multiple years of CSR
performance and relating it to subsequent years of a firm’s financial performance
(Peters and Mullen 2009) of which the results supported that practicing CSR over
time leads to increased and enhanced CFP (Rebera 2010). The negative relation
45
between the Corporate Social Responsibility and Corporate Financial Performance
has also been the results of many researches by many neoclassical economists
(Waddock and Graves 1997) (Friedman 1970). They opine that socially accountable
firms have a competitive shortcoming because of the costs they sustain that fall
straight upon the bottom line and decrease incomes. The result of a negative
correlation between CSR and CFP specifies the need of conduct of more recent study
on this concept (Palmer Harmony 2012).
Many empirical results disclose insignificant association between CSR and financial
performance (Tsoutsoura 2004). In a research in which CSP was measured by ethical
rating and CFP measured by accounting and market ratios (Maaria-GaiaSoana 2011),
it was examined that here exist statistically insignificant connection between CSP and
CFP using correlation. As regards CSR-CFP link, there is no settled or identical
opinion among experts whether CSR influences financial performance of firm or is
strongly driven by financial performance. Most of the studies conducted showed
positive relation while others have encountered negative, curvilinear and spurious
relationships. Thus, mixed evidence was found about the validity of socially
responsible behaviour of firms and the role of CSP in creating value to a firm (Tyagi
2012).
2.6 Measures of Corporate Social Responsibility
The modus of how each company implements corporate social responsibility differs.
The differentiating factors could be company’s size, industry type, the firm’s
corporate culture, investor demands and the historic progression of the company in
engaging CSR. Not only is there a variance in the aspects but the focus area for CSR

46
activities also vary. Companies emphasize on a sole area that is observed as the most
significant for them and is highly vulnerable, be it human rights or the environment
or the society or all aspects of their operations. The efforts and practices in CSR by
businesses is not demarcated by single variable and researches in the area have quantity
of ways to quantity CSR performance. The reported CSR performance indicators,
whether voluntarily or mandatorily have been used to approximate the performance of
a business (Hanna 2013). For social performance measure, the comprehensive number
of studies employed diverse measures. The Kinder Lydenberg Domini (KLD)
assembled the Domini 400 Social Index (DSI 400), Standard and Poor’s 500 Index, for
socially responsible businesses, where each S and P 500 company is rated on
numerous attributes reflected pertinent to CSP (Tsoutsoura 2004) (Waddock and
Graves 1997). The different researchers who conducted studies in different countries
considered the country’s index to measure CSP. The social performance by Korean
companies was measured by using two proxies based on the KEJI index i.e. similar to
the US- CEP index, the Japanese-Asahi Foundation index, Australian Corporate
Responsibility Index, and many other corporate ethics indices of Europe nations (Chi
and Kwak 2010). The CSR reports or CSP-related reports published on sample
companies’ websites for assessment, have been the information source for Taiwanese
companies where no formal or open CSP rating organization exists and the indicators
of the French AReSE method (Henri and Stéphane 2002) viz., the ER (employee
relations), SHA (shareholder relations), ENV (Environment), COM (community) and
PRD (product quality and relations with providers and customers) were used to
measure CSP (Yang, Ling and Chan 2010).

47
The other factors that were used to measure CSR in various empirical studies were
contribution towards income, human resource, public, environmental and product and
service (Goswami 2011). The National Association of Accountants’ committee on
accounting for corporate social performance recognized areas of CSP and its
disclosures: community development, human resources, service and product
contribution and physical resource and environment contribution (NAA 1974).
2.7 Measures of Corporate Financial Performance
The selection of financial indicators has a direct influence on the results for the
empirical researches of associations between corporate financial performance and
corporate social responsibility. In many researches, the main indicators of corporate
financial performance have been divided into market indicators (Lioui and Sharma
2012), based on stock market trading data concentrated on shareholder returns, and
accounting indicators (Bayoud, Kavanagh, and Slaughter 2012), (Iqbal et al. 2012),
(Mwangi and Jerotich 2013), (Mishra and Suar 2010) based on the companies’
financial statements that reflects the corporation's operating situation. The accounting
indicators often used to examine the association between corporate financial
performance and corporate social responsibility and include: return on assets (ROA),
earnings per share (EPS) and return on net assets (ROE) so on (Qui 2012) and the
market measures were: stock price change, price per share change, P/E ratio
(Ullmann, 1985). For most of the previous studies, return on assets (ROA) and
return on net assets (ROE) have been the most commonly used accounting indicators
to measure financial performance (Waddock and Graves 1997). ROA is unaffected

48
by the degree of leverage existent in companies and is related with the stock
pricepositively, an increased ROA indicates increased value formation for
Stockholders. ROA gives a better display of company performance (Mishra 2010).
To evaluate a degree of financial success the contemporary research relied on two
measures: profit margin and ROA, which are both common indicators of profitability
(Zaborek 2014). (Simpson and Kohres 2002) took return on assets (ROA) and losses
through loans, while (Berman, Wicks, Kotha and Jones1999) took return on assets
only as the measure of corporate financial performance. Accounting variables: return
on equity (ROE), return on assets (ROA) and return on sales (ROS) were used as
financial performance measures (Tsoutsoura 2004).The accounting based measures
engaged by numerous studies were ROA, asset and sales growth, total assets,
operating income growth. (Hackston and Milne1996) Average ROA and ROE were
used to measure profitability.
2.8 Corporate Social Responsibility Disclosure
In India, during the eighties, corporate social responsibility and its disclosure gained
significance and have been augmenting in India in current economic environment,
specially after liberalization, privatization and globalization (LPG) (Goswami 2011).
With time the interest of companies, in the concept has increased with time.
Corporate social responsibility disclosure makes information available to the public
concerning societal corporate actions focusing on waste management,
environmental regulations and employees’ protection (Hasan 2010). In the present
scenario, the stakeholder groups’ demands are not only confined to financial records

49
but also information about societal and environmental issues the companies are
engaged in.
The study of companies’ societal impacts has become a matter of global concern
because of the increased expectations of the stakeholders on the companies’ role in
the community. Rules, codes and principles, established by numerous Indian
regulatory bodies and worldwide are asssiting to upsurge accountability of a
business’s processes and the influence of these processes on society (Tran, Thao
2014) The businesses need to validate their actions to a broader public by not just
restricting to connecting about the economic proportions of their processes but also
societal (Daub 2007).
CSRD is a significant instrument that forms a dominant charter for public relations in
communicating and making common understanding, handling probable encounters
and attaining legitimacy (Golob and Bartlett 2007). A well-constituted CSR reporting
augments decision-making process internally, progresses the stakeholder-related
performance, and supports external relation management, eventually leading to a
sustainable company (Tran, Thao 2014). Different patterns are adopted by the
corporate houses to disclose their CSR activities in CSR reports such as
Environmental and Social or Sustainability reports (Douglas, Doris and Johnson
2004). Conducting social audits, publishing social reports, ranking by rating agencies
corporations, on companies’ social performance has become a regular and mandate
action for companies (Hasan Nasr 2010). In response to this trend, companies
are on the verge of incorporating ethical, social and environmental issues into
their corporate reports either separately or as an indispensable part of their annual

50
reports (Khurana 2011), subsequently, bringing the triple-benefit blend and
empowering the companies to captivate the interest of stakeholders. (Tran and Thao
2014).
The companies’ interest towards disclosing or communicating CSR initiatives through
sustainability reports or separate CSR reports or business reporting reports or CSR
initiatives in their annual reports has become significant. The disclosure portrays about
the effect of business on societal development aspects by clarifying the social activities
of an entity about its stakeholders, making the relation better (Goswami 2011). In
2012, the SECP drafted Corporate Social Responsibility Guidelines, 2012 in Pakistan
for the public limited corporations to assign quantified resources or quantity of the
post-tax profit (Khan and Hassan 2013). CSR seems to be at a promising stage in
Malaysia with some companies acknowledged acting pro-actively in this area. These
comprise businesses which have voluntarily implemented the Global Reporting
Initiatives (GRI) reporting framework (Saleh and Zulkifli 2010).
Emphasizing their CSR identifications through website reporting of environmental,
societal and sustainability performance have become a culture with businesses in
European, American and other countries. (Cooper and Owen 2007). India Inc. too,
has developed as a prominent nation paying an ever-increasing consideration towards
corporate social responsibility (CSR) disclosure and is progressively warming up to
sustainability reports, in consensus with the reporting guidelines.
The business houses, big and small, Indian or foreign, are comprising themselves in
the CSR element of their business activity by reporting the actions in their annual
reports like sustainability reports for the recognition from various stakeholders (Guha

51
2011).
1. Introduced in 2000, GRI (Global Reporting Initiative) has delivered the base
to sustainability reporting by setting guidelines to social, environmental and
financial reporting of corporate. Indian companies are now progressively
embracing the GRI framework of reporting standard though the number is
limited (Singh 2010).
2. UN Global Compact announced in the World Economic Forum, ten
principles, which were related specifically to, labor standards, human rights,
environment and anticorruption. These principals have pointed at the
corporate community to appeal them to bring into line their operations
accordingly.
3. The introduction of the Accountability AA1000 Assurance Standard is an
initiative by ISEA (Owen 2003)
4. International guidelines have also been announced like ISO-26000 framework
and OECD guidelines, for instigating socially responsible practices. (Hasan
2010).
5. The new Companies Act 2013 has been modified to enforce obligatory
corporate social responsibility commitments upon Indian corporations and
foreign business operations in India.
6. The National Voluntary CSR guidelines by Ministry of Corporate Affairs create

52
a common standard for improvement of CSR efforts by the companies,
specifically with regard to sustainability.
These initiatives have made CSR Disclosure gained impetus in India also.
2.9 Relationship between CSR Disclosure and CFP
In the previous two decades, CSR appears to have become more universal and
professed as being relevant to businesses worldwide (Aras and Crowther 2008).
However, the relation between CSR and financial performance of the business is still
debatable. Howard Bowen’s (1953) “Social Responsibilities of the Businessman”
(Bowen 1953) has been regarded as the preliminary effort by all the academicians
and researchers to thoroughly observe and analyze the relationship between
corporations and society. There also have been various studies conducted to establish
and comprehend this critical issue but CSR is still challenging and it is apparent that
there exists a contrast between CSR and financial performance. Even after decades of
research, existing literature on CSR fails to provide conclusive confirmation on the
effect of corporate financial performance (CFP) on responsible business practices
(Tang et al. 2012). (Lu et al. 2014) who meta-analyzed 84 papers published during
2002-2011 explored this relationship and found wide conceptualizations,
methodological approaches and outcomes (Zaborek 2014). Numerous studies and
researches on the association between CSR disclosure and financial performance of
the companies, is still far from clear and have stated a positive, negative, and no
impact of CSP on CFP.

53
No relation
The association between CSR and CFP (Mc Williams and Siegel 2001) was tested
using a regression model for 524 large U.S corporations for the period 1991-1996 and
the non-existent CSR- CFP link was found. Statistical evidence proved that CSR does
not impact airline companies’ accounting performance. There also existed no
relationship, both in current and long-term periods, between CSR and accounting
performance (Lee and Park 2011) using correlation with CSP as measured by ethical
rating and market ratios and accounting ratios used as CFP indicators (Maaria-Gaia
Soana 2011).
Negative relation
A negative association between CSR and CFP has been put forward and CSR has been
measured as an extra load on the organisation’s CFP (Friedman 1970) due to the
additional costs involved which seems to have made no contribution to enhance
shareholder value (Lee, Faff and Smith 2009). The negative correlation between CSR
and CFP, an unusual conclusion equated to other alike empirical researches, demands
more contemporary researches on the topic (Palmer Harmony 2012).
Positive relation
It was examined that strategy to disclose is inclined by type of industry and is
positively linked to company size (Brammer and Pavelin 2004). A positive and
significant relation (Peters and Mullen 2007), (Rettab et al. 2009), (Wagner 2009)
between CSR and corporate financial performance was developed when CSR was
calculated by a stakeholder-weighted index while an insignificant relation was

54
developed when an equal-weighted index was used to measure. The outcomes imply a
positive financial impact if a company introduces CSR gradually over long period of
time (Tang et al. 2012).
Nevertheless, it is clear that the CSR initiatives of an organisation must be considered
by the management as the sustainability of that performance is reliant upon such CSR
action (Aras and Aybars 2009).
2.10 Conclusions
The review of literature has brought in the following tentative conclusions that can
form the background for the study:
1. The concept of CSR is in an emerging stage in India and the Indian researches are
at a preliminary stage in this area. Although many foreign studies have been
conducted in this field.
2. In India, not many researches have been made on understanding the association
between CSR and CFP. Especially, the disclosure of the CSR initiatives by the
companies has not been a grave area of concern
3. No doubt the researches have highlighted about the CSR regulatory framework to
be followed by the companies but a comparison of the Indian Guidelines and foreign
guidelines has not been the scope of these studies.
4. Most of the researches conducted in India have targeted different sectors but
automotive sector is still untapped for the study of CSR concept.
Overall, there exists a huge gap relating to in depth study of the concept of CSR and CFP
in India, especially in automotive sector.

55
THEORETICAL FRAMEWORK
In this chapter, an insight to the concept is given including the definitions, the related
terminology, the need and significance and the committees of CSR. The chapter further
discusses the initiatives taken by the select companies in the automotive sector in India.
And finally, the chapter explains the CSR disclosure guidelines both national and
global, in detail.
3.1 Corporate Social Responsibility (CSR) - An Insight
Although, there exists an inordinate uncertainty and ambiguity about the meaning of
corporate social responsibility and driving forces for a company to pursue it (Abiodun
2012), the theme is rapidly flourishing on the domestic and global schema of the
corporate sector (Khurana 2011) and has come a long way in India. The adoption of
sustainable initiatives have undoubtedly made the corporate exhibit their capacity to
make a noteworthy transformation in the society improving the inclusive quality of
life. (Berad 2011). (Ahamed et.al 2014) Corporate Social Responsibility (CSR) as a
common corporate practice has recognized a locus in developing nations with
businesses committing to advance the social and economic standing of numerous
investors by conforming to all economic and legal requirements (Krishnan and
Balachandran 2010). It is fundamental for the corporate sector to appreciate the triple
bottom-line effect: profits, environment protection and fight for social justice of all
CSR activities. (Berad 2011). CSR is the DNA of a business and is a corporate
decision accountable for its financial sustainability and value creation of the operating
business. Hence, the companies try to trim down the negative impacts and maximize

56
the positive impacts for their benefit and that of the society as well. CSR, generally
called charity (Sharma 2011) by the corporate doesn’t regard business growth and
societal welfare as a zero-sum game rather focuses and voluntarily assumes doing
well for the community, the environment and all other aspects (Singh 2010). For a
long time, there has neither been a consensus that businesses should undertake social
responsibilities, nor there exists an absolute definition for CSR (Qiu 2010). Industry
leaders, policy makers and consumers may have their own definition - and opinion -
but something that is sure is: CSR is here to stay and it should!
3.1.1 Definition of CSR
Corporate Social Responsibility (CSR) primes to triple bottom-line: profits,
environment protection and fight for social justice. Though CSR is a recurrently
debated and a pivotal concept in business ethics, literature displays its definition with
significant changes with time with no single acceptable definition (Min-Dong 2008).
CSR, which primarily was considered to be tantamount to occasional charity work and
philanthropy by the business, has augmented both depth and width in connotation and
has emerged as a multifaceted concept. No sole commanding definition of corporate
social responsibility exists (Chaudhry, 2007; Fiesler et.al 2008; Ihlen, 2008).
However, all of them highlight the interrelationship between economic,
environmental, and societal features and organization’s activities’ impacts (Ashok
2010). (Davis 1973) defined corporate social responsibility as company’s reaction to
matters outside the purview of financial and legal necessities of the business.
Starting with Sheldon, who first cited the concept of corporate social responsibility in

57
1924 and suggested the concept of CSR in his book “The Philosophy of
Management”, various viewpoints on this concept had been put forward by
academics and organizations (Qui 2011) ensuing long debates (Garriga and Mele
2004). (Bowen 1953) defined CSR as a social obligation i.e. the responsibility to fulfill
the purposes and values of society followed by a paradigm shift in terminology from
the social responsibility of business to CSR (Yoonjae2011). CSR believed as the value
and standard in operating business (Cowen 2000) was recognized by three principles:
Legitimacy, Public Responsibility and Managerial Discretion (Wood 1991). (Hopkins
2003) convinced CSR theory as a responsibility of corporate to deal with
stakeholders and create a better living standard for them.
CSR is not a novel concept in India. But, new is the shift in emphasis from making
profits to meeting social challenges. Well-known institutions have also defined CSR
but had faced the intricacy of defining the concept of CSR.
World Business Council for Sustainable Development defines Corporate Social
Responsibility (CSR) as the enduring commitment by corporate to behave ethically
and contribute to economic development while cultivating the life quality of the
workforce along with their families, the local community and society at large.
The European Commission or European Union (EU2001) through Commission
Green Paper 2001" Promoting a European Framework for Corporate Social
Responsibility " advocates CSR as a concept where businesses assimilate social and
environmental concerns in their commercial processes and in their interaction with
their investors on a voluntary basis.
58
The U.S. Chamber of Commerce documented CSR as the company behaviors
steady with social norms, values and expectations. Its divided the content into four
stages according to different levels: in the first level, the corporations meet their
economic needs in the current legal structure; in the second level, the corporate
behavior meets the expectations of the public; in the third level, the corporate
anticipate the public needs and act pro-actively; in the fourth level, the companies
become a leader under the new standards, while donates corporate resources to help
the public improving their life quality.
World Bank 2002 explained the concept of CSR as a method of handling the cost
and benefits of corporate initiatives for both internal (management, employees and
investors) and external (public institutions, regulatory bodies, society, civil groups,
other enterprises) stakeholders.
The Indian Corporates say that Sustainable development suggests enhancing
financial situation whereby not diminishing communal and ecological aspects and
CSR, as a concept infers supporting subjects related to children, public and
environment (Berad 2011)
International Finance Corporation defined the concept of corporate social
responsibility too. According to IFC, CSR is an obligation of functional companies to
donate to supportable economic progress by engaging with workers and their
families, the local public and community to advance their lives in conducts that are
virtuous for growth of the business.
59
CSR Asia elaborates the concept, as a business’s obligation to functioning in an
economically, communally and sustainable routine bringing a balance in the interests
of varied people having stake in the companies.
The online encyclopedia, Wikipedia (2007) gave one of the best definitions of CSR.
It defined CSR as a notion that business or companies have a commitment to deliberate
the comforts of customers, shareholders, employees and societies in all facets of their
business operations.
Business for Social Responsibility (BSR) justified corporate social responsibility as
attaining commercial achievement in conducts that value ethics and respect public,
groups, along with the natural environment.”
The concept of CSR not only has different definitions but also understood in the form
of different substitutable terms. Hence, it becomes necessary to examine all the related
terms related to CSR.
3.1.2 Related Terminology with CSR
There are many other terms that relate with the meaning and concept of Corporate
Social Responsibility. The focus of these terms is on sustainability, citizenship
behaviour of the corporate, public relations and cause marketing. The researcher
highlights a few concepts in this part.
Corporate Citizenship
Corporate citizenship means undertaking operations not just to encounter the
prerequisites of owners and shareholders, but to assimilate the securities of
all stakeholders in commercial processes including, employees, consumers, the
60
society and the environment. A business is considered to be a responsible corporate
citizen if functions in an ethical mode and supports the welfare and show concern
towards the society in which it operates. Virtuous corporate citizens have a good
reputation in the public because of their focus to balance the needs of numerous
stakeholder groups. Some researchers have equated Corporate Citizenship with CSR
and others (Birch 2001) deliberated it as an improvement to the CSR concept.
Corporate Citizenship is said to involve a jointly strengthening relationship between
individuals and societies (McIntosh et al.1998). It is regarded as a continuum from
minimal citizenship i.e. compliance with laws only, at one end, through philanthropy,
to the strategic citizenship i.e. enjoying strong relationship with its societies (Shen
2006)
Corporate philanthropy (CP):
Corporate Giving as it is generally called is the corporations act donating a part of
their resources or profits, to charitable causes (Walter 2006) reflecting corporate
kindness and benevolence through deliberate corporate initiatives (L’Etang 1994).
The emergent concept of the 21st century has been equated with CSR quite often
(Porter and Kramer 2003) and (Smith 2003) and has been considered as an
imperative, but unrestricted part of companies business strategy. Employees devoting
their office times in charity like providing free education, spreading awareness for
environment protection, giving volunteer grants are some of the latest initiatives
taken by the corporate. The corporate have no anticipation of direct corporate
advantage (rises in revenue), but typically involves indirect gains (improving a
company’s brand, engaging employees, goodwill etc.

61
The idea behind the concept is considering the source of a problem or issue and not
only symptom.
Sustainable Development:
Sustainable Development meets the current needs without bargaining with the future
generations’ capacity to meet the individual requirements (Brundtland report), i.e. a
better life quality for everyone, now and for future generation. The sustainable
performance of the business is determined by not only internal (organizational) or
external (stakeholders’ demands) factors but also the three critical success factors like
leadership and vision; flexibility to change; and openness for engagement (Szekely
and Knirsch, 2005). Unlike CSR which deliberates attaining the intermediate goal
that marks triple bottom line, corporate sustainability reflects the vital goal associated
with creating value, managing the environment and managing the human capital (Lo
and Sheu 2007)
Socially Responsible Investment:
Socially Responsible Investment is the investment made in the companies, which are
considered socially responsible because of the nature of the business the companies
engaging in environmental sustainability have. The corporate normally uphold a fund
for SRI ensuring no investment in companies having poor records of CSR, like in
companies producing or selling addictive substances (alcohol, gambling and
tobacco). Also referred to as “sustainable”, “socially conscious” or “ethical”
investing, the socially accountable stockholders encourage the concepts and ideals that
they sense intensely about.

62
Strategic Philanthropy:
Strategic philanthropy is defined as the all-encompassing exercise that involves
synergistic usage of organizational fundamental resources to report significant
interests of the stakeholders and to accomplish both organizational and communal
benefits (McAlister and Ferrell, 2002) (Tokarski1999). The corporate adopting
strategic philanthropy is besieged to assist direct business interests while also
examining beneficiary organizations just likes the company‘s business and their
charitable involvement. It is a discretionary duty of a firm to voluntarily assign its
slack possessions to philanthropic or social activities to meet the societal expectations
(Ricks 2002).
3.1.3 Need of Corporate Social Responsibility
Every corporate has an obligation to maintain the ecological “footprint” in all their
operational aspects along with the interests of clienteles, employees, shareholders,
societies (Abiodun 2012). In today’s world of fierce competition, handling the
pressure of various external stakeholders without social investment is a challenge for
the companies (Margolis and Walsh 2003). The development of diverse strategies to
connect social needs, corresponding business imperatives and natural environment
has become vital for every business, eventually assimilating social responsibility
methods into strategy and daily procedures (Abiodun 2012). The large-scale
corporate collapses and scams, mounting terrors of global warming resulting in
adoption of the Kyoto Protocol (Lee, Faff and Smith, 2009) and problems like
illiteracy, lack of basic amenities that lead to poverty and many more have ensued the

63
regulators, legislators and broader stakeholder groups to become all the more vigilant
(Fombrun et al. 2000). Corporate social responsibility plays vibrant role in
captivating the consumer confidence that help developing the businesses for which
profit maximization is no longer the sole purpose. A responsible company should
entrust its activities (Yang, Ling and Chang 2010) in such a manner that it enhances
trust of the investors, new opportunities in the market and positive responses of
capital markets. The procedure of implementing the principles of CSR motivates
managers to reassess their commercial practices and to hunt for more proficient
operational ways for doing business. The corporate are bound to follow CSR
initiatives because of the following reasons: Firstly, it enhances brand image and
status. Consumers are fascinated to brands and corporations with good brand value in
CSR linked issues are the investment opportunities for many investors (Tsoutsoura
2004). Secondly, it attracts employees. Employees are inclined more towards
working with the firms with higher CSR ratings than with those corporations, which
did not involve in any CSR initiatives. Thirdly, it comprehends government control.
The growth in number of industries by a double-digit ratio every year is accompanied
with a lot of problems, which can be collectively taken care of by Government and
companies also. The companies must comprehend their role in enriching the
downtrodden society. The company following CSR initiatives on a regular basis has
motivated staff and the effective corporate governance help mitigate them the risk.
These assistances are significant and most corporations that are involved in CSR are
reconsidering their strategies and intensifying their processes to reap enriched profits
and contribute to inclusivity in growth. There are myriad numbers of business models

64
established to achieve CSR objectives.
3.2 CSR Initiatives in Automotive industry
India has covered an extensive journey from the days when the Indian automotive
industry portrayed limited choice, not so latest technology, outdated designs and long
waiting periods. The automotive industry in India is one of the fastest growing
worldwide. By 2016, India will most probably be overtaking Germany, Brazil and
Japan to be the third biggest automotive market of the world. The recent global
downturn has strengthened the Indian automotive industry giving a record breaking
numbers in sales across all segments in the recent past. Not only domestic but global
players also mark advancement of the automotive industry and will contribute to
make Indian market among the world's top auto-producing markets by 2015
(Majumdar 2013). A big amount of novel model and modified launches every year
are tossed out by the Indian auto industry and almost 12% of the vehicles
manufactured by it are exported to the most competitive auto markets across the
globe. Demographically and economically, this industry is well positioned for
development, tuning domestic demand and export opportunities too. A projected
upsurge in India’s working-age population is expected to encourage the mushrooming
market for private vehicles. The past ten years preceding the last two years have
perceived a six fold upsurge in the turnover of automotive industry. Rising fuel
prices and poor consumer confidence hitting the auto industry so hard that sales
often touched new lows in the last ten years. According to a study by the Society of
Indian Automotive Manufacturers (SIAM), passenger car sales fell 9.6% in 2013 from

65
2012. This drastic downfall in the car sales annually for the first time in the last years
compelled the customers to defer their buying amid a slackening economy. The
challenges like rapid depletion of the vehicles, the mounting fossil fuels’ cost, the
vehicles impact on the environment and climate change associated with the sector
affect the sector drastically. As a reaction to this, Indian Government strives to go
green. In fact, the India National Electric Mobility Mission Plan 2020 envisions to
have 5-7 million electric vehicles (EVs) on the roads, by 2020. A mindful change of a
move towards energy efficient vehicles and hybrid/ electric vehicles, by auto
manufacturers, developed as a common initiative for the companies. These are areas of
severe concern not only to the Governments across the globe but also to industry
experts and automotive leaders alike. The automotive industry spends
comprehensively in new technologies to deal with the intricate CSR challenges.
Worldwide, the automotive sector aims at a better quality of life. In the urge to
achieve the aim, the companies in this sector have been striving to decrease the
environmental footprint of its products, services and production facilities. Hence,
CSR has developed as an increasingly noteworthy paradigm for corporate strategies
in the industry. Customers in emerging markets expect automotive corporations to
aggressively contribute to the country’s economic and social development.
This necessitates understanding the automotive industry in regards to compliance and
contribution towards environmental, social, and philanthropic activities. Globally,
the consumers likely accept or reject a company based on its repute for societal and
ecological responsibility. Big companies are gradually conscious that their social
responsibility unswervingly affects their image and brand equity - and subsequently,

66
their occupational success. Therefore, many corporations are investing greatly in
CSR activities - predominantly in those markets where they are converging on
expansion, to be impactful for the long term (Rana 2013).
3.3 CSR Disclosure
3.3.1 CSR Reporting
To meet the expectations of the stakeholder groups regarding the information related
to communal and environmental issues, the corporate need to substantiate their
activities communicating all the issues and not just about the economic dimensions of
their operations (Daub 2007). The trend has been gaining importance in India in
present economic environment (Goswami 2011) and it is extensively acknowledged
that corporate are not only responsible but also exhibit a great capacity to exercise
positive modification on the state of the economy worldwide, environmental and
communal conditions. Sustainability Performance Reporting helps organisations to
manage improved sustainable progress outcomes. Stakeholders’ pressure have proven
to be an effective method for stimulating transparent behaviour and disclosure of social
responsibility initiatives. The reporting could be either in the form of a separate CSR
report called a ‘social and environmental report’ or a ‘sustainability report’, or in their
annual report and accounts. These reports specify a company’s assurance towards
ethical conduct and highlight their growth towards attaining their strategic CSR
objectives (Chandan and Pratik 2010).The companies’ performance can be examined
annually or be compared to similar corporate, by augmenting reputation both
internally and externally (Knowles 2014).

67
3.3.2 CSR Reporting Guidelines
Figure 3.1 CSR Reporting Guidelines
Source: Own Elaboration
3.3.2.1 Global Reporting Initiative G-3 Framework (GRI-G-3)
GRI was founded in 1997, through a multi-stakeholder, consensus-seeking approach
and has its headquarters and Secretariat in Amsterdam, The Netherlands GRI became
an independent non-profit organization in 2002 with the challenge "to advance
and propagate globally pertinent sustainability reporting guidelines" (GRI 2002).
These Guidelines are predominant standards for sustainability reporting — also
known as ecological footprint reporting, ESG reporting, TBL reporting and CSR
reporting. The corporate, community agencies, small businesses, NGOs, industries
and other groups of more than four thousand organizations from sixty countries use

68
the guidelines to prepare and present their sustainability reports. This reporting
framework permits the businesses to be fairly accountable to their stakeholders on
their performance, beyond the financial bottom line. Initially released in 2000 called
G-1, followed by G-2 in 2002, G-3 are the so-called “Third Generation” of the GRI’s
Sustainability Reporting Guidelines launched in October 2006. The G-3 consists of
the principle of materiality, principle of stakeholder inclusiveness, principle of
comparability and lastly, the principle of timeliness).The guidelines divides the
categories of disclosure items into organization’s performances which are economic,
environmental and governance. These items are the base of report content and guide the
reporters in framing the reports, eventually assisting them to recognize business
threats and opportunities faced by the business due to these factors. Each disclosure
item is divided into a set of Core performance indicators, expected to be substantial
for most establishments and subsidiary performance indicators that characterize
emergent practice or discourse topics that may be substantial for some establishments,
but insignificant for others. The various performance indicators are:
The economic indicators of sustainability: are the dimensions of the
corporate’s behaviour that have an impact on the economic surroundings of its
stakeholders and on economic arrangements at local, national and
international levels. The indicators are the capital among diverse stakeholders
and the economic influences of the business throughout the society.

69
The environmental indicators of sustainability: are the dimensions of the
corporate’s behaviour that have an impact on living and non-living natural
systems. These indicators constitute performance related to natural resources
with their emissions and waste.
The social indicators of sustainability: are the dimensions of the corporate’s
behaviour that have an impact on the social structures within which it
functions. The GRI social dimensions recognize crucial performance aspects
related to labour practices, human rights, people, and product responsibility.
The table shows the various disclosure items divided into core and additional
indicators
Table 3.1: GRI Guidelines
SN Performance
Indicators
No. Performance Aspects
1 Economic T:09
C:07
A:02
Economic performance, Indirect economic
impacts, Market presence
2 Environmental T:30
C:17
A:13
Materials, Water, Energy, Biodiversity,
Effluents, Emissions and Waste,
Compliance, Products and Services,
3 Social
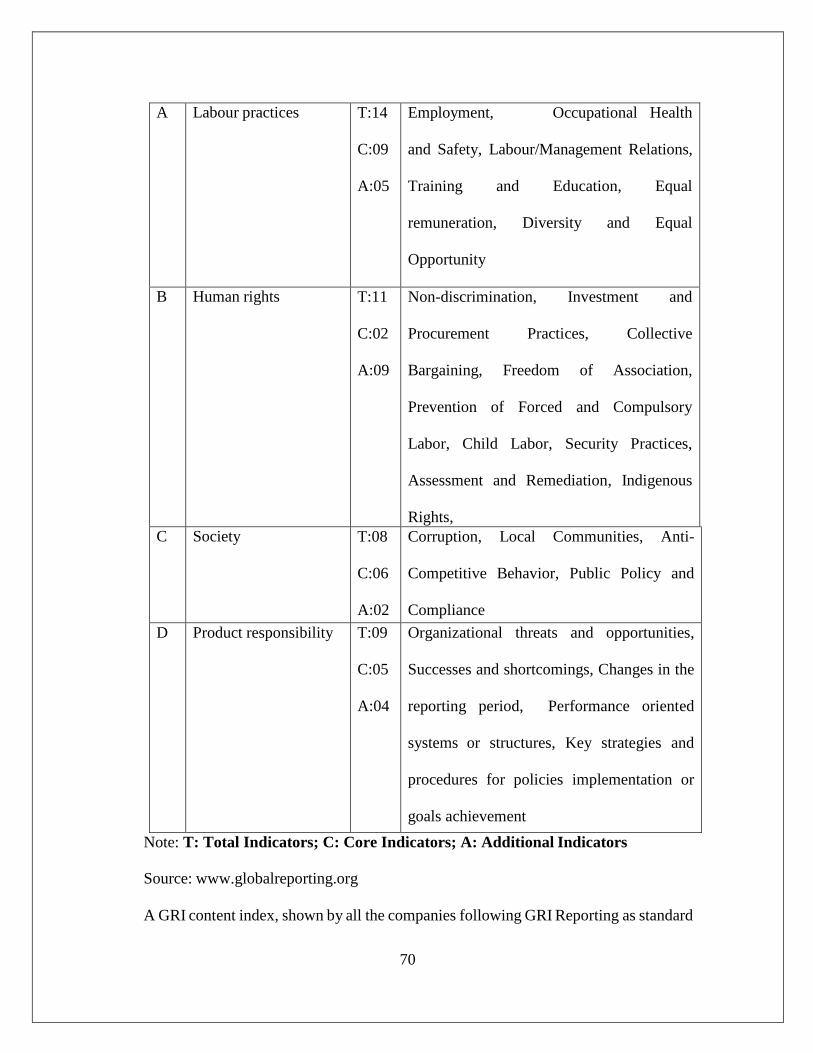
70
A Labour practices T:14
C:09
A:05
Employment, Occupational Health
and Safety, Labour/Management Relations,
Training and Education, Equal
remuneration, Diversity and Equal
Opportunity
B Human rights T:11
C:02
A:09
Non-discrimination, Investment and
Procurement Practices, Collective
Bargaining, Freedom of Association,
Prevention of Forced and Compulsory
Labor, Child Labor, Security Practices,
Assessment and Remediation, Indigenous
Rights,
C Society T:08
C:06
A:02
Corruption, Local Communities, Anti-
Competitive Behavior, Public Policy and
Compliance
D Product responsibility T:09
C:05
A:04
Organizational threats and opportunities,
Successes and shortcomings, Changes in the
reporting period, Performance oriented
systems or structures, Key strategies and
procedures for policies implementation or
goals achievement
Note: T: Total Indicators; C: Core Indicators; A: Additional Indicators
Source: www.globalreporting.org
A GRI content index, shown by all the companies following GRI Reporting as standard

71
form of reporting, lists the standard disclosures and the stakeholders get an overview
of the reporting by the corporate.
Recently the G4, 4th generation GRI Guidelines, with effect from May 2013, is an
effort to replace the third generation guidelines, G3 and G3.1, within next two-years.
The G4 Guidelines were introduced to enhance the material aspects, to focus on
wider reporting boundaries of diverse impacts on businesses, to develop new
governance and supply chain disclosure necessities The companies in India reporting
as per the GRI guidelines have benefited immensely. Sustainability reporting is
nowadays becoming a accustomed exercise for global businesses. Indian companies,
to be competitive across the globe require to follow GRI based sustainability
reporting for sure.
3.3.2.2 Companies Act, 2013
The Ministry of Corporate Affairs (MCA) has issued the Companies (Corporate
Social Responsibility Policy) Rules, 2014, to implement the legislative mandate of
CSR spending, from April 1, 2014 and embraces all firms, and spell out diverse
actions for businesses to assume in order to encounter their obligations.

72
Table 3.2: Companies (Corporate Social Responsibility Policy) Rules, 2014 at a
glance
Effective from April 1, 2014
Applicable on Pvt Ltd. or Pb Ltd.
Companies
Criteria to be
fulfilled*
- Net Worth (NW): Equal to
or more than Rs 500 cr ; or
- Turnover (TO): Equal to or
more than Rs 1,000 cr; or
- Net profit (NP) Equal to or
more than of Rs 5 cr
Computed as per the P/L A/c
prepared u/s 198 of the
Companies Act, 2013
Expenditure in CSR Minimum 2% of average net
profit of the company, for
the immediately previous
three financial years
Net Profits (means net profit
before tax , computed as per
section 198 of the Companies
Act, 2013) excludes:
- Profits from any overseas
branch of the company
- Dividend receipts from
other Indian companies

73
CSR Activities to be
undertaken
Schedule VII of
Companies Act, 2013
Constitution CSR Committee Minimum three directors, one
to be an independent director
CSR Policy To frame the guidelines to be
followed for activities to be
undertaken
Source: www.mca.gov.in
*The CSR Rules stipulate that a corporation, which does not fulfill the stated criteria
for a successive period of three financial years, is not obligated to conform to the CSR
norms. However, if a company does not fulfill any of the stated criteria in a
successive financial year, it will still be require to undertake CSR initiatives unless it
concludes to content the stated standards for incessant period of three years. This
could upsurge the problem on small businesses, which do not endure to make
substantial profits. The table below shows the new CSR Rules, which have prescribed
the following activities to be considered and not to be considered as CSR expenditure
by the companies.
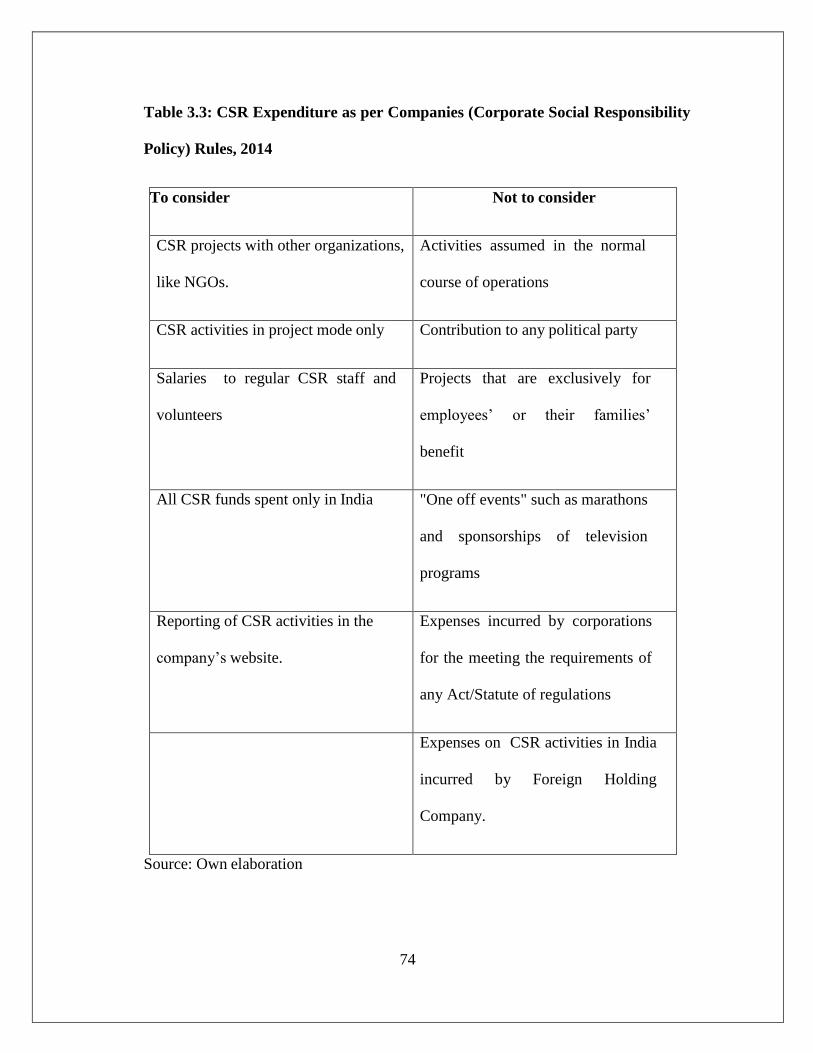
74
Table 3.3: CSR Expenditure as per Companies (Corporate Social Responsibility
Policy) Rules, 2014
To consider Not to consider
CSR projects with other organizations,
like NGOs.
Activities assumed in the normal
course of operations
CSR activities in project mode only Contribution to any political party
Salaries to regular CSR staff and
volunteers
Projects that are exclusively for
employees’ or their families’
benefit
All CSR funds spent only in India "One off events" such as marathons
and sponsorships of television
programs
Reporting of CSR activities in the
company’s website.
Expenses incurred by corporations
for the meeting the requirements of
any Act/Statute of regulations
Expenses on CSR activities in India
incurred by Foreign Holding
Company.
Source: Own elaboration
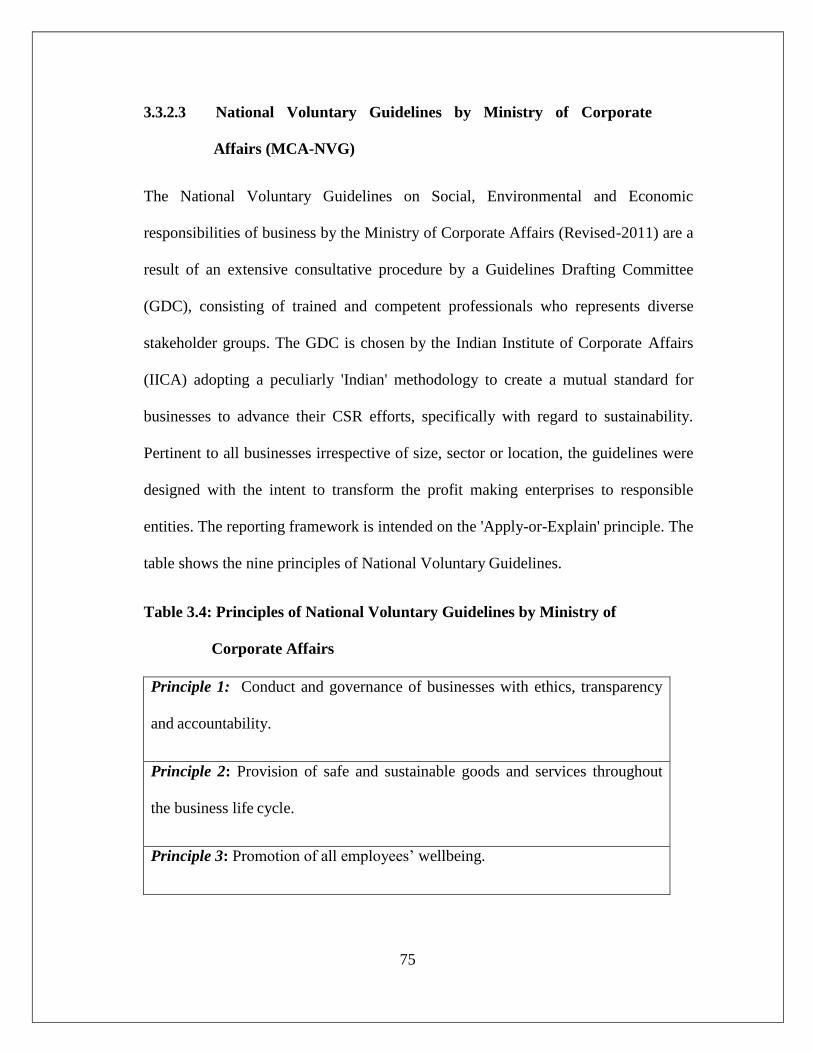
75
3.3.2.3 National Voluntary Guidelines by Ministry of Corporate
Affairs (MCA-NVG)
The National Voluntary Guidelines on Social, Environmental and Economic
responsibilities of business by the Ministry of Corporate Affairs (Revised-2011) are a
result of an extensive consultative procedure by a Guidelines Drafting Committee
(GDC), consisting of trained and competent professionals who represents diverse
stakeholder groups. The GDC is chosen by the Indian Institute of Corporate Affairs
(IICA) adopting a peculiarly 'Indian' methodology to create a mutual standard for
businesses to advance their CSR efforts, specifically with regard to sustainability.
Pertinent to all businesses irrespective of size, sector or location, the guidelines were
designed with the intent to transform the profit making enterprises to responsible
entities. The reporting framework is intended on the 'Apply-or-Explain' principle. The
table shows the nine principles of National Voluntary Guidelines.
Table 3.4: Principles of National Voluntary Guidelines by Ministry of
Corporate Affairs
Principle 1: Conduct and governance of businesses with ethics, transparency
and accountability.
Principle 2: Provision of safe and sustainable goods and services throughout
the business life cycle.
Principle 3: Promotion of all employees’ wellbeing.

76
Principle 4: Respect and responsiveness towards the interests of all stakeholders,
especially ones who are the disadvantaged, marginalized and vulnerable, by the
businesses.
Principle 5: Respect and promotion of human rights, by the businesses.
Principle 6: Respect, protection, and putting in efforts for restoration of the
environment, by the businesses.
Principle 7: Responsible engagement by the businesses in influencing public
and regulatory policy.
Principle 8: Supporting inclusive growth and equitable development by the
businesses
Principle 9: Responsible engagement with and provision of value to
their consumers, by the businesses.
Source: www.mca.gov.in
3.3.2.4 ISO 26000
The concept of socially responsible behavior, its rationale has gained utmost
significance in organizations around the world. The organization’s performance is no
longer confined to its financial performance. However, its impacts on the environment
and its ability to continue operating in a sustainable manner mark its overall
performance. Every organization is expected to account for its social accountability
performance, to the investors, periodically. ISO 26000, prepared by ISO/TMB
Working group on Social Responsibility, released on 1st November 2010, was one of

77
the most comprehensive standards ever developed by ISO. With global attention and
acceptance, ISO-26000 is considered to help establishments in donating towards
sustainability and to indorse common understanding in the arena of social
responsibility. ISO 26000 is based on seven principles of social responsibility, which
are:
Table 3.5: Principles as per ISO 26000 Guidelines
Accountability: Businesses have to be accountable for decisions and actions and
their influences on society, the economy and the environment.
Transparency: Businesses have to be open about their decisions and actions that
have an impact on society and the environment.
Ethical behavior: Businesses should behave in agreement with principles
of good behaviour and conduct
Respect for stakeholder interest: Businesses should respect, deliberate and react
to its stakeholders’ interests
Respect for rule of law: is mandatory for all the businesses
Respect for global standards of behavior by all the businesses
Respect for human rights by all the businesses.
Source: www.iso.org
3.3.2.5 United Nations Global Compact (UNGC)
The UNGC was launched at UN Headquarters in New York on July 26, 2000. An
international organization founded by fifty-one countries is dedicated to uphold
international peace and security, developing sociable relations among countries
and indorsing social progress, better living standards and human rights. Also known

78
as Compact or UNGC, United Nations Global Compact is a United Nations initiative
to boost companies across the globe to embrace sustainable and socially accountable
practices in the areas of human rights, labour standards, the environment and anti-
corruption, and report them. The Global Compact was initially launched with nine
principles, with the tenth principle adopted in 2003 against corruption. The
principles, which the companies are expected to follow under this compact, are listed
in the table:
Table 3.6: Principles of Corporate Social Responsibility as per United Nations
Global Compact
Human Rights P1: Business should support, respect and protect the human
rights worldwide
P2: Business should assure that they are not complicit in
human rights abuses.
Labour Standards P3: The autonomy of relationship and the effective
acknowledgment of the right to collective bargaining
P4: All forms of forced and compulsory labor should be
eliminated by the business.
P5: Abolition of child labor by the business

79
P6: Employment and occupation discrimination should be
eliminated by the business.
liminated
Environment P7: Business should support a precautionary approach to
environmental challenges
P8: Business should undertake initiatives to encourage
environmental accountability
P9: Business should reassure the growth and dissemination
of environmentally friendly technologies.
Anti-Corruption P10: Businesses should work against corruption, including
extortion and bribery.
Source: Adapted from the UN global Compact
3.3.2.6 Account Ability AA1000 Assurance Standards
Account Ability, a process standard is a principal global association providing
pioneering clarifications to the most precarious challenges in corporate
accountability and sustainable development. The AA1000 recommends an ideal
practice for companies to assume, in order to reason for their performances. Account
Ability assists its clients and members progress corporate performance and form
sustainable competitive advantage, set and effect sustainability standards and aid
corporations implant environmental and social accountability into their
organizational DNA. The AA1000 Series of Standards based on the principles are
shown in the table below:

80
Table 3.7: Principles of Corporate Social Responsibility as per AA1000
Inclusivity – Decision making power for the decisions that impact people should be
with the them
Materiality - Decision makers should recognize and clarify the material and
relevant issues of the organisation.
Responsiveness – Businesses must be transparent about their activities
Source: www.accountability.org
These principles in their all-inclusive exposure demand that a business actively
engrosses with its investors, fully recognizes and appreciates sustainability subjects
that will have an effect on its performance, including economic, environmental,
social and financial performance, and then uses this understanding to advance
accountable business strategies and objectives.
3.3.2.7 Business Responsibility Reports (BRR)
In the larger concern of public disclosure concerning steps taken by listed
corporations from Environmental, Social and Governance (“ESG”) perspective,
Business Responsibility (BR) Reports introduced by the Securities and Exchange
Board of India (SEBI) has been mandated for top 100 listed entities based on market
capitalization at the stock exchanges. The mandate came into effect from financial
year ending on or after December 31, 2012. The format prescribed by SEBI under
clause 55 enables every corporate to furnish its self- assessment of implementing the
BRR/sustainability parameters along with the company annual report and be
81
accessible for public on company website. An MNC, with its subsidiary in India,
producing a single Global Reporting Initiative (GRI) report, is obligated to make its
separate Business Responsibility Report emphasizing the accountable business
practices taken by the companies in India. An Indian listed company need not prepare
a separate report if incase it has already published a GRI report for its processes.
Such companies have to provide to their stakeholders the details of the report they
have prepared. In case the companies fail to provide Business Responsibility Report,
it will be interpreted as non-compliance with Clause-55 of Equity Listing Agreement.
But, a specific level of compliance with NVG has not been made mandatory.
All the above guidelines have been formulated by various agencies to be followed by
corporate for CSR Reporting. The guidelines under the Companies Act 2013 and the
NVG Guidelines are applicable to only Indian companies or foreign companies with
their operations in India. While the guidelines like GRI-G-3, ISO-26000, UNGC and
AA1000 are the global standards. There are other guidelines like OECD Guidelines
which were studied for the purpose of the study but were not included as a part of the
study because these are global standards for sustainability reporting with fifty one
country members but India not being the member.

82
RESEARCH METHODOLOGY
In this chapter, to achieve the aims and objectives of the study, the hypotheses are
developed. An attempt is made to discuss the data collection methods, selection of
sample from the target population, identification of independent, dependent and
controlled variables. Thereafter, the creation of CSR Disclosure Index and the
Questionnaire development procedure is explained in detail. Finally the statistical
techniques and tests used to analyse the data are discussed.
4.1 Target Population
The target population was the Indian companies in the Automotive Sector and the
foreign automotive companies with operations in India. For the research purposes,
four hundred ninety two companies listed in PROWESS DATABASE were taken
as the total population.
4.2 Sample for the Study
The Section 135 and Schedule VII of the Companies Act, 2013 effective from
29thAugust 2013 and Companies (Corporate Social Responsibility Policy) Rules,
2014 effective from April 1, 2014 imposed obligatory corporate social
responsibility provisions upon Indian companies and foreign companies operating in
India. The criteria to be met by companies for any financial year, for a mandatory
CSR contribution to the society are:
a) Having net profit of five crores rupees or more; or

83
b) Having net worth of five hundred crores rupees or more; or
c) Having turnover of thousand crores rupees or more
Out of the target population of 492 companies, 278 companies satisfied the
mandatory criteria for CSR contribution imposed by the Companies Act 2013.
The requirement of listing of the companies and the availability of the financial
data of these companies for five years (2009-2014) further reduced the sample to
59 companies. Thereafter, the websites of these companies were visited for
exclusive CSR reports or annual reports disclosing CSR initiatives of the
companies. It was noted that the companies are not disclosing the CSR initiatives
in their reports. Some of the companies have just started reporting 1-2 years back,
the reporting framework of the selected 59 companies was not available and all
could not fall within the scope of the study. Hence, a list of 26 companies was
finalized as a sample for the study for justifying Objective 1 and Objective 2 of
the study. To justify the Objective 3 and Objective 4 of the study, primary data
was collected through questionnaires and the total population comprised of the
middle level and senior level employees of the 26 companies. The survey was sent
to 450 employees.
4.3 Period of Study
Data was collected for a period of five years from 2009-10 to 2013-14
4.4 Data Collection
The data for the study was collected both from primary sources and secondary
sources. Since the nature of study was purely exploratory in nature, the primary
data had to be collected from the employees of the sample companies in the

84
automotive sector, in the form of surveys.
The secondary data was collected from CSR/ Sustainability reports of companies,
annual reports and web pages of the companies, management journals, business
magazines, newspaper articles etc.
4.4.1 Secondary Data
The source of financial data is the Prowess database and the companies’ websites
for corporate social responsibility. The companies have disclosed the information
either in the form of the sustainability reports or the CSR reports. For the
companies, which have not been maintaining these reports, annual reports were
studied. The reports of five years (2009-14) were studied in detail. A detailed
analysis is shown in the table below:
Table 4.1: CSR Reporting Framework
SN Company
Names
2009-10 2010-11 2011-12 2012-13 2013-14 CSRP CSRC
1 Amtek Auto Ltd AR SR GRI-G-3/
SR
GRI-G-3/
SR
GRI-G-3/
SR
Y Y
2 Apollo Tyres AR AR GRI-G-3/
SR
GRI-G-3/
SR
GRI-G-3/
SR
Y Y
3 Ashok Leyland AR AR AR AR AR Y Y
4 Atul Auto Ltd. AR AR AR AR AR N N

85
5 Bajaj Auto AR AR AR BRR BRR Y Y
6 Bharat Forge ltd. AR AR AR AR AR Y Y
7 CEAT Ltd No info No info AR AR AR Y Y
8 Cummins India Ltd AR AR AR BRR BRR Y Y
9 Eicher Motors Ltd AR AR AR AR AR Y Y
10 Escorts Ltd AR AR AR AR AR Y Y
11 Federal-Mogul
Goetze (India)
AR AR AR AR AR Y Y
12 Force Motors Ltd. AR AR AR AR AR N N
13 Gabriel India Ltd AR AR AR AR AR Y Y
14 Goodyear India Ltd AR AR AR AR AR Y Y
15 Greaves Cotton Ltd AR AR AR AR AR Y Y
16 Hero Honda Motor
Ltd./HERO Motocorp
AR AR BRR BRR BRR Y Y
17 Hyundai Motor India G-3/UNGC SR/ GRI-G-
3
SR/GRI
-G-3
SR/GR
I-G-3
SR/GRI-
G-4
Y Y
18 J K Tyre and Industry
Ltd
AR AR AR AR AR N N
19 Jay Bharat MarutiLtd AR AR AR AR AR Y Y
20 Lumax Industries Ltd AR AR AR AR AR Y Y
21 MRF Ltd AR AR AR AR AR Y Y

86
22 Mahindra &
Mahindra
SR/UNGC SR/UNGC SR/BRR SR/BRR SR/BRR/
GRI-G-3
Y Y
23 Maruti Suzuki India
Ltd
SR SR SR/GRI/
BRR
SR/GRI/B
RR
SR/GRI-
G-4/BRR
Y Y
24 MINDA Industries AR AR AR AR AR Y Y
25 TVS Motor Co. Ltd AR AR AR AR AR Y Y
26 TATA Motors Ltd. GRI/SR/
UNGC
GRI/SR/U
NGC
GRI/SR/
BRR
GRI/SR/
BRR
GRI/SR/
BRR
Y Y
Note: AR: Annual Report; SR: Sustainability Report; GRI: Global
Reporting Initiatives; BRR: Business Responsibility Report; UNGC: United
Nations Global Compact; CSRP: CSR Policy; CSRC: CSR Committee; Y:
Yes; N: No
Source: Secondary reports of the companies
4.4.1.1 Creation of Corporate Social Responsibility Disclosure Index
(CSRDI)
The independent variable of the study i.e. the corporate social responsibility
disclosure level of companies has been studied through a self-composed Corporate
Social Responsibility Index (CSRDI).There is no commonly acknowledged theory
to forecast user information needs and there is a nonexistence of a suitable
generally accepted model for the collection of the items of social and environmental
information to be comprised in a disclosure index (Hossain 2006). The researchers
created their own indices, which encompassed the dimensions, which they found to
be appropriate for the study. Such indices were called the Self Composed or Self

87
Constructed Disclosure Indices (Aupperle, 1991), (Allouche and Laroche 2005),
(Hanna Nopanen 2013), (Iqbal and Ahmad, 2012) and (Pirsch and Gupta 2006). It
is a matter of great concern for a researcher to decide the categories to use to
disclose the sustainability information of the companies in the Self Composed CSR
Disclosure Index. There is a difference of opinion amongst the researchers not only
in the choice of categories but also the number of categories. Some researchers
have used 9 categories (Raar 2002), some have used 18 categories (Wiseman 1982)
or 21 categories (Gray et al. 1995) or 27 categories (Benito and Benito 2005).
(Hackston and Milne 1996) used 73 categories. (Suar and Mishra 2010) categorized
the CSR initiatives of companies as environment, labor, occupational health and
safety, human rights, corruption. Environmental strategy, corporate management
systems, reporting, stakeholder engagement, climate change, responsible
investment is some other classification of CSR initiatives (KPMG 2008).
(Sukcharoensin 2012) categorized CSR initiatives taken by companies into
organizational governance, labour practices, environment, human rights, consumer
issues, fair operating practices and community involvement and development. The
list of 20 responsibility items were taken as dimensions from the regulatory
guidelines on CSR (Yao et.al.2011).
In this study, the Self Composed CSR Disclosure Index (CSRDI) is the base index
for measuring CSR disclosure of the companies divided into three major categories:
Economic, Environmental and Social with the sub categories under all the three
major heads, making a total of 51 categories. The index has been made after the
thorough study of the guidelines-both Indian and global, to be followed by

88
companies for CSR Disclosure or Reporting across the globe: Global Reporting
Initiative-G-3 Guidelines (Guthrie and Parker1990), (Patten 1991), (Burritt and
Welch 1997), (Buhr 1998) and (Raar 2002), used by huge number of European
firms to reveal their sustainability reports (Lopez et al, 2007) (Hopkins, 2003),The
Companies Act, 2013, National Voluntary Guidelines (Ministry of Corporate
Affairs), ISO-26000, United Nations Global Compact (UNGC) (Pirsch and Gupta,
2006), Account Ability Standard -1000, introduced by (ISEA) (Owen, 2003),
Business Responsibility Report (SEBI) or the annual reports (Boli and Hartsuiker
2001) made by company.
The three head categories: Economic, Environmental and Social have been taken
keeping the Triple Bottom Line Effect as the base. The sub categories are selected on
the basis of nine principles given in the National Voluntary Guidelines given by
Ministry of Corporate Affairs, seven principles of social responsibility defined by
ISO 26000, ten principles given by United Nations Global Compact, three
principles of Account Ability1000 Series of Standards. The dimensions set by GRI-
G-3 Guidelines and the core areas for CSR initiatives given by the Companies Act
2013 also form the base for composing the CSR Disclosure Index.
4.4.2 Primary Data
The primary data is the first hand information that is collected from the respondents
directly. The information about disclosure of the CSR initiatives was collated
through secondary sources i.e. the reporting framework followed by the companies
and a relationship between the CSR disclosure and the corporate financial

89
performance was established to satisfy the first two objectives of the study.
To fulfill the third and fourth objectives of the study, the researcher found it
necessary to comprehend the secondary data based research with the first-hand
information from the employees of the companies. A web-enabled version of the
questionnaire was advanced through e-mails to the employees of the automotive
companies, who had e-mail ids. The LinkedIn profiles of the CSR manager of the
companies were tracked to choose the respondents. Where the LinkedIn profiles of
CSR managers were not available, the profiles of HR managers or the
Communication Managers of the companies were tracked. The details (names,
phone numbers and email-ids) of the concerned managers or executives of the
corporate and branch offices of the companies were taken from the websites. The
managers, whose email-ids were not available on the websites, were requested for
the email ids telephonically. Thereafter, they were requested to fill the questionnaire
and also get them filled from their team members. The limitation was that the
managers were not available for a one-on one interaction. Although, the corporate
offices in Delhi-NCR were contacted for appointments but the appointments were
limited only to handing over the questionnaire and explaining the objective of
filling in the same. Hence, the research could not get a personal assessment of the
managers which could have otherwise been possible through personal interview.
The questionnaires were sent to the employees who were either middle level or
senior level employees of the companies. The respondents were given constant
reminders during the period of two months. With limited sample size and a large
size of employees in few sample companies, 34% was the response rate, which is

90
considered to be a reasonably good response rate. (Sweeney 2009) had a response
rate of 22.5 % of her survey, (Zaborek 2014) got filled 220 completed interviews for
a response rate of 39%.
4.4.2.1 Questionnaire Development
The source of primary data for the study has been Questionnaires
To fulfill the final objective of the study, the final stage of the research was
constructing and administering a structured questionnaire, which is a extensively
used and recognized research technique worldwide (Malhotra and Birks 2000) to the
employees of the companies. The questionnaires are the most prominent type of
method (Bryman 1988), which has various benefits over telephone surveys like they
are cost effective, can be used when the sample is extensively spread (Bryman
1988; Bailey 1982, Sanford and Hagedorn 1981), can be filled at the convenience of
the respondent, (Rea and Parker 1992), covering in depth and detailed information
about the topic to be researched (Bryman 1988) However, like any other method of
data collection, even this method of collecting data through questionnaires has
limitations. The respondent may not understand certain difficult questions and might
need explanations which would not be possible because of lack of personal presence
of the interviewer (Bryman 1988) (Birn 2000). Length of the questionnaire may also
be a hindrance in data collection (Sanford and Hagedorn 1998). Even the identity of
the respondent cannot be sure of in this method (Proctor 2003). Hence, all the
necessary steps should be taken by the researcher to attain the effectiveness of the
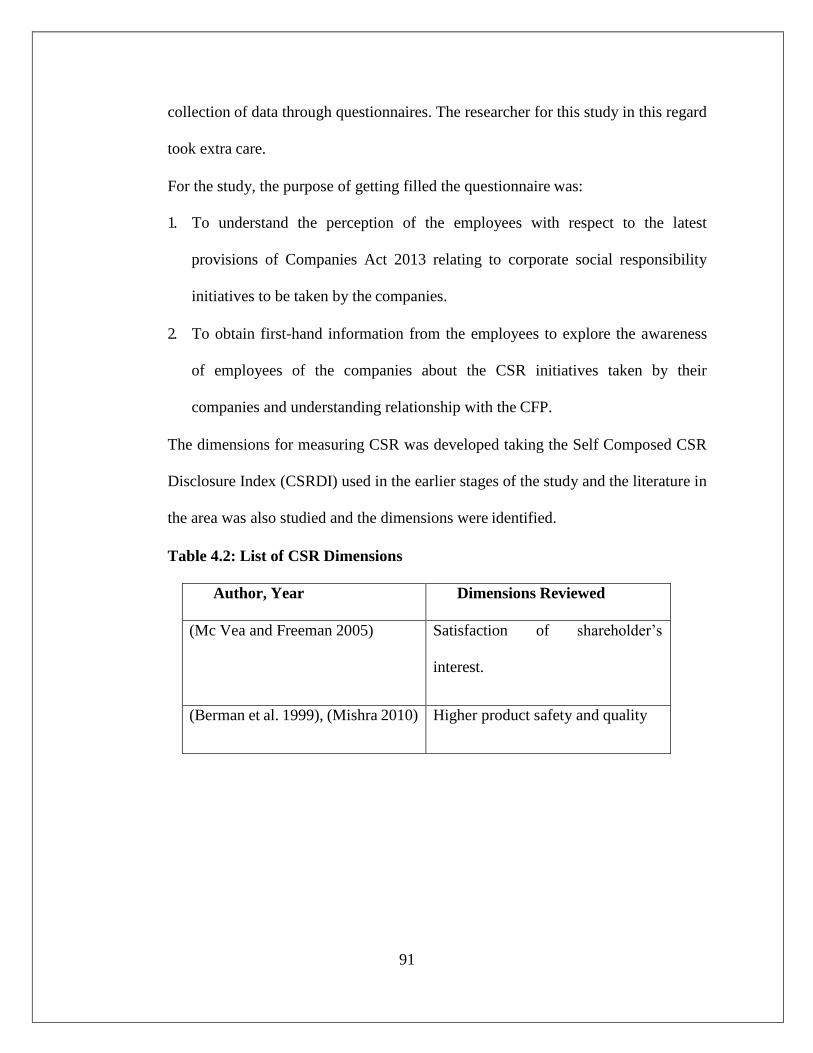
91
collection of data through questionnaires. The researcher for this study in this regard
took extra care.
For the study, the purpose of getting filled the questionnaire was:
1. To understand the perception of the employees with respect to the latest
provisions of Companies Act 2013 relating to corporate social responsibility
initiatives to be taken by the companies.
2. To obtain first-hand information from the employees to explore the awareness
of employees of the companies about the CSR initiatives taken by their
companies and understanding relationship with the CFP.
The dimensions for measuring CSR was developed taking the Self Composed CSR
Disclosure Index (CSRDI) used in the earlier stages of the study and the literature in
the area was also studied and the dimensions were identified.
Table 4.2: List of CSR Dimensions
Author, Year Dimensions Reviewed
(Mc Vea and Freeman 2005) Satisfaction of shareholder’s
interest.
(Berman et al. 1999), (Mishra 2010) Higher product safety and quality

92
(Somavia 2000), (Riordan et al.
1997), (Kumar et al. 2001)
Trade union policies, participative
management, remuneration policy,
stable working conditions
(Berman et al. 1999), (Koys, 2001),
(Huselid, 1995; Youndt et al., 1996)
Higher morale and highly motivated
employees career development
opportunities to employees,
standard remuneration policies,
grievance handling procedures
(Singh and Bhagat, 2004)
(Brugmann and Prahalad, 2007)
Joining hands with Non-
Governmental Organisations
(NGOs), socially responsible image
(Ahmed et al.1998) Market share, public image and
profitability
(Russo and Fouts 1997), (Klassen
and Mc Laughlin 1996), (Alvarez et
al. 2001), (Miles and Covin 2000).
System of reduce, reuse and recycle,
development of environmental
friendly product , development and
diffusion of environmentally
friendly technologies, sustainable
packaging, use of renewable
resources
(Sweeney 2009) Profitability, effect on sales

93
(Zuber 2001) Working environment, flexible
timing offered
Source: Adapted from Literature
The questionnaire was designed using the website “monkey survey.com” and the
link of the same was sent to the employees. The survey was then tested with a
sample of respondents before final administration of the survey. After the testing,
the final questionnaire was designed, as shown in Appendix A, which consisted of
four sections:
i. Section A gathered information about the demographic profile of the
respondents: gender, level in the organization and tenure in the
organization.
ii. Section B was dedicated to understand the employees’ perception
enforcement of Companies Act 2013. The seven questions in this section
were based on the important provisions of the latest Act which every
company, who falls in the criteria for mandatory CSR investment, has to
follow. Through this section, the researcher wanted to understand the
acceptability of the applicability of these provisions by the companies.
iii. Section C was divided into four heads Economic, Environmental, Social
and Profitability. This section was designed to study the awareness of
employees of the companies about the CSR initiatives taken by their
companies in the three heads.

94
a. The Economic aspect covered the areas of production of sustainable
goods and services by the company, support to inclusive growth and
equitable development, development and diffusion of
environmentally friendly technologies, customers and consumers
satisfaction, Stockholders and Investors interest, Industry research
and development and innovation, quality as a core value, public
policy and regulatory framework adopted by the company, Investor
grievances handling policies, code of conduct of business with
ethics, transparency and accountability.
b. The second aspect was Environment which covered the areas like
environmental policy, system of reduce, reuse and recycle, policy
towards employees, regular voluntary information about
environmental management to stakeholders, supply of vibrant and
precise environmental information on its products and services to
stakeholders.
c. The last aspect of this section was related to the CSR initiatives
taken by the companies towards the society, like employee
satisfaction measures, occupational health and safety policies, skills
and career development of employees, work-life balance for
employees, non-discrimination, diversity and equal opportunity,
forced and compulsory labor, poverty alleviation measures,
community development & investment, creation of
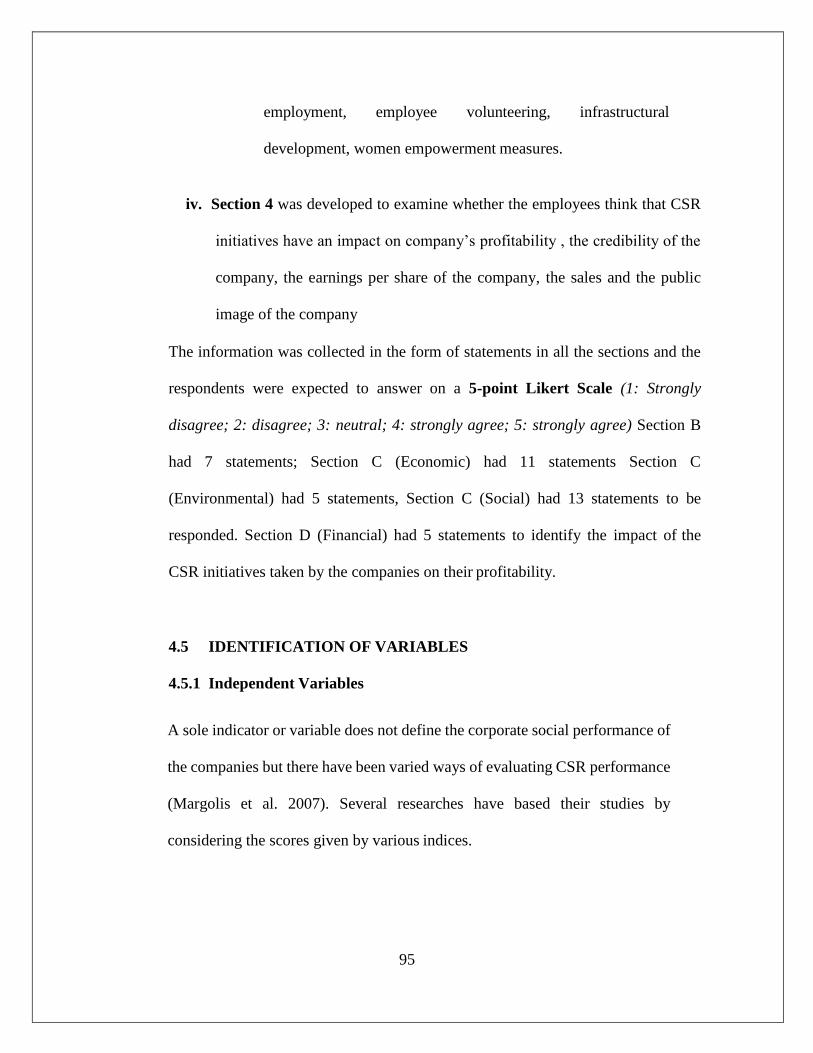
95
employment, employee volunteering, infrastructural
development, women empowerment measures.
iv. Section 4 was developed to examine whether the employees think that CSR
initiatives have an impact on company’s profitability , the credibility of the
company, the earnings per share of the company, the sales and the public
image of the company
The information was collected in the form of statements in all the sections and the
respondents were expected to answer on a 5-point Likert Scale (1: Strongly
disagree; 2: disagree; 3: neutral; 4: strongly agree; 5: strongly agree) Section B
had 7 statements; Section C (Economic) had 11 statements Section C
(Environmental) had 5 statements, Section C (Social) had 13 statements to be
responded. Section D (Financial) had 5 statements to identify the impact of the
CSR initiatives taken by the companies on their profitability.
4.5 IDENTIFICATION OF VARIABLES
4.5.1 Independent Variables
A sole indicator or variable does not define the corporate social performance of
the companies but there have been varied ways of evaluating CSR performance
(Margolis et al. 2007). Several researches have based their studies by
considering the scores given by various indices.
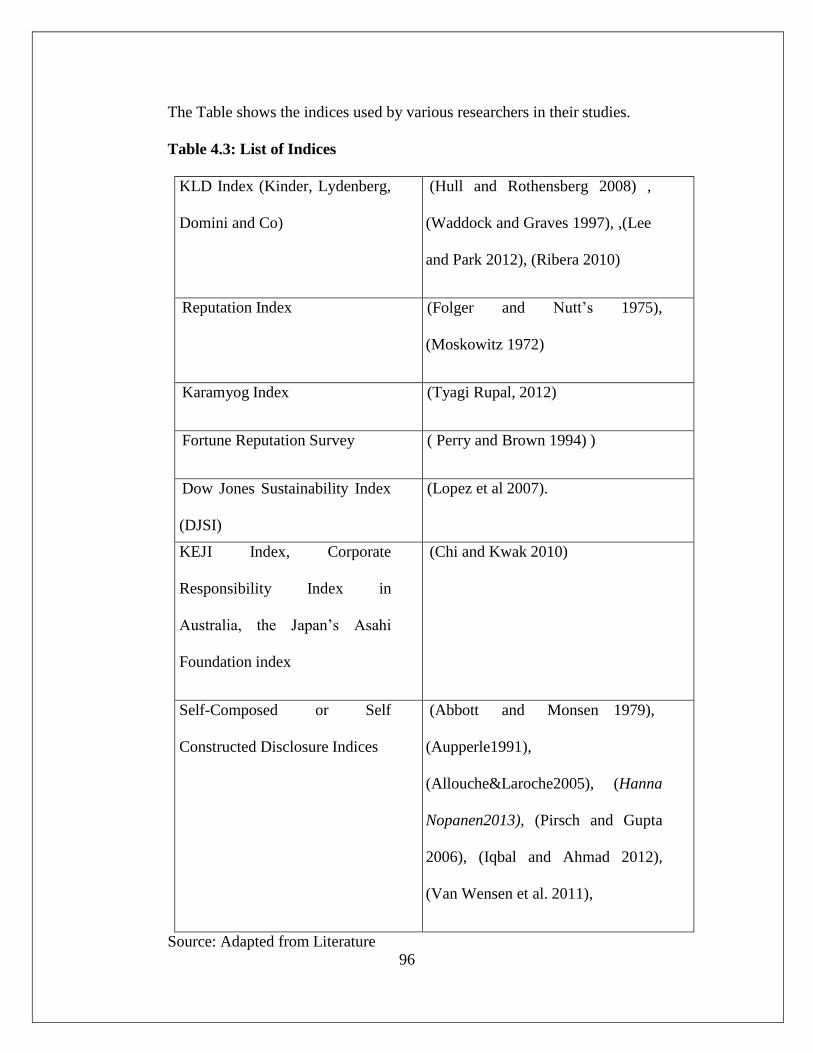
96
The Table shows the indices used by various researchers in their studies.
Table 4.3: List of Indices
KLD Index (Kinder, Lydenberg,
Domini and Co)
(Hull and Rothensberg 2008) ,
(Waddock and Graves 1997), ,(Lee
and Park 2012), (Ribera 2010)
Reputation Index (Folger and Nutt’s 1975),
(Moskowitz 1972)
Karamyog Index (Tyagi Rupal, 2012)
Fortune Reputation Survey ( Perry and Brown 1994) )
Dow Jones Sustainability Index
(DJSI)
(Lopez et al 2007).
KEJI Index, Corporate
Responsibility Index in
Australia, the Japan’s Asahi
Foundation index
(Chi and Kwak 2010)
Self-Composed or Self
Constructed Disclosure Indices
(Abbott and Monsen 1979),
(Aupperle1991),
(Allouche&Laroche2005), (Hanna
Nopanen2013), (Pirsch and Gupta
2006), (Iqbal and Ahmad 2012),
(Van Wensen et al. 2011),
Source: Adapted from Literature
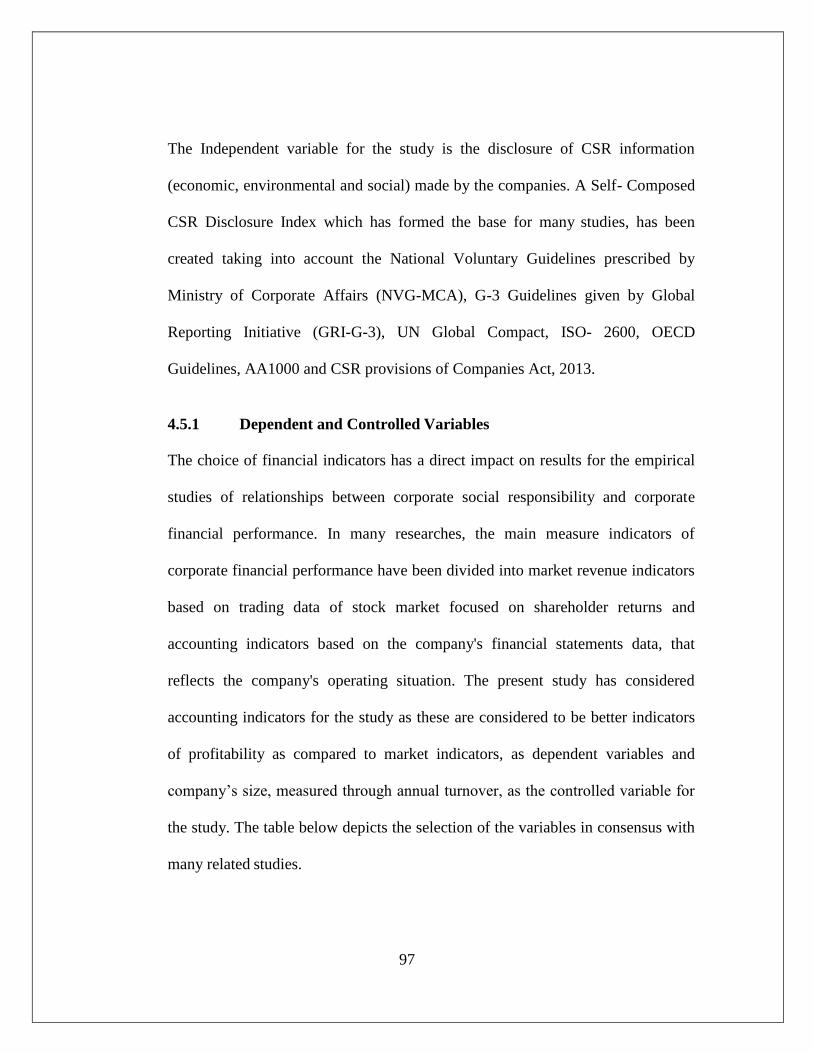
97
The Independent variable for the study is the disclosure of CSR information
(economic, environmental and social) made by the companies. A Self- Composed
CSR Disclosure Index which has formed the base for many studies, has been
created taking into account the National Voluntary Guidelines prescribed by
Ministry of Corporate Affairs (NVG-MCA), G-3 Guidelines given by Global
Reporting Initiative (GRI-G-3), UN Global Compact, ISO- 2600, OECD
Guidelines, AA1000 and CSR provisions of Companies Act, 2013.
4.5.1 Dependent and Controlled Variables
The choice of financial indicators has a direct impact on results for the empirical
studies of relationships between corporate social responsibility and corporate
financial performance. In many researches, the main measure indicators of
corporate financial performance have been divided into market revenue indicators
based on trading data of stock market focused on shareholder returns and
accounting indicators based on the company's financial statements data, that
reflects the company's operating situation. The present study has considered
accounting indicators for the study as these are considered to be better indicators
of profitability as compared to market indicators, as dependent variables and
company’s size, measured through annual turnover, as the controlled variable for
the study. The table below depicts the selection of the variables in consensus with
many related studies.

98
Table 4.4: List of Dependent (D) and Controlled (C) Variables
D/C Dependent
variables
Related Literature
D Return on Equity
(ROE)
(Qui 2012), (Waddock and Graves
1997), Cochran and Wood (1984),
(Tsoutsoura 2004), (Hackston and
Milne1996), (Wibowo,2012)
D Return on Assets
(ROA)
(Qui 2012), (Waddock and Graves
1997), (Berman, Wicks, Kotha and
Jones1999), (Simpson and Kohres
2002) Cochran and Wood (1984),
(Tsoutsoura2004), (Hackston and
Milne1996), (Cahan, et.al 2012), (Lang
and Lundholm 1993), (Wibowo,2012)
D Profit after tax
(PAT)
(Wibowo 2012), (Hossain et.al. 2006),
(Lu et al. 2014), (Zaborek 2014)
D Debt Equity (D/E) (Simpson and Kohres 2002), (Frankel,
Mc Nichols, and Wilson 1995), Cahan
et.al (2012), (Leftwich, Watts, and
Zimmerman 1981)
C Firm Size (Palmer Harmony, 2012), (Stanwick and
Stanwick, 1998) McWilliams and Siegel

99
(2000) and (D’Arcimoles and Trebucq,
2002) (Cohen et al. 1987), (Haniffa&
Cooke 2005), (Cahan,et.al 2012)
Source: Adapted from Literature
4.6 HYPOTHESES DEVELOPMENT
Hypothesis 1: There is a positive relationship between the disclosure of
Sustainability performance information and Return on Equity.
Hypothesis1a: There is a positive relationship between the disclosure of Economic
performance information and Return on Equity.
Hypothesis1b: There is a positive relationship between the disclosure of
Environmental performance information and Return on Equity.
Hypothesis 1c: There is a positive relationship between the disclosure of Social
performance information and Return on Equity.
Hypothesis 2: There is a positive relationship between the disclosure of
Sustainability performance information and Profit after Tax.
Hypothesis 2a: There is a positive relationship between the disclosure of Economic
performance information and Profit after Tax.
Hypothesis 2b: There is a positive relationship between the disclosure of
Environmental performance information and Profit after Tax.

100
Hypothesis 2c: There is a positive relationship between the disclosure of Social
performance information and Profit after Tax.
Hypothesis 3: There is a positive relationship between the disclosure of
Sustainability performance information and Return on Assets.
Hypothesis 3a: There is a positive relationship between the disclosure of Economic
performance information and Return on Assets
Hypothesis 3b: There is a positive relationship between the disclosure of
Environmental performance information and Return on Assets
Hypothesis 3c: There is a positive relationship between the disclosure of Social
performance information and Return on Assets
Hypothesis 4: There is a negative relationship between the disclosure of
Sustainability performance information and Debt/Equity.
Hypothesis 4a: There is a negative relationship between the disclosure of Economic
performance information and Debt/Equity
Hypothesis 4b: There is a negative relationship between the disclosure of
Environmental performance information and Debt/Equity
Hypothesis 4c: There is a negative relationship between the disclosure of Social
performance information and Debt/Equity
101
Hypothesis 5: There is a positive relationship between the disclosure of
Sustainability performance information and Return on Equity after controlling the
size of the firm.
Hypothesis 6: There is a positive relationship between the disclosure of
Sustainability performance information and Profit after tax after controlling the size
of the firm
Hypothesis 7: There is a positive relationship between the disclosure of
Sustainability performance information and Return on Assets after controlling the
size of the firm
Hypothesis 8: There is a negative relationship between the disclosure of
Sustainability performance information and Debt/Equity after controlling the size
of the firm.
Hypothesis 9: There is a positive relationship between the Corporate Social
Responsibility initiatives taken by the firms and the Corporate Financial
Performance of the firm.

102
4.7 STATISTICAL TOOLS AND TECHNIQUES (HYPOTHESIS 1 T0 8)
In this study:
1. Hypothesis1 to Hypothesis 4 studies the relationship between the CSR
disclosure information (economic, environmental and social) and the CFP
(return on assets, return on equity, profit after tax and debt/equity)
2. Hypothesis 5 to Hypothesis 8 studies the relationship between the CSR
disclosure information (economic, environmental and social) and the CFP
(return on assets, return on equity, profit after tax and debt/equity),
controlling the size of the firm, which has been measured through Annual
Turnover
To test the Hypothesis1 to Hypothesis 8, the statistical tools and techniques used
are:
I. Content Analysis
II. Multiple Regression Analysis
4.7.1 Content Analysis-Coding Procedure
Content analysis, first used by (Bowman and Haire 1975) used to assign the score
or a specific value to each parameter related to companies’ CSR identified in the
company’s various reports or annual report and then evaluate the total score. This
is a very objective method. (Abbott and Monsen 1979), (Ingram 1978), (Hackston
and Milne 1996), (Anderson and Frankle 1980) (Hughes et al. 2001). Content

103
Analysis has been used to assign scores to the sample companies. Many
researchers have used the content analysis as the coding procedure (Frost et. al.
2005), (Jones et. al. 2007), (Wibowo 2012), (Hossain et.al 2006), (Cahanet.al
2012). The researchers have a difference of opinion in deciding for the unit of
analysis to determine the disclosure of information by different companies. The
table below shows the different unit of analysis adopted by different researchers.
Table 4.5: Units of Analysis for CSR Information in Companies Reports
Number of pages (Trotman 1979), (Cowen et. al. 1987)
Number of words (Deegan and Gordon 1996), (Deegan and
Rankin1996), (Holland and Foo 2003)
Number of sentences (Buhr 1998), (Raar 2002), (Hackston and
Milne 1996), (Milne and Adler 1999)
Number of words and
sentences
(Cunningham and Gadenne2003)
CSR categories (Saleh and Zulkifli 2010), (Hassan 2010)
Source: Adapted from Literature
For this study, the content analysis was done and the scores were assigned on the basis
of the corporate social responsibility information disclosed by the companies in their
reports. The information has been divided into the three head categories: Economic,

104
Environmental and Social and a self-composed CSR disclosure index (CSRDI) has
been created. The CSRDI has been constituted with Triple Bottom Line effect as the
base, taking into account the dimensions included in all the global and Indian guidelines
prescribed for CSR reporting in India. The Index contains 15 Economic, 11
Environmental and 31 Social CSR information variables disclosed by the companies
during the period of five years (2009-2014).The composite score of individual
companies have been calculated by assigning score 1(one) to each variable reported
anywhere in the annual report or website and 0 (zero) if not reported. A composite CSR
disclosure score out of a total score of 57 has been assigned.
4.7.2 Multiple Regression Analysis
This study uses two Regression models:
i. To test Hypothesis1 to Hypothesis 4, multiple regression model with no
controlled variable was used to investigate and examine the relationship
between the independent variable i.e. CSR disclosure information (economic,
environmental and social) and each of the dependent variables
i.e. return on assets, return on equity, profit after tax and debt equity.
ii. To test Hypothesis 5 to Hypothesis 8, multiple regression model with
controlled variable: annual turnover, was used to investigate and examine the
relationship between the independent variable i.e. CSR disclosure information
(economic, environmental and social) and each of the
dependent variables i.e. return on assets, return on equity, profit after tax and
debt equity.
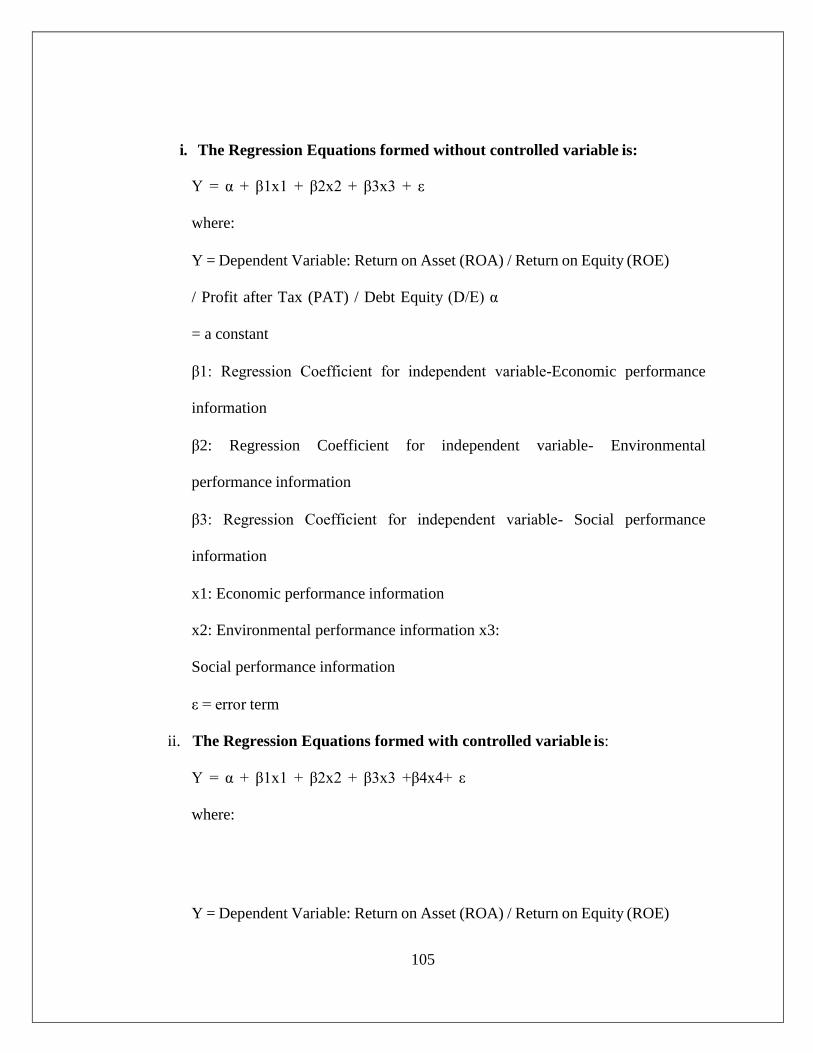
105
i. The Regression Equations formed without controlled variable is:
Y = α + β1x1 + β2x2 + β3x3 + ε
where:
Y = Dependent Variable: Return on Asset (ROA) / Return on Equity (ROE)
/ Profit after Tax (PAT) / Debt Equity (D/E) α
= a constant
β1: Regression Coefficient for independent variable-Economic performance
information
β2: Regression Coefficient for independent variable- Environmental
performance information
β3: Regression Coefficient for independent variable- Social performance
information
x1: Economic performance information
x2: Environmental performance information x3:
Social performance information
ε = error term
ii. The Regression Equations formed with controlled variable is:
Y = α + β1x1 + β2x2 + β3x3 +β4x4+ ε
where:
Y = Dependent Variable: Return on Asset (ROA) / Return on Equity (ROE)

106
/ Profit after Tax (PAT) / Debt Equity (D/E)
α = a constant
β1: Regression Coefficient for independent variable- Economic performance
information
β2: Regression Coefficient for independent variable- Environmental
performance information
β3: Regression Coefficient for independent variable- Social performance
information
β4: Regression Coefficient for controlled variable, sales
x1: Economic performance information
x2: Environmental performance information x3:
Social performance information
x4: Controlled variable, sales
ε = error term
Before applying the regression models, the data has been checked for its
normality and multi collinearity. The normality has been checked using
Skewness and Kurtosis
Table 4.6: Skewness and Kurtosis- Shape of Distribution

107
Shape of the
Distribution
Skewness
Value
Shape of the
Distribution
Kurtosis
Value
Normal Zero Normal Zero
Positively Skewed Positive Pointed (Leptokurtic) Positive
Negatively Skewed Negative Flat (Platykurtic) Negative
The acceptable values for skewness and kurtosis are between -2 and 2.
When two or more independent variables are highly correlated, the variables
are said to be multi collinear and when two or more independent variables are
perfectly correlated the existence of singularity between the variables is
confirmed. The multi co linearity and linearity between the variables were
determined by considering the Variance Inflation Factor (VIF) value. Even
though the rule of thumb is that Variance Inflation Factor (VIF) figures of more
than 10 represent the existence of multi co linearity. (Freund and Littell 2000)
suggested that VIF figures below 5 specify the lack of multi co linearity. The
acceptable VIF value in this study was considered less than 3 (Ofori et.al.
2014)

108
CSR_SOC
CSR
CSR_ECO
CSR_ENV
CFP
4.8 STATISTICAL TOOLS & TECHNIQUES USED
(HYPOTHESIS 9)
The third objective of the study: to examine the perception of employees
regarding the implementation of the new Companies Act 2013 provisions
being followed by the companies was confirmed by the 7 statements in the
questionnaire and these were analysed using Percentage and Pie Charts.
Using Exploratory Factor Analysis (EFA) followed by Structural Equation
Modelling (SEM) tested the fourth objective of examining the relationship
between CSR initiatives and CFP. The statistical program IBM SPSS
(Statistical Product and Service Solutions, developed by SPSS Company of
America,) Statistics 20 and AMOS 22 is employed in the study for which a
Conceptual Model was proposed.
Figure 4.1: The Proposed Conceptual Model
Source: Own Elaboration

109
4.8.1 Exploratory Factor Analysis (EFA)
The present study entails examining relationship between CSR involvement and
CFP. The multi‐dimension scale developed to determine involvement in CSR was
reduced using the exploratory factor analysis to test the relationship between the
CSR and CFP of the sample firms. EFA helps the researcher to explore the
observed variables, which inter-correlate freely (Anderson and Gerbing 1988) and
seek to find a model that fits the data (Sweeny 2009). Factor rotation is used to
maximize the sum of variances of required loadings of the factor matrix. Loadings
closer to -1 or +1 indicate high association between the variable and the factor,
whereas loadings closer to 0 indicate a lack of association (Hair et al. 2010). To
assess the suitability of use of Exploratory Factor Analysis, it has to be ensured
that:
1. The data should be either interval or ratio scale data and the variables are
identified through exploratory research. A five or seven-point Likert scale may
be used.
2. The size of the sample respondents should be at least four to five times more than
the number of variables and these variables should be highly correlated.
3. A correlation matrix of the variables should be computed and tested for its
statistical significance by using a Barttlet test of sphericity, which takes the
determinant of the correlation matrix into consideration. Value less than 0.05
means that the factor analysis may be useful for the selected data.

110
4. The value of Kaiser-Meyer-Olkin (KMO) statistics is to be calculated, to
compare the degree of observed correlation coefficients with the degree
of partial correlation coefficients. KMO takes the value between 0 and 1
and it should be greater than .05.
Once EFA is completed, a reliability test is conducted to assess the measures are
consistent (Peter 1979). The widely used measure of reliability, the coefficient
alpha (Cronbach’s alpha), is employed to assess the internal consistency of the
scale. It takes values from 0 to 1, closer the value is to 1, the better it is.
Cronbach's alpha is thus analogous to a correlation coefficient (Hrach, Mihola,
2006).
4.8.2 Structural Equation Modelling (SEM)
Structural Equation Modelling (SEM) was used to evaluate the full model under
investigation, using AMOS 22 Software- a computer program capable of
capturing all interactions represented in a conceptual model and examine them
as a single statistical test. In addition, SEM method provides individual metrics
for evaluation of particular bivariate relationships. The structural equation
analysis has the advantage of analysing the definition of the latent constructs in
the context of a group of causal effects. (Maduenoa et.al. 2015).
SEM is a multivariate statistical analysis which is the combination of factor
analysis and multiple regression analysis, and is used to analyze the structural
relationship between measured variables and latent constructs. The method is
favored by the researcher because it estimates the multiple and interrelated

111
dependence in a single analysis. The parameter estimates are obtained for a SEM
model using the Multi-Dimension Scale.
4.8.2.1 Model Fit
Model fit refers to the extent to which a hypothesized model is consistent with
the data and determines the acceptance or rejection of the model.
1. The Root MS Error of Approximation (RMSEA) focuses on the discrepancy
between the model and population covariance matrices per degree of
freedom. An RMSEA value ranges from .05 to .1 with .05 or less indicating a
perfect fit and .1 indicating a complete lack of fit.
2. The Adjusted Goodness of Fit Index (AGFI) is an absolute fit index, which
directly assesses how well the covariance predicted from the parameter
estimates reproduce the sample covariance. The threshold value for a well-
fitted model is more than equal to .08.
3. The Root MSd Residual (RMSR) is a measure of residual variance, reflecting
the average amount of variances and covariance not accounted for by the
model. The values below .05 are interpreted as indicating good model fit.

112
4. The Normed Fit Index (NFI) compares chi square values of the proposed
model to a null model. It ranges from 0 to 1 with 1 indicating perfect fit and 0
denoting a complete lack of fit.
5. Comparative Fit Index (CFI) provides a major of complete covariation in data.
The value of CFI determines whether the hypothesized model adequately
describes the sample data or not. A value of > .90 is considered
representative of a well-fitting model.
ANALYSIS AND INTERPRETATION

113
The previous chapter presented the research methodology used to investigate
the problem. This chapter begins with the analysis of the objectives of the study
and is divided into four sections, each analyzing the four objectives separately.
The first two sections A and B covers the secondary data analysis, while the
sections C and D covers the primary data analysis.
1. Section A: analyses the guidelines followed by the sample companies for
disclosing corporate social responsibility activities. This is followed by the
year wise disclosure analysis of the corporate social responsibility practices
by the companies.
2. Section B: analyses the relationship between Corporate Social
Responsibility Disclosure and the Corporate Financial Performance using
Multiple Regression Analysis. Firstly, the normality of the data is checked
followed by the analysis of descriptive statistics of the data. Then the results
of the regression analysis are discussed after examining the satisfaction of
the assumptions of applying Multiple Regression Model.
3. Section C: analyses the employees’ perception on the provisions of New
Companies Act 2013 followed by the companies.
4. Section D: analyses the relationship between Corporate Social
Responsibility initiatives and the Corporate Financial Performance using

114
Factor Analysis and Structural Equation Modeling.
5.1 Section A: Corporate Social Responsibility Disclosure
5.1.1 Guidelines for CSR Disclosure
All the companies disclose the corporate social responsibility initiatives take by the
company. The examination of the CSR disclosure companies was conducted by
evaluating the reports published by the companies in the period of five years
starting from 2009-10 to 2013-14, which was available on the websites of the
companies. The reports are either in the form of CSR report or Sustainability report
or Business Responsibility report. The disclosure through such reports is a rare
phenomenon. Most of the companies did not disclose the CSR initiatives through
any of these reports. For studying such companies’ disclosure, a thorough study of
their annual reports was done. A total of 130 reports were analysed. Some
companies followed GRI-G-3 guidelines and some the NVG guidelines laid by
Ministry of Corporate Affairs. For detailed analysis, Table 5.1 can be referred to.
A depiction of the way of reporting done by companies in the period of five years
is shown in Table 5.1.

115
Table 5.1: Types of Reports Maintained by the Companies
Years Type of Reports No. of Companies
2009-10 GRI Report 02
Sustainability Report 02
Business Responsibility Report. 0
Annual Report 21
UNGC Report 03
2010-11 GRI Report 02
Sustainability Report 05
Business Responsibility Report. 0
Annual Report 20
UNGC Report 02
2011-12 GRI Report 05
Sustainability Report 5
Business Responsibility Report. 04
Annual Report 19
UNGC Report 0
2012-13 GRI Report 05
Sustainability Report 05
Business Responsibility Report. 05
Annual Report 18
UNGC Report 0

116
2013-14 GRI Report 05
Sustainability Report 06
Business Responsibility Report. 06
Annual Report 17
UNGC Report 0
Source: Own elaboration
The table shows that in 2009-10, 21 companies had disclosed the CSR
information in their annual reports. 2 companies had prepared GRI report and 2
companies prepared sustainability reports. 3 companies also prepared UNGC
reports. From 2010-14, the number of companies disclosing CSR activities
through annual reports reduced marginally to 20 in 2011, 19 in 2012, 18 in 2013
and 17 in 2014. In 2009-10 and 2010-11, no company prepared the Business
Responsibility Report. However, in 2011-12, 2012-13 and 2013-14, the number of
companies disclosing their CSR initiatives through BRR was 4, 5 and 6
respectively. Around 5-6 companies from the year 2010-11 to 2013-14 also
maintained the sustainability reports. The table also shows that all the companies
in the form of one report or another disclosed the CSR information. However,
most of the sample companies are not following some stipulated guidelines or a
standard reporting structure for CSR disclosure. Such companies are large in
number and have been disclosing their CSR practices either in the form of a
separate section ‘Corporate Social Responsibility’ in their annual reports or in
Director’s report. While other companies are disclosing just in the form of a

117
500
450
400
350
300
250
200
150
100
50
0
433 433 404
351 369
260 263 268 275 275
132 131 134 144 147
2009-10 2010-11 2011-12 2012-13 2013-14
Years
Economic Environmetal Social
small paragraph under the head ‘Management Discussion’ in the annual report. A
few companies also disclose their initiatives on their webpages.
5.1.2 Year-wise Disclosure Analysis of CSR Practices by Companies
The CSR Disclosure of five years from 2009-10 to 2013-14 was examined for all
the companies. The CSR Disclosure information by the companies was divided
into three dimensions: economic, environmental and social.
Fig 5.1: Year-wise Disclosure Analysis of CSR practices
The Figure 5.1 depicts that the CSR disclosure scores of the sample companies
have increased over the period of five years.
There has been marginal increase in the CSR (Economic) disclosure score from
260 in 2009-10 to 275 in 2013-14.
The companies have also increased the number of environmental and social
initiatives taken by them. The CSR (Environmental) disclosure score has
CS
R D
isc
los
ure
Sc
ore

118
increased from 132 to 147 and social score has increased to a large extent from
351 to 433.The chart depicts that the companies’ contribution towards social
initiatives is more than the environmental and economic contribution. With the
increased awareness of the significance of CSR contribution, the companies have
eventually increased their CSR initiatives. A major reason is also the latest clause
of Companies Act 2013 stating that every company satisfying a certain criteria is
mandatorily required to invest 2% of their average profits of the preceding three
years in CSR activities, failing which that have to submit a report to the Ministry
of Corporate Affairs stating the reason of non- contribution.
5.2 Section B: Relationship between CSR Disclosure and CFP
The normality of the data collected has been tested by using Skewness
and Kurtosis
Table 5.2: Results of Skewness and Kurtosis Tests
Economic Environme
ntal
Social PAT D/E ROA ROE
Valid 130 130 130 130 127 125 125
Skewness -.331 -.057 .142 1.811 1.579 3.50 4.50
Kurtosis -.664 -1.422 -1.323 2.111 3.618 12.915 16.935
Table 5.2 shows the results of skewness of the Independent variables: the
economic performance information distribution (-.331), environmental

119
performance information distribution (-.057) and social performance information
distributions (.142) are within the acceptable values of skewness. On the other
hand the skewness of the dependent variables: PAT (1.811) and D/E (1.579) are
within the acceptable value of -2 and +2. However the skewness statistics of ROA
(3.50) and ROE (4.50) shows that both the distributions are positively skewed
Table 5.2 also shows the kurtosis statistics of Independent variables: the economic
performance information distribution (-.664), environmental performance
information distribution (-1.422) and social performance information distribution
(-1.323) are within the acceptable values of -2 and +2 and hence are normal.
However, the kurtosis statistics for PAT (2.111) is marginally exceeding the
kurtosis acceptable limit, while ROA (12.915) and ROE (16.935) exceed the
acceptable value of +2. All the three variables have a leptokurtic distribution. The
data was also checked for its multi collinearity in the table below:

120
Table 5.3: Calculation of VIF Values
Model: Dependent Variable:
PAT
Collinearity
Statistics
VIF
Economic 1.957
1.738
2.439
Environmental
Social
Model: Dependent Variable: ROA
Economic 1.940
1.727
2.419
Environmental
Social
Model: Dependent Variable: ROE
Economic 1.957
1.738
2.439
Environmental
Social
Model: Dependent Variable: D/E
Economic 1.951
1.734
2.431
Environmental
Social
Source: Own Elaboration

121
The Table 5.3 shows the VIF Values. It has been analyzed that all the VIF Values
are less than 3, hence the data is multi collinear, which means that all the
independent variables are not correlated and have an individual effect on all the
dependent variables.
5.2.1 Descriptive Statistics
Table 5.4: Descriptive Stats
Economic nvironmental Social PAT D/E ROA ROE
Vali d 130 130 130 130 127 125 130
Mean .68 .48 .49 613.09 .62 21.60 21.38
SD
.223 .35 .32 928.78 .618 32.41 16.69
Minimum .20 .00 .00 -16.36 0 -3 -4.02
Maximum 1.00 1.00 1.00 3757.87 3 176 111.58
Table 5.4 shows the mean, standard deviation, minimum and maximum of the
economic performance information, environmental performance information, and
social performance information disclosed by companies.
The table shows that the mean for the economic, environmental and social
performance information disclosed is .68, .48 and .49 respectively, which means
that the economic performance information has been disclosed more than the
environmental and social performance information.

122
5.2.2 Multiple Regression Analysis
Hypothesis 1: There is a positive relationship between the disclosure of
Sustainability performance information and Return on Equity.
Hypothesis 1a: There is a positive relationship between the disclosure of
Economic performance information and Return on Equity.
Hypothesis 1b: There is a positive relationship between the disclosure of
Environmental performance information and Return on Equity.
Hypothesis 1c: There is a positive relationship between the disclosure of Social
performance information and Return on Equity.
Table 5.5 a: Model Summary of Regression of Disclosure of Sustainability
Performance Information on Return on Equity
Model R R2
Adjusted R2
SE of the Estimate
1 .212 .045 .022 16.51108
Table 5.5 b : ANOVA Table
Model SS df MS F Sig.
1
Regression 1613.541 3 537.847 1.973 .121
Residual 34349.596 126 272.616
Total 35963.137 129

123
Table 5.5 c : Regression Coefficients of Disclosure of Sustainability
Performance Information on Return on Equity
Model U C S C t Sig.
B SE
Beta
1
(Constant) 15.681 4.876 3.216 .002
Economic 7.659 9.111 .102 .841 .402
Environmental -9.371 5.449 -.197 -1.720 .088
Social 10.010 6.945 .196 1.441 .152
The Table shows the relationship between the disclosures of:
1a. Economic performance information and ROE, r (130) = .402, p> .05.
1b. Environmental performance information & ROE, r (130) =.088, p >.05.
1c. Social performance information and ROE, r (130) = .152, p>.05.
The result shows that the null hypothesis i.e. there is no positive relationship
between the disclosure of CSR information (economic, environmental and
social) variables and return on equity, is accepted because all the p values are >
.05. This implies that there is no positive relationship between the CSR
information (economic, environmental and social) variables and return on
equity.
Hypothesis 2: There is a positive relationship between the disclosure of
Sustainability performance information and Profit after tax

124
Hypothesis 2a: There is a positive relationship between the disclosure of
Economic performance information and Profit after Tax.
Hypothesis 2b: There is a positive relationship between the disclosure of
Environmental performance information and Profit after Tax.
Hypothesis 2c: There is a positive relationship between the disclosure of Social
performance information and Profit after Tax.
Table 5.6 a: Model Summary of Regression of Disclosure of Sustainability
Performance Information on Profit After Tax
Model R R2 Adjusted
R2
SE of the Estimate
1 .611 .373 .358 743.93269
Table 5.6 b : ANOVA Table
Model SS df MS F Sig.
1
Regression 41547146.736 3 13849048.912 25.024 .000
Residual 69732917.560 126 553435.854
Total 111280064.296 129

125
Table 5.6 c : Regression Coefficients of Disclosure of
Sustainability Performance Information on Profit
After Tax
Model U C S C t Sig.
B SE Beta
1
(Constant) -748.327 219.707 -3.406 .001
Economic 1199.248 410.521 .288 2.921 .004
Environmental 96.884 245.492 .037 .395 .694
Social 992.506 312.934 .349 3.172 .002
The Table shows the relationship between the disclosures of:
2a. Economic performance information & PAT, r (130) = .004, p< .05.
2b. Environmental performance information & PAT, r (130) =.694, p< .05.
2c. Social performance information & PAT, r (130) = .002, p< .05.
The result shows that the null hypothesis i.e. there is no positive relationship between
the disclosure of CSR information (economic, environmental and social) variables
and profit after tax (PAT) is partially rejected and partially accepted because the p
values of economic and social information variables and PAT are < .05, but the value is
> .05 of the environmental information variables and PAT. This implies that there
exists a positive relationship between the CSR information (economic and social)
variables and profit after tax and no significant relationship between CSR information
(environmental) variables and PAT

126
Hypothesis 3: There is a positive relationship between the disclosure of
Sustainability performance information and Return on Assets.
Hypothesis 3a: There is a positive relationship between the disclosure of
Economic performance information and Return on Assets
Hypothesis 3b: There is a positive relationship between the disclosure of
Environmental performance information and Return on Assets
Hypothesis 3c: There is a positive relationship between the disclosure of Social
performance information and Return on Assets
Table 5.7 a : Model Summary of Regression of Disclosure of Sustainability
Performance Information on Return on Assets
Model R R2 Adjusted
R2
SE of the
Estimate
1 .091 .008 -.016 32.677
Table 5.7 b : ANOVA Table
Model SS df MS F Sig.
1
Regression 1070.052 3 356.684 .334 .801
Residual 129200.859 121 1067.776
Total 130270.911 124

127
Table 5.7 c : Regression Coefficients of Disclosure of Sustainability
Performance Information on Return on Assets
Model U C S C t Sig.
B SE Beta
1
(Constant) 24.230 9.651 2.511 .013
Economic -8.223 18.046 -.057 -.456 .649
Environmental 10.154 10.792 .112 .941 .349
Social -3.809 13.948 -.038 -.273 .785
The Table shows the relationship between the disclosures of:
3a. Economic performance information & ROA, r (130) = .649 p> .05.
3b. Environmental performance information & ROA, r (130)=.349, p>.05.
3c. Social performance information and ROA, r (130) = .785, p> .05.
The result shows that the null hypothesis i.e. there is no positive relationship
between the disclosure of CSR information (economic, environmental and
social) variables and return on assets (ROA) is accepted because all the p values
are > .05. This implies that there does not exists a positive relationship between
the CSR information (economic, environmental and social) variables and return
on assets.

128
Hypothesis 4: There is a negative relationship between the disclosure of
Sustainability performance information and Debt/ Equity.
Hypothesis 4a: There is a negative relationship between the disclosure of
Economic performance information and Debt/Equity
Hypothesis 4b: There is a negative relationship between the disclosure of
Environmental performance information and Debt/Equity
Hypothesis 4c: There is a negative relationship between the disclosure of Social
performance information and Debt/Equity
Table 5.8 a : Model Summary of Regression of Disclosure of Sustainability
Performance Information on Debt/Equity
Model R R2 Adjusted R2 SE of the Estimate
1 .083 .007 -.017 .623
Table 5.8 b : ANOVA Table
Model SS df MS F Sig.
1
Regression .334 3 .111 .287 .835
Residual 47.788 123 .389
Total 48.122 126
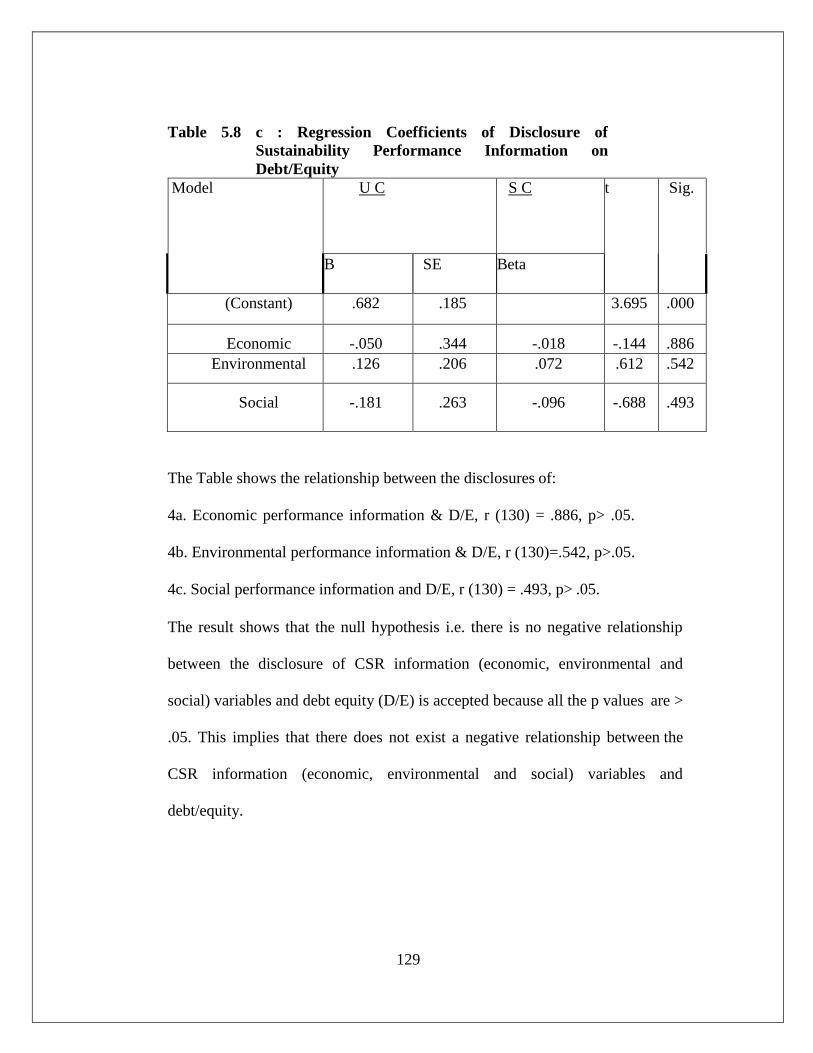
129
Table 5.8 c : Regression Coefficients of Disclosure of
Sustainability Performance Information on
Debt/Equity
Model U C S C t Sig.
B SE Beta
(Constant) .682 .185 3.695 .000
Economic -.050 .344 -.018 -.144 .886
Environmental .126 .206 .072 .612 .542
Social -.181 .263 -.096 -.688 .493
The Table shows the relationship between the disclosures of:
4a. Economic performance information & D/E, r (130) = .886, p> .05.
4b. Environmental performance information & D/E, r (130)=.542, p>.05.
4c. Social performance information and D/E, r (130) = .493, p> .05.
The result shows that the null hypothesis i.e. there is no negative relationship
between the disclosure of CSR information (economic, environmental and
social) variables and debt equity (D/E) is accepted because all the p values are >
.05. This implies that there does not exist a negative relationship between the
CSR information (economic, environmental and social) variables and
debt/equity.

130
Hypothesis 5: There is a positive relationship between the disclosure of
Sustainability performance information and Return on Equity after
controlling the size of the firm
Table 5.9 a : Model Summary of Regression of Disclosure of
Sustainability Performance Information on Return on
Equity after controlling the size of the firm
Model R R2
Adjusted R2
SE of the Estimate
1 .212 .045 .014 16.57580
Table 5.9 b : ANOVA Table
Model SS df MS F Sig.
1
Regression 1618.499 4 404.625 1.473 .214
Residual 34344.638 125 274.757
Total 35963.137 129
Table 5.9 c : Regression Coefficients of Disclosure of Sustainability
Performance Information on Return on Equity after
Controlling Size of Firm
Model U C S C t Sig.
B SE Beta
1
(Constant) 15.431 5.238 2.946 .004
Economic 8.024 9.543 .107 .841 .402

131
Environmental -9.225 5.576 -.194 -1.654 .101
Social 10.283 7.262 .201 1.416 .159
Sales -2.050E-005 .000 -.017 -.134 .893
The Table shows the relationship between the disclosures of:
5a. Economic performance information & ROE, r (130)= .402, p> .05.
5b. Environmental performance information & ROE, r(130)=.101, p>.05.
5c. Social performance information and ROE, r (130) = .159, p> .05.
The result shows that the null hypothesis i.e. there is no positive relationship
between the disclosure of CSR information (economic, environmental and social)
variables and return on equity (ROE), after controlling sales variable, is accepted
because all the p values are > .05. This implies that there does not exist a positive
relationship between the CSR information (economic, environmental and social)
variables and return on equity, after controlling size of the firm.
Hypothesis 6: There is a positive relationship between the disclosure of
Sustainability performance information and Profit after tax after controlling
the size of the firm

132
Table 5.10 a : Model Summary of Regression of Disclosure of Sustainability
Performance Information on Profit After Tax after Controlling
the Size of the Firm
Model R R2
Adjusted R2
SE of the Estimate
1 .775 .600 .587 596.63206
Table 5.10 b : ANOVA Table
Model SS df MS F Sig.
1
Regression 66783837.562 4 16695959.391 46.903 .000
Residual 44496226.734 125 355969.814
Total 111280064.296 129
Table 5.10c: Regression Coefficients of Disclosure of Sustainability
Performance Information on Profit After Tax after Controlling
the Size of the Firm
Model U C S C t Sig.
B SE Beta
1
(Constant) -183.697 188.534 -.974 .332
Economic 374.737 343.491 .090 1.091 .277
Environmental -231.588 200.712 -.088 -1.154 .251
Social 377.141 261.397 .133 1.443 .152
Sales .046 .005 .669 8.420 .000
The Table shows the relationship between the disclosures of:
6a. Economic performance information & PAT, r (130) = .277, p>.05.

133
6b. Environmental performance information & PAT, r (130) = .251, p> .05.
6c. Social performance information & PAT, r (130) = .152, p> .05.
The result shows that the null hypothesis i.e. there is no positive relationship
between the disclosure of CSR information (economic, environmental and
social) variables and profit after tax (PAT), after controlling sales variable, is
accepted because all the p values are > .05. This implies that there does not exist
a positive relationship between the CSR information (economic, environmental
and social) variables and profit after tax, after controlling size of the firm.
Hypothesis 7: There is a positive relationship between the disclosure of
Sustainability performance information and Return on Assets after controlling
the size of the firm.
Table 5.11 a : Model Summary of Regression of Disclosure of Sustainability
Performance Information on Return on Assets after Controlling the Size of
the Firm
Model R R2
Adjusted R2
SE of the Estimate
1 .121a .015 -.018 32.708
Table 5.11 b : ANOVA Results
Model SS df MS F Sig.
1
Regression 1891.570 4 472.892 .442 .778
Residual 128379.341 120 1069.828
Total 130270.911 124

134
Table 5.11 c : Regression Coefficients of Disclosure of Sustainability Performance
Information on Return on Assets after Controlling the Size of the
Firm
Model U C S C T Sig.
B SE Beta
1
(Constant) 20.843 10.405 2.003 .047
Economic -3.447 18.868 -.024 -.183 .855
Environmental 12.007 11.007 .132 1.091 .278
Social .671 14.868 .007 .045 .964
Sales .000 .000 -.118 -.876 .383
The Table shows the relationship between the disclosures of:
7a. Economic performance information & ROA (130) = .855, p> .05.
7b. Environmental performance information & ROA, r (130) = .278, p> .05.
7c. Social performance information and ROA, r (130) = .964, p> .05.
The result shows that the null hypothesis i.e. there is no positive relationship
between the disclosure of CSR information (economic environmental and social)
variables and return on assets (ROA), after controlling the sales of the firm, is
accepted because all the p values are > .05. This implies that there does not exists
a positive relationship between the CSR information (economic, environmental
and social) variables and return on assets, after controlling the size of the firm.

135
Hypothesis 8: There is a negative relationship between the disclosure of
Sustainability performance information and Debt/Equity after controlling
the size of the firm
Table 5.12 a : Model Summary of Regression of Disclosure of
Sustainability Performance Information on Debt Equity
after Controlling the Size of the Firm
Model R R2
Adjusted R2
SE of the Estimate
1 .138 .019 -.013 .622
Table 5.12 b : ANOVA Table
Model SS df MS F Sig.
1
Regression .915 4 .229 .591 .670
Residual 47.208 122 .387
Total 48.122 126
Table 5.12 c : Regression Coefficients of Disclosure of Sustainability Performance
Information on Debt Equity after Controlling the Size of the Firm
Model U C S C t Sig.
B SE Beta
(Constant) .597 .197 3.029 .003
Economic .076 .358 .028 .211 .833
1 Environmental .176 .209 .101 .840 .403
Social -.088 .274 -.047 -.322 .748
Sales -7.017E-006 .000 -.154 -1.225 .223
136
The Table shows the relationship between the disclosures of:
8a. Economic performance information and D/E, r (130) = .833, p> .05.
8b. Environmental performance information and D/E, r (130) = .403, p > .05.
8c. Social performance information and D/E, r (130) = .748, p> .05.
The result shows that the null hypothesis i.e. there is no negative relationship
between the disclosure of CSR information (economic, environmental and social)
variables and debt on equity (D/E), after controlling the size of the firm is accepted
because all the p values are > .05. This implies that there does not exist a negative
relationship between the CSR information (economic, environmental and social)
variables and debt on equity, after controlling the sales of the firm.
The numerous studies and researches conducted to examine the connection
between CSR disclosure and financial performance of the companies, a positive
(Graves and Waddock 1994), (Heinz 1976), (Sturdivant and Ginter 1977),
(Waddock and Graves 1997) (Maignan and Ralston 2002), negative (Friedman
1970), and no impact (Ullman 1985, (Alexander and Buchholz 1982), (Shane and
Spicer 1983) of CSR disclosure on CFP has been reported (Palmer Harmony 2012).
In the present research, the analysis of both the regression models with and without
using the controlled variables shows that there does not exist any relationship
between the CSR information (economic, environmental and social) disclosure and
corporate financial performance of the firm (McWilliams and Siegel (2001).
Results inconsistent with literature
137
The findings of the study are not consistent with (Jones 2007), who found that
corporations with higher leverage disclose more sustainability performance
information and with the results of (Hillman and Keim 2001) according to
which there exists a positive relation between CSR information and the return
on equity as a CFP variable. (Yang et al. 2009) with size and R and D as
control variables and regression analysis investigated that the impact of CSR
on the ROA is positive depending upon the periods. The other similar studies
which showed a relation between the two variables and were not in consensus
with present study analysis were by (Everaert et al 2009) who analysed a
positive relationship between the amount of CSR disclosure and profitability
of the company, using correlation coefficients and by (Waddock and Graves
1997) who claimed that companies having better financial situation can afford
better CSR practices. The regression analysis by (Simpson and Kohers 2002)
revealed that there is a significant positive relationship between the CSR
information and both dependent financial performance indicators of ROA and
loan losses. (Cochran and Wood 1984) outlined a positive correlation between
CSR and accounting performance after controlling for the age of assets like
(Dahlia 2008) and (Danu 2011) who also showed positive relationships
between corporate social responsibility and the company's performance (ROE).
However, a negative correlation with Return on Equity (ROE) existed in
financial industry while no relation existed in in the electronics industry.
(Nelling and Webb 2006) using the Granger causality approach and ordinary
least square (OLS) regression models furnished that CSP and FP are related.
138
(Preston and O’Bannon 1997) also located a negative relationship between CSR
information and the return on equity as a CFP variable.
Results consistent with literature
However, the results are consistent with (Iqbal, 2012), who found that corporate
social performance has insignificant relationship with the debt equity the firm.
(McWilliams and Siegel (2001) and (Aras, Aybars, and Kutlu 2010) also did
not find any significant relationship between CSR and CFP in none of the ways.
A study on this topic by (Mahoney and Roberts 2007) (Ahmed, Islam and Hasan
2012) did not find significant relationship between companies’ disclosure of
CSR activities and the financial performance. The multiple regression model
used in the study by (Fauzi 2009) highlighted a spurious relationship as also
concluded by (Orlitzki 2000). Even (Aile and Bausys 2013) found no evidence
for CSR activities having any effect on firm financial performance in the Baltic
States.
These findings are in line with the results of (Hackston and Milne 1996) and
(Aras et al. 2010) who used a similar methodology of content analysis and did
not find significant relationship between CSR and CFP (McWilliams and Siegel
2000) (Simpson and Kohers2002). (Aupperle, Carroll, and Hatfield 1985)(Aras
and Aybars, 2009) detected no significant relation between CSP and a firm’s
risk adjusted return on assets. (Lee and Park 2011) did not find any relationship
between the two variables in airline companies’. (Maaria-Gaia Soana 2011)
indicated that this research was based on the assumption of no correlation
between CSP and CFP.

139
The study had examined a positive relationship between the environmental
information disclosure and profit after tax when size of the company was taken
as the controlled variable. The results are in consensus with the study (Aras,
Aybars, and Kutlu 2010) that showed a significant relationship between CSR
disclosure and company size control variables. The results are different from
the study of (Saleh, Zulkifli and Muhamad 2008) (Mahoney and Roberts 2007)
according to which the environmental and society related CSR activities had
negative relationship with financial performance. It is also not in consensus
with (Makin and Fancouer, 2008) findings which suggested significant negative
impact of the environmental dimension of CSP on FP. Cormier and Gordon
(2001) also established a significant negative relation between social
disclosures and economic performance. Likewise, (De Villiers and Van Staden
2011) found that economic performance in the form of ROA was negatively
related to environmental disclosure in the annual report, indicating that more
disclosures are made by the firms with bad economic performance. Lastly,
(Roberts 1992) established a positive relationship between earnings and social
disclosures, and (Clarks et.al 2011) find that proactive environmental strategies
are more likely to be implemented by the firms with good financial
performance and resources.
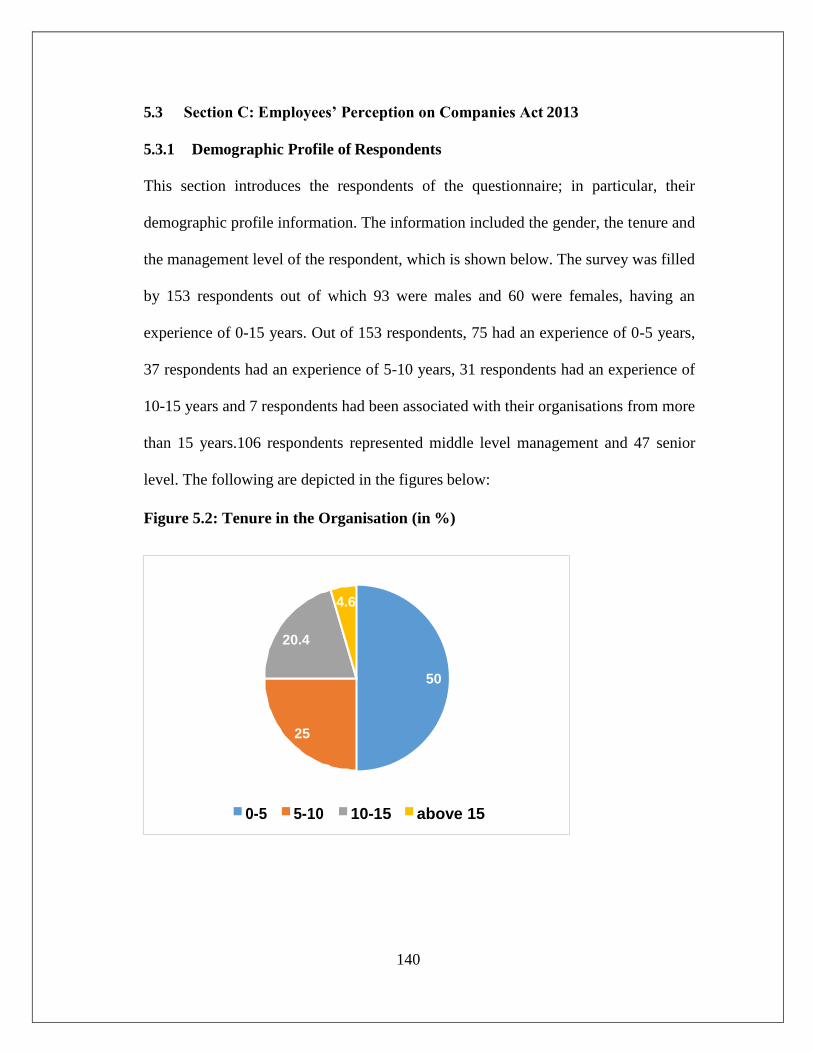
140
5.3 Section C: Employees’ Perception on Companies Act 2013
5.3.1 Demographic Profile of Respondents
This section introduces the respondents of the questionnaire; in particular, their
demographic profile information. The information included the gender, the tenure and
the management level of the respondent, which is shown below. The survey was filled
by 153 respondents out of which 93 were males and 60 were females, having an
experience of 0-15 years. Out of 153 respondents, 75 had an experience of 0-5 years,
37 respondents had an experience of 5-10 years, 31 respondents had an experience of
10-15 years and 7 respondents had been associated with their organisations from more
than 15 years.106 respondents represented middle level management and 47 senior
level. The following are depicted in the figures below:
Figure 5.2: Tenure in the Organisation (in %)
4.6
20.4
50
25
0-5 5-10 10-15 above 15

141
Figure 5.3: Gender (in %)
Figure 5.4: Managerial Level of the Employees (in %)
30.3
69.7
Middle Level Senior Level
39.5
60.5
Male Female

142
5.3.2 Employees’ Perception on Companies Act 2013 provisions
The employees’ perception of the provisions of Companies Act 2013 regarding the
mandatory expenditure on CSR activities have also been analysed and shown below.
5.3.2.1 Conduct of Research for CSR Activities
The figure below explains the perception of employees towards conduct of research by
the companies for undertaking CSR activities in an effective manner, irrespective of
the high cost involved. It was observed that 31.60% of the total number of employees
strongly agreed and 43.40% of the employees agreed that the companies should
conduct research for undertaking CSR activities in the effective manner. 19.70% of
total number of employees were neutral in their opinion. However, 5% of the
respondent empolyees didn’t favour research for undertaking CSR activities due to the
high cost involved in it.
Figure: 5.5: Conduct of Research for CSR Activities
43.40%
31.60%
19.70%
0.70%0 4.60%
Strongly Disagree Disagree Neutral Agree Strongly Agree

143
5.3.2.2 Following CSR Practices
The figure below explains the employees’ opinion towards companies following CSR
practices. It was found that 40% of the total number of employees strongly agreed
and 48.70% of the employees agreed that the companies should follow CSR practices.
Only 1.5% disagreed with the fact that the companies should follow CSR practices
and 10% of the total respondents were neutral.
Figure 5.6: Following CSR Practices
5.3.2.3 Use of CSR Funds
The respondent employees were asked whether the companies should invest their funds
in CSR activities in India or abroad. It was observed that 37.50% of the total number
of employees strongly agreed and 30.30% of the employees agreed that the funds of
the companies should be invested in CSR activities in India only and not
abroad.21.70% of the total employees were indifferent on the spending of CSR funds,
while 10% opined that the funds in CSR activities should be invested not only in India
but also abroad. The figure below shows the opinion of the employees:
48.70%
40.10%
0.70% 0.70% 9.90%
Strongly Disagree Disagree Neutral Agree Strongly Agree

144
Figure 5.7: Use of CSR Funds
5.3.2.4 Nature of CSR activities
The figure explains the perception of employees towards the nature of CSR activities
undertaken by the companies. It was found that 38.20% of the total number of
employees strongly agreed and 38.80% of the employees agreed that the funds of the
companies should not engage in mere charity or donation in the name of CSR activities.
They opined that the CSR activities of the companies should be project based and not
one time investment in any venture. Around 5% of the total respondents considered
that charity or donation form a significant part of CSR activties undertaken by the
companies and CSR activities can be a one time affair, while 18.40% of total employees
were indifferent on the nature of CSR activities.
37.50%
30.30%
21.70%
3.90% 6.60%
Strongly Disagree Disagree Neutral Agree Strongly Agree

145
Figure 5.8: Nature of CSR activities
5.3.2.5 Joinining hands with NGOs
The figure explains the perception of employees towards joining hands wth NGOs for
conducting CSR. It was found that 33.60% of the total number of employees strongly
agreed and 43.40% of the employees agreed that the companies should join hands with
NGOs to conduct the SR activities in a more effective manner. While 19.70% of the
respondents were neutral on the association, only 3% of the employees disagreed.
38.80% 38.20%
18.40%
1.30% 3.30%
Strongly Disagree Disagree Neutral Agree Strongly Agree

146
Figure 5.9: Joinining Hands with NGOs
5.3.2.6 Separate CSR Department
This figure explains that 36.80% of the total employees strongly agreed and 32.90%
agreed that the companies should have a separate CSR department to conduct CSR
activities. 23% of the respondents were neutral on the idea of having a separate CSR
department while 7% didn’t support the opinion.
Figure 5.10: Separate CSR Department
36.80%
32.90%
23%
0.70% 6.60%
Strongly Disagree Disagree Neutral Agree Strongly Agree
0.70% 2.60%
Strongly Disagree Disagree Neutral Agree Strongly Agree
43.40%
33.60%
19.70%

147
5.3.2.7 Contribution towards CSR
This figure explains whether the employees supported the mandatory provision of
contribution towards CSR. It was found that 22.40% of employee respondents strongly
agreed and 40.80% agreed that the companies should invest 2% of the average profits
of preceding three years for CSR activities. 7% of employees disagreed whereas
29.60% were neutral on this provision of mandatory investment.
Figure 5.11: Contribution towards CSR
5.4 Section D: CSR Initiatives and the CFP
This section is focused on analyzing the relationship between Corporate Social
Responsibility initiatives taken by the companies and the Financial Performance of
the companies using Exploratory Factor Analysis and Structural Equation
Modelling.
40.80%
29.60%
22.40%
1.30% 5.90%
Strongly Disagree Disagree Neutral Agree Strongly Agree

148
5.4.1 Exploratory Factor Analysis
Exploratory factor analysis was applied to develop the measurement tool for
identifying dimensions of measuring CSR. A total of 36 dimensions were selected
on the basis of literature review (Table 5.4). The information was collected through
a sample of 153 middle and high-level managers of the sample automotive
companies on a 5-point Likert Scale (1: Strongly disagree; 2: disagree; 3: neutral;
4: strongly agree; 5: strongly agree).
Table 5.13: Dimensions for Measuring CSR
Production of sustainable goods and services by the company CSR 1
Corporate image and Market Share of the company CSR 2
Support to inclusive growth and equitable development CSR 3
Customers and Consumers satisfaction CSR 4
Protecting Stockholders and Investors interest CSR 5
Supplier relations and supply chain management CSR 6
Industry research and development and innovation CSR 7
Focusing on Quality as a core value CSR 8
Public Policy and Regulatory Framework adopted by the company CSR 9
Handling Investor grievances handling policies CSR 10

149
Following Code of Conduct of business with ethics, transparency
and accountability followed by the company
CSR 11
Following an Environmental Policy CSR 12
Following the System of reduce, reuse and recycle CSR 13
Development and diffusion of environmentally friendly
technologies.
CSR 14
Providing regular voluntary information about environmental
management to stakeholders
CSR 15
Supply of clear and accurate environmental information on its
products, services and activities to stakeholders
CSR 16
Adopting a Policy towards employees CSR 17
Taking Greater employee satisfaction measures CSR 18
Following Occupational Health and Safety policies CSR 19
Skills and Career Development of Employees CSR 20
Providing a good work-life balance for employees (flexible working
hours or work from home facility)
CSR 21
Non-discrimination, Diversity and Equal Opportunity CSR 22
Prevention of Forced and Compulsory Labor CSR 23
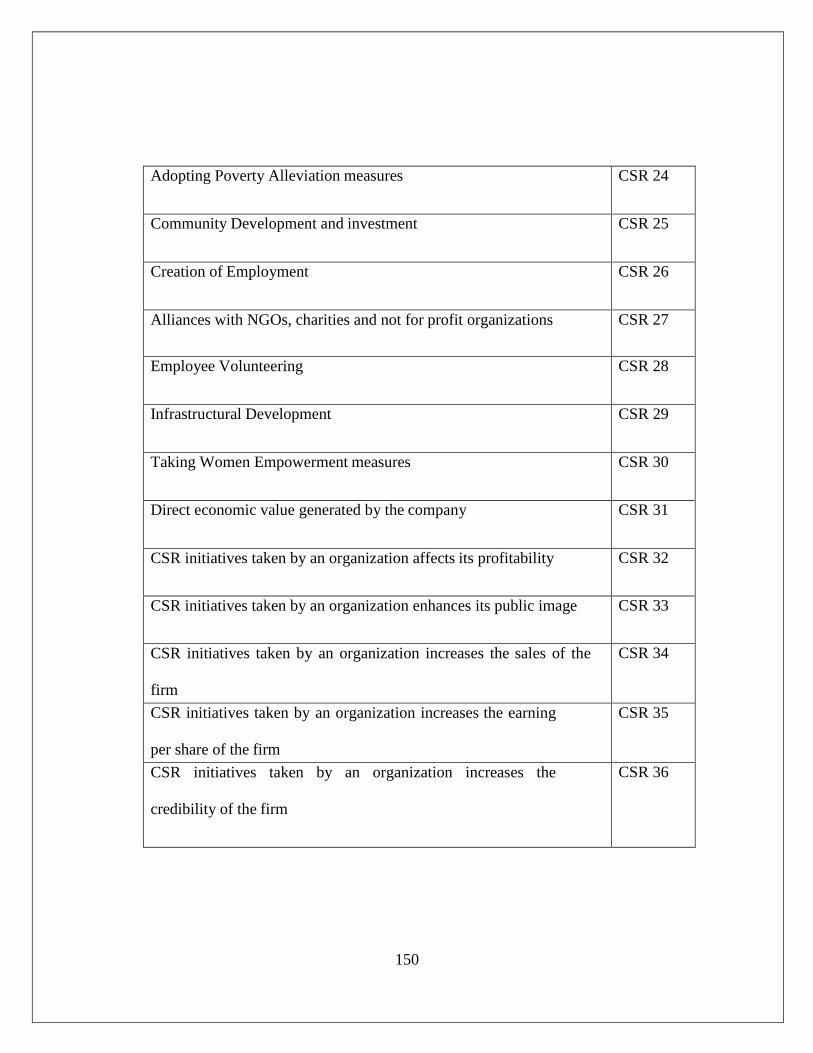
150
Adopting Poverty Alleviation measures CSR 24
Community Development and investment CSR 25
Creation of Employment CSR 26
Alliances with NGOs, charities and not for profit organizations CSR 27
Employee Volunteering CSR 28
Infrastructural Development CSR 29
Taking Women Empowerment measures CSR 30
Direct economic value generated by the company CSR 31
CSR initiatives taken by an organization affects its profitability CSR 32
CSR initiatives taken by an organization enhances its public image CSR 33
CSR initiatives taken by an organization increases the sales of the
firm
CSR 34
CSR initiatives taken by an organization increases the earning
per share of the firm
CSR 35
CSR initiatives taken by an organization increases the
credibility of the firm
CSR 36

151
The specific conditions that must be ensured before executing the Exploratory Factor
Analysis were met. A five point Likert scale had been used for collecting the data through
questionnaire. The size (153) of the sample respondents is four times more than the number
of variables (36). It was observed that all the variables correlated fairly well and none of the
correlation coefficients were particularly large. The Kaiser- Meyer-Olkin (KMO) Test (Table
5.14) was .875 and chi- square value of Bartlett’s Test of Sphericity (Table 5.14) was found to
be significant (chi sq= 2975.435, p= .000). For the KMO test, a score of .70 is considered
adequate while .80 or higher is excellent (Hair et al. 2010), hence, confirming the acceptance
of exploratory factor analysis.
Table 5.14: Results of KMO and Barlett Test of Sphericity
Kaiser-Meyer-Olkin Measure of Sampling Adequacy. .875
Bartlett's Test of Sphericity
Approx. Chi-Square 2975.435
df 630
Sig. .000
The EFA revealed that some of the measures did not seem to represent their respective
constructs satisfactorily and hence were removed from the further analysis and the final rotated
component matrix was generated. The variables that were not retained were CSR_2
(Corporate image and market share of the company), CSR_9 (Public policy and regulatory
framework adopted by the company), CSR_12 (Following an environmental policy), CSR_15
(Providing regular voluntary information about environmental management to stakeholders),
CSR_16 (Supply of clear and accurate environmental information on its products, services

152
and activities to stakeholders) and CSR_27 (Alliances with NGOs, charities and not for profit
organizations).
5.4.1.1 Rotated Component Matrix
The factor analysis used maximum likelihood method and generated 4 components
with eigen values above 1. The promax rotation clubbed the items in 4 components as
shown in Table 5.15, along with their factor loadings and the Cronbach alpha values.
It should be noted that in the following table showing factor loadings, loadings below
.3 have been excluded for ease of interpretation.
Out of the 36 dimensions (Table 5.13) in the original set of indicators, 30 were used in
the subsequent SEM.
1. The dimensions CSR 26, CSR 20, CSR 21, CSR 24, CSR 23, CSR 19, CSR 18,
CSR 22, CSR 30, CSR 25, CSR 29 and CSR 28 got clubbed under the head
“CSR_SOC” which comprised of the social dimensions of the CSR initiatives
taken by the companies. The Cronbach alpha value was found to be .911, which
is an acceptable value of reliability.
2. The dimensions CSR 5, CSR 1, CSR 3, CSR 31, CSR 7, CSR 10, CSR 6, CSR
8, CSR 11 and CSR 4 were grouped under the head “CSR_ECO” which
comprised of the economic dimensions of the CSR initiatives taken by the
companies. The Cronbach alpha value was found to be .858, which is an
acceptable value of reliability.

153
3. The dimensions CSR 36, CSR 14, CSR 33, CSR 13 and CSR 17 were named
as “CSR_ENV” which included the environmental dimensions of the CSR
initiatives taken by the companies. The Cronbach alpha value was found to be
.670, which is an acceptable value of reliability.
4. The dimensions CSR 32, CSR 34, CSR 35 were named as “CSR_FIN” which
included the dimensions indicating the effect of CSR initiative on financial
performance of the companies. The Cronbach alpha value was found to be .895,
which is an acceptable value of reliability.
Table 5.15: CSR Dimensions with Factor Loadings and Cronbach Alpha
Values
CSR Dimensions Variables Factor
Loadings
Cronbach
Alpha values
CSR_SOC
CSR 26 .821
.911
CSR 20 .808
CSR 21 .785
CSR 24 .722
CSR 23 .701
CSR 19 .683
CSR 18 .669

154
CSR 22 .649
CSR 30 .629
CSR 25 .605
CSR 29 .558
CSR 28 .510
CSR_ECO
CSR 5 .782
.858
CSR 1 .774
CSR 33 .676
CSR 31 .641
CSR 7 .622
CSR 10 .602
CSR 6 .575
CSR 8 .525
CSR 11 .490
CSR 4 .489
CSR 36 .539 .670
CSR 14 .524

155
CSR_ENV CSR 33 .511
CSR 13 .501
CSR 17 .408
CSR_FIN
CSR 35 .836
.895 CSR 34 .801
CSR 32 .727
Source: Own Elaboration
5.4.2 Structural Equation Modeling
The proposed conceptual model (Figure 4.1) established the effect of CSR_SOC
(Social dimensions of CSR initiatives), CSR_ECO (Economic dimensions of CSR
initiatives) and CSR_ENV (Environmental dimensions of CSR initiatives) on the
corporate financial performance. The hypothesis of the study was examined by
estimating a SEM model in AMOS22 – a computer program through which all
interactions between variables represented in the conceptual model are captured and
examined as a single statistical test.
The SEM method also provides individual metrics for evaluation of particular bivariate
relationships. The model was graphically represented along with standardized
estimates of regression weights to develop scales for each of the constructs in the
structural model and evaluate them in terms of reliability and validity to estimate
measurement models for each of the constructs in the model and evaluate them in terms
of measures of fit and interpretation.

156
The conceptual model (Figure 4.1) is illustrated in a path diagram. A path diagram
represents a pictorial portrayal of all relationships in the model (Hair et al, 1998). It is
a graphical representation of how the various elements of the model relate to one
another. The path diagram and goodness of fit indices calculated in the first attempt
was found to be as follows:
Figure 5.12: Path Diagram of the Preliminary Model
Source: Own Elaboration
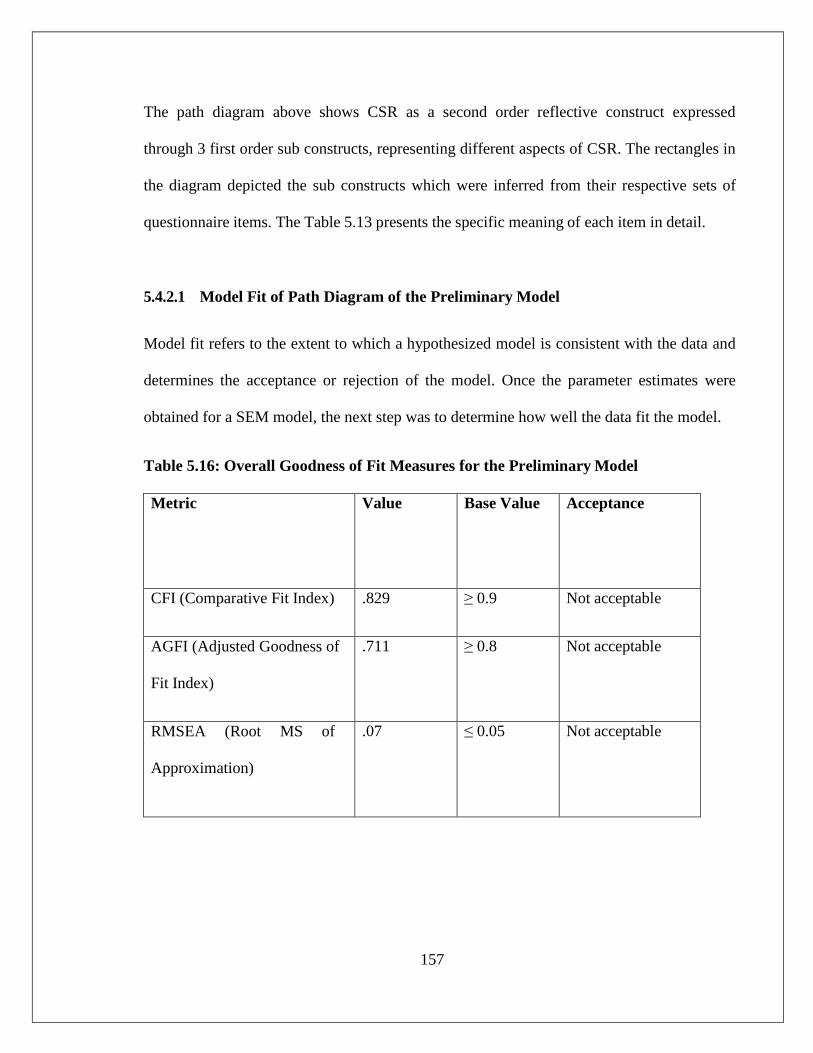
157
The path diagram above shows CSR as a second order reflective construct expressed
through 3 first order sub constructs, representing different aspects of CSR. The rectangles in
the diagram depicted the sub constructs which were inferred from their respective sets of
questionnaire items. The Table 5.13 presents the specific meaning of each item in detail.
5.4.2.1 Model Fit of Path Diagram of the Preliminary Model
Model fit refers to the extent to which a hypothesized model is consistent with the data and
determines the acceptance or rejection of the model. Once the parameter estimates were
obtained for a SEM model, the next step was to determine how well the data fit the model.
Table 5.16: Overall Goodness of Fit Measures for the Preliminary Model
Metric Value Base Value Acceptance
CFI (Comparative Fit Index) .829 ≥ 0.9 Not acceptable
AGFI (Adjusted Goodness of
Fit Index)
.711 ≥ 0.8 Not acceptable
RMSEA (Root MS of
Approximation)
.07 ≤ 0.05 Not acceptable

158
RMSR (Root MSd
Residual)
.06 ≤ 0.05 Not Acceptable
NFI (Normal Fit Index) .71 0 to 1 Acceptable
Source: Own elaboration
The preliminary model was amended to improve the model fit. Modification indices and
standardized residuals calculated through AMOS 22were used to modify the model resulting
in the final model. The items CSR_20, CSR_30, CSR_29 and CSR_28 were removed from
the construct CSR_SOC. The items CSR_1, CSR_3, CSR_31, CSR_7, CSR_6, CSR_11and
CSR_4 were removed from the construct CSR_ECO. The items CSR_36, CSR_33 and
CSR_17 were removed from the construct CSR_ENV in the final model. The final path
diagram with the improved Goodness of Fit are given below:

159
Figure 5.13: Path Diagram of Final Model
Source: Own Elaboration
5.4.2.2 Model Fit of Path Diagram of Final Model
Table 5.17: Overall Goodness of Fit measures for the Final Model
Metric Value Base
Value
Acceptance
CFI (Comparative Fit Index) .829 ≥ 0.9 Acceptable
AGFI (Adjusted Goodness of Fit Index) .85 ≥ 0.8 Acceptable

160
RMSEA (Root MS of
Approximation)
.05 ≤ 0.05 Acceptable
RMSR (Root MSd Residual) .041 ≤ 0.05 Acceptable
NFI (Normal Fit Index) .87 0 to 1 Acceptable
Source: Own elaboration
The model fit of the final model with all the indices’ values beyond the threshold
limits is indicative of the fact that the model is offering an adequate approximation
of empirical data, hence it is acceptable. The standardized factor loadings of the
dimensions of CSR initiatives (CSR_SOC, CSR_ECO, CSR _ENV) ranged from
0.65 for CSR_13 to 0.79 for CSR_22. The extent of variance of observed variables
of the factor is indicated through the squared multiple correlations. The R2 statistics
corresponding to the latent variable (CSR_ECO) was found highest at 0.94, 0.57 for
(CSR_ENV) and the lowest for (CSR_SOC) at 0.467.
The model was further analyzed and adjusted on the regression paths among CSR
and CFP which is given by a standardized regression weight of .31. This depicts that
there exists a weak but significant and positive relationship between the two
variables CSR and CFP. This implies that CSR is not the main determinant of CFP
but one of them. There are other factors that contribute to the corporate financial
performance of the companies.

161
FINDINGS, CONCLUSIONS AND RECOMMENDATIONS
Chapter 5 had detailed the analysis of the CSR initiatives taken by the companies, the
guidelines followed for disclosure of the same in their reports during the period 2009-
2014. The relationship between CSR and CFP has been studied in detail. Both
primary data analysis and secondary data analysis of the relationship has been
comprehensively done in this chapter.
The present study aims at investigating two relationships:
1. The relationship between corporate social responsibility initiatives taken by
the companies and financial performance of companies in the automotive
sector.
2. The relationship between corporate social responsibility disclosure level and
financial performance of companies in the automotive sector.
To investigate the relationships following objectives were framed:
1. To examine the Corporate Social Responsibility initiatives of the select
companies in Automotive Sector in India.
2. To analyse the relationship between disclosure of Corporate
Social Responsibility initiatives and the Financial Performance of the
companies.
3. To examine the perception of employees regarding the implementation of the
new Companies Act 2013 provisions being followed by the companies.
4. To analyse the relationship between Corporate Social Responsibility
162
initiatives and the Financial Performance of the companies.
The relationship between corporate social responsibility disclosure level and financial
performance of companies in the automotive sector was studied by doing content
analysis followed by multiple regression analysis on 26 sample automotive
companies. The CSR Disclosure Index was created and the effect of the disclosure of
sustainability information was studied on the CFP variables (ROE, PAT, ROA, D/E)
with and without controlling the size of the firm.
The relationship between corporate social responsibility initiatives taken by the
companies and financial performance of companies in the automotive sector was
analysed using Exploratory Factor Analysis and Structure Equation Modelling. The
analysis was done by conducting a survey on 153 employees (middle level and senior
level management) of select automotive companies
The findings of the study are presented in this chapter and are stated objective wise
as below followed by the conclusions, the limitations of the study and
recommendations for the research and practitioners for further study.
6.1 FINDINGS
Objective 1: To examine the Corporate Social Responsibility initiatives of the
select companies in Automotive Sector in India.
The corporate social responsibility initiatives taken by the companies in the
automotive sector during the period 2009-14 is disclosed by all the
companies in the form of one report or another. However, most of the

163
sample companies are not following some stipulated guidelines or a
standard reporting structure for CSR disclosure. Such companies are large
in number and have been disclosing their CSR practices either in the form
of a separate section ‘Corporate Social Responsibility’ in their annual
reports or in Director’s report. While other companies are disclosing just in
the form of a small paragraph under the head ‘Management Discussion’ in
the annual report. A few companies also disclose their initiatives on their
webpages.
Only a few automotive companies have followed global guidelines of
reporting like GRI-G-3 given by Global Reporting Initiative, guidelines by
United Nation Global Compact. Guidelines given by ISO 26000 and
Account Ability Standard have not been adhered to by the sample
companies. This shows that the Indian automotive companies have yet to
realise the significance of global reporting of CSR initiatives. It was found
that the companies have maintained CSR Policy as a part of the mandatory
provision of the Companies (CSR Policy) rules, 2014 and Companies Act
2013. The policy contained the details of list of CSR activities to be taken
by the companies, the proposed amount of expenditure of the same. The
details of CSR Committee formed, its members, the meeting schedules were
clearly found stated by all the companies.

164
It was found that more than half of the automotive companies have
disclosed all the economic dimensions of the CSR activities and the
disclosures (economic, environmental and social) have increased in the
subsequent years starting from 2009. The economic initiatives included the
direct economic value generated by the companies, customer satisfaction,
Stockholders’ and investors’ interest, industry research and development,
quality, investor grievances and handling policies, conduct of business with
ethics, transparency and accountability. The disclosure of some initiatives
like corporate image and market share, supply chain management,
procedures for hiring from local community, public policy and regulatory
framework was not given much significance by some companies.
The environmental initiatives undertaken by most of the companies were
confined to development and diffusion of environmentally friendly
technologies, develop environment friendly products and following the system
of 3Rs: reduce, reuse and recycle. The companies have yet to frame
environmental policy and make provisions for supply of regular and accurate
environmental information of its products and services to stakeholders.
The social initiatives taken by most of the organizations included skills and
career development of employees, their occupational health and safety,
employee satisfaction and their well-being, labour management relations,
community development, poverty alleviation, employment creation, alliances
with NGOs, women empowerment, vocational training, infrastructural
165
development and other philanthropic activities. The social areas where the
companies are still not active are promotion of human rights, work life balance
for employees, freedom of association and collective bargaining, prevention of
child labour and road safety programmes.
It has been found that the companies are more inclined towards taking economic
initiatives and disclosing economic performance than the environmental and
social performance information in their reports. The reason for the extensive
economic disclosure could be the perception of companies to recognize
economic responsibility towards Stockholders and investors to be the prime
obligation of the companies to reap enhanced benefits.
Objective 2: To analyse the relationship between disclosure of Corporate Social
Responsibility initiatives and the Financial Performance of the companies.
The relationship between corporate social responsibility disclosure level and financial
performance of companies in the automotive sector was studied by doing content
analysis followed by multiple regression analysis on 26 sample automotive companies.
The CSR Disclosure Index was created and the effect of the disclosure of sustainability
information was studied on the CFP variables (ROE, PAT, ROA, D/E) with and
without controlling the size of the firm.
The CSR Disclosure Index was created by dividing the sustainability or CSR
information into three head categories: Economic, Environmental and Social have been
taken keeping the Triple Bottom Line Effect as the base and the sub categories The sub
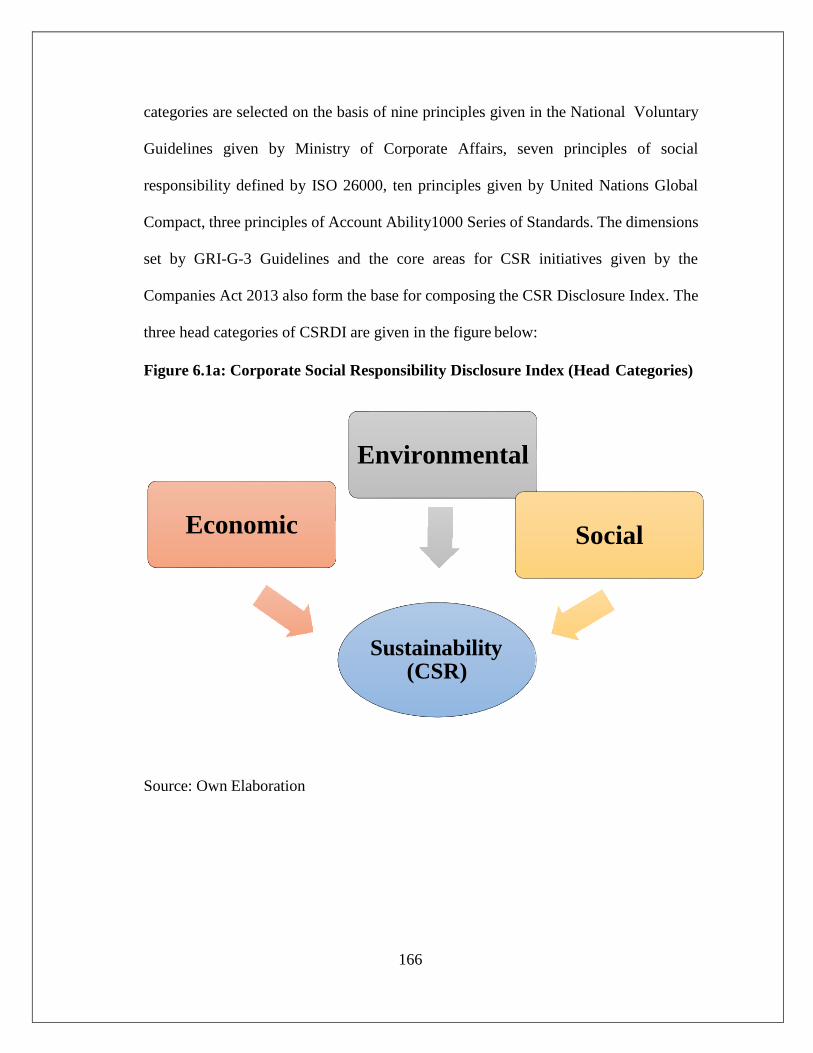
166
Environmental
categories are selected on the basis of nine principles given in the National Voluntary
Guidelines given by Ministry of Corporate Affairs, seven principles of social
responsibility defined by ISO 26000, ten principles given by United Nations Global
Compact, three principles of Account Ability1000 Series of Standards. The dimensions
set by GRI-G-3 Guidelines and the core areas for CSR initiatives given by the
Companies Act 2013 also form the base for composing the CSR Disclosure Index. The
three head categories of CSRDI are given in the figure below:
Figure 6.1a: Corporate Social Responsibility Disclosure Index (Head Categories)
Source: Own Elaboration
Sustainability
(CSR)
Social
Economic
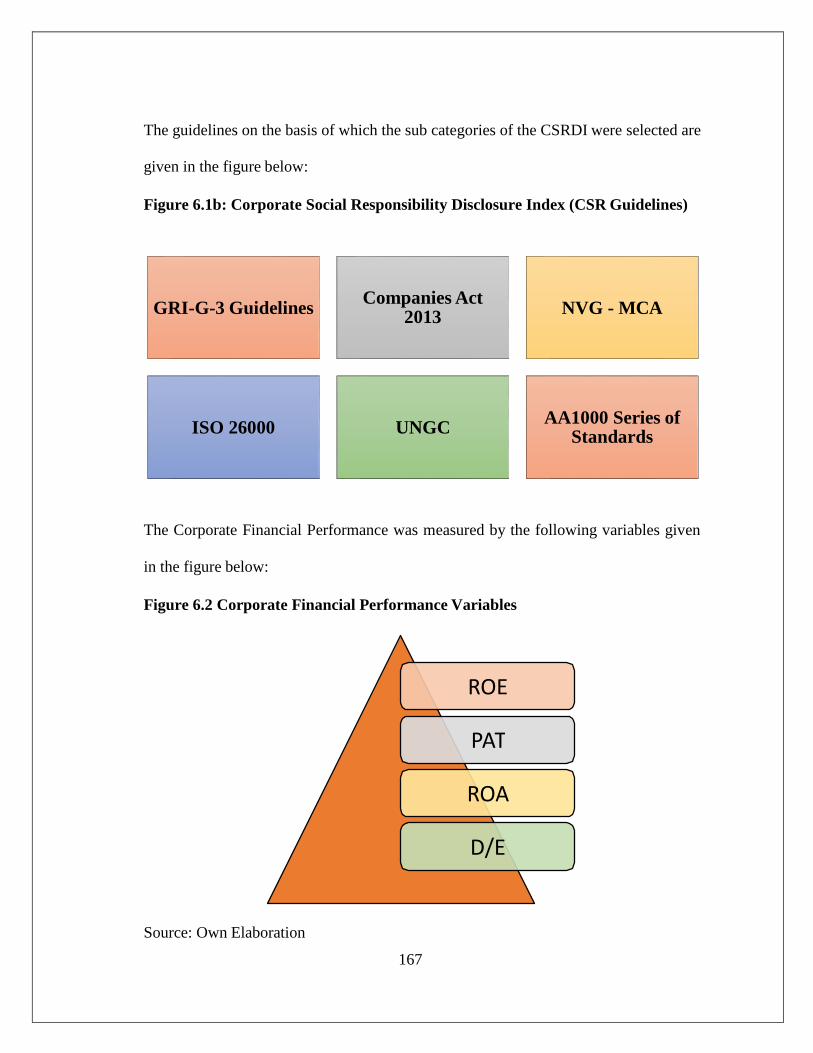
167
The guidelines on the basis of which the sub categories of the CSRDI were selected are
given in the figure below:
Figure 6.1b: Corporate Social Responsibility Disclosure Index (CSR Guidelines)
The Corporate Financial Performance was measured by the following variables given
in the figure below:
Figure 6.2 Corporate Financial Performance Variables
Source: Own Elaboration
ROE
PAT
ROA
D/E
AA1000 Series of Standards
UNGC
ISO 26000
NVG - MCA
Companies Act 2013
GRI-G-3 Guidelines
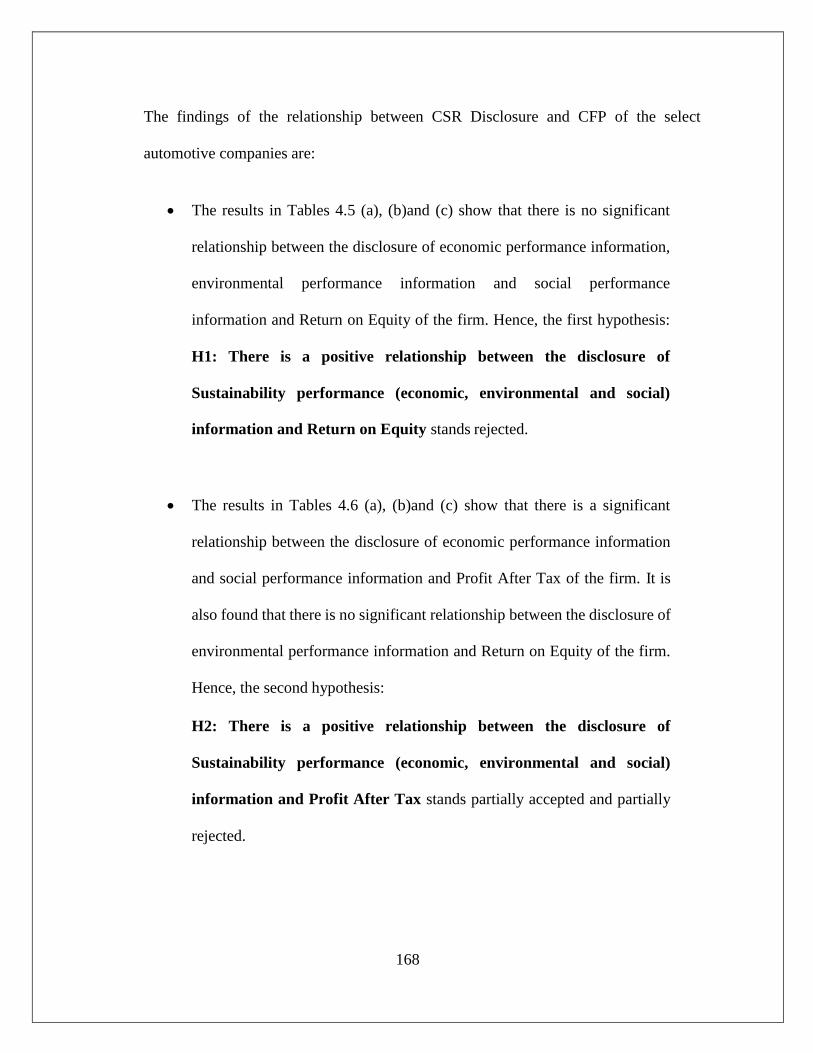
168
The findings of the relationship between CSR Disclosure and CFP of the select
automotive companies are:
The results in Tables 4.5 (a), (b)and (c) show that there is no significant
relationship between the disclosure of economic performance information,
environmental performance information and social performance
information and Return on Equity of the firm. Hence, the first hypothesis:
H1: There is a positive relationship between the disclosure of
Sustainability performance (economic, environmental and social)
information and Return on Equity stands rejected.
The results in Tables 4.6 (a), (b)and (c) show that there is a significant
relationship between the disclosure of economic performance information
and social performance information and Profit After Tax of the firm. It is
also found that there is no significant relationship between the disclosure of
environmental performance information and Return on Equity of the firm.
Hence, the second hypothesis:
H2: There is a positive relationship between the disclosure of
Sustainability performance (economic, environmental and social)
information and Profit After Tax stands partially accepted and partially
rejected.
169
The results in Tables 4.7 (a), (b)and (c) show that there is no significant
relationship between the disclosure of economic performance information,
environmental performance information and social performance information and
Return on Assets of the firm. Hence, the third hypothesis:
H3: There is a positive relationship between the disclosure of Sustainability
performance (economic, environmental and social) information and Return on
Assets stands rejected.
The results in Tables 4.8 (a), (b)and (c) show that there is no significant
relationship between the disclosure of economic performance information,
environmental performance information and social performance information and
Debt Equity of the firm. Hence, the fourth hypothesis:
H4: There is a negative relationship between the disclosure of Sustainability
performance (economic, environmental and social) information and
Debt/Equity stands rejected.
It was also revealed that CSR disclosure and CFP are not associated even when measured
along with annual turnover or sales as a controlled variable.
The results in Tables 4.9 (a), (b) and (c) show that there is no significant
relationship between the disclosure of economic performance information,
environmental performance information and social performance information and
Return on Equity of the firm, after controlling the size of the firm. Hence, the fifth
hypothesis:
170
H5: There is a positive relationship between the disclosure of Sustainability
performance (economic, environmental and social) information and Return on
Equity after controlling the size of the firm, stands rejected.
The results in Tables 4.10 (a), (b) and (c) show that there is no significant
relationship between the disclosure of economic performance information,
environmental performance information and social performance information and
Profit After Tax of the firm, after controlling the size of the firm. Hence, the sixth
hypothesis:
H6: There is a positive relationship between the disclosure of Sustainability
performance (economic, environmental and social) information and Profit
After Tax after controlling the size of the firm, stands rejected.
The results in Tables 4.11 (a), (b) and (c) show that there is no significant
relationship between the disclosure of economic performance information,
environmental performance information and social performance information and
Return on Assets of the firm, after controlling the size of the firm. Hence, the
seventh hypothesis:
H7: There is a positive relationship between the disclosure of Sustainability
performance (economic, environmental and social) information and Return
on Assets after controlling the size of the firm, stands rejected.
The results in Tables 4.12 (a), (b) and (c) show that there is no significant

171
relationship between the disclosure of economic performance information,
environmental performance information and social performance information and
Debt/Equity of the firm, after controlling the size of the firm. Hence, the eighth
hypothesis:
H8: There is a positive relationship between the disclosure of Sustainability
performance (economic, environmental and social) information and
Debt/Equity after controlling the size of the firm, stands rejected.
Objective 3: To examine the perception of employees regarding the implementation
of the new Companies Act 2013 provisions being followed by the companies.
The study revealed the employees’ perception of the provisions of Companies
Act 2013 regarding the mandatory expenditure on CSR activities. It was found
that more than 70% of the respondent employees agreed that the companies
should conduct research for undertaking CSR activities in an effective manner,
irrespective of the high cost involved. 90% agreed that companies should
follow CSR practices. Around 3/4th of the employees agreed that the CSR
activities of the Indian companies should be based in India only and not abroad
and should be project based. Around 80% agreed that the companies should
join hands with some other organization (like an NGO) for conduct of CSR
activities in a more effective manner. 60% of the employees were of the
opinion that the company should have a separate CSR Department to conduct
CSR activities. Almost all of the employees believed that the companies
should invest every year 2% of their average profits of preceding three years

172
for CSR activities.
The provisions of the latest Companies Act 2013 with respect to Corporate Social
Responsibility are shown in the figure below:
Figure 6.3: Latest Companies Act 2013 provisions with respect to Corporate
Social Responsibility
Source: Own Elaboration
Objective 4: To analyse the relationship between Corporate Social Responsibility
initiatives and the Financial Performance of the companies.
The said objective was fulfilled using Exploratory Factor Analysis and Structure
Equation Modelling. The analysis was done by conducting a survey on 153 employees
(middle level and senior level management) of select automotive companies.
The CSR initiatives (Economic, Environmental and Social) taken by the select
automotive companies were listed and the employees’ perception was studied to
Conduct of Research for CSR Activities
Following CSR Practices
Use of CSR Funds
Nature of CSR activities
Joinining hands with NGOs
Separate CSR Department
Contribution towards CSR

173
analyse the relationship between CSR and CFP of the select companies.
It was found that the employees perceived that their companies were active in
taking CSR initiatives related to corporate image and market share of the
company, public policy and regulatory framework adopted by the company,
following an environmental policy, providing regular voluntary information
about environmental management to stakeholders, supply of clear and accurate
environmental information on its products, services and activities to
stakeholders and alliances with NGOs, charities and not for profit
organizations. However, the analysis using SEM explained that these initiatives
do not contribute to the profitability of the companies. The list of CSR
initiatives (Economic) which are perceived by the employees to affect the
profitability of the firm are stated in the figure below:
Figure 6.4 a: List of CSR Initiatives (Economic) by the Companies
Source: Own Elaboration
It was found that the companies’ employees perceived that their companies
follow an environmental policy, provide regular voluntary information about
environmental management to stakeholders, and supply clear and accurate
Customers and Consumers satisfaction
Protecting Stockholders and Investors interest
Focusing on Quality as a core value
Handling Investor grievances

174
environmental information on its products, services and activities to
stakeholders. The system of reduce, reuse and recycle by their companies and
taking initiatives in the development and diffusion of environmentally friendly
technologies were the major initiatives taken by the companies. However, the
analysis using SEM explained that all these initiatives do not contribute to the
profitability of the companies. The list of CSR initiatives (Environmental)
which are perceived by the employees to affect the profitability of the firm are
stated in the figure below:
Figure 6.4 b: List of CSR Initiatives (Environmental) by the Companies
Source: Own Elaboration
The study explains that the companies are adopting a policy towards employees,
taking greater employee satisfaction measures, following occupational health
and safety policies, working on skills and career development of employees,
providing a good work-life balance for employees (flexible working hours or
work from home facility), aiming at non-discrimination, diversity and equal
opportunity among the employees, preventing forced and compulsory labour.
The companies are also adopting poverty alleviation measures, creating
employment, taking initiatives for community development and investment.
Following the System of reduce, reuse and recycle
Development and diffusion of environmentally friendly technologies

175
Following the provisions of the new Companies Act 2013, the companies are
also forming alliances with NGOs, charities and not for profit organizations for
the conduct of CSR activities. Employee volunteering and infrastructural
development and taking women empowerment measures are some of the core
initiatives taken by the companies. However, the analysis using SEM explained
that all these initiatives do not contribute to the profitability of the companies.
The list of CSR initiatives (Social) which are perceived by the employees to
affect the profitability of the firm are stated in the figure below:
Figure 6.4 c: List of CSR Initiatives (Social) by the Companies
Source: Own Elaboration
Taking Greater employee satisfaction measures
Following Occupational Health and Safety policies
Skills and Career Development of Employees
Providing a good work-life balance for employees (flexible working hours or work from home facility)
Non-discrimination, Diversity and Equal Opportunity
Prevention of Forced and Compulsory Labor
Adopting Poverty Alleviation measures
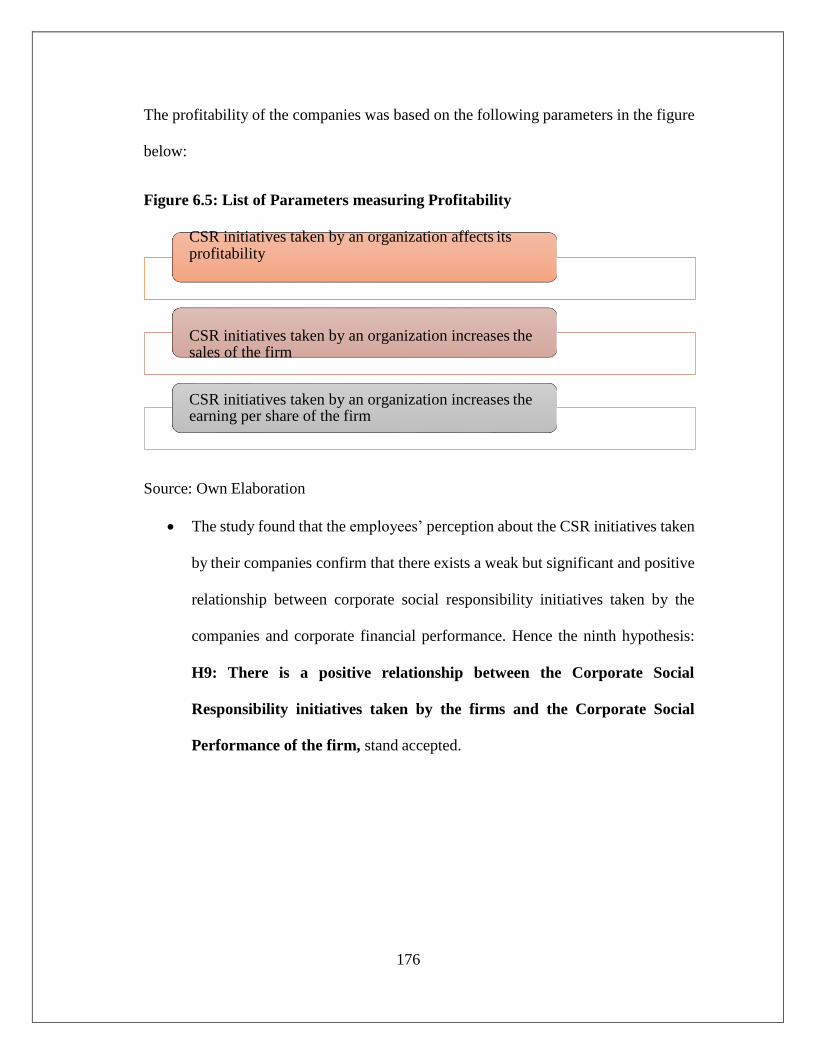
176
The profitability of the companies was based on the following parameters in the figure
below:
Figure 6.5: List of Parameters measuring Profitability
Source: Own Elaboration
The study found that the employees’ perception about the CSR initiatives taken
by their companies confirm that there exists a weak but significant and positive
relationship between corporate social responsibility initiatives taken by the
companies and corporate financial performance. Hence the ninth hypothesis:
H9: There is a positive relationship between the Corporate Social
Responsibility initiatives taken by the firms and the Corporate Social
Performance of the firm, stand accepted.
CSR initiatives taken by an organization increases the earning per share of the firm
CSR initiatives taken by an organization increases the sales of the firm
CSR initiatives taken by an organization affects its profitability
177
6.2 CONCLUSIONS
The augmenting pressure of the globalized economy has made the concept of CSR a
need of the hour. Indian corporate houses, by developing a globally tolerable socially
responsible behaviour (Sharma Seema 2011) are clearly exhibiting their capacity to
make a significant difference in the society and advance the overall quality of life
(Berad 2011). Known as a successful management strategy, CSR has become a buy-in
at all levels of the company (Oron Emmanuel 2011). Mere following CSR as a strategy
by the companies is not enough, its reporting to the Stockholders is equally
significant. CSR reports are a communication tool not merely to help stakeholders’
understand how the companies pursue CSR activities, but also to make companies
globally competitive and sustainable. With the introduction of CSR provision in the
Companies Act, India Inc. is increasingly getting involved in conducting and
reporting CSR activities that contribute to society and various stakeholders. The new
act is a welcome step and all companies satisfying the CSR criteria will have to
undertake CSR activities under the new CSR regime. The step would eventually,
boost much required social projects with some professional management of the
private sector (Lal Mansukh 2013).
The conclusions that may be drawn from the present study, objective wise are discussed
here below:
Objective 1: To examine the Corporate Social Responsibility initiatives of the
select companies in Automotive Sector in India.
The annual reports or the sustainability reports or the CSR reports for the period of five
years were studied and following conclusions may be drawn:

178
The companies in the automotive sector are active in taking CSR initiatives fulfilling
the 3Ps of Triple Bottom Line: economic (profit), environmental (planet) and social
(people).Most of the automotive companies disclose their CSR initiatives inthe form of
a separate section ‘Corporate Social Responsibility’ in their annual reports or in
Director’s report. Most of the sample companies are not following some stipulated
guidelines or a standard reporting structure for CSR disclosure. A few automotive
companies follow global guidelines given by GRI and UNGC. With the increased
awareness of the significance of CSR contribution, the companies have eventually
increased their CSR initiatives. There has been marginal increase in the CSR
(Economic) disclosure score from 2009-10 to 2013-14. The CSR (Environmental)
disclosure score has also increased from 2009-10 to 2013-14. The CSR (Social)
disclosure score has increased to a large extent during the period of five years. A major
reason is also the latest clause of Companies Act 2013 stating that every company
satisfying a certain criteria is mandatorily required to invest 2% of their average profits
of the preceding three years in CSR activities, failing which that company has to submit
a report to the Ministry of Corporate Affairs stating the reason of non-contribution.
Objective 2: To analyse the relationship between disclosure of Corporate Social
Responsibility initiatives and the Financial Performance of the companies.
This objective has been fulfilled by doing content analysis followed by multiple
regression analysis on 26 sample automotive companies. The CSR Disclosure Index
was created and the effect of the disclosure of sustainability information was studied
on the CFP variables (ROE, PAT, ROA, D/E) with and without controlling the size of

179
the firm. The conclusion that may be drawn from the above analysis was that:
There is no positive relationship between the CSR information (economic,
environmental and social) variables and CFP (return on equity, return on assets, debt
on equity) before and after controlling the size of the firm. However, there exists a
positive relationship between the CSR information (economic and social) variables and
profit after tax before controlling the size of the firm but there is no significant relation
between CSR information (environmental) and profit after tax, after controlling the size
of the firm.
Objective 3: To examine the perception of employees regarding the
implementation of the new Companies Act 2013 provisions being followed by
the companies.
The study revealed the employees’ perception of the provisons of Companies Act
2013 regarding the mandatory expenditure on CSR activities.
The conclusions that may be drawn are that the employees of all the sample
automotive companies perceive that their companies should follow all the
provisions of Companies Act 2013, relating to CSR initiatives.
Objective 4: To analyse the relationship between Corporate Social
Responsibility initiatives and the Financial Performance of the companies.
The said objective was fulfilled using Exploratory Factor Analysis and Structure
Equation Modelling. The analysis was done by conducting a survey on 153
employees (middle level and senior level management) of select automotive
companies.
The CSR initiatives (Economic, Environmental and Social) taken by the select

180
automotive companies were listed and the employees’ perception was studied to
analyse the relationship between CSR and CFP of the select companies.
The conclusions that may be drawn from the analysis were:
The companies are actively demonstrating their participation in the CSR
initiatives for the economic, environmental and social benefit
The economic activities that may affect the profitability of the companies are :
Customers and consumers satisfaction, protecting Stockholders and investors
interest, community focusing on quality as a core value and handling investor
grievances
The CSR initiatives (Environmental) that may affect the profitability of the
firm are: Following the system of reduce, reuse and recycle, development and
diffusion of environmentally friendly technologies.
The CSR initiatives (Social) that may affect the profitability of the firm are:
Taking greater employee satisfaction measures, following occupational
health and safety policies, skills and career development of employees,
providing a good work-life balance for employees (flexible working hours or
work from home facility), non-discrimination, diversity and equal
opportunity, prevention of forced and compulsory labour and adopting
poverty alleviation measures
It may also be concluded that there exists a weak but significant and positive
relationship between corporate social responsibility initiatives taken by the
companies and corporate financial performance.

181
6.3 RECOMMENDATIONS
On the basis of the findings of the study, the following suggestions can be made to the
companies:
1. With respect to the provisions of Companies Act, 2013
a. The companies should conduct research for undertaking CSR activities in
an effective manner, irrespective of the high cost involved.
b. The companies should follow CSR practices and the practices should not
be a one-time charity or donation but the activities should be project
based.
c. The companies should join hands with some other organization (like an
NGO) for conduct of CSR activities in a more effective manner.
d. The companies should have a separate CSR Department to conduct CSR
activities.
e. The companies should invest every year 2% of their average profits of
preceding three years for CSR activities.
2. Companies should be responsible for adding value to the community through
their operations. The corporate world commitment towards the CSR can give
them an opportunity to explore the potentially viable areas to augment the
company profits portfolio. It should be taken as a strategic decision by the
companies and to deepen it as a core business.
3. It is of utmost importance to the companies to share with their Stockholders
the kind and amount of investment they are making in the field of CSR and

182
how are they working towards betterment of the society. This necessitates the
creation of awareness about CSR amongst the general public. The companies
should increase the intensity and frequency of making CSR disclosure through
reporting.
4. Organizations must realize that upliftment of the society is not the sole
responsibility of the government, corporates have a dominant role instead.
Hence, the companies should invest more in the projects which helps in societal
development at large.
5. The government should also mandate the following of provisions of the new
Companies Act 2013, obligating the companies to take initiatives and then
disclose them on a regular basis.
6. The Government should introduce a regulatory mechanism through an
independent agency for mainstreaming and institutionalizing CSR in the main
business framework of the companies.
The companies should aim at ingraining CSR into the DNA of core business activities
of companies.
183
6.4 FUTURE RESEARCH
There is a substantial amount of research that still needs to be done concerning the link
between corporate social responsibility and financial performance.
1. The corporate financial performance is studied only on accounting based
financial variables, which are considered to be better indicator of profitability.
However, market based financial variables like earning per share and Tobin Q
can be used as a measure for corporate financial performance.
2. It can be observed from the results in this research that companies CSR scores
are predominantly increasing in the years 2009-2014 and future research could
be more significant in coming years as companies will expand its CSR
investments following the latest provisions of new Companies Act 2013
relating to mandatory CSR investments by companies fulfilling a certain
criteria.
3. Another suggestion for future research is to study a larger sample than the one
observed in this research. Due to the adoption of criteria as per new Companies
Act 2013, the sample was limited to 26 companies only. Considering that the
total number of companies in the automotive companies in the PROWESS data
is 492, future research could apply another research design, which allows the
inclusion of the total population of companies. An increased sample size in

184
future studies may allow higher levels of generalization.
4. The present study is confined to only automotive sector in India, the future
researchers can select some other industries for the purpose of study and some
more options of implementation of the concept of CSR can be suggested.
5. This research should act as a guiding force for the managers in the companies
to formulate strategies for implementing CSR as a full time activity in the
companies.
6.5 CONTRIBUTION OF THE STUDY
Apart from increasing the number of scholarly works with neutral outcomes as far as
the link between CSR and CFP is contemplated, this study contributes, theoretically
and practically, to the existing literature body of CSR and financial performance
relationship research field in a number of ways:
1. The results outline that during the time span of 2009-2014, there was no
significant relationship between CSR performance and financial performance
(in terms of ROA, ROE, PAT and D/E) across the Indian automotive
companies. The information about the existence of this insignificant
relationship has a significant practical implication. This in turn, could influence
the extent to which companies choose to invest in CSR activities if these
financial measures are considered important.
2. The findings of the study that investment in CSR activities by the companies
has an effect on profitability, sales and credibility of the firm, provides further
185
evidence for managers that CSR may develop customer trust, mitigate
reputation risks, and create long-term shareholder value.
3. The detailed examination of the global and Indian guidelines for CSR
disclosure, in the study has offered an insight to the companies that to be
globally competitive and sustainable, not only Indian guidelines but global
guidelines like GRI or UNGC guidelines should be followed by the companies
for CSR reporting. Moreover, inconsistency with the international standards
makes cross-border comparisons difficult.
4. The outcomes are arguably more trustworthy than some other studies because
of directly asking managers about their perceptions of how CSR is used in their
companies rather than relying on more general ratings derived from third‐party
databases
Although CSR is still at a nascent stage in India, management should be cognizant of
the strategic benefits that firms may realize from engaging in CSR activities. A better
understanding and practice of CSR among companies will not only augment
companies’ sustainability, but also advance the development of CSR in India.