Embed Size (px)
Citation preview

Going Green In RubberResources for Reducing Rubber Operation Wastes
and Markets for Utilizing your Green Product
Introduction: Edward Noga Editor Rubber & Plastics News

Going Green in RubberResources for Reducing Rubber Operation Wastes
and Markets for Utilizing your Green Product
Today’s sponsor:
Green Rubber

Going Green in RubberResources for Reducing Rubber Operation
Wastes and Markets for Utilizing your Green Product
Moderator: Bill Cole VP Product [email protected]

Going Green in Rubber
Welcome

Delta-Energy• Phoenix Black®,
recovered carbon black based reinforcing agent
• Performance comparable to virgin carbon black
• 75% less carbon foot print than virgin carbon black
• Recycle without polymer compatibility issues
Phoenix Black Commercial N326
SBR 1502Black Filler 50 phr
Cure System - TBBS 1.5 phr, S 1.5 phr
0
5
10
15
20
25
0 100 200 300 400 500 600 700 800
Strain, %
Stre
ss, M
Pa
Phoenix Black E700N762Phoenix Black E900N990

Going Green in Rubber
Audience Demographics

31
11
6
13
28
3
9
0 5 10 15 20 25 30 35
Service
Rubber Dist
RM Dist
RM Mfg
Industrial Rubber
OEM Other Tier
OEM Tier 1
Portion of Registrants, %
Types of Companies Represented

Where Green Initiatives Defined
0
45
26
29
0 5 10 15 20 25 30 35 40 45 50
Not defined
In corporate strategies
In sustainability plans
Stand alone plan
Portion of Registrants, %

Impact of Corporate Green Initiatives
25
25
7
43
0 5 10 15 20 25 30 35 40 45 50
Sustainability Driven
Neutral Cost
Net Cost
Net Savings
Portion of Registrants, %

Objectives of Webinar
• Transfer information• Identify available resources to assist
– Tom Murray – EPA, Green Suppliers Network
• Green initiative market opportunities – Steve Hellem of Suppliers Partnership
NIST MEP
Green Suppliers NetworkGOING GREENAugust 12, 2009

12NIST MEP
Current Trends
Suppliers need environmental technical assistance to meet customers’ needs
– 59% of CEOs believe their companies should incorporate sustainability into supply chain management
– Only 27% currently do
– CEOs identified primary obstacle - difficulty in changing suppliers’ practices
Source: McKinsey & Co. survey of 391 CEOs at global companies, October 2007

13NIST MEP

14NIST MEP
Overview
• What is Green Suppliers Network?
• Why Go Beyond Lean?
• How the Program Works
• Success Stories

15NIST MEP
What is the Green Suppliers Network?
Strong first step on path to sustainabilityHow:• Expands lean definition of waste to include environmental
considerations: Lean and Clean Advantage• Hands-on training on shop floor• Measurable business and environmental impacts• Trains employees - “learn to see” environmental
opportunities• Customized solutions to manufacturing challenges• Improved supply chain relationships

16NIST MEP
Why Go Beyond Lean?
• Optimize Material Use Less Scrap = Reduced Solid Waste
• Reduce Inventory Less Chemical Spoilage = Reduced Hazardous Waste
• Reduce Overproduction Less Runtime = Energy Savings
• Reduce Transportation Less Fuel Consumption = Reduce Air Emissions

17NIST MEP
Why Go Beyond Lean?
Results for 117 reviews
Cost Savings from Environmental Impact Opportunities
$23,144,225/yr
Energy Conservation (MM Btu) 857,431,725 Water Conservation (gallons) 77,355,558 Water Pollution Reduction (lbs) 19,839,848 Air Emissions Reduction (lbs) 1,825,721 Solid Waste Reduction (lbs) 7,081,044 Cost Savings from Lean Opportunities
$34,864,155/yr
Cost Savings from Other Opportunities
$1,146,947/yr
Total Potential Cost Savings $59,155,327/yr Average Savings per Review $505,600/yr

18NIST MEP
Program Roles
• U.S. Environmental Protection Agency
• National Institute of Standards and Technology’s Manufacturing Extension Partnership (NIST MEP)
• State Environmental Experts
• Large Manufacturers
• Suppliers

19NIST MEP
How the Program Works• Corporate Champions join program
• Champions nominate suppliers
• Review team conducts assessment
• Supplier implements opportunities
• Champion can get aggregated data in five-supplier increments

20NIST MEP
How the Program Works

21NIST MEP
Lean & Clean ApproachClean Strives For...
– Nature-friendly Substitutes
– Optimized Material And Energy Efficiency
– Waste Elimination
– Air/Water Emission Reductions
– Solid/ Hazardous Waste Reduction
– Toxic Material Reduction Or Substitution
– Efficient Packaging
Lean Eliminates...
– Defects
– Overproduction
– Waiting
– Non-utilized People
– Transportation
– Inventory
– Motion
– Extra processing

22NIST MEP
How the Program Works
23NIST MEP
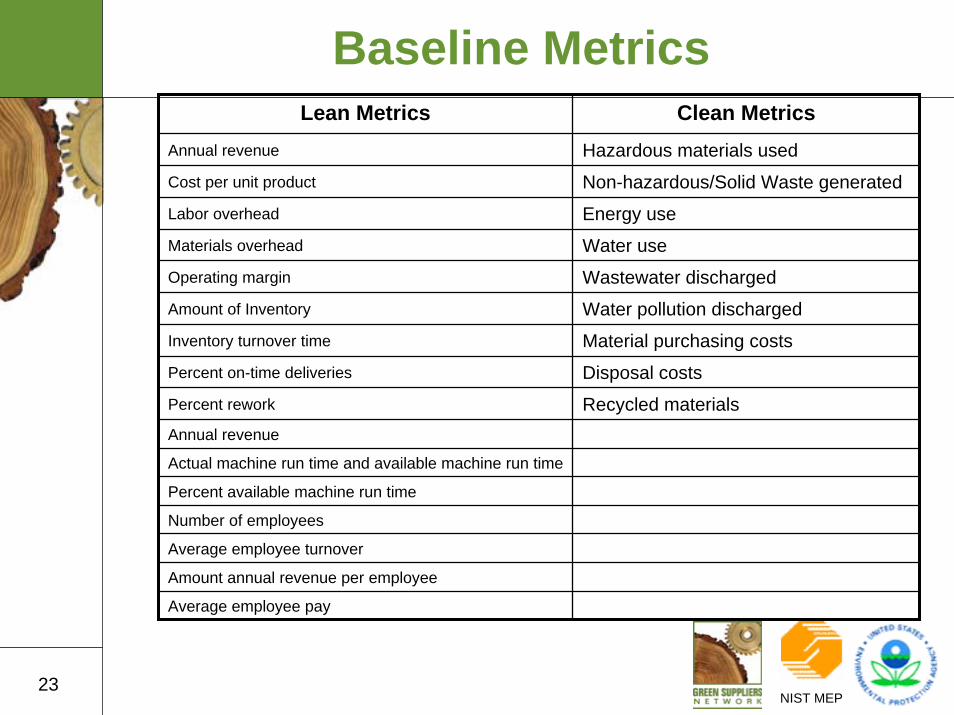
Baseline MetricsLean Metrics Clean Metrics
Annual revenue Hazardous materials usedCost per unit product Non-hazardous/Solid Waste generatedLabor overhead Energy use Materials overhead Water use Operating margin Wastewater dischargedAmount of Inventory Water pollution dischargedInventory turnover time Material purchasing costsPercent on-time deliveries Disposal costsPercent rework Recycled materialsAnnual revenue
Actual machine run time and available machine run time
Percent available machine run time
Number of employees
Average employee turnover
Amount annual revenue per employee
Average employee pay

24NIST MEP
Review Specifics
• Reviews first come, first served
• Reviews focus on single process
• On-site reviews take 2-3 days
• Cost$7,500 Total cost to supplier
• Return on Investment is generally 3:1

25NIST MEP
Success Story
Summit Corporation of America• Metal finishing company• 121 employees, $18M in annual sales • Nickel barrel plating line -- 3% of business
Green Suppliers Network Review Results• $980,000 in potential annual savings • $95,000 in potential energy savings

26NIST MEP
Success Story
HAR-CONN Chrome Company• Metal finishing company• 55 employees, $6M in annual sales• Hard chrome plating line -- 15% of business
Green Suppliers Network Review Results• $425,000 in potential annual savings • $77,750 in potential energy savings

27NIST MEP
For More Information
www.greensuppliers.gov
Tom Murray, US [email protected]
202-564-8829
Kari Reidy, [email protected]
301-975-4149

28
Suppliers Partnership for the Environment (SP)
Going Green WebinarRubber and Plastics News
Steve Hellem, Executive Director, SP
August 12 2009

29
Suppliers Partnership for the Environment
Vision:
Association of automotive OEMS and their suppliers working in partnership with the EPA to find creative ways to improve the environment while providing economic value to the members.
Mission:
A forum for large, medium and small service and product vendors and vehicle manufacturers to develop and share tools, information, knowledge, good practices and technical support to ensure that the suppliers’ products and their processes provide environmental improvement and cost savings to SP participants.

30
What is SP?
• 40 Member Companies
• Non-profit 501(c)(6) Organization
• Member Driven Work Group Activities
• Advocacy Organization

31
Current SP MembersAtwater Steel
Trading Corporation
Merit Laboratories
Inc.
Advanced Environmental Management
Group
Crystal
Filtration

32
What is EPA’s andNIST’s Role in SP?
• SP is in a partnership with the U.S. EPA
• EPA provides topics for special projects, information, tools and resources
• EPA brings to SP additional opportunities, including providing financial resources from the National Institute of Standards and Technology’s (NIST) Manufacturing Extension Partnerships (MEPs) to provide counsel and guidance for facilitation of SP Member “Lean and Green” Technical Assistance Workshops.

33
Value of SP Membership
• Provides a common auto sector approach to greening the supply chain.
• Provides a forum for companies to work together to share “good practices” through work groups to address specific issues.
• Provides facility-specific technical assistance workshops.
• All cost savings realized through SP – MEP workshop activities are retained by the SP member company.

34
SP Work Groups
• Energy
• Materials Efficiency
• Technology and Networking
• Chemical Issues Management

35
Energy Work Group
Goal: Identify ways to provide energy cost savings to SP companies in a way that those companies can: - Utilize more efficient technologies, practices and
services- Quantify the results of their energy efficiency or
energy reduction activities- Achieve some or all of the cost reductions that will
be required by their customers. - Reduce the carbon footprint of SP member
companies
Co-chairs: Reg Modlin, Chrysler LLCRahul Naik, ARCADIS

36
Energy Work Group Resources
• U.S. EPA
http://www.energystar.gov/
• DOE
http://www1.eere.energy.gov/industry/saveenergynow/energy_experts.html
• Chrysler Energy Manual
Available to SP members at no cost!

37
Success Stories
Chrysler:Through May 2007, from a 2006 baseline, the Chrysler Group has
reduced energy consumption by 3% per vehicle built, eliminating approximately 600,000 MMbtu’s or 112,500 metric tons of CO2.
Federal-Mogul:Federal-Mogul has 729 projects from 98 plants. These projects have
saved $9.4M since 2004. Have $9M more in open projects. Estimate this at 60,900 Metric Tons of Greenhouse gas reduction.
General Oil Company:• Steam/Natural Gas – 13% natural gas savings from February to
May 2007 over same time period in 2006. • Lighting/Electricity - electricity savings of 3% or 5,000 kWh in 2008• Water - 17% reduction in water usage in 2008.

38
Materials EfficiencyWork Group
Goal: Serve member companies by finding creative relationships and technologies that will reduce packaging by-product environmental impacts and create a multi-tiered environmental approach to managing packaging by-products.
Co-chairs: John Bradburn, GMSusanne Fredericks, Goodwill International

39
Success Stories - Goodwill
• Earth Day Events –60,000 lbs. (e-waste & household goods)- DENSO (and Affiliates)- GM
• Reconnect E-Cycling –2,391,439 lbs. - 5,094,439 lbs. since October 2005
• 20 jobs created• Wooden Heat Treated Pallets -2125• Plastic (caps, plugs, totes, trays, pallets and vehicle parts) –1,063,674 lbs. * • Cardboard (OCC) –360,000 lbs. • Vehicle Batteries Re-charged -2336 • Gaylords –15/week• Aluminum –4354 lbs from obsolete dunnage

40
Success Stories – Federal-Mogul
Quiet Shield G Project- Developed a process to convert Asian/ U.S cardboard and recycled
textile fibers into a non-woven substrate for use as an acoustic material.
Objectives:- To reduce waste in the assembly plants and turn it back into usable
parts in the vehicle. - Final non-woven substrate to contain 25-75% Cardboard.- Material must meet technical, commercial, and economic targets
What’s Next:- Working with GM on the Volt and Epsilon II platform.- Continuing to explore use of alternative materials- Exploring incorporation of additional processes

41
Success Stories - GM
GM Warren Technical CenterProject Overview: 2 x 250,000 Gallon Fuel Oil Storage Tanks
- Clean, decommission tanks, piping and pits which was abandoned in place 15 years ago.
Environmental Benefits• Reused 44 K Gallons within Company• Recycled 74 K Gallons• Limited landfill volume to < 1%• Avoided Land filling 106 K Net Oil Gallons of High Water fuel.
Representing 1,200 Metric Tons of CO2.
Economic Benefits• Reuse-Saved corporation $150,000 in Material Costs•Recycling-
Saved an additional $15,000 over Landfill Costs

42
Technology and Networking Group
Goal: Providing a forum through which member companies share opportunities and processes for SP's Tier II and Tier III companies to communicate directly and effectively with the OEMs and Tier I suppliers in the organization and automotive industry.
Co-Chairs: David O’Ryan, Asset Recovery & Management Gr.Russell Brynolf, FTS Technologies

43
U.S. Automotive Industry Roadmap Activity
Goal: Identify specific strategies, technologies and policy recommendations for ways that the United States’automotive industry can utilize technology, innovation and creativity to enhance the economic and environmental performance of the automotive manufacturing industry and its supply chain, while improving its environmental footprint.
Task Force: John Bradburn, GMDave O'Ryan, Asset Recovery & Management Gr.Russell Brynolf, FTS TechnologiesJimmy Gayle, Gayle Technologies Inc.

44
Chemical Issues Work Group
Goal: Forum for discussing emerging chemical issues of potential impact to the automotive manufacturers and supply chain; creating a Materials Assessment Process to address and assess chemical issues in the interior of an automobile as well as addressing chemical impacts outside the vehicle, such as wear parts.
Chair: Pat Beattie, General Motors

45
MAS Development Team Participants
• General Motors• Ford Motor Company• Chrysler• Honda• Hyundai• Nissan• Subaru• Lear Corp
• Eagle-Ottawa• Denso• JCI• Allegiant• Federal-Mogul• Quaker Chemical

46
The Approach
The SP MAS is structured into 4 Phases:
- Phase 1 – Principles and preliminary project scope
- Phase 2 – Develop common risk assessment parameters and identify appropriate tools for human exposure in vehicle interiors
- Phase 3 – Build upon Phase 2 to include environmental risks from vehicle wear debris (brakes, tires) or other exterior materials
- Phase 4 – Build upon Phase 3 to include health and environmental risks from vehicle end-of-life activities

47
MAS Drivers
• REACH and its increased attention to exposure/risk• TSCA reauthorization• California Green Chemistry Rule efforts• United Nations Environment Program
- Workshop in Geneva - February 2009- Sweden and Japan sponsors- Auto industry is a leader
- GM presentation • NGOs, Investors and other stakeholders

48
Current Status
• MAS Principles complete• MAS Program Guidelines complete
- Hazard & Dose Response Assessment Guidelines- Exposure Assessment Guidelines- Risk Assessment Guidelines- Business Process Management Guidelines
• Assessment Process Automation via Web-based software- Subset of companies working with Science Strategies, LLC & SciVera, Inc.
- Piloting and optimization• Implementation
- Voluntary, company-specific approach
49
MAS Recommendation at the CEC Council Meeting
• On June 24, 2009, Pat Beattie, GM and Barbara Boroughf, Lear, urged members of the CEC Council, to support the implementation of the SciVera Lens ™ process for assessing and managing chemicals used by the North American Auto Industry.
• Utilizing CEC as the facilitator and coordinator of the program, it was recommended that Canada, Mexico and the United States each provide $1 million dollars a year for two years, as seed money, in order to provide the M-A-S software to North American auto manufacturers and their suppliers for two years.
• Program has potential to impact chemical characteristics of all articles (parts) and process chemicals used in the North American auto industry.
• Copies of statement are on SP’s website, www.supplierspartnership.org

50
Projected Achievements
Program Duration -- Jan 2010 through Dec 2011
• >10,000 Industrial Chemicals (CAS Registry Numbers) Researched and Assessed for Properties, Hazard Attributes and relevant data for exposure estimation and calculating characterization
• >500,000 Automotive Components Assessed for Hazard and Risk
• 300 Substances of Concern substituted or eliminated from over 100,000 automotive components
• Reporting mechanism of general program achievement metrics for supporting countries to track progress of the program
• Engine for innovation toward better products for humans and the environment resulting in enhanced competitive advantage for the North American automotive industry

51
MAS Phase 3 Scope
• Build upon Phases 1 & 2 (Principles & Auto Interior Materials)
• Incorporate Friction Materials & Wear Debris (e.g, Brakes, Tires, Belts, etc.)
• Explore Hazards, Exposure, and Risks- Multi-pathway- Human and Environmental
• Deliverable is a Supplement to Existing Guidelines for Friction Components

52
MAS Phase 3 Timeline
• Begin 3rd Quarter 2009
• Engage Tire and Friction Component Suppliers
• Complete work by 1st Quarter 2010

53
For More Information on SP
Suppliers Partnership for the Environment1155 15th Street, NW, Suite 500
Washington, DC 20005Phone: 202-530-0096
Fax: 202-530-0659info@supplierspartnership.orgwww.supplierspartnership.org

Going GreenResources for Reducing Rubber Operation Wastes
and Markets for Utilizing your Green Product
Questions?

Going Green in RubberNext for Going Green in Rubber? - Summer 2010
• Rubber company case studies - General
• Rubber company case studies – Recycle
• Traditional raw material suppliers – Efforts to reduce carbon foot print
• Round table - rubber automotive, appliance, consumer markets
• Regulatory updates

Going GreenResources for Reducing Rubber Operation Wastes
and Markets for Utilizing your Green Product
Thanks for participating!
This Webinar will be archived for 3 months at RubberNews.com


![[Noga Alon, Joel H. Spencer] the Probabilistic Met(BookZZ.org) (1)](https://img.dokumen.tips/doc/110x75/577c7d1a1a28abe0549d66f0/noga-alon-joel-h-spencer-the-probabilistic-metbookzzorg-1.jpg)