Embed Size (px)
Citation preview

Issues Paper
Murraylink electricity transmission
revenue proposal
1 July 2018 to 30 June 2023
March 2017
Murraylink electricity transmission revenue proposal 2018–23 | Issues Paper i

© Commonwealth of Australia 2017
This work is copyright. In addition to any use permitted under the Copyright Act 1968, all material contained within this work is provided under a Creative Commons Attributions 3.0 Australia licence, with the exception of:
the Commonwealth Coat of Arms
the ACCC and AER logos
any illustration, diagram, photograph or graphic over which the Australian Competition and Consumer Commission does not hold copyright, but which may be part of or contained within this publication. The details of the relevant licence conditions are available on the Creative Commons website, as is the full legal code for the CC BY 3.0 AU licence.
Requests and inquiries concerning reproduction and rights should be addressed to:
Director, Corporate CommunicationsAustralian Competition and Consumer Commission GPO Box 4141, Canberra ACT 2601
or
Inquiries about this publication should be addressed to:
Australian Energy RegulatorGPO Box 520Melbourne Vic 3001
Tel: (03) 9290 1444Fax: (03) 9290 1457
Email: [email protected]
Murraylink electricity transmission revenue proposal 2018–23 | Issues Paper ii

Request for submissions
Energy consumers and other interested parties are invited to make submissions on the Murraylink electricity transmission revenue proposal by COB Friday 12 May 2017. The proposal is available on the AER’s website www.aer.gov.au
We will consider and respond to submissions in our draft determination in September 2017.
We prefer that all submissions are in Microsoft Word or another text readable document format. Submissions should be sent to: [email protected]
Alternatively, submissions can be sent to:
Mr Sebastian RobertsGeneral ManagerAustralian Energy RegulatorGPO Box 520Melbourne Vic 3001
We prefer that all submissions be publicly available to facilitate an informed and transparent consultative process. Submissions will be treated as public documents unless otherwise requested. Parties wishing to submit confidential information should:
clearly identify the information that is the subject of the confidentiality claim
provide a non-confidential version of the submission in a form suitable for publication.
All non-confidential submissions will be placed on our website. For further information regarding our use and disclosure of information provided to us, see the ACCC/AER Information Policy (June 2014), which is available on our website: ACCC and AER information policy.
If interested parties have any enquires about this Issues Paper, or about lodging submissions, please send an email to: [email protected]
Murraylink electricity transmission revenue proposal 2018–23 | Issues Paper iii

Contents1 Introduction...............................................................................................1
2 Our initial observations............................................................................4
2.1. Total revenue......................................................................................4
2.2. Capital expenditure............................................................................6
2.3. Regulatory asset base.......................................................................6
2.4. Operating expenditure.......................................................................7
2.5. Rate of return......................................................................................7
3 Background to our assessment..............................................................9
3.1. Who we are.........................................................................................9
3.2. Who is Murraylink and what does it do?........................................11
3.3. AER Guidelines and schemes.........................................................11
3.4. Our framework and approach paper..............................................12
3.5. Maximum allowed revenue to be recovered from consumers.....12
4 Capital expenditure.................................................................................15
4.1. How do we assess capex expenditure...........................................15
4.2. Murraylink's capex proposal...........................................................16
4.3. Key drivers of the capital expenditure proposal...........................17
5 Operating expenditure ...........................................................................20
5.1. How we assess operating expenditure..........................................20
5.2. Murraylink's operating expenditure proposal................................22
5.2.1 Key opex issue...............................................................................23
6 Rate of return...........................................................................................25
6.1. How we calculate the rate of return................................................25
6.1.1 Return on equity.............................................................................25
6.1.2 Return on debt................................................................................26
Murraylink electricity transmission revenue proposal 2018–23 | Issues Paper iv

6.2. Murraylink's proposed overall rate of return.................................27
6.3. Key rate of return issues.................................................................27
6.3.1 Return on equity.............................................................................27
6.3.2 Return on debt................................................................................28
7 Value of imputation credits....................................................................30
7.1.1 How we have calculated the value of imputation credits................30
7.2. Murraylink's proposed value of imputation credits......................30
8 Consumer engagement..........................................................................32
8.1. Consumer engagement in the NER................................................32
8.2. Our consumer engagement guideline............................................33
8.3. Murraylink’s consumer engagement strategy...............................33
Murraylink electricity transmission revenue proposal 2018–23 | Issues Paper v

Shortened formsShortened form Extended form
AEMC Australian Energy Market Commission
AEMO Australian Energy Market Operator
AER Australian Energy Regulator
capex capital expenditure
EBSS efficiency benefit sharing scheme
kW kilowatt
MAR maximum allowed revenue
MW megawatt
MWh megawatt hour
NEL National Electricity Law
NEM National Electricity Market
NEO National Electricity Objective
NER National Electricity Rules
opex operating expenditure
RAB regulatory asset base
RIT-T Regulatory Investment Test for Transmission
RPPs Revenue and pricing principles
STPIS service target performance incentive scheme
TUoS transmission use of system
VCR Value of Customer Reliability
WACC weighted average cost of capital
Murraylink electricity transmission revenue proposal 2018–23 | Issues Paper vi

1 IntroductionHouseholds and businesses consume electricity, which is supplied through a network of 'poles and wires'. The electricity network is commonly divided into two parts:
a transmission network, which carries electricity from the large generators to the major load centres
a distribution network, which carries electricity from the points of connection with the transmission network to virtually every building, house and apartment.
The transmission and distribution networks charge their customers for transmitting electricity across their networks. These 'network charges' do not appear directly on most customers’ electricity bills, which are sent by the retail businesses. Nevertheless, the network charges are important as they account for a significant component of each customer's final bill.
Murraylink owns and operates a transmission link between the Victorian and SA transmission networks. On 31 January 2017 Murraylink submitted its electricity transmission revenue proposal for its regulatory control period from 1 July 2018 to 30 June 2023 (2018–23 regulatory control period). This revenue proposal sets out how much Murraylink proposes to charge its customers over the five year period.
We, the Australian Energy Regulator (AER), regulate the revenues of the network businesses by setting the annual revenues they may recover from customers. For electricity transmission businesses, this annual revenue is called the maximum allowed revenue, and directly affects the network charges Murraylink can recover from customers as part of their electricity bills.
Although our decision influences the total revenue Murraylink can recover from its transmission customers, we do not set transmission charges for each customer or the retail prices that end consumers pay. Retail prices are set by electricity retailers and include the costs associated with transmission, distribution, generation, and the costs incurred by retailers in selling the electricity.
We are just starting the process of reviewing Murraylink's revenue proposal for the 2018–23 regulatory control period. This involves examining Murraylink's proposal to ensure that consumers pay no more than necessary for the safe and reliable delivery of electricity.
We determine an overall revenue allowance based on a forecast of the efficient costs required by Murraylink to prudently provide transmission services and fulfil its obligations. The regime provides incentives for Murraylink to outperform our forecast, while delivering safe, reliable and secure services to its customers. If Murraylink incurs costs that are greater than what we deem to be efficient, Murraylink bears those costs.
The purpose of this issues paper is to help consumers and other stakeholders understand Murraylink's proposal. This issues paper will be followed by our draft decision in September 2017 and our final decision by April 2018.
Table 1 lists the key dates of the review.
Murraylink electricity transmission revenue proposal 2018–23 | Issues Paper 1

Table 1 Key dates for the Murraylink transmission pricing review
Step Date
AER published Framework & Approach paper for Murraylink July 2016
Murraylink submitted revenue proposal to AER 31 January 2017
AER publishes issues paper 28 March 2017
AER to hold public forum on issues paper 10 April 2017
Submissions on revenue proposal close 12 May 2017
AER to publish draft transmission determination 29 September 2017*
AER to hold public forum on draft transmission determination October 2017
Murraylink to submit revised revenue proposal to AER 1 December 2017*
Submissions on revised revenue proposal and draft determination close 5 January 2018 *
AER to publish final transmission determination 30 April 2018
Source: NER, chapter 6A, Part E* Note this is our expected timeframe; actual dates may differ.
Under the NER, consumer engagement is a factor we can consider when making our revenue determinations.1 Consumers can get involved in our review process in a number of ways. We will host public forums during which consumers can ask us and Murraylink questions. Consumers can make submissions on Murraylink's proposal, this issues paper, and our draft determination.
As part of our 'Better Regulation Program' and to ensure that consumers have a say in our decision making process, we established the Consumer Challenge Panel (CCP). The purpose of the CCP is to assist us in making better regulatory decisions by advising us on issues that are important to consumers. Panel members will present their views and analysis at our public forums, which will help consumers understand the issues and be better able to have a say.
Submissions
Submissions on Murraylink's proposal and this issues paper are due by 12 May 2017.
Your submission will be of greater value to us if it is supported by evidence and analysis. Submissions that address specific issues, supported by evidence and analysis, can be very useful.
If you consider a certain aspect of the revenue proposal is not justified, you should state why you consider it is not justified. You should also state what further information you consider
1 NER, cl. 6A.6.6(e)(5A), cl. 6A.6.7(e)(5A).
Murraylink electricity transmission revenue proposal 2018–23 | Issues Paper 2

Murraylink should provide to justify that aspect of its proposal. Likewise, if you consider a certain aspect of the proposal is justified, you should state why.
When considering the questions on which we would like feedback, it is useful to keep in mind that our jurisdiction in reviewing the proposal is set out in the National Electricity Law (NEL) and National Electricity Rules (NER). The objective of the regulatory framework is to promote the efficient investment in, and efficient operation and use of, electricity services for the long term interests of consumers of electricity. Under the NER, we assess the business' proposed expenditure forecasts to determine whether they are required to meet this objective.
We are most interested in receiving submissions on Murraylink's proposed approach to customer engagement, operating expenditure (opex), capital expenditure (capex), and the expected rate of return. However, we welcome submissions on all aspects of the proposal.
Public forum
We will hold a public forum on Murraylink's revenue proposal at the AER's Adelaide office, Level 2, 19 Grenfell Street, Adelaide SA, on Monday 10 April 2017 from 12 noon to 2pm. To attend, please email us by COB Tuesday 4 April 2017 at: [email protected]
Murraylink electricity transmission revenue proposal 2018–23 | Issues Paper 3
2 Our initial observations This section sets out our initial observations on Murraylink's revenue proposal.
2.1 Total revenueMurraylink's revenue proposal covers many issues relevant to our responsibilities as an economic regulator. Primarily though, the revenue proposal sets out the revenue that Murraylink proposes to recover from consumers over the next regulatory control period. This section discusses Murraylink's revenue proposal in total.
Murraylink has proposed a total revenue requirement of $90.5 million (smoothed, real $ June 2018) over the 2018–23 regulatory control period.2,3 This represents a 30 per cent increase compared to the revenue Murraylink was allowed to recover from customers over the 2013–18 regulatory control period.4
Murraylink's actual and forecast revenue are outlined in Figure 1 below.
Figure 1 Murraylink total revenue requirement ($m, real June 2018)
Source: AER, Murraylink Regulatory Accounts; AER, Final decision PTRM for Murraylink 2013-18, 3 July 2013; Murraylink, Revenue Proposal 2018-23, January 2017; AER analysis.
2 Energy Infrastructure Investments - Murraylink Transmission Company Pty Ltd, Murraylink Revenue Proposal, Effective July 2018 to June 2023, January 2017 (Murraylink, Revenue Proposal 2018–23, January 2017). Revenues are smoothed to reduce revenue fluctuations between years. To calculate the smoothed revenues, the annual building block revenue requirements (the sum of the various building block costs) for all five years are smoothed across the regulatory control period. The smoothed and unsmoothed revenues across this period are equal in net present value terms.
3 Murraylink, Murraylink - Attachment 10.1 - Murraylink - PTRM - 20170131 - Public, January 2017.4 AER analysis.
Murraylink electricity transmission revenue proposal 2018–23 | Issues Paper 4

Revenue impact by building block revenue component
To assist consumers to understand the drivers of the increase in Murraylink's proposed total revenue requirement we have separated Murraylink's proposed changes in revenue into the various building block elements.
In the figure below we show the impact of these changes as if all of these were to occur in the first year. By doing so, we can see more clearly the key drivers of Murraylink's proposed revenue increase.
Figure 2 shows that the regulatory depreciation, corporate tax and opex building blocks are the key drivers of the proposed increase in revenues in the 2018–23 regulatory control period.
Figure 2 Murraylink – change in 2013–18 average revenue to proposed 2018–23 average revenue – by revenue component ($m, June 2018)
Source: AER, Final decision PTRM for Murraylink 2013-18, 30 April 2013; Murraylink, Revenue Proposal 2018-23, January 2017; AER analysis.
2.2 Capital expenditure
Murraylink electricity transmission revenue proposal 2018–23 | Issues Paper 5

Murraylink has proposed forecast capex of $33.8 million ($2018) over the forthcoming regulatory period. This represents an average increase of approximately 101 per cent compared to actual and expected expenditure over the current period.5
Murraylink submitted that all of the capex forecast is related to network capex for replacement and refurbishment. A significant part of the forecast ($27.2 million or 80 per cent) is for replacement of the control system. Murraylink’s capex forecast does not include any expenditure for augmentation of the network or non-system components.6 Murraylink has however, proposed a significant contingent project which it submits would be capable of addressing the capacity constraints in the regional transmission networks as well as providing increased South Australian interconnection capacity.7 Murraylink proposed three staged augmentation projects with a total cost of $994 million ($2018). As a contingent project, this expenditure has not been included in the capex forecast. Rather, as submitted by Murraylink, this will be subject to the completion of a RIT-T consultation and cost benefit analysis that justifies any one or more than one element of the contingent project, and financial commitment by Energy Infrastructure Investments.8
See section 4 of this paper for further details.
2.3 Regulatory asset baseThe regulatory asset base (RAB) is the value of the assets used by Murraylink to provide prescribed transmission services. From the proposed opening value of the RAB on 1 July 2018, the RAB will be adjusted for each year of the 2018–23 regulatory control period by:
adding an inflation adjustment to the opening RAB
adding actual or estimated capital expenditure to the RAB
subtracting depreciation from the RAB, calculated according to a straight-line depreciation approach
subtracting gross proceeds from any asset disposals.
These annual adjustments give the closing RAB for any particular year, which then becomes the opening RAB for the following year, and this process rolls forward the RAB to the end of the 2018–23 regulatory control period.
Figure 3 Murraylink historical and forecast RAB ($m, nominal)
5 Murraylink, Revenue Proposal 2018–23, January 2017, pp. 19 and 93. Actual expenditure and estimated expenditure over the current period is in nominal dollar terms. Actual and forecast CPI has escalated to derive a comparable average in real dollar terms ($2018).
6 Murraylink, Revenue Proposal 2018–23, January 2017, p. 93.7 Murraylink, Revenue Proposal 2018–23, January 2017, p. 94.8 Murraylink, Revenue Proposal 2018–23, January 2017, pp. 95–96.
Murraylink electricity transmission revenue proposal 2018–23 | Issues Paper 6
Source: AER, Final decision PTRM for Murraylink 2013–18, April 2013; AER, Final decision RFM for Murraylink 2013–18, April 2013; AER, Final decision PTRM for Murraylink 2003-12, October 2003; Murraylink, Revenue Proposal 2018/19 – 2022/23, January 2017.
As shown in Figure 3, Murraylink proposed an opening RAB value of $114 million ($nominal) as at 1 July 2018 and a closing forecast RAB of $124 million ($nominal) as at 30 June 2023. This closing forecast RAB reflects the proposed opening RAB, forecast capex, expected inflation, and depreciation over the 2018–23 regulatory control period.
2.4 Operating expenditureMurraylink proposed total operating expenditure of $22.0 million ($2018) for the 2018–23 regulatory control period. This is approximately 5.6 per cent more than Murraylink's actual and estimated opex in the 2013–18 regulatory control period.9
See section 5 of this paper for further details.
2.5 Rate of returnMurraylink has proposed a rate of return of 6.54 per cent. This is made up of:
8.6 per cent return on equity calculated using;
o A (placeholder) risk free rate of 2.82 per cent
o A beta of 0.8; and
o A (placeholder) market risk premium of 7.18 per cent
A (placeholder) 5.16 per cent return on debt; and
9 AER analysis; Murraylink Revenue Proposal 2018–23, January 2017, pp. 105-106. . Opex for 2013–14 to 2015–16 is actual; opex for 2016–17 to 2017–18 is estimated because actual data is not available yet.
Murraylink electricity transmission revenue proposal 2018–23 | Issues Paper 7

60 per cent gearing.10
We consider Murraylink's proposed rate of return in further detail in section 6 of this paper.
10 Note: Murraylink has proposed a method for forecasting the WACC which yields this value at the time of submission. However, as per usual practice, these values will be revised using updated data.
Murraylink electricity transmission revenue proposal 2018–23 | Issues Paper 8

3 Background to our assessmentThis section provides information about the AER and Murraylink. If you are familiar with the AER's pricing review process, then refer straight to section 4.
The NEL and NER set out the regulatory framework for the National Electricity Market (NEM). Chapter 6A of the NER contains timelines and processes for the regulation of transmission businesses. It provides that regulated transmission businesses must periodically apply to us to assess their revenue requirements. Typically, this happens every five years. The revenue proposal as submitted by each business starts a process often referred to as a pricing review or 'revenue reset'.
3.1 Who we areWe are Australia's energy market regulator for the National Electricity Market (NEM).11 Our functions are set out in NEM legislation and rules. These functions include:
setting the revenues that network businesses can recover from their customers for using energy networks (electricity poles and wires and gas pipelines) to transport energy to customers
monitoring wholesale electricity and gas markets so suppliers comply with the legislation and rules, and taking enforcement action where necessary
publishing information on energy markets, including the annual State of the Energy Market report and more detailed market and compliance reporting, to assist participants and the wider community
assisting the Australian Competition and Consumer Commission with energy-related issues arising under the Competition and Consumer Act, including enforcement, mergers and authorisations.
The NEL and NER set out the regulatory framework under which we operate.
We exercise our functions in a manner that will advance the National Electricity Objective (NEO). The NEO in turn is supported through the revenue and pricing principles and the various objectives, criteria and elements within the rules. The NEO is:
…to promote efficient investment in, and efficient operation and use of, electricity services for the long term interests of consumers of electricity with respect to—
(a) price, quality, safety, reliability and security of supply of electricity; and
(b) the reliability, safety and security of the national electricity system.
Energy Ministers have provided us with a substantial body of explanatory material that guides our understanding of the NEO. 12 The long term interests of consumers are not
11 The NEM connects electricity customers to electricity generators across all states and Territories with the exception of the Northern Territory and Western Australia. We are responsible for regulating electricity networks in every state and territory other than Western Australia.
12 Hansard, SA House of Assembly, 9 February 2005 pp. 1451–1460.Hansard, SA House of Assembly, 27 September 2007 pp. 963–972. Hansard, SA House of Assembly, 26 September 2013 pp. 7171–7176.
Murraylink electricity transmission revenue proposal 2018–23 | Issues Paper 9

delivered by any one of the NEO's factors in isolation, but rather by balancing them in reaching a regulatory decision. 13
In general, we consider that we will achieve this balance and, therefore, contribute to the achievement of the NEO, where consumers are provided a reasonable level of safe and reliable service that they value at least cost in the long run.14 In most industries, competition creates this outcome. Competition drives suppliers to develop their offerings to attract customers. Where a supplier’s offering is not attractive it risks being displaced by other suppliers.
However, in the energy networks industry the usual competitive disciplines do not apply. Electricity transmission businesses such as Murraylink are largely natural monopolies.15 In addition, many of the products they offer are essential services for most consumers. Consequently, in an uncompetitive environment, consumers have little choice but to accept the quality, reliability and prices the network service provider offers.
The NEL and NER aim to remedy the absence of competition by providing that we, as the regulator, make decisions that are in the long term interests of consumers. For example, we might require a transmission business to offer its services at a different cost than they would choose themselves. By its nature, this process will involve exercising regulatory judgement to balance the NEO's various factors.
It is important to recognise that there are a number of plausible outcomes that may contribute to the achievement of the NEO. The nature of decisions under the NER is such that there may be a range of economically efficient decisions, with different implications for the long term interests of consumers.16 At the same time, however, there are a range of outcomes that are unlikely to advance the NEO to a satisfactory extent. For example, we do not consider that the NEO would be advanced if allowed revenues encouraged overinvestment and resulted in prices so high that consumers are unwilling or unable to efficiently use the network.17 This could have significant longer term cost implications for those consumers who continue to use network services.
Equally, we do not consider the NEO would be advanced if the revenue recoverable from customers results in prices so low that investors are unwilling to invest as required to adequately maintain the appropriate quality and level of service, and where customers make more use of the network than is sustainable. This could create longer term problems and have adverse consequences for safety, security and reliability of the network.18
13 Hansard, SA House of Assembly, 26 September 2013 p. 7173.14 Hansard, SA House of Assembly, 9 February 2005 p. 1452.15 A natural monopoly is a distinct type of monopoly that may arise when there are extremely high fixed costs of distribution,
such as exist when large-scale infrastructure is required to ensure supply. Examples of infrastructure include cables and grids for electricity supply, pipelines for gas and water supply.
16 Re Michael: Ex parte Epic Energy [2002] WASCA 231 at [143].Energy Ministers also accept this view – see Hansard, SA House of Assembly, 26 September 2013 p. 7172.AEMC, Rule Determination National Electricity Amendment (Economic Regulation of Transmission Services) Rule 2006 No. 18, p. 50
17 NEL, s. 7A(7).18 NEL, s. 7A(6).
Murraylink electricity transmission revenue proposal 2018–23 | Issues Paper10

3.2 Who is Murraylink and what does it do?Murraylink Transmission Company Pty Ltd operates Murraylink, a privately funded transmission interconnector. Murraylink connects the Victorian and South Australian regions of the NEM, transferring power between the Red Cliffs substation (near Mildura) in Victoria and the Monash substation in Berri, South Australia. Murraylink is a direct current interconnector with a rated capacity of 220 megawatts.19
Murraylink is dispatched by the Australian Energy Market Operator (AEMO), in a similar manner to a generator, to control flows between the Victorian and South Australian regions of the NEM and minimise generation costs in the NEM.20
The Murraylink Transmission Company Pty Ltd is owned by Energy Infrastructure Investments Pty Ltd and managed by the APA Group.21
3.3 AER Guidelines and schemesDuring our 2013 Better Regulation program we developed, through an extensive consultation process, a number of guidelines and schemes. The result was a suite of guidelines that accommodated changes to the NEL and NER and set out approaches we consider are most likely to advance the NEO.
Below is a list and brief description of each of our guidelines and schemes that are relevant to our decision for Murraylink. These are available on our website and include:22
Expenditure forecast assessment guideline
This guideline sets out how we go about assessing the operating and capital expenditure proposals from businesses.
Rate of return guideline
This guideline sets out how we go about determining the allowed rate of return businesses earn on their investments.
Capital expenditure incentive guideline
Our capital expenditure incentive guideline provides network businesses with an incentive to spend capital expenditure efficiently and share the benefits of efficiencies with consumers.
Efficiency benefit sharing scheme
Our efficiency benefit sharing scheme provides network businesses with a continuous incentive to spend operating expenditure efficiently and share efficiencies with consumers.
Consumer engagement guideline for network service providers 19 Murraylink, Revenue Proposal 2018–23, January 2017, p. 9.20 Murraylink, Revenue Proposal 2018–23, January 2017, p. 3.21 Murraylink, Revenue Proposal 2018–23, January 2017, p. 7.22 http://www.aer.gov.au/Better-regulation-reform-program
Murraylink electricity transmission revenue proposal 2018–23 | Issues Paper11

This guideline looks at our expectations of what the businesses should consider in implementing consumer engagement strategies that are effective for all stakeholders.
Shared asset guideline
This guideline explains how revenue the networks earn from shared assets is shared with consumers.
Service target performance incentive scheme
The purpose of the STPIS is to provide incentives to TNSPs to improve or maintain a high level of service for the benefit of participants in the NEM and end users of electricity.
Confidentiality guideline
This guideline sets out how we manage confidential information claims within the regulatory determination process.
We consulted extensively in developing these guidelines. This consultation process was very important for testing our views and hearing from a range of interested parties. In particular, we made a special effort to engage consumers in the process through our Consumer Reference Group. The guidelines provide a solid foundation for our decision making and provide predictability in how we will exercise our discretion. Predictability provides confidence to both investors and consumers.
3.4 Our framework and approach paperWe released our Framework and Approach (F&A) paper for Murraylink on July 2016.23 The F&A paper is the first step in the regulatory process and determines the broad nature of any regulatory arrangements that will apply in this process. It also facilitates early public consultation and assists network service providers to prepare revenue proposals.
The F&A is not binding on Murraylink or us.24 This means it is open to Murraylink or us to propose a different approach to that set out in our F&A for the regulatory control period.
3.5 Maximum allowed revenue to be recovered from consumers
A transmission business recovers revenue from its customers via network charges. A pricing methodology prescribes the way the business recovers this revenue. To determine the transmission business' revenue for the next regulatory control period, we assess the total revenue required to provide prescribed transmission services for each year of the period.
In accordance with the NER, we use the building block approach to determine the total revenue required by the business. That revenue requirement is determined by estimating the efficient costs that the business is likely to incur in providing prescribed transmission services. The underlying cost elements include:
23 The Murraylink F&A can be found on our website at: http://www.aer.gov.au/system/files/AER%20-%20Murraylink%20final%20framework%20%26%20approach%202018-23%20-%20July%202016.pdf
24 NER, cl. 6A.10.1A(f).
Murraylink electricity transmission revenue proposal 2018–23 | Issues Paper12

a return on the regulatory asset base (RAB) (return on capital)
depreciation of the regulatory asset base (return of capital)
forecast operating expenditure (opex)
increments or decrements resulting from the application of incentive schemes
the estimated cost of corporate income tax.
Our assessment of capex directly affects the size of the RAB and therefore the return on capital and return of capital building blocks.
Our assessment of Murraylink's proposal will consider each of the building blocks shown in Figure 4. However, we must decide Murraylink's revenue as a whole and describe how the component parts of the decision relate to each other.
Murraylink electricity transmission revenue proposal 2018–23 | Issues Paper13
Figure 4 The building block approach to determining maximum allowed revenue
The key drivers of these cost elements in the revenue proposal are discussed in sections 4 to 7 of this paper.
Murraylink electricity transmission revenue proposal 2018–23 | Issues Paper14

4 Capital expenditureCapital expenditure (capex) refers to the capital expenditure incurred in the provision of network services. The most significant elements of total capex are generally network augmentation expenditure (augex) and asset replacement expenditure (repex).
Capex is added to the regulatory asset base (RAB) and so forms part of the capital costs of the building blocks used to determine total required revenue. Under the rules, we must accept the proposed forecasts of total capex if we are satisfied they reasonably reflect the capital expenditure criteria (capex criteria) set out in the NER.25 The capex criteria relate to the efficient costs incurred by a prudent operator in light of realistic demand forecasts and cost inputs. We must have regard to the capex factors in the NER when making that decision.26
4.1 How do we assess capex expenditureOur approach is to compare the service provider's total capex forecast with an alternative estimate that we are satisfied reasonably reflects the capex criteria. Having established our alternative estimate of the total forecast capex, we can test the service provider's proposed total forecast capex. This includes comparing our alternative estimate total with the service provider's proposal total. If there is a difference between the two, we may need to exercise our judgement as to what is a reasonable margin of difference.
If we are satisfied that the service provider's proposal reasonably reflects the capex criteria, we accept it. If we are not satisfied, the rules require us to put in place a substitute estimate which we are satisfied reasonably reflects the capex criteria taking into account the capex factors.27 Where we have done this, our substitute estimate is based on our alternative estimate.
We assess forecast capex proposals through a combination of top down and bottom up assessments. Our focus is typically on determining the prudent and efficient level of forecast capex. We will generally assess forecast capex through assessing: the need for the expenditure; and the efficiency of the proposed projects and related expenditure to meet any justified expenditure need. This is likely to include consideration of the timing, scope, scale and level of expenditure associated with proposed projects. Where businesses do not provide sufficient economic justification for their proposed expenditure, we will determine what we consider to be the efficient and prudent level of forecast capex. In assessing forecasts and determining what we consider to be efficient and prudent forecasts we may use a variety of analysis techniques to reach our views.
Our assessment approaches for capex and opex differ. We use revealed costs for opex to a greater extent than for capex because we consider opex is largely recurrent. Past actual expenditure may not be an appropriate starting point for capex given it is largely non-recurrent or 'lumpy', and so past expenditures or work volumes may not be indicative of
25 NER, cl.6A.6.7(c).26 NER, cl.6A.6.7(e).27 NER, cl.6A.12.2(b)(4).
Murraylink electricity transmission revenue proposal 2018–23 | Issues Paper15
future volumes. Further, TNSPs will tend to propose smaller volumes of large, high cost projects which we may need to consider on a case by case basis.
The assessment techniques that we may adopt to assess Murraylink' forecasts of total capex are outlined in our expenditure forecast assessment guideline.28
4.2 Murraylink's capex proposalMurraylink has proposed forecast capex of $33.8 million ($2018) over the forthcoming regulatory period. This represents an average increase of approximately 101 per cent compared to actual and expected expenditure over the current period.29
Murraylink submitted that the proposed capex forecast is related to network capex for replacement and refurbishment. A significant part of the forecast ($27.2 million or 80 per cent) is for replacement of the control system. Murraylink’s capex forecast does not include any expenditure for augmentation of the network or non-system components.30
Murraylink has proposed a contingent project which it submits would be capable of addressing the capacity constraints in the regional transmission networks as well as providing increased South Australian interconnection capacity. In particular, Murraylink proposed three staged projects with a total cost of $994 million ($2018). As a contingent project, this expenditure has not been included in the ex-ante capex forecast. Rather, as submitted by Murraylink, this project will be subject to:
the successful completion of a RIT-T consultation, which includes a cost benefit analysis that justifies any one or more than one stage of the contingent project; and
financial commitment by Energy Infrastructure Investments.
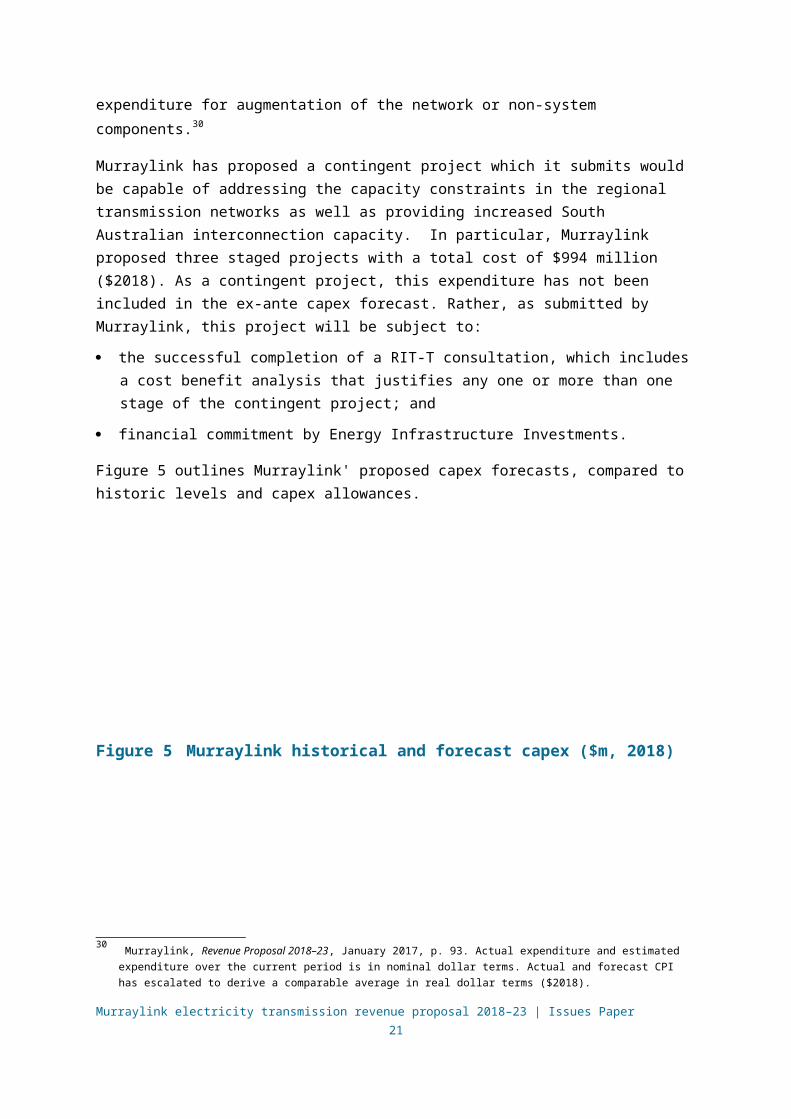
Figure 5 outlines Murraylink' proposed capex forecasts, compared to historic levels and capex allowances.
Figure 5 Murraylink historical and forecast capex ($m, 2018)
28 AER, Expenditure Forecast Electricity Distribution Guideline, November 2013. 29 Murraylink, Revenue Proposal 2018–23, January 2017, pp. 19 and 93.30 Murraylink, Revenue Proposal 2018–23, January 2017, p. 93. Actual expenditure and estimated expenditure over the
current period is in nominal dollar terms. Actual and forecast CPI has escalated to derive a comparable average in real dollar terms ($2018).
Murraylink electricity transmission revenue proposal 2018–23 | Issues Paper16

Source: AER, Murraylink roll forward models; AER, Final decision PTRM for Murraylink 2013-18, 30 April 2013; Murraylink, Revenue Proposal 2018–23, January 2017; AER analysis.
4.3 Key drivers of the capital expenditure proposalThe key driver of Murraylink's capital expenditure forecast is the proposal to upgrade the control and protection systems required to operate the interconnector. Although not included in the proposed capital expenditure forecast, Murraylink also proposed a significant contingent project to address capacity constraints in the regional transmission networks and increased South Australian interconnection capacity networks.
Control systems replacement
Murraylink submitted that the control and protection systems have been in service for just under 15 years and:
the manufacturer ABB will no longer support the system from 2021
components are failing with increasing frequency and spares have been difficult to source.31
In response to the increasing obsolescence and the withdrawal of support, Murraylink submits that in order to avoid increasing outage frequency and downtime, they will need to spend $27.2 million ($2018) to replace the superseded system.
Contingent project for capacity upgrades
Murraylink states that:
APA has developed a conceptual proposal with three stages, which would be capable of addressing the capacity constraints in the regional transmission networks as well as providing increased South Australian interconnection capacity.32
31 Murraylink, Revenue Proposal 2018–23, January 2017, p. 91.32 Murraylink, Revenue Proposal 2018–23, January 2017, p. 94.
Murraylink electricity transmission revenue proposal 2018–23 | Issues Paper17

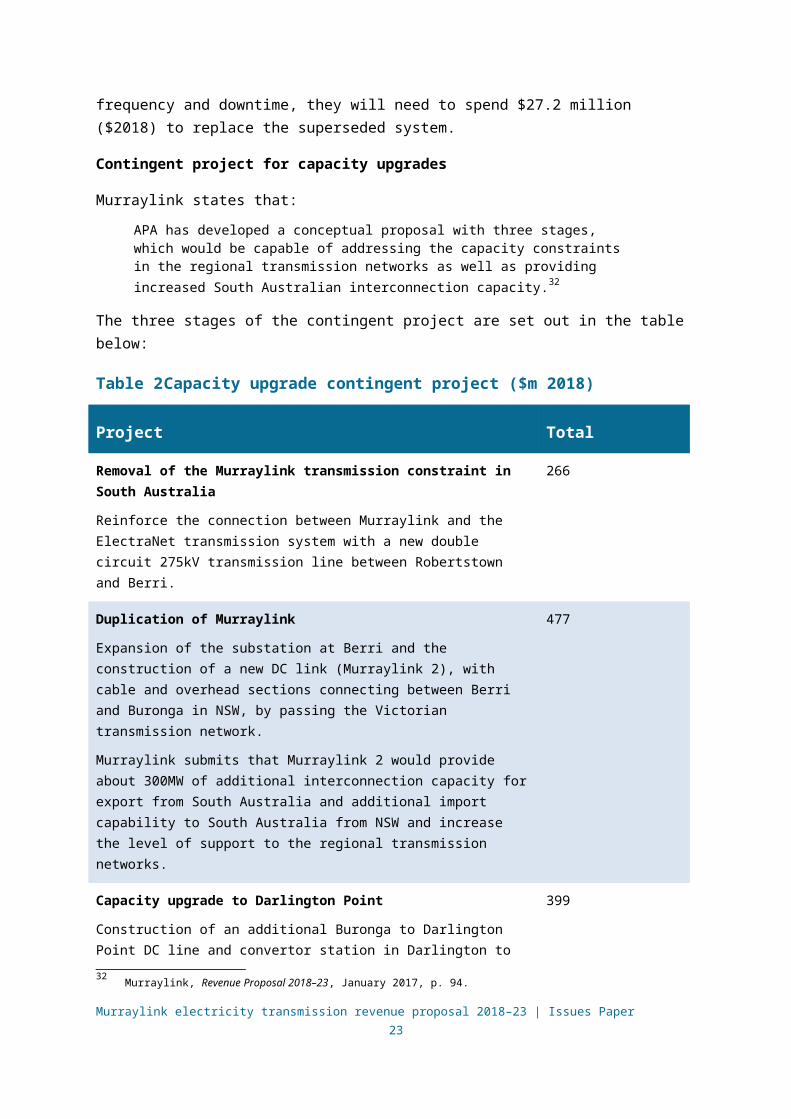
The three stages of the contingent project are set out in the table below:
Table 2 Capacity upgrade contingent project ($m 2018)
Project Total
Removal of the Murraylink transmission constraint in South Australia
Reinforce the connection between Murraylink and the ElectraNet transmission system with a new double circuit 275kV transmission line between Robertstown and Berri.
266
Duplication of Murraylink
Expansion of the substation at Berri and the construction of a new DC link (Murraylink 2), with cable and overhead sections connecting between Berri and Buronga in NSW, by passing the Victorian transmission network.
Murraylink submits that Murraylink 2 would provide about 300MW of additional interconnection capacity for export from South Australia and additional import capability to South Australia from NSW and increase the level of support to the regional transmission networks.
477
Capacity upgrade to Darlington Point
Construction of an additional Buronga to Darlington Point DC line and convertor station in Darlington to address the limited capacity and losses in the existing 220kV line.
399
Total (if all three projects are undertaken) 994 (a)
Source: Murraylink, Regulatory Proposal 2018–23, January 2017, pp. 94–95, Murraylink - Attachment 1.1 - Murraylink - Regulatory Information Notice v2 - 20170131, tab 7.2 contingent projects
(a) There are two discrepancies in the numbers identified in Murraylink's regulatory proposal. (1) The total (if all three projects are undertaken) sourced from the Murraylink regulatory proposal and Regulatory Information Notice is not the sum of the projects represented in this table (266+477+399=1142) and (2) Murraylink state on page 94 of its regulatory proposal that the first stage of the contingent project would cost approximately $276 million, not $266 as set out in table 7.8 on page 95 of its regulatory proposal.
Murraylink has not provided any supporting information in its regulatory proposal, including in regard to the additional export and importing capabilities of the proposed Murraylink 2 upgrade which makes up around half the contingent project costs.
Murraylink submits that the contingent project should be triggered by the completion of a Regulatory Investment Test for Transmission (RIT-T) consultation and cost benefit analysis that justifies any one or more than one element of the contingent project and financial commitment by Energy Infrastructure Investments.33 However, no information has been provided to support the need for this contingent project and no specific trigger events for this project have been provided. In particular, further information will be required as the proposed
33 Murraylink, Revenue Proposal 2018–23, January 2017, pp. 95–96.
Murraylink electricity transmission revenue proposal 2018–23 | Issues Paper18
trigger for this contingent project does not identify any specific network limitations in the regional TNSPs or in relation to the Murraylink interconnector.
ElectraNet, the transmission network service provider in South Australia is exploring options for improved system security and capacity for South Australia and has commenced a RIT-T to assess the market benefits of a number of solutions identified and set out in its Project Specification Consultation Report (PSCR). 34 This includes the potential for a new high voltage electricity interconnector between South Australia and the eastern states.
ElectraNet has identified an upgrade to Murraylink as part of its potential option for an interconnector from mid north SA to NSW:
Augment existing Murraylink capacity (e.g. by adding a parallel HVDC link) and upgrade control systems to provide fast frequency response.35
The Murraylink option would need to demonstrate the highest positive net market benefit to be considered as the preferred option. As previously discussed Murraylink's proposes to replace the control systems. This raises the issue of whether Murraylink's replacement would accommodate the option under consideration or it would be prudent to defer or otherwise reconsider the extent of the replacement.
In addition, TransGrid, the transmission network service provider in New South Wales, has also proposed a number of contingent projects36 and there may be overlap with these and the contingent project proposed by Murraylink.
The above matters, in particular the potential overlap with processes being undertaken by ElectraNet and TransGrid will require further consideration before determining Murraylink's capex forecast and proposed contingent project.
34 ElectraNet, South Australian Energy Transformation, RIT–T; Project Specification Consultation Report, 7 November 201635 ElectraNet, South Australian Energy Transformation, RIT–T; Project Specification Consultation Report, 7 November 2016,
p. 35.36 TransGrid, Revenue Proposal 2018/19 – 2022/23, January 2017, p. 107.
Murraylink electricity transmission revenue proposal 2018–23 | Issues Paper19

5 Operating expenditure Opex refers to the operating, maintenance and other non-capital expenditure incurred in the provision of network services. It includes labour costs and other non-capital costs that a prudent service provider is likely to require for the efficient operation of its network.
Opex is one of the building blocks used to determine Murraylink's total revenue requirement.
5.1 How we assess operating expenditureOur role is to form a view about whether a business' forecast of total opex is reasonable. Specifically, we must form a view about whether a business' forecast of total opex 'reasonably reflects the opex criteria'.37 In doing so we must have regard to each of the opex factors specified in the NER.38
If we are satisfied the business' forecast reasonably reflects the criteria, we accept the forecast.39 If we are not satisfied, we substitute the business' forecast with an alternative estimate that we are satisfied reasonably reflects the opex criteria.40 In making this decision, we take into account the reasons for the difference between our alternative estimate and the business' proposal and materiality of the difference. Further, we consider interrelationships with the other building block components of our decision.41
After conducting an extensive consultation process with service providers, users, consumers and other stakeholders, we published the Expenditure forecast assessment guideline (the guideline) together with an explanatory statement in November 2013.42 The guideline sets out our intended approach to assessing opex in accordance with the NER.43 While the guideline provides greater regulatory predictability, transparency and consistency, it is not binding. If we depart from the approach set out in the guideline we must set out explicit reasons that warrant a departure.44
We apply the assessment approach outlined in the guideline to develop our estimate of the business' total opex requirements (our alternative estimate). Our alternative estimate serves two purposes. First, it provides a basis for assessing whether the business' proposal is reasonable. Second, it can be used as a substitute forecast if we determine the business' proposal does not reasonably reflect the opex criteria.
37 NER, cl. 6A.6.6(c). The opex criteria are (1) the efficient costs of achieving the operating expenditure objectives;(2) the costs that a prudent operator would require to achieve the operating expenditure objectives; and(3) a realistic expectation of the demand forecast and cost inputs required to achieve the operating expenditure objectives.
38 NER, cl. 6A.6.6(e).39 NER, cl. 6A.6.6(c).40 NER, cl. 6A.6.6(d), 6A.14.1(3)(ii).41 NEL, s.16(1)(c).42 AER, Expenditure Forecast Assessment Guideline for Electricity Transmission, November 2013.43 NER, cl. 6A.5.6.44 NER, cl. 6A.2.3(c).
Murraylink electricity transmission revenue proposal 2018–23 | Issues Paper20

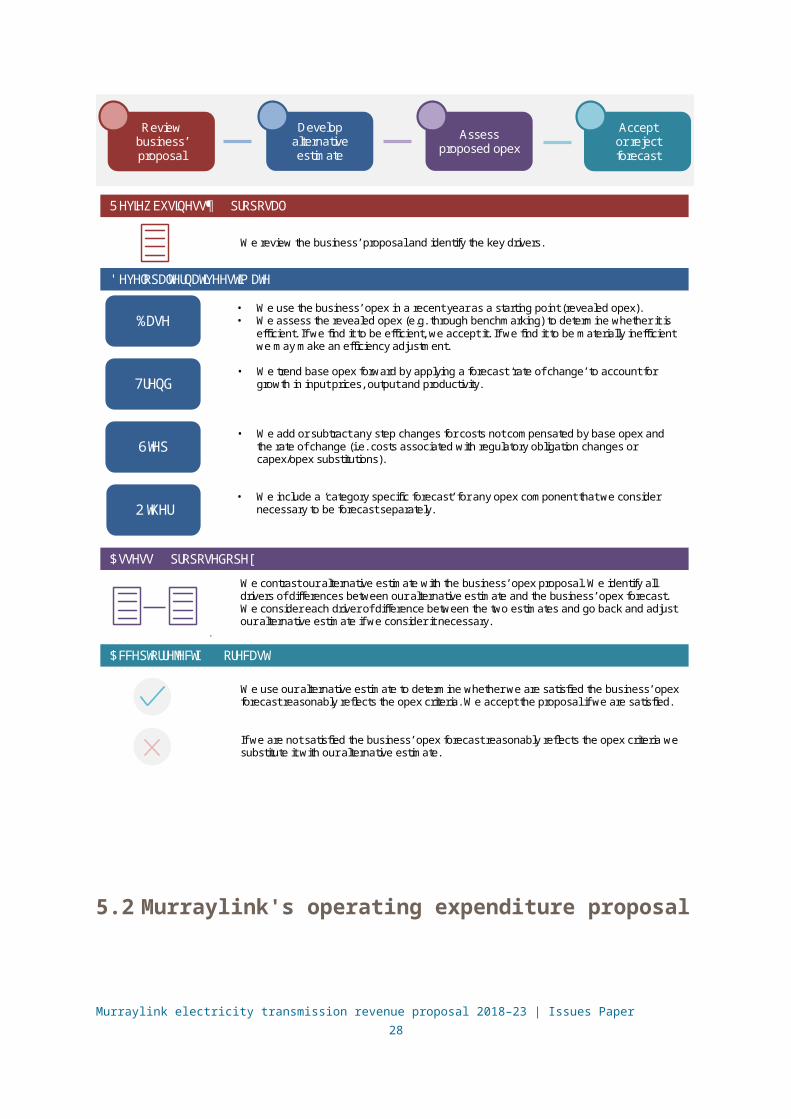
We apply the base-step-trend forecasting approach—a top-down model—to develop our alternative estimate. There are three broad stages to the base-step-trend approach as its name suggests, as summarised in Figure 6.
Figure 6: Our opex assessment approach
5 HYLHZEXVLQHVV¶ SURSRVDO
We review the business’ proposal and identify the key drivers.
' HYHORSDOWHUQDWLYHHVWLP DWH
%DVH • We use the business’ opex in a recent year as a starting point (revealed opex). • We assess the revealed opex (e.g. through benchmarking) to determine whether it is
efficient. If we find it to be efficient, we accept it. If we find it to be materially inefficient we may make an efficiency adjustment.
7UHQG • We trend base opex forward by applying a forecast ‘rate of change’ to account for
growth in input prices, output and productivity.
• We add or subtract any step changes for costs not compensated by base opex and the rate of change (i.e. costs associated with regulatory obligation changes or capex/opex substitutions).
6WHS
2 WKHU • We include a ‘category specific forecast’ for any opex component that we consider
necessary to be forecast separately.
We use our alternative estimate to determine whether we are satisfied the business’ opex forecast reasonably reflects the opex criteria. We accept the proposal if we are satisfied.
If we are not satisfied the business’ opex forecast reasonably reflects the opex criteria we substitute it with our alternative estimate.
$FFHSWRUUHMHFWI RUHFDVW
$VVHVV SURSRVHGRSH[
We contrast our alternative estimate with the business’ opex proposal. We identify all drivers of differences between our alternative estimate and the business’ opex forecast. We consider each driver of difference between the two estimates and go back and adjust our alternative estimate if we consider it necessary.
Develop alternative estimate
Assess
proposed opex
Accept or reject forecast
Review
business’ proposal
Murraylink electricity transmission revenue proposal 2018–23 | Issues Paper21

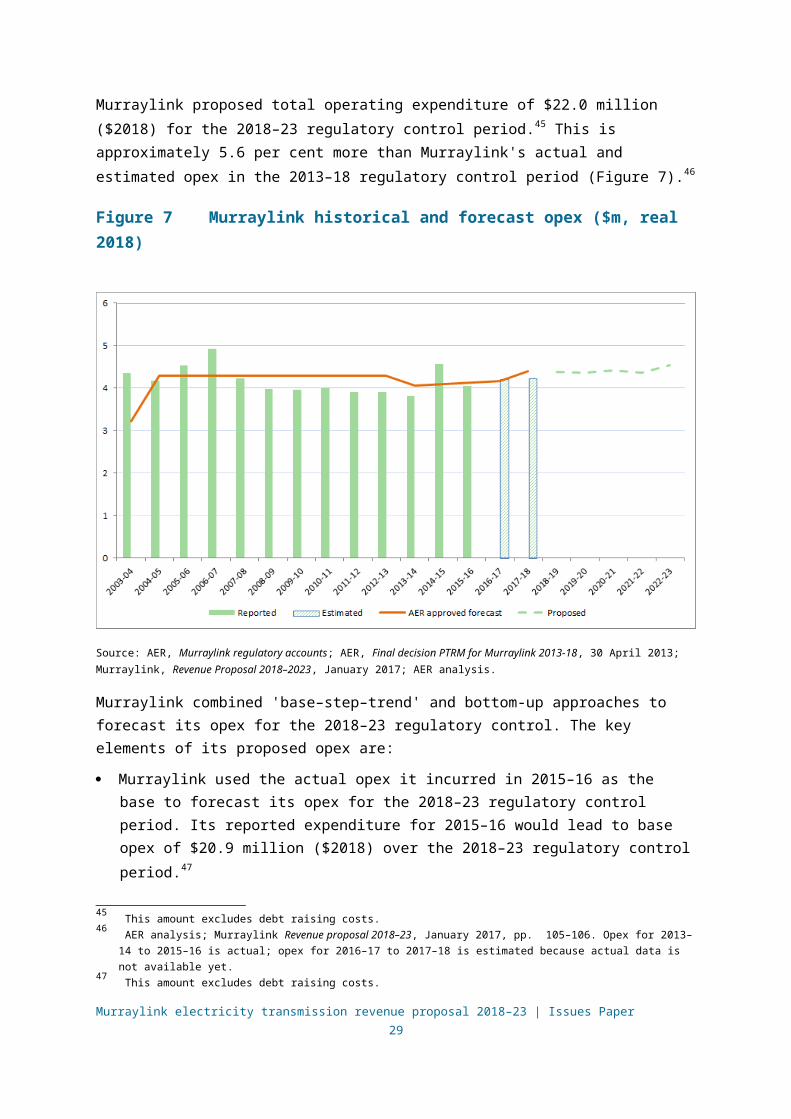
5.2 Murraylink's operating expenditure proposalMurraylink proposed total operating expenditure of $22.0 million ($2018) for the 2018–23 regulatory control period.45 This is approximately 5.6 per cent more than Murraylink's actual and estimated opex in the 2013–18 regulatory control period (Figure 7).46
Figure 7 Murraylink historical and forecast opex ($m, real 2018)
Source: AER, Murraylink regulatory accounts; AER, Final decision PTRM for Murraylink 2013-18, 30 April 2013; Murraylink, Revenue Proposal 2018–2023, January 2017; AER analysis.
Murraylink combined 'base–step–trend' and bottom-up approaches to forecast its opex for the 2018–23 regulatory control. The key elements of its proposed opex are:
Murraylink used the actual opex it incurred in 2015–16 as the base to forecast its opex for the 2018–23 regulatory control period. Its reported expenditure for 2015–16 would lead to base opex of $20.9 million ($2018) over the 2018–23 regulatory control period.47
Murraylink proposed zero real price growth, output growth and productivity growth.
Murraylink proposed one step change of $0.17 million ($2018) for each year of the regulatory control period. This increased its total opex forecast by $0.9 million ($2018).
Murraylink proposed category specific forecasts of $0.2 million ($2018) over the 2018–23 regulatory control period for non–recurrent activities that, it considered, are required to keep the network operating.48 Murraylink stated that the basis for the forecast frequency
45 This amount excludes debt raising costs.46 AER analysis; Murraylink Revenue proposal 2018–23, January 2017, pp. 105–106. Opex for 2013–14 to 2015–16 is
actual; opex for 2016–17 to 2017–18 is estimated because actual data is not available yet.47 This amount excludes debt raising costs.48 Murraylink, Revenue Proposal 2018–23, January 2017, p. 103–105.
Murraylink electricity transmission revenue proposal 2018–23 | Issues Paper22

for each of these projects is based on manufacturer’s recommendations or Murraylink’s experience with assets of that type. Although Murraylink's category specific forecasts are inconsistent with our ‘base-step-trend’ approach, we take into account the materiality of the bottom-up forecasts and the size of its base opex. We have not raised this as a key issue.
This resulted in total opex forecast of $22.0 million ($2018) for the 2018–23 regulatory control period.
Murraylink also included debt raising costs of $0.04 million ($2018) in its proposed PTRM.49 It stated that it adopted our method to forecast debt raising costs.50
5.2.1 Key opex issue
An issue in our assessment of Murraylink's opex proposal is a step change for it to enter into a service agreement with the manufacturer of the systems used by Murraylink.
While we welcome any feedback on Murraylink's proposed opex forecast, we will specially consider this issue in making our draft decision, so it is helpful for stakeholders to engage with us on this matter. That said, we note Murraylink has made substantial confidentiality claims around this part of its proposal, which reduces stakeholders' ability to understand and assess the substance of the issue.
Our guideline approach is to apply step changes for any costs not captured in base opex or the rate of change that are required for forecast opex to meet the opex criteria.51 These costs would form part of base opex in future resets and they are subject to the EBSS.
Our starting position is that only exceptional events are likely to require explicit compensation as step changes, as stated in our guideline.52 Two typical examples of 'events' that may require explicit compensation are:
a material change in the business' regulatory obligations
an efficient and prudent capex/opex substitution opportunity.
In the absence of a change to regulatory obligations or legitimate capex/opex trade-off opportunity, our guideline approach is to only accept a step change under limited circumstances. We would likely consider whether the costs associated with the step change are unavoidable and material—such that base opex, trended forward by the forecast rate of change, would be insufficient for the business to recover its efficient and prudent costs.
A network business may experience fluctuations in particular categories of opex and the composition of its opex may vary from year-to-year. There are generally some offsetting effects of these variations and to the extent the opex categories do not offset each other, we expect the network business would continually re-prioritise its work program. Therefore, total
49 Murraylink, Revenue Proposal 2018–23, Attachment 10.1 Murraylink PTRM sheet 'PTRM inputs', cells G394-K394.50 Murraylink, Revenue Proposal 2018–23, Attachment 10.1 Murraylink PTRM sheet 'PTRM inputs', cell F441. For more
details, see: AER, Final decision: Amadeus Gas Pipeline Access Arrangement 2016 to 2021 Attachment 3 – Rate of return, May 2016, p. 3–358–359.
51 AER, Expenditure Forecast Assessment Guideline for Electricity Transmission, November 2013, p.24.52 AER, Expenditure Forecast Assessment Guideline for Electricity Transmission, November 2013, p.24.
Murraylink electricity transmission revenue proposal 2018–23 | Issues Paper23
opex is relatively stable. We base our opex forecast on the network business' total opex, and not the specific costs it has identified in the forecast period. Once total revenue is set, it is for the network business to decide what opex projects are required to service its customers while meeting its regulatory obligations.
Murraylink proposed a single step change of $0.9 million ($2018).53 Murraylink is proposing to enter into a service agreement with the manufacturer of the systems used by Murraylink. It claimed confidentiality over this component of its proposed opex.54
Based on the limited information provided by Murraylink, the identified new costs associated with the service agreement does not relate to a change in regulatory obligations or a capex/opex substitution opportunity.
In making our draft decision, we will consider whether:
circumstances identified by Murraylink—that is, entering into a service agreement—should require explicit funding as a step change
the additional $0.9 million spending is unavoidable or discretionary
base opex and rate of change opex forecast components, and any efficiency gains derived from this opex activity, are sufficient for Murraylink to fund the costs associated with the service agreement
proposed costs associated with the service agreement prudent and efficient.
53 Murraylink, Revenue Proposal 2018–23- Attachment 8.1 - Murraylink - Forecast Operating Expenditure Model, January 2017.
54 Murraylink, Revenue Proposal 2018–23, January 2017, p. 103.
Murraylink electricity transmission revenue proposal 2018–23 | Issues Paper24

6 Rate of returnThe rate of return is the return that we allow Murraylink to earn on its investments. Significant investment is required to sustain a transmission network. To provide the owners of transmission networks with an incentive to invest in their networks we must provide them with an appropriate return on their investments. If this rate is too low, there is a risk that they will underinvest. Conversely, if the return is too high, there is a risk of overinvestment.
We published our Rate of Return guideline in December 2013.55 It sets out the method we propose to use to estimate the allowed rate of return for electricity and gas network businesses. The Rate of Return guideline is not binding, but if a business seeks to depart from this, the business must include reasons in its proposal for doing so. Also, if we seek to depart from its guideline when making our draft or final decision, we must also include reasons for doing so.
Transmission networks must submit their regulatory proposals 15 months in advance of our final decisions. This means that financial information that is relevant to determining the rate of return may not be available at the time that they submit their proposals. As such, transmission networks often submit a method for determining certain WACC parameters once data is available.
6.1 How we calculate the rate of returnTo estimate the rate of return, we consider the cost of the two sources of funds for investments – equity and debt. The return on equity is the return shareholders of the business require to attract new investment. The return on debt is the interest rate the business pays when it borrows money to invest. We consider that efficient transmission network businesses would fund their investments by borrowing 60 per cent of the required funds, while raising the remaining 40 per cent from equity.
For both the return on debt and return on equity, we estimate the efficient financing costs of a benchmark efficient entity, rather than the actual financing costs or circumstances of the service provider to which a determination relates.
Below we set out how we estimate the return on debt and the return on equity and the value of imputation credits.
6.1.1 Return on equity
We apply the 'foundation model' approach to estimate the return on equity as set out in the guideline and applied in regulatory determinations for NSW network businesses. This approach has been considered and upheld by the Australian Competition Tribunal (Tribunal).56
55 The rate of return guideline is available on our website, here: https://www.aer.gov.au/networks-pipelines/guidelines-schemes-models-reviews/rate-of-return-guideline
56 Australian Competition Tribunal, Applications by Public Interest Advocacy Centre Ltd and Ausgrid [2016] ACompT 1, 26. February 2016
Murraylink electricity transmission revenue proposal 2018–23 | Issues Paper25
Our starting point is the Sharpe Linter Capital Asset Pricing model (SL CAPM)—our ‘foundation model.’ We use the SL CAPM because it is widely accepted and is the current standard asset pricing model of modern finance, both in theory and practice.
In applying the SLCAPM, the return on equity for a network business depends on the returns on a risk-free asset (the risk free rate), the returns to the broader market (the MRP) and the extent to which returns to equity for network businesses vary with market conditions in general (the equity beta).
The risk free rate is determined by observing the return on ten-year Commonwealth Government Securities over a short period close to the start of the next regulatory period.
We consider information from a range of relevant evidence when estimating the MRP and equity beta. We assign a role to each piece of evidence based on an assessment of their relative merits and suitability for our regulatory task. And we select point estimates of the MRP and equity beta having regard to the role assigned to each piece of evidence. In recent determinations, we have estimated the equity beta and MRP to be 0.7 and 6.5 per cent respectively.
We then cross-check the resulting estimates against those from other relevant sources of relevant information to inform the reasonableness of the foundation model return on equity estimate. In recent determinations, we have cross-checked at the equity risk premium level (that is, multiplying the equity beta by the MRP).
6.1.2 Return on debt
The return on debt is the interest rate the network business pays when it borrows money to invest. When lending money, investors require a risk premium which differs depending on how risky they perceive the borrower to be. To estimate the risk premium of Australian Energy Networks we use the yields on Australian 10-year broad BBB-rated corporate bonds. We measure this as the mid-point of RBA and Bloomberg estimates of the yield on Australian 10-year broad BBB-rated bonds.
Our approach to the return on debt is to consider the average interest rate that a network business would face if it raised debt annually in ten equal parcels. This is referred to as the trailing average portfolio approach. This approach assumes that every year, one-tenth of the debt of a network business is re-financed. As the return on debt is an average of the interest rates over a period of ten years, this approach leads to a relatively stable estimate over time.
This method for estimating the return on debt differs to the approach that we applied prior to publishing our rate of return guideline. Previously we applied an "on-the-day" estimate of the return on debt based on prevailing interest rates around the start of the regulatory period. To implement the new approach, we are transitioning the benchmark business gradually. We start the transition by setting the return on debt allowance in a way similar to the previous regime. From there we update the regulatory allowance every year until it is reflective of the debt financing costs of a benchmark business that refinances one-tenth of its debt portfolio annually.
6.2 Murraylink's proposed overall rate of returnMurraylink electricity transmission revenue proposal 2018–23 | Issues Paper
26

Murraylink has proposed a rate of return of 6.54 per cent. This is made up of
8.6 per cent return on equity calculated using;
o A (placeholder) risk free rate of 2.82 per cent
o A beta of 0.8; and
o A (placeholder) market risk premium of 7.18 per cent
A (placeholder) 5.16 per cent return on debt; and
60 per cent gearing.57
Murraylink has proposed to calculate the risk free rate using the yield on 10-year Commonwealth Government Securities. This aligns with our guideline approach. Murraylink has used a placeholder risk free rate of 2.82 per cent which will be updated closer to our final decision.
Murraylink has departed from our estimates of the beta, market risk premium and return on debt in recent determinations.
6.3 Key rate of return issues
6.3.1 Return on equity
Murraylink has proposed an equity beta of 0.8. This is higher than our most recent decisions on beta of 0.7. Murraylink has proposed a higher beta for the following reasons:
In our previous determination for Murraylink we applied a beta of 0.8.58
Ordinary least squares estimation of beta using updated data undertaken by Frontier Economics indicate that beta has risen.59
Murraylink has also proposed a higher market risk premium than we have applied in our recent determinations. Murraylink has estimated the market risk premium to be the difference between two separately estimated parameters: the risk free rate and the return on a fully diversified market portfolio (the market portfolio). Murraylink used the long term average historical return on the market as the market portfolio. This differs from our rate of return guideline and approach in recent determinations where we have estimated the market risk premium as a single variable using well accepted analytical techniques. Murraylink justifies this approach by noting that in finance theory the market risk premium is the difference between the risk free rate and return on the market portfolio.60
Murraylink has proposed a return on the market portfolio of 10 per cent which is based upon a number of estimates of the return on the market portfolio.61 This yields a (placeholder) market risk premium of 7.18, which is higher than our recent estimate of 6.5 per cent.
57 Note: Murraylink has proposed a method for forecasting the WACC which yields this value at the time of submission. However, as per usual practice, these values will be revised using updated data.
58 Murraylink, Revenue Proposal 2018–23, January 2017, pp. 33 and 38.59 Murraylink ,Revenue Proposal 2018–23, January 2017, pp. 36–37.60 Murraylink, Revenue Proposal 2018–23, January 2017, pp. 46–53.61 Murraylink, Revenue Proposal 2018–23, January 2017, pp. 54–56.
Murraylink electricity transmission revenue proposal 2018–23 | Issues Paper27
Murraylink also notes that other recent estimates of the market risk premium which are higher than the AER's including an estimate of 7.4 per cent made by the Economic Regulatory Authority of Western Australia.62
Question
What are stakeholder views on Murraylink's approach to forecasting the return on equity?
6.3.2 Return on debt
Murraylink has estimated the cost of debt using an equally weighted average cost of debt for fixed rate debt raised in each of the last 10 years (including the current year). For this, Murraylink has used the yields on the BBB rated debt of non-financial corporations, published by the Reserve Bank of Australia (RBA), extrapolated to maturities of 10 years.63
This approach differs from our guideline approach in two key respects:
1. Murraylink has not proposed to apply the AER's transition from the 'on-the-day' estimate. Murraylink argues that the efficient financing costs must be assessed with reference to its own financing practices. Because Murraylink does not have a debt portfolio to unwind it argues that the AER's transition approach should not apply to it.64
2. Murraylink has estimated a historical trailing average solely using RBA data (and has not used Bloomberg data).65 In contrast, because of our approach to transition, we commence the regulatory period with an 'on the day' rate and do not need to estimate a historical trailing average. Murraylink then proposes to adopt a simple average of Bloomberg and RBA curves for 2017–18 onwards, as per our approach.66
Murraylink made its estimate of the return on debt guided by the Tribunal’s February 2016 decisions in response to the applications from the New South Wales service providers. That guidance was not, in Murraylink’s view, especially clear.67 We have sought judicial review of the Tribunal’s decisions.
Murraylink has stated that it will review its estimation of the return on debt in its response to the AER’s draft decision. This is on its expectation that the Full Federal Court will have made its decision and we will have taken it into account in our draft decision.68
Question
What are stakeholder views on Murraylink's approach to forecasting the return on debt?
62 Murraylink, Revenue Proposal 2018–23, January 2017, pp. 43–45.63 Murraylink, Revenue Proposal 2018–23, January 2017, pp. 72–73.64 Murraylink, Revenue Proposal 2018–23, January 2017, p. 71.65 Murraylink, Revenue Proposal 2018–23, January 2017, pp. 72–74.66 Murraylink, Revenue Proposal 2018–23, January 2017, p. 75.67 Murraylink, Revenue Proposal 2018–23, January 2017, p. 74.68 Murraylink, Revenue Proposal 2018–23, January 2017, p. 74.
Murraylink electricity transmission revenue proposal 2018–23 | Issues Paper28
7 Value of imputation creditsIn the building block model, we make an allowance for the estimated tax paid by the benchmark firm. In Australia companies typically pay tax at the rate of 30 per cent on their profit. However, under the Australian taxation system, investors can receive an 'imputation credit' for income tax paid at the company level. For investors that meet certain eligibility criteria, this credit can be used to offset their tax liabilities. If the amount of imputation credits received exceeds an investor’s tax liability, that investor can receive a cash refund for the balance. Imputation credits are a benefit to investors in addition to any cash dividend or capital gains from owning shares.
The NER recognises that a service provider's allowed revenue does not need to include the value of imputation credits. Under the NER, service providers are able to recover revenue that compensates them for their efficient costs in providing regulated services. This includes, among other things, a return to be provided to investors (return on equity) that is required to promote efficient levels of investment. The more that imputation credits are valuable, the less return that investors require from dividends and capital gains. We adjust the revenue granted to a service provider to cover its expected tax liability to account for imputation credits.
7.1.1 How we have calculated the value of imputation credits
The rate of return guideline proposes that the value of imputation credits would be estimated as a market-wide parameter, rather than estimating this on an industry or business specific basis. Under the guideline, it would be determined as the product of:
a distribution rate (referred to in our guideline as the 'payout ratio'), which represents the proportion of imputation credits generated by the benchmark entity that is distributed to investors
a utilisation rate, which is the extent to which investors can use the imputation credits they receive to reduce their tax or to get a refund.
In the guideline, our assessment of this evidence produced an estimate of 0.7 for the utilisation rate and 0.7 for the distribution rate. The guideline therefore proposed an estimate of 0.5. However, in the recent determinations we re-examined the evidence and clarified our understanding of the utilisation rate as the utilisation value to investors in the market per dollar of imputation credits distributed. This re-examination, in addition to new evidence and advice considered since the guideline, led us to depart from the 0.5 value of imputation credits we proposed in the guideline. Instead, we chose a value for imputation credits of 0.4 from within a range of 0.3 to 0.5.
7.2 Murraylink's proposed value of imputation creditsMurraylink has proposed a value of imputation credits of 0.25. This being the product of a distribution rate of 0.7 (derived using all equity - Australian Tax Office (ATO) Franking Account Balance (FAB) data) and a theta of 0.35 (based on a SFG consulting dividend drop off study). Murraylink submits that successive Tribunal decisions have determined that
Murraylink electricity transmission revenue proposal 2018–23 | Issues Paper29

gamma should be 0.25. Only the SAPN Tribunal decision has supported the gamma estimate of 0.4.69
Our recent decisions on the value of imputation credits have been the focus of reviews of our decisions at the Tribunal and Full Federal Court. A number of these decisions are currently reserved. Subject to our required decision making timeframes and processes under the NER, we will consider any Tribunal or Federal Court decisions on the value of imputation credits handed down in making our future decisions on the value of imputation credits. The outcomes of these legal cases may affect our future decisions on the value of imputation credits.
Question
Do you agree with Murraylink's proposal to use a gamma value of 0.25 in valuing imputation credits?
69 ACT 11 of 2015 / [2016] ACompT 11.
Murraylink electricity transmission revenue proposal 2018–23 | Issues Paper30
8 Consumer engagement This section summarises the consumer engagement strategies and activities described by Murraylink in its revenue proposal. We consider this is a valuable resource for readers to get a sense of Murraylink’s consumer engagement approaches. When assessing the revenue proposal we will have regard to how a business engaged with its consumers and accounted for their long term interests.
8.1 Consumer engagement in the NERUnder the NER, consumer engagement is a factor we can consider when making our revenue determinations.70 We will examine whether and how well a transmission business considered and responded to consumer views, equipped consumers to participate in consultation, made issues tangible and obtained a cross-section of views. We will make our assessment on a case-by-case basis, considering whether it would have been reasonable to engage on a particular issue. We will monitor consumer engagement activities through our consumer challenge panel and by our ongoing engagement with stakeholders. We may publicly comment on any shortcomings in a businesses' consumer engagement that we identify from a regulatory proposal.
Our obligation to have regard to the extent to which a transmission business' forecast includes expenditure to address the concerns of consumers forms part of our overall task of determining whether the transmission business' proposed forecasts reasonably reflect the efficient and prudent costs of achieving the capex (or opex) objectives.71 Therefore, if proposed expenditure is not required to achieve one or more of the capex (or opex) objectives, even with evidence of consumer support we will not be satisfied that the proposed expenditure reasonably reflects the capex and opex criteria.
Furthermore, the extent to which the proposed forecasts include expenditure to address the concerns of consumers during the course of its engagement with consumers is only one of nine or more factors that we must have regard to in determining whether we are satisfied that the proposed capex (or opex) reasonably reflects the capex (or opex) criteria.72 In this sense, the factor relating to consumer engagement alone is not determinative.73
If a transmission business submits that particular expenditure programs will address the concerns of consumers identified through its consumer engagement, we will consider whether such claims are supported by solid evidence of the preferences of affected consumers. This may include consideration of whether the engagement was sufficient to identify key areas of consumer concern, whether consumers have been adequately informed of relevant price implications, and how the expenditure proposed would address those customer concerns.
8.2 Our consumer engagement guideline70 NER, cl. 6A.6.6(e)(5A), cl. 6A.6.7(e)(5A).71 NER, cl. 6A.6.6(e)(5A).72 NER, cl. 6A.6.6(e)(5A).73 NER, cl. 6A.6.6(e)(5A).
Murraylink electricity transmission revenue proposal 2018–23 | Issues Paper31
Our consumer engagement guideline sets out a framework for electricity and gas network service providers to better engage with consumers. It aims to help the businesses develop strategies to engage systematically, consistently and strategically with consumers on issues that are significant to both parties. The guideline sets out our expectations when considering service provider consumer engagement activities:
Priorities—we expect service providers to identify consumer cohorts, and the current views of those cohorts and their service provider; outline their engagement objectives; and discuss the processes to best achieve those objectives.
Delivery—we expect service providers to address the identified priorities via robust and thorough consumer engagement.
Results—we expect service providers to articulate the outcomes of their consumer engagement processes and how they measure the success of those processes reporting back to us, their business and consumers.
Evaluation and review—we expect service providers to periodically evaluate and review the effectiveness of their consumer engagement processes.
8.3 Murraylink’s consumer engagement strategyMurraylink submitted that it has no directly connected customers and only engages with AEMO, ElectraNet and AusNet Services, who have a stake in the way Murraylink manages the network.74 Although Murraylink states that it's keen to engage with customers and their representatives, we are not aware of any consumer engagement undertaken by Murraylink prior to submitting its regulatory proposal. Murraylink views our revenue determination process as the means to undertake stakeholder engagement.75
Murraylink is a regulated transmission network service provider and the costs of the interconnector are ultimately borne by customers in Victoria and South Australia. Murraylink bills ElectraNet and AEMO as the ‘coordinating network service providers’ in the South Australian and Victorian regions, respectively. The role of the coordinating network service provider is to collect the revenue of all TNSPs operating in their region. They then distribute Murraylink’s share back to it. The regulated tariffs charged by ElectraNet and AEMO fully recover Murraylink’s regulated revenues. The revenue split between regions is set out in the pricing methodologies we approve. Murraylink gets 45% of its revenue on the South Australia side (via ElectraNet) and 55% on the Victorian side (via AEMO).76
Customers in Victoria and South Australia are relevant stakeholders. As such, consumer cohorts should have been identified and engagement activity undertaken before submission of Murraylink's regulatory proposal. We consider that Murraylink should be doing more consumer engagement, consistent with our consumer engagement guideline and not simply leaving this to the regulatory determination process.
74 Murraylink, Regulatory Proposal 2018–23, January 2017, pp. 10–11.75 Murraylink, Regulatory Proposal 2018–23, January 2017, pp. 10–11.76 Murraylink pricing methodology - Effective July 2013 to June 2023, May 2012, p. 3. (see;
http://www.aer.gov.au/system/files/Murraylink%20-%20Proposed%20Pricing%20Methodology%20-%20May%202012.pdf)
Murraylink electricity transmission revenue proposal 2018–23 | Issues Paper32