Embed Size (px)
DESCRIPTION
Introduction. Air Quality Index (AQI). AQI helps in understanding the level at which air is polluted and the associated health effects that might concern. - PowerPoint PPT Presentation
Citation preview

Introduction

Air Quality Index (AQI)
• AQI helps in understanding the level at which air is polluted and the associated health effects that might concern.
• EPA calculates the AQI for five major air pollutants : ground-level ozone, particulate matter, carbon monoxide, sulfur dioxide, and nitrogen dioxide.
• For each of these pollutants, EPA has established national air quality standards to protect public health.
• The EPA has developed the pollutant standard index (PSI) for introducing consistency in providing information regarding the air quality throughout the US. The system is based on a scale of 0-500.
Air Quality Index (AQI)
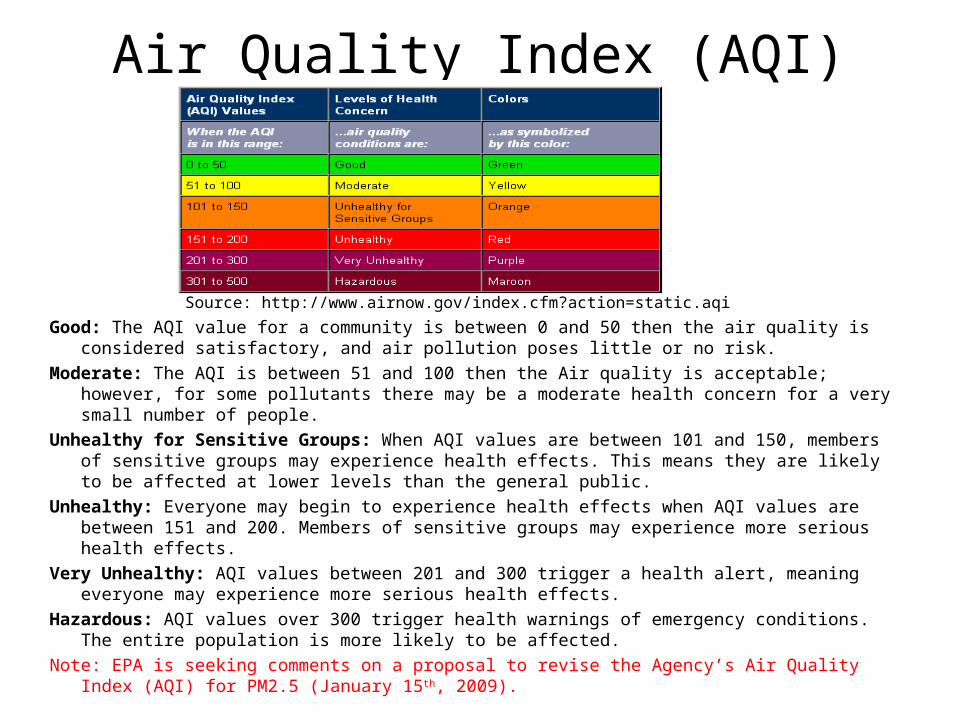
Good: The AQI value for a community is between 0 and 50 then the air quality is considered satisfactory, and air pollution poses little or no risk.
Moderate: The AQI is between 51 and 100 then the Air quality is acceptable; however, for some pollutants there may be a moderate health concern for a very small number of people.
Unhealthy for Sensitive Groups: When AQI values are between 101 and 150, members of sensitive groups may experience health effects. This means they are likely to be affected at lower levels than the general public.
Unhealthy: Everyone may begin to experience health effects when AQI values are between 151 and 200. Members of sensitive groups may experience more serious health effects.
Very Unhealthy: AQI values between 201 and 300 trigger a health alert, meaning everyone may experience more serious health effects.
Hazardous: AQI values over 300 trigger health warnings of emergency conditions. The entire population is more likely to be affected.
Note: EPA is seeking comments on a proposal to revise the Agency’s Air Quality Index (AQI) for PM2.5 (January 15th, 2009).
Source: http://www.airnow.gov/index.cfm?action=static.aqi
Air Quality Standards
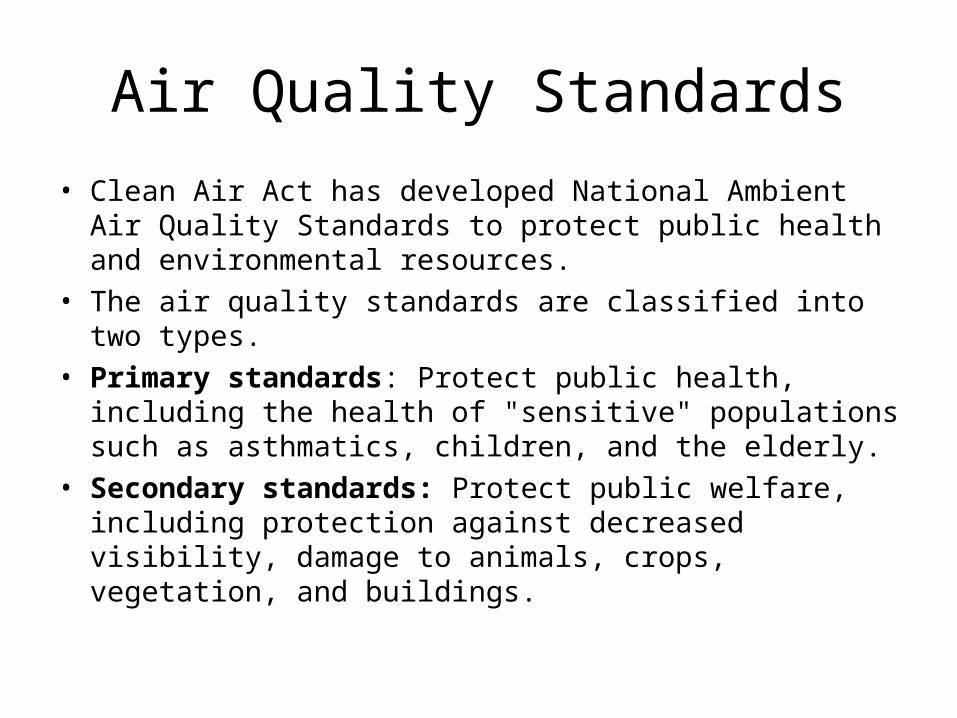
• Clean Air Act has developed National Ambient Air Quality Standards to protect public health and environmental resources.
• The air quality standards are classified into two types. • Primary standards: Protect public health, including the health
of "sensitive" populations such as asthmatics, children, and the elderly.
• Secondary standards: Protect public welfare, including protection against decreased visibility, damage to animals, crops, vegetation, and buildings.

National Ambient Air Quality Standards
(Source: USEPA, January, 2010)

Ozone NAAQS Revisions
• On Jan. 6, 2010, EPA proposed to further lower the 8-hour primary ozone standard from .075 ppm, set in 2008, to a level within the range of .060 - .070 ppm to protect public health.
• EPA is also proposing a new cumulative, seasonal secondary
standard, to protect sensitive vegetation and ecosystems, within the range of 7-15 ppm-hours.
• Likely to issue final standards by Aug. 31, 2010.

SO2 NAAQS Revisions • On December 8, 2009, EPA proposed to revise the primary SO2
standard to a level between 50 and 100 parts per billion (ppb) measured over 1-hour. This proposed primary NAAQS is based on a three-year average of the annual 99th percentile (or 4th highest) of 1-hour daily maximum concentrations.
• EPA is also taking comment on both revoking the current 24-hour and annual primary SO2 standards (because it anticipates that the new proposed 1-hour standard would better protect public health) as well as maintaining the current 24-hour and annual standards.
• The proposed changes would not impact the SO2 secondary 3-hour standard.
• EPA plans to issue a final rule by June 2010.
Air Quality Regions
• Any region within a state is designated as either attainment or nonattainment area.
• Attainment area is the region where the air quality is within the national ambient air quality standards.
• Nonattainment area is the region where the air quality exceed national ambient air quality standards.
• An area may fall into both categories for different pollutants.• Permits are issued to the sources considering the amount of
pollutants that are expected to emit per year.

Nonattainment area for CO

Remedies and SolutionsEfforts to reduce air pollution have largely fallen into three categories: a) Regulatory, b) Technological, and c) Economic or Market-based solutions.• Regulatory Solutions: Regulatory solutions involve the passage of laws and
the establishment of government agencies which attempt to reduce air pollution through government monitoring and punitive measures (usually fines but, in exceptional cases, criminal sentences as well).
• Technological Solutions: This includes the progress in emissions technology (e.g., reformulated gasoline), pre-warmed catalytic converters, and in the extension of emissions rules to trucks, pickups and SUVs.
• Market-based solutions: These solutions allow firms the flexibility to select cost-effective solutions to achieve established environmental goals.
Source: A.Kumar and S. Jampana, “Air Pollution”, 83-99, Vol. 1, Social Issues in America: An Encyclopedia, Edited by J. Ciment, M.E. Sharpe Inc., 2006.
Air Quality Monitoring
• Air quality monitoring helps us in better understanding the sources, levels of different air pollutants, effects of air pollution control policy, and exposure of various substances in the air we breathe.
• Air quality monitoring program assists us in improving and developing air pollution control programs to reduce the effect of air pollution.
• The purpose of air monitoring is not merely to collect data, but also to provide the information necessary for engineers, scientists, policy makers, politicians and planners to make informed decisions on managing and improving the air environment.

Air Quality Monitoring• Monitoring stations continuously
monitor and collect information about the presence and level of atmospheric contaminants as well as the meteorological indices.
• A typical monitoring station include sophisticated gaseous pollutant analyzers, particle collectors, and weather sensors that are continuously maintained and operated.
• In U.S., Environmental Protection Agency (EPA) with the help of state and local agencies monitors air pollutants.

Emissions Monitoring
Ambient Monitoring
Visibility Monitoring Upper Air Monitoring
Deposition Monitoring
Health Monitoring

Air Quality Monitoring
In general air quality monitoring can be grouped into following types:
• Emissions Monitoring: This type of monitoring focuses on emissions coming out of natural and man made sources.
• Ambient Monitoring: The emphasis is on ambient air concentration of toxic as well as non-toxic contaminants.
• Deposition Monitoring: This type of network measures the dry and wet deposition of atmospheric contaminants.
• Visibility Monitoring: Ability to see things is primary focus of this type of monitoring.
• Upper Air Monitoring: A look at ambient concentrations in upper atmosphere with the help of satellites, airplanes etc.
• Health Monitoring: Recognizes the importance of risk assessment and risk management in public health studies.

Air Quality Monitoring Networks
Different types of air quality monitoring networks operating today in the world:
– Ambient Air Monitoring Program in the U.S.– Atmospheric Integrated Research Monitoring Network in the U.S.– Canadian Air Monitoring Network– Mexican Network– Emission monitoring at industrial plants– Health monitoring program by WHO– Satellite monitoring by NASA and USEPA
Source: A. Kumar, H. G. Rao, S. Jampana, and C. Varadarajan, Air Quality Monitoring & Associated Instrumentation, Chapter 2, Environmental Technology Handbook (edited by N.P. Cheremisinoff), Government Institutes, Rockville, MD, 99-136, 2005.

Air Monitoring Instrumentation
Air pollution instruments are available for the measurement of indoor and outdoor air pollution. The available instruments could be grouped into the following major categories: – Concentration Measurement Instruments: This group includes the
instruments available for gaseous and particulate sampling.– Continuous Emission Monitoring Systems (CEMS): Real time
monitoring of stack gases is the basic thrust behind such systems.– Air Measuring Devices: This category includes volume meters, rate
meters and velocity meters (Kumar et al., 2004).– Meteorological Instruments: Basic devices used for measuring
atmospheric variables are included in this category.
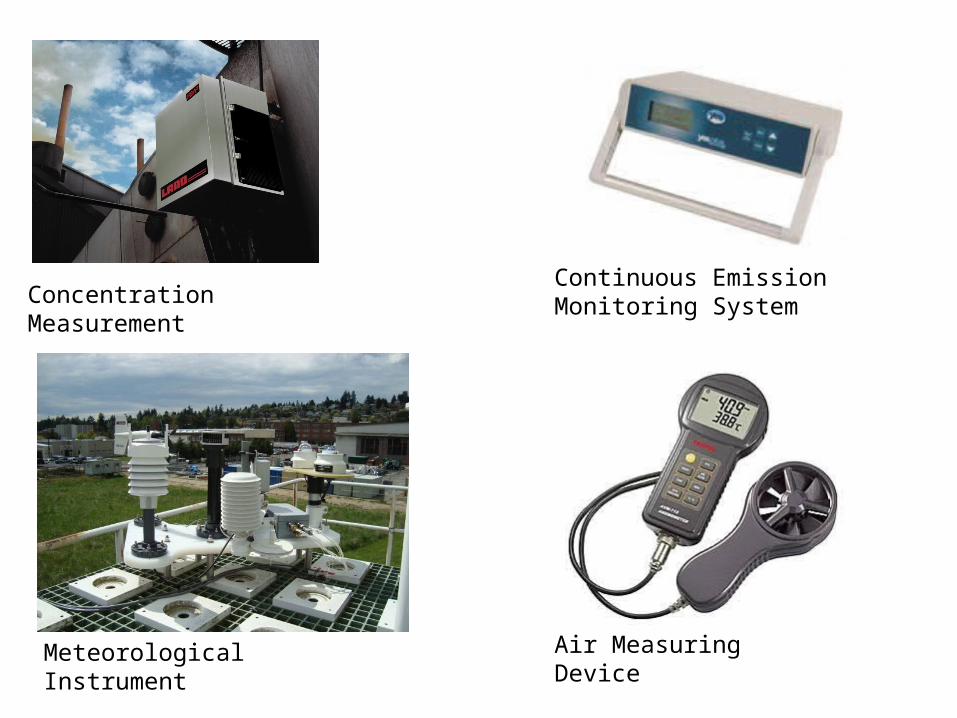
Concentration MeasurementContinuous Emission Monitoring System
Meteorological Instrument Air Measuring Device

Emission Inventory
• Emission inventory is an estimate of the amount of pollutants emitted into atmosphere.
• Developed by: o Plant o Local environmental agency o National environmental agency
• Characterized by the following aspects:o Type of activities that cause emissions,o Chemical or physical identity of the pollutants included,o Geographic location, ando Time period over which emissions are estimated.
Emission Inventory
• Details for development of an emission inventory depend on: – Area of coverage – Nature of sources – Purpose
• Well known emission inventories in the US – Inventory of criteria pollutants – Toxic release inventory (TRI)– Greenhouse gas emissions (first reporting: March 31, 2010)
Emission Rate
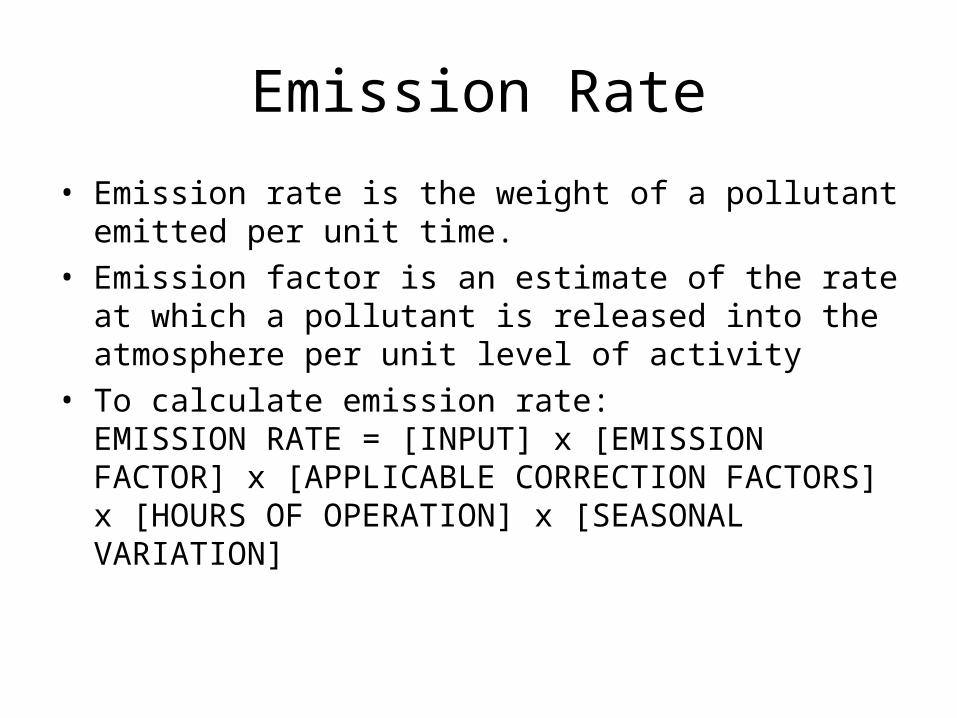
• Emission rate is the weight of a pollutant emitted per unit time.
• Emission factor is an estimate of the rate at which a pollutant is released into the atmosphere per unit level of activity
• To calculate emission rate: EMISSION RATE = [INPUT] x [EMISSION FACTOR] x [APPLICABLE CORRECTION FACTORS] x [HOURS OF OPERATION] x [SEASONAL VARIATION]

Importance of Climate Protection
• At standard atmospheric pressure, one tonne of CO2 occupies a cube the size of a three-story building (8.2m x 8.2m x 8.2m).
• This is the amount of CO2 produced by an average person in an industrialized country in one month.
CO2 Cube in Copenhagen – December (2009)
Emission Inventory
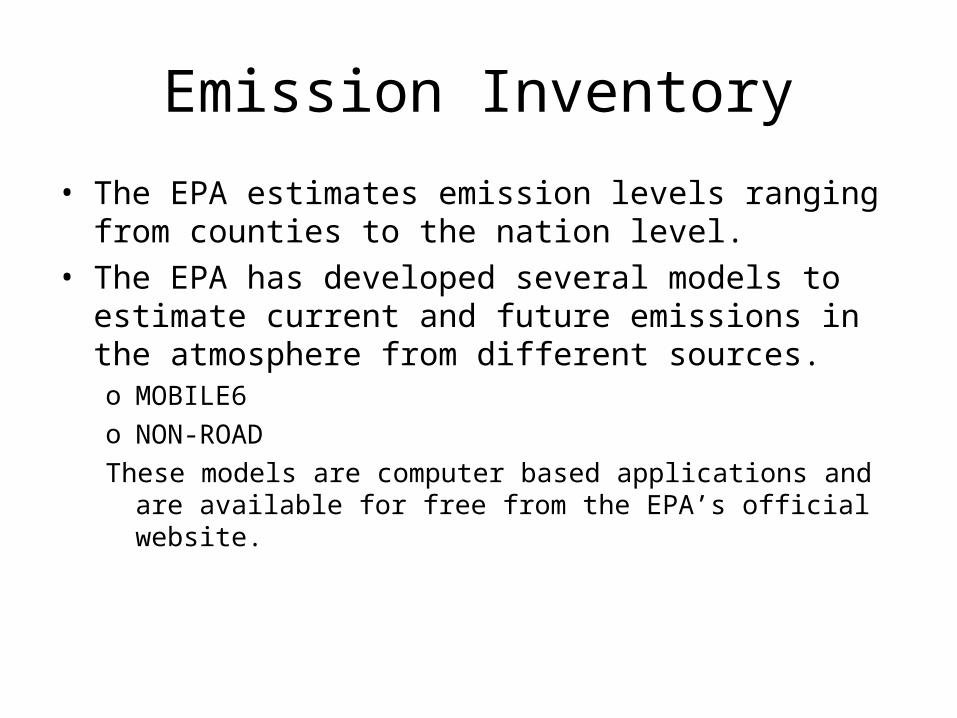
• The EPA estimates emission levels ranging from counties to the nation level.
• The EPA has developed several models to estimate current and future emissions in the atmosphere from different sources.o MOBILE6o NON-ROADThese models are computer based applications and are available for free
from the EPA’s official website.

Steps to Develop Emission Inventory
Steps Involved in development of an emission inventory are: • Planning • Data Collection • Data Analysis • Reporting Data
Planning
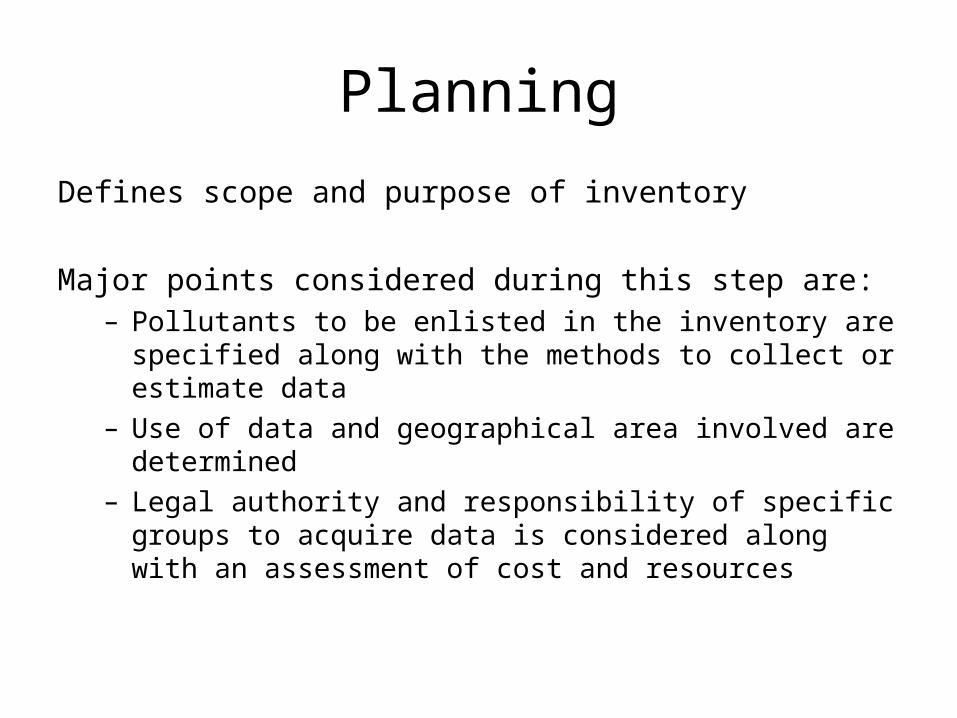
Defines scope and purpose of inventory
Major points considered during this step are: – Pollutants to be enlisted in the inventory are specified along
with the methods to collect or estimate data – Use of data and geographical area involved are determined – Legal authority and responsibility of specific groups to acquire
data is considered along with an assessment of cost and resources
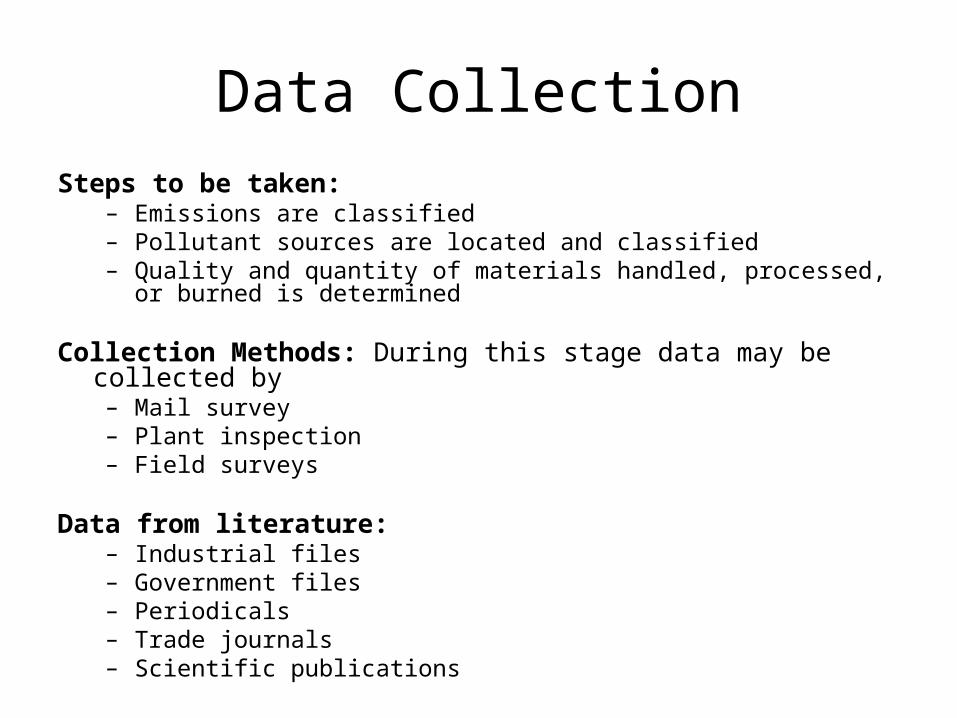
Data CollectionSteps to be taken:
– Emissions are classified – Pollutant sources are located and classified – Quality and quantity of materials handled, processed, or burned is determined
Collection Methods: During this stage data may be collected by
– Mail survey – Plant inspection – Field surveys
Data from literature: – Industrial files – Government files – Periodicals – Trade journals – Scientific publications

Information Collected During Data Collection
• General source information - location, ownership, and nature of business
• Activity levels - amount of fuel and materials (input) • Amount of production - output of the plant • Control device information - type of pollution control devices • Information required to estimate emissions - temperature,
tank conditions, hours of operations, seasonal variation and other data
Data Analysis
• Check accuracy • Calculation of emission rate is done using:
– Monitoring data (most accurate & most expensive) – Emission factors from AP-42 , – Mass balance, and – Engineering calculation

Reporting Data
• Information can be filed with the following pollution control agencies: – Local – Regional – National
• In US, data gathered by state agencies are reported to the USEPA
• Emission data are available from the USEPA’s web site
Uses of an Emission Inventory• The Emission Inventory developed may be used for:
– Identifying types of pollutants emitted from specific sources. – Determining the magnitude or amount of emissions from those
sources – Developing the emissions distribution in time and space – Calculating emission rates under specific plant operating
conditions – Finding out the relation of ambient air pollutant concentration
with specific sources – Input data for air quality modeling and risk – Determine pollution control options for public health – Estimating cost based on emissions
Air Pollution in AsiaAsia represents a major source of air pollution as a result of rapid
population growth, explosive industrialization, and few environmental regulations
China: China is polluted with sulfur dioxide (15 million tons) and particulate
matter (20 million tons) because of the use of the high sulfur coal used to generate energy.
Other Chemicals: – 1. Carbon Dioxide from Industry – 2. Greenhouse Gases from Industry – 3. Nitrogen Oxides from Cars – 4. Acid Rain
• With all these problems China has started implementing air pollution control technology.

Air Pollution in AsiaIndia: • Most common air pollutant: Suspended particulate matter is due to
use of coal in power plants • Use of low quality coal produces 45 million metric tons of ash
annually • When particulate matter ash is mixed with auto exhaust the
emissions across limits resulting in an increase in respiratory diseases and allergies
South Korea:• SO2 is the major pollutant in South Korea, however, it is being
controlled by using air pollution control equipment
Hong Kong: • Vehicular emissions contribute to air pollution problems with diesel
powered engines being the prime culprit.


Problems
Exercise
Problem :• A power plant proposes to burn coal with a sulfur
content of 1.8% by weight. The heating value of fuel is 10750 BTU/lb. What percent SO2 removal is required to meet the performance standard of 1.2 lb of SO2/106 BTU.

SolutionStep 1 : Performance standard 1.2 lb/106 BTUFuel heating value 10750 BTU/lb1.8% S content by weightStep 2 : lb of coal for 106 BTU= ?1 lb = 10750 BTU(106 / 10750)lb = 93.02 lbStep 3:S + O2 = SO2
32+32 = 641 lb yields 2lb of SO2
93.02 lb of coal contains 93.02*0.018 of S = 1.67 lb of S

Step 4 : Rate of SO2 generated = 93.02*0.018*2
= 3.35 lb SO2 /106 BTU
% to be removed = (3.35-1.20/3.35)*100 = 64%
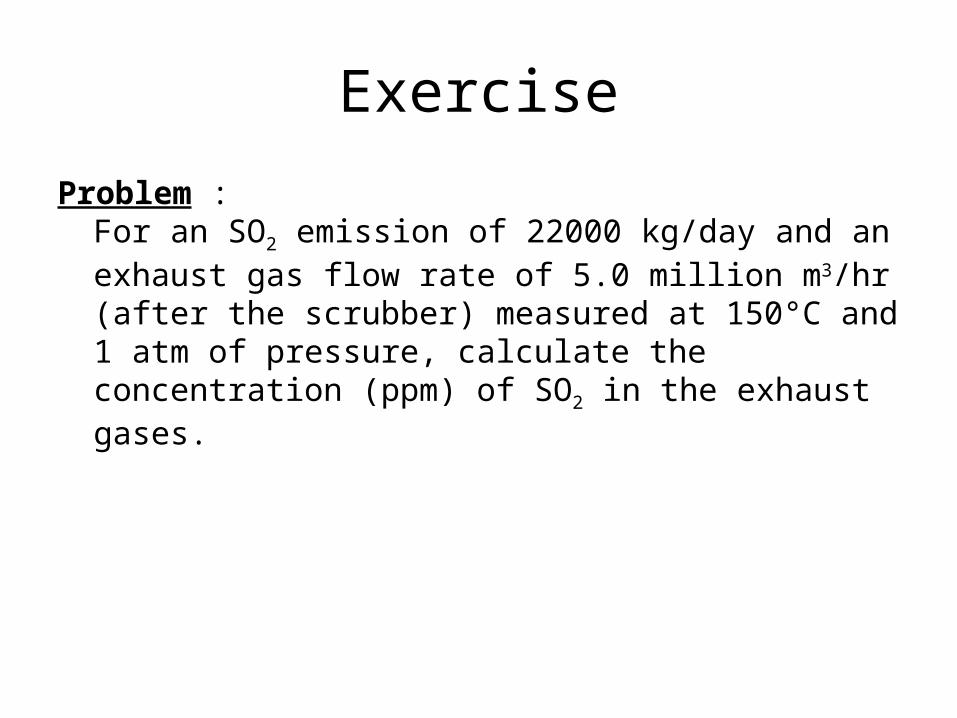
Exercise
Problem : For an SO2 emission of 22000 kg/day and an exhaust gas flow rate of 5.0 million m3/hr (after the scrubber) measured at 150°C and 1 atm of pressure, calculate the concentration (ppm) of SO2 in the exhaust gases.

Solution
Step 1 : n = {33000 kg/day x 1000 g /kg x g-mol /64 g }
= 515625 g-mol/day
Step 2: VSO2 = (nRT)/P
= {515625 (g*mol/day) x 0.08206 (L*atm/gmol*°K) x (200+273)°K }
1 atm = 20013664.7 L/day

Step 3: Vexhaust gases = (5.0 x 10⁶ m3/hour x 1000 L/m3 x 24 hours/1 day)
= 1.2 x 10¹¹ L/day
Step 4: For 1 day,
Total volume = 1.2 x 10¹¹ LVolume of SO2 = 2.0 x 10⁷ L
Concentration SO2 = (VSO2 ) / (Vexhaust gases )
= {(2.0 x 10⁷ L) / (1.2 x 10¹¹ L)} * 106 ppm = 166.6 ppm
References• Corbitt, R. A., Standard Book of Environmental Engineering, McGraw-Hill,
1998.• USEPA, National Ambient Air Quality Standards (NAAQS),
http://www.epa.gov/air/criteria.html, 2008• http://www.epa.gov/air/oaqps/eog/course422/ap3.html• http://airnow.gov/index.cfm?action=static.aqi• http://www.atsdr.cdc.gov/general/theair.html• http://yosemite.epa.gov/R10/AIRPAGE.NSF/webpage/
Emissions+Inventory• http://www.epa.gov/airprogm/oar/oaqps/takingtoxics/p1.html#3