Embed Size (px)
Citation preview

HIGHLIGHTS 2001 2ESRF
Introduction2001 was a very productive year for theESRF. The machine (linac, synchrotron,storage ring) performed extremely well,providing almost 5500 hours of beam. Theoverall availability was close to 97%, a newrecord. For our Users, reliability is asimportant as raw flux, and here the MachineDivision continued to improve the machine'sperformance with a mean time between failures of 46 hours. To answer the needs of a wide andvaried User community, the ESRF offers a variety of machine modes, with a significant proportion(30% of the total number of shifts delivered) in single-bunch or 16-bunch for time-resolved studies.During the last year there was a move from the previous routine high-brilliance mode (2 x 1/3 filling)to uniform mode, which has advantages as far as beam lifetime and detectors are concerned.Other improvements and advances include the installation and operation of 10 mm NEG-coatedchambers, the installation of the first of a series of in-vacuum undulators, and the start of aprogramme to increase the beam current from the present 200 mA.This latter project is particularlyexciting and during the first tests in November, a stable current of 250 mA was achieved.
These Machine improvements were mirrored in an extremely high level of activity on thebeamlines. As well as carrying out an ambitious scientific programme on 40 beamlines, many ofthe ESRF's beamlines were refurbished or upgraded. For example, there was excellent progressin the installation of the former BM16 powder diffractometer in its new position on ID31 and alsoin the restart of operation of the Dragon beamline on the new dedicated section ID8. An ever-increasing number of guest scientists visit the ESRF. During 2001, there were some 5000 visits bymore than 3000 individual Users. These scientists carried out about 800 distinct experiments,resulting in more than 400 publications in scientific journals. For example, in 2001 ESRF staff andvisitors contributed to at least 29 papers in Nature and Science, 44 papers in Physical ReviewLetters and Europhysics Letters, and 52 papers in the Physical Review. These figures attest bothto the international dimension and to the quality of the research carried out at the ESRF.
A major project for the ESRF's further development is the Partnership for Structural Biology withthe EMBL, ILL and IBS. The aim of this project is to provide a European focus for the vibrant andexpanding field of structural biology.The ESRF will build a new state-of–the-art beamline with twostations for macromolecular structure determination. A major contribution will also be made to theconstruction and operation of a new laboratory/office building, specifically designed for the needsof the PSB.The ESRF's Medium Term Scientific Programme was further refined in 2001 to providea road-map for scientific directions over the next five years. There are projects to enhance ourfacilities for engineering studies, to examine the possibilities of combining synchrotron radiationwith high magnetic fields, and to develop photoemission spectroscopies in the X-ray region. Inparallel, we shall continue to enhance and improve our beamlines and the machine – thisenhancement programme is a cornerstone of the ESRF's success.
Among many significant events during 2001, we highlight the Three-way Meeting with ourcolleagues from the Advanced Photon Source (USA) and SPring-8 (Japan). This meeting, on 14and 15 November 2001, proved valuable us an exchange of ideas at both the professional andpersonal levels.The three Directors-General, none of whom had been in post for more than a fewmonths, had the opportunity to meet for the first time and exchange views on the challengesencountered when leading these large and diverse organisations.
W.E.A. Davies, P. Elleaume, P.F. Lindley, F. Sette, W.G. Stirling(January 2002)
Participants in the APS, ESRF, SPring-8 Three-way Meeting.

Macromolecular crystallography hascontinued to play a dominant role in theLife Sciences during 2001. ID29 wasinaugurated into the public programme as abeamline with a full capacity for molecularanomalous diffraction (MAD) experiments,replacing the bending magnet beamlineBM14. The new beamline has alreadyprovided some impressive results (see forexample the research of Iwata et al., on thestructure of the membrane protein, formatedehydrogenase). An in-vacuum insertiondevice will be installed for the beamline inthe winter of 2001. BM14 has become acollaborating research group (CRG) facility,operated jointly by Spanish and UKconsortia. At the beginning of 2003, theSpanish consortium will move to BM16,currently the powder diffraction beamline,which itself is being transferred to aninsertion device, ID31. At BM16, theSpanish group will maintainmacromolecular crystallography, but mayalso add other techniques such as small-angle X-ray scattering. Indeed,macromolecular crystallography will gaintwo thirds of a bending magnet beamlinebecause the ESRF has one third of the useof the CRG beamlines for its publicprogramme. The inauguration of thesecond branch of DUBBLE, the Dutch-Belgium CRG at BM26 will bring this figureup to a whole new beamline and this is inaddition to the French CRG beamline FIP atBM30. In the ID14 Quadriga complex,station EH3 has been taken out ofcommission for refurbishment. It is beingused to develop automation and high-throughput technologies that will then betransferred to the other beamlines.
This Highlights 2001 includes projects fromboth the in-house research programme,(Hybrid Cluster Proteins, the Semiliki ForestVirus and Phase Determination UsingAnomalous Scattering from Sulphur Atoms)and the research of the external usercommunity. With respect to the former, theprogramme under the leadership of SeanMcSweeney continues to flourish resulting inthe development of new technologies on thebeamlines and in the methodology of datacollection, processing and structureelucidation. With respect to the latter, theprogrammes on the cyanobacterial systemand the ribosomal subunits deserve specialmention. These are long-term projects thatrequire repeated visits to synchrotronradiation facilities. In the case of theribosomal subunits, many thousands of
HIGHLIGHTS 2001 4ESRF

crystals, by several groups, have been usedto produce the present-day results. Suchresearch requires dedication and the long-term support that has become possiblethrough the Block Allocation System andLong Term Project research programmes.Every year it becomes more difficult toselect highlights in the field ofmacromolecular crystallography. The overallquality and importance of these structuralstudies is astonishingly high and anyselection becomes very subjective. If yourresearch is not mentioned, this reflects thejudgement of the Research Directors and notits quality.
It should be noted that the use of themacromolecular crystallography beamlinesby the pharmaceutical industry continuesto increase. A beamline (or its equivalent)dedicated to this type of use andincorporating a “Fedex” service (sendcrystals, receive data or even structures)will clearly be needed in the near future.The income derived from such a beamlinecould well fund staff and other projects.New projects include the Partnership forStructural Biology involving the ILL, theEMBL Grenoble Outstation, the ESRF andmaybe other institutions. This partnershipintends to provide a technological andscientific base within the European contextto exploit post-genomic research and high-throughput methodology. In its basic form,the partnership intends to build a newbeamline complex dedicated tomacromolecular crystallography and toconstruct a new building for both in-houseuse and use by external parties. Thebeamline complex will involve twobeamlines one with full MAD capacity andthe second with limited MAD capacity inthe ID23 straight section of the ESRF. Itmay well involve the use of cantedundulators to give two separate and distinctbeams or a diamond monochromator in asimilar manner to the Quadriga complex.Further details of this important andexciting new project can be obtained fromthe Management of the three institutionsmentioned above.
Within the Life Sciences programme, andindeed in many other parts of the overallscience programme at the ESRF, the use ofmicro X-ray beams is becoming increasinglyimportant. Thus small, highly collimated X-ray beams can be used for small samples orsmall volumes of larger samples. In thisrespect beamline ID13 has pioneered anumber of technical developments. Theseare illustrated by research into the structureof sensory rhodopsin and themicrostructural homogeneity of support silk
spun by Eriophora fuliginea.The Biomedical programme is alsoexpanding and a new biomedical facilityhas just been completed as an extension tothe ID17 building. This will enable a wholenew range of research activities to beinstigated in addition to those in humancoronary angiography, radiation dosimetry,phantom imaging and technologicaldevelopments on the beamline. Thus,experiments will be performed to measurecerebral blood values and blood to braintransfer coefficients in the C6 glioma modelin the rat brain and in the VX2 carcinomamodel in the rabbit brain, to evaluate lungfunction in rabbits as part of aninvestigation into asthma, and to developnew protocols for therapy. In thisHighlights 2001, research is presented fromthe microbeam radiation therapyprogramme, a long-term research projectinvolving Jean Laissue and his team inSwitzerland, which could lead to theradiation treatment of surgically inoperablebrain and other tumours in humans. Thesetypes of experiment, undertaken in ahumane manner by professionals, areessential for the progress of medicine. Itshould be clearly remembered that manymedical treatments that are now acceptedas normal and routine, could only havebeen developed through such programmes.
This Highlights 2001 is the last highlightsfor which I have had the pleasure ofwriting an introduction to the Life Sciencessection. The past five years have seen manychanges including the dedication of ID2 tosmall-angle scattering, the development ofID13, the Quadriga complex and ID29, andof course, the Biomedical programme. TheLife Sciences are also being practisedelsewhere: EXAFS on ID26; X-raymicroscopy on ID21 and ID22; andtomography on ID19. Currently the LifeSciences account for some 20-25% of theoverall science programme at the ESRF.I have enjoyed my period of office at theESRF and hope that the Life Sciences willcontinue to expand and flourish, producingresearch that is acknowledged to be at theforefront of world science. Of course, theLife Sciences cannot be allowed todominate resources at the expense of otherimportant programmes in materials scienceand physics. I hope that my colleagues inthe life sciences will be both tolerant andbroad in outlook, thereby accepting thatthe ESRF and other synchrotron sources inEurope must be allowed to serve scienceas a whole.
Peter LindleyDirector of Research – December 2001
2001 HIGHLIGHTSESRF
Life Sciences
5

HIGHLIGHTS 2001 6ESRF
Life Sciences
Structure of a MembraneProtein Complex: FormateDehydrogenase-N at 1.6 Å
The respiration of nitrate constitutes a major respiratorypathway in Escherichia coli under anaerobic conditions. Amajor electron donor in this pathway is formate, which isproduced from pyruvate via acetyl-CoA. A systemcomposed of the integral membrane proteins, formatedehydrogenase-N (Fdh-N) and dissimilatory nitratereductase (Nar) utilises the two-electron oxidation of formateas an electron donor for the reduction of nitrate to nitrite.Nar/Fdh-N has a redox loop mechanism responsible for thisenergy conservation. The Nar/Fdh-N system generatesproton motive force, which is used by ATP synthase andsecondary transporters, by the redox loop mechanism, amechanism ubiquitous among biomembranes of higherorganisms and bacteria.
Both Fdh-N and Nar are members of a subgroup ofmolybdo-enzymes, binding the molybdopterin guaninedinucleotide (MGD) form of the molybdopterin cofactor intheir active site. Both enzymes are three-subunit proteins (α,β, γ), consisting of two membrane-associated subunits andan integral membrane subunit. The crystal structure of Fdh-N was determined by multiple anomalous dispersion (MAD)using the 22 native Fe atoms. MAD and high-resolution datasets were collected at beamlines ID29 and ID14-3,respectively. Automated model building in combination withphase extension to 1.6 Å was performed using the
ARP/wARP program suite. Refinement, including watermolecule placement, was performed using the programsARP and CNS with final Rcryst of 17.7 % and Rfree of 19.5 %.This is the highest resolution structure achieved for anymembrane protein complex to date (Figure 1).
The overall structure of Fdh-N is shown in Figure 2. Fdh-Nis packed as a trimer (total MW 510 kDa) with the monomersrelated by a crystallographic threefold symmetry axis. Thetrimer shows a “mushroom”-like shape with the largestdimensions of 125 Å (along the membrane) x 150 Å (alongthe membrane normal). The α-subunit incorporates thecatalytic domain with a molybdenum (Mo) atom, two MGDcofactors, a selenocysteine residue and one [4Fe-4S] iron-sulphur cluster. The ß-subunit is an electron transfer unitcontaining four [4Fe-4S] iron-sulphur clusters, while themembrane intrinsic γ-subunit incorporates the two heme bmolecules and a quinone reduction site.The structure showshow electrons are transferred from formate to MQ throughMGD, 5 [4Fe-4S] clusters and two heme b groups, a totaldistance of over 90 Å. Further studies utilising amenasemiquinone analogue, HQNO (2-n-nonyl-4-hydroxyquinoline N-oxide) revealed the MQ binding site inthe γ-subunit and a possible proton uptake pathway from thecytoplasm to this quinone binding site. A comparative studyof the Fdh-N with the related enzymes, nitrate reductase and[NiFe] hydrogenase, has successfully explained how theproton motive force is generated by the Fdh-N/Nar system.
Principal Publication and AuthorsM. Jormakka (a), S.Tornroth (c), B. Byrne (b), S. Iwata (a, b,c) and A. Thompson (d), Science, in press (2002).(a) Division of Biomedical Sciences, Imperial College (UK)(b) Department of Biological Sciences, Imperial College(UK)(c) Department of Biochemistry, Uppsala University(Sweden) (d) EMBL Grenoble Outstation (France)
Fig. 1: Electron density map around the active site of Fdh-N at1.6 Å resolution.
Fig. 2: Trimer of Fdh-N viewed parallel to the membrane.Catalytic α-subunit is shown in orange, ß-subunit in blue andγ-subunit in pink.

2001 HIGHLIGHTSESRF
Life Sciences
7
Hybrid Cluster Proteins(HCP): A Unique BiologicalMetal Centre
Hybrid cluster proteins (HCP), first reported in 1989 [1], haveunprecedented redox chemistry and are unique amongstmetal centres in biological systems. Despite the wealth ofspectroscopic and structural information on HCP, the precisephysiological function(s) of these proteins remains unknown.To account for the early electron paramagnetic resonanceanalyses carried out on the protein, the presence of a [6Fe-6S] cluster was proposed and the protein was thereforenamed the “prismane protein” after the shape of theproposed iron-sulphur cluster. The first X-ray crystalstructure of the protein, isolated aerobically fromDesulfovibrio vulgaris (Dv), showed that HCP does notcontain a [6Fe-6S] cluster, but instead has two independentcentres each containing four iron atoms [1]. One of these isa cubane [4Fe-4S] structure and the second is the so-called“hybrid cluster”, a novel [4Fe-2S-2O] cluster with an unusualarrangement.
The quite unusual and unexpected structure of the hybridcluster raised the question of whether it was indeed a nativestructure. The similar protein from Desulfovibriodesulfuricans (Dd) was therefore purified and crystallisedanaerobically. X-ray data for the Dd protein were collected ata wavelength of 1.722 Å on BM14, so that anomalousdispersion effects could be used to confirm the locations ofthe iron atoms in the clusters.Then a second high-resolutiondata set, 1.25 Å, was collected using a wavelength of0.933 Å on ID14-2.
The three-dimensional structures of the Hybrid ClusterProteins from Dd and Dv were shown to have a very highsimilarity and both contain a cubane and a hybrid cluster.The overall protein and cluster structure appears to beindependent of the oxidation state of the protein and/orwhether the preparations were performed aerobically oranaerobically. The hybrid clusters contain both oxygen andsulphur bridges between pairs of iron atoms (Figure 3) anda further moiety, X, appears to bridge Fe5 and Fe7 therebycompleting their coordination geometries.The hybrid clusteritself has an open configuration and is readily accessible byboth hydrophobic cavities and hydrophilic channels [2]. Theposition of X represents an obvious site of substrate bindingand Fe8 may also be involved, but the nature of thesubstrate and the reaction mechanism both remain to beclarified.
A structurally-based sequence alignment between theHCP and the carbon monoxide dehydrogenase(CODH) enzyme from C. hydrogenoformans highlightsthe close structural similarity between Dd/Dv andC. hydrogenoformans (Figure 4). In fact, all the Dd/Dvcysteine and histidine cluster binding residues and many of
the residues contributing to the strong hydrophobicity ofone of the cavities pointing towards Fe8 [2] are conserved.This cavity leads directly from the surface of the protein toLys489, a residue that is retained between many HCP andCODH and located within 3.0 Å of the oxygen atombridging Fe7 and Fe8 in the HCP.This lysine is predicted tohave a crucial role in the CODH enzyme mechanism [3]and may indicate a hydrophobic pathway for substrate orproduct with a common key role for Lys489 between theCODH and the HCP reaction mechanisms. However, sofar, any attempts to find such activity have failed.
Fig. 3: The hybrid cluster in the HCP proteins. (a) A schematicview, (b) electron density in a 2|Fo|-|Fc| map contoured atthe 2.0 (blue) and 15.0 (red) rms levels in the vicinity of the Xmoiety in the Dv protein, and (c) as per (b) for molecule A inthe Dd protein.

HIGHLIGHTS 2001 8ESRF
Life Sciences
More recent results have suggested a possible sulphurtransferase role for the HCP proteins and this aspect is nowbeing vigorously pursued.
References[1] W.R. Hagen, A.J. Pierik and C. Veeger, J. Chem. Soc.Faraday Trans I 85, 4083-4090 (1989).[2] S.J. Cooper, C.D. Garner, W.R. Hagen, P.F. Lindley andS. Bailey, Biochem., 39, 15044-15054 (2000).[3] H. Dobbek, V. Svetlitchnyi, L. Gremer, R. Huber andO. Meyer, Science, 293, 1281-1285 (2001).
Principle publication and authorsS. Macedo (a, b), E.P. Mitchell (b), C.V. Romão (a),S.J. Cooper (c, d), R. Coelho (a), M.Y. Liu(e), A.V. Xavier (a),J. LeGall (e), S. Bailey (c*), C.D. Garner (d),W.R. Hagen (f),M. Teixeira (a), M.A. Carrondo (a) and P. Lindley (b), to bepublished.(a) Instituto de Tecnologia Química e Biológica,Universidade Nova de Lisboa, Oeiras (Portugal)(b) ESRF(c) CLRC Daresbury Laboratory, Warrington (UK)(d) School of Chemistry, University Park, Nottingham (UK)(e) Department of Biochemistry, University of Georgia(USA)(f) Delft University of Technology, Kluvyer Department ofBiotechnology (The Netherlands)* Current address: Lawrence Berkeley National Laboratory,Berkeley (USA)
Structure of an EnvelopedVirus: the Semliki Forest VirusAmongst the wide variety of viruses, some have rathersimple spherical structures. Examples are the rhinovirus,which causes the common cold, and the poliovirus, theagent causing poliomyelitis. They consist of a single proteinshell surrounding a nucleic acid molecule that carries theviral genome information. These are called non-envelopedviruses and their mode of infection involves an attachmentstep whereby their cellular receptors link to the host cell,followed directly by the injection of their viral genome into thecell and, subsequently, by multiplication of the virus.
In contrast, enveloped viruses, which are multi-layeredstructures composed of a series of concentric protein shellsand one lipid envelope, have a specific step before infection,namely the fusion (or merging) of the viral and host cellmembranes. In the case of the Semliki Forest Virus (SFV),an alphavirus, which can provoke encephalitis and which istransmitted to humans by mosquitoes, the fusion of the hostcell and the viral membranes is induced by a single proteincalled E1. The E1 protein is embedded in the lipid envelopeof the virus and, together with a second viral protein namedE2, forms spikes on the outer surface of the viral particle.During infection, the E2 protein is believed to bind to a hostcell receptor and this leads to the entry of the viral particleinto the host cell. When SFV is exposed to the acidic pH of
Fig. 4: The hybrid clusters of the Dd HCP (a) and the CODH-cooS from C. hydrogenoformans (b) afterstructural alignment. In the vicinity of the hybrid clusters,the cysteine, Cys308 (not shown in the figure), Cys399,Cys427 and Cys452, and histidine, His240, cluster bindingresidues are conserved.

2001 HIGHLIGHTSESRF
Life Sciences
9
the endosome within the cell, the conformation of the E1protein changes drastically. This event leads to membranefusion and allows the infectious cycle to proceed.
X-ray crystallographic data collected on beamlines ID2 andID14 have allowed the determination of the 3D structure ofthe E1 protein at neutral pH. A combination of this data withElectron Microscopy [1], allowed the reconstruction of thefusion shell of the entire virus particle (Figure 5). Theseresults have highlighted the crucial scaffolding role of the E1protein to form a closed virus particle and thus, to direct theexit of newly formed viral particles from the host cell.
SFV is currently used to selectively express some proteinsin susceptible host cells and could therefore be of use insome gene therapy protocols. Virologists are also using theSemliki Forest Virus particle as a scaffold to present viralenvelope proteins to the immune system. With the help ofthe 3D structure of SFV, one could therefore envisionpreparing chimerical viral particles for vaccination. Finallyand quite unexpectedly, it turned out that the structure of theSFV E1 envelope protein is very similar to the structure ofthe envelope protein from Tick Borne Encephalitis, amember of the flaviviridae family of viruses [2]. This familyincludes important human pathogens like Yellow-Fever Virusor Dengue Virus, with no vaccine yet being available for thelatter. Knowledge of the structure of Semliki Forest Virussuggests that alphaviruses and flaviviruses use a commonmechanism of infection and may help in providing somepossible strategies to prevent it.
References[1] E.J. Mancini, M. Clarke, B.E. Gowen, T. Rutten andS.D. Fuller, Mol. Cell 5, 255-266 (2000).[2] F.A. Rey, F.X. Heinz, C. Mandl, C. Kunz andS. C. Harrison, Nature 375, 291-298 (1995).
Principal Publications and AuthorsJ. Lescar (a), A. Roussel (b), M.W. Wien (b), J. Navaza (b),S.D. Fuller (c), G. Wengler (d) and F.A. Rey (b), Cell., 105,
137-148 (2001); G. Wengler (d) and F.A. Rey (b), Virology257, 472-482 (1999).(a) ESRF(b) Laboratoire de Génétique des Virus, C.N.R.S.-UPR9053(France)(c) University of Oxford (UK)(d) Institut für Virologie, Giessen (Germany)
Extending the Range of thede novo Phasing of NativeProtein Crystal Structuresusing the AnomalousScattering from SulphurAtomsThe macromolecular crystallography community isincreasingly interested in new, routine methods of structuresolution which require neither the chemical modification ofmacromolecules nor the introduction of very heavy atomsinto crystals. One technique that has recently received agreat deal of attention is the exploitation, using X-rays ofrelatively long wavelength (λ > 1.5 Å), of the significantanomalous scattering properties of sulphur atoms found inthe structures of almost all proteins [1, 2]. For all of themacromolecular crystal structures thus far solved using thismethod, the crystals diffracted to much better than 2 Åresolution. The method would thus appear to requirecrystals that diffract rather well. It is also unclear just whatthe limits are for the size of anomalous signal that cansuccessfully be used in this procedure.
In order to ascertain just how general a method S-SAD(Sulphur-Single-Wavelength Anomalous Dispersion) canbecome and what the limits of the technique are, we havesolved the structures of two crystal forms of Tryparedoxin IIusing data collected on BM14 at 1.77 Å wavelength. Thetwo crystal forms diffract to1.5 Å and 2.7 Å resolutionrespectively and both experiments produced extremely highquality, interpretable electron density maps (see Figure 6).
Fig. 5: The T = 4 icosahedral protein layer formed by E1 on theSemliki Forest Virus surface.
Fig. 6: Part of the electron density map (red chicken wire) forcrystal form II of Tryparedoxin II calculated using solventflattened S-SAD phases at 2.7 Å resolution.

HIGHLIGHTS 2001 10ESRF
Life Sciences
The success of the latter experiment extends theresolution limits of the technique markedly, shows that thetechnique can be successful even using data fromcrystals that diffract only to medium resolution and hassignificant implications for macromolecular structuredetermination in the high throughput era. In the 10 yearsto mid-October 2001, the number of macromolecularcrystal structures submitted to the Protein Data Bank was12633. Of these 11679, or 92.5%, were determined to aresolution of 2.7 Å or better. Thus, even allowing for theskewing effect of amino acid mutant structures etc., thevast majority of crystal structures would, in terms ofresolution of data available, be amenable to solution by S-SAD. However, one must also take into account aminoacid composition when considering whether a proteincrystal structure might be suitable for solution by S-SAD.Of the ordered amino acid residues in the asymmetric unitof the crystals studied here, those containing sulphurrepresent 4.7%. This produces, at λ = 1.77Å, ananomalous signal from crystals of the native protein that isstrong enough to allow structure solution of both crystalforms. Of the five eukaryotic genomes for which there isfull or partial sequence information, the frequency ofoccurrence of sulphur-containing amino acid residues isas follows (see http://www.ebi.ac.uk/proteome/ fordetails): Homo sapiens, 4.4%; Arabidopsis thaliana, 4.3%;Caenorhabditis elegans, 4.7%; Drosophila melanogaster,4.2%; Saccharomyces cerevisiae, 3.4%. Large numbersof proteins from all of these genomes should thus, inprinciple, be amenable to structure solution by S-SAD(see Figure 7 for a breakdown of % sulphur-containing
residues for C. elegans) and our experiments havetherefore shown that S-SAD has the potential to becomea major technique for macromolecular crystal structuredetermination.
References[1] Z. Dauter, M. Dauter, E. de la Fortelle, G. Bricogne andG.M. Sheldrick, J. Mol. Biol., 289, 83-92 (1999).[2] Z-J. Lui, E.S. Vysotski, C-J. Chen, J.P. Rose, J. Lee andB.C. Wang, Protein Science 9, 2085-2093 (2000).
Principle Publication and AuthorsE. Micossi (a), W.N. Hunter (b) and G.A. Leonard (a), ActaCryst., D58, 21-28 (2001).(a) ESRF(b) School of Life Sciences, University of Dundee, Scotland(UK)
Atomic Model ofCyanobacterial Photosystem I:a Well-defined Assembly of12 Proteins and 127CofactorsThe conversion of solar energy to chemical energy byphotosynthesis forms the main energy source for life onearth. In plants, green algae and cyanobacteria, capable ofoxygenic photosynthesis, the central photosyntheticprocesses of light-induced charge separation are catalysedby two large protein complexes, the photosystems I (PSI)and II (PSII), which are located in the photosyntheticthylakoid membrane.
This year, the crystal structures of both PSI and PSII,isolated from the thermophilic cyanobacteriumSynechococcus elongatus, have been published atresolutions of 2.5 Å and 3.8 Å [1], respectively. Until recently,structural studies on PSI by crystallographic methods werelimited to a relatively low resolution of 4.0 Å. Significantimprovement of the crystal quality, mainly achieved byapplying seeding techniques [2], and general improvementsin technologies applied in collection of X-ray diffraction data,in particular cryocrystallography, and in crystallographiccomputing resulted in the present structural model at 2.5 Åresolution. All X-ray data collection was performed at thehigh-brilliance beamline ID2B at the ESRF. The initialelectron density map of PSI was obtained by multipleisomorphous replacement including effects from anomalousdispersion (MIRAS) and permitted the modelling of the 12protein subunits of PSI.
In cyanobacteria, three monomers are organised into atrimer (Figure 8). In the monomers, the organisation of the
Fig. 7: A histogram showing the distribution of the number ofopen reading frames (ORFs) as a function of the percentagecontent of sulphur containing residues for the genome ofC. elegans. As can be seen more than 50% of all ORFs in thisgenome are predicted to produce proteins containing at leastas high a ratio of sulphur containing residues as found inTryparedoxin II.

2001 HIGHLIGHTSESRF
Life Sciences
11
subunits in the thylakoid membrane is dictated by the 83 kDasubunits PsaA and PsaB. They form a heterodimer in whichthe two subunits are related by a pseudo-twofold rotationaxis (pseudo-C2). This heterodimer is surrounded by sevensmaller membrane intrinsic subunits and three extrinsicsubunits located on the stromal side.
The charge separation across the membrane is performedby a set of cofactors termed the electron transfer chain(Figure 9). It consists of three pairs of chlorophylls and onepair of phylloquinones (Vitamin K1), positioned along thepseudo-C2 axis in two branches, followed by the 4Fe4S
cluster FX that is located right on the pseudo-C2 axis andcoordinated to both PsaA and PsaB.The electron is furthertransferred to the two terminal 4Fe4S clusters FA and FB
located in the stromal subunit PsaC. The light energyrequired to drive this process is captured by the integralantenna system containing 90 chlorophyll a and 22carotenoids (Figure 9). The crystal structure of PSI showsnew types of Mg2+ axial ligands, not previously observed inthe structures of other (bacterio)chlorophyll-proteincomplexes, the most striking being a phospholipid oxygenand methionine sulphur.
The structure of PSI provides a detailed picture of thearchitecture of this protein-cofactor complex. Since thelocations and orientations of all the cofactors are known,and their chemical environments are visible for the firsttime, it is now possible to carry out theoretical studies tounderstand the spectroscopically determined electron andexciton transfer kinetics between the different cofactors.However, an unambiguous assignment of individualspectral and redox properties of the cofactors is notpossible at the moment.The new structural data will initiatemutational studies on PSI which will help to unravelstructure-function relationships in more detail.
References[1] A. Zouni, H.T. Witt, J. Kern, P. Fromme, N. Krauß,W. Saenger and P. Orth, Nature, 409, 739-743 (2001).[2] P. Fromme and H.T. Witt, Biochim. Biophys, Acta, 1365,175-184 (1998).
Principal Publication and AuthorsP. Jordan (a), P. Fromme (b), H.T. Witt (b), O. Klukas (a),W. Saenger (a) and N. Krauß (a*), Nature, 411, 909-917(2001).(a) Institut für Chemie/Kristallographie, Freie UniversitätBerlin (Germany)(b) Institut für Chemie, Max-Volmer-Laboratorium,Technische Universität Berlin (Germany)* present address: Institut für Biochemie,Universitätsklinikum Charité, Humboldt-Universität zuBerlin (Germany)
Antibiotics TargetingRibosomesAnalysis of high-resolution structures of complexes ofantibiotics with ribosomal particles sheds light on antibioticselectivity and illuminates various modes of action, fromreduction of decoding accuracy via limiting conformationalmobility, to interference with substrate binding and hindranceof the progression of growing proteins.Their interactions andthe lack of major conformational rearrangements associatedwith antibiotic binding, support the suggestion that the
Fig. 9: Cofactors of the antenna system (chlorophylls green,ring substituents omitted for clarity, carotenoids yellow) andof the electron transfer chain (blue and Fe4S4 cluster asyellow and blue spheres) in one monomer of photosystem I.
Fig. 8: Complete view of cyanobacterial, trimeric photosystemI from the stromal side of the membrane. The 12 proteinsubunits are in different colours, chlorophylls in yellow,carotenoids in white.

HIGHLIGHTS 2001 12ESRF
Life Sciences
ribosome provides a framework for peptide bond formation,rather than enzymatic activity.
Resistance to antibiotics is a significant problem in moderntherapeutics. Ribosomes of pathogenic bacteria are majortargets for antibiotics. Ribosomes are a cellular organellecatalysing the translation of genetic code into proteins.Theyare protein/RNA assemblies arranged in two subunits thatassociate for performing protein biosynthesis. The largesubunit (1.5 megaDa, 3000 nucleotides in two RNA chainsand ~35 proteins) creates the peptide bonds and providesthe path for emerging nascent proteins. The smaller subunit(0.85 megaDa, 1500 nucleotides in one RNA chain and~20 proteins) has key roles in controlling the fidelity ofcodon-anti-codon base-pairing and in initiating thebiosynthetic process.
The high-resolution structures of ribosomal subunits fromtwo pathogen-models [1], obtained recently by brightsynchrotron radiation, were used as a reference that allowedunambiguous localisation of several antibiotics. Amongthose reported here, six were clinically relevant and one wasof no clinical use. All were found to bind primarily toribosomal RNA and their binding did not cause majorconformational changes.
Small subunit antibiotics: Tetracycline was found to be amulti-site antibiotic with inhibitory action that stems from itsinterference with A-site tRNA binding. Edeine, a universalagent, inhibits the initiation of protein synthesis by linkingcritical features for tRNA, IF3 and mRNA binding, thusimposing constraints on ribosomal mobility that accompanythe translation process (Figure 10). Its universality impliesconservation of structural elements important for initiation.
Large subunit antibiotics: Chloramphenicol targets thepeptidyl transferase cavity close to the amino acceptor groupof tRNA. Clindamycin interferes with substrate binding andphysically hinders the path of the growing peptide chain.Themacrolides erythromycin, clarithromycin and roxithromycinbind to the entrance of the protein exit tunnel and block theprogression of nascent proteins (Figure 11). Interestingly,none of these antibiotics binds to the nucleotides assignedto be crucial for the catalytic mechanism of the ribosome thatwas proposed based on the 2.4 Å structure of theHaloarcula marismortui large subunit [2].
Comparative studies have helped to identify elements thatmay confer drug selectivity (e.g. Figure 12). The antibiotics
Fig. 10: (Left) The small ribosomal subunit. The mRNA pathand the P-(orange) and E-(yellow) sites are shown. The RNAfeatures that are “frozen” by edeine are highlighted in whiteand cyan. In the assembled ribosome the large subunit willface the left side of the particle. (Middle) top: the free edeine binding site. Bottom: thestructure of edeine. (Right) Detailed view of edeine (purple)binding site. Note the newly formed base pair (green).
Fig. 11: The position of erythromycin (red) within the largeribosomal subunit - RNA (dark green), the proteins (lightgreen). The view is from the active site into the protein exittunnel.
Fig. 12: Clindamycin binding site shown on a superposition ofthe backbone of the peptidyl transfer ring of a eubacterialpathogen model (D50S) and of its archeal counterpart (H50S)which serves as a model for eukaryotes (E. coli numberingscheme).

2001 HIGHLIGHTSESRF
Life Sciences
13
modes of interactions and the preservation of the active-siteconformation, favour the suggestion that the peptidyltransferase center serves as a template for properpositioning of tRNAs to allow for spontaneous, rather thanenzymatic, creation of peptide bonds. The ribosomalcomponents constructing the frame for accurate positioningof the tRNA molecules may include proteins, CTC, L27 andL16.
Antibiotics targeting ribosomes are excellent tools forstudying ribosomal function and for understandingmechanisms of drug action. Analysis of their modes ofaction should lead to structure-based design of improvedantibiotics.
References[1] F. Schluenzen, A. Tocilj, R. Zarivach, J. Harms,M. Gluehmann, et al., Cell, 102, 615-623 (2000).[2] P. Nissen, J. Hansen, N. Ban, P.B. Moore and T.A. Steitz,Science 289, 920-930 (2000).
Principle Publications and AuthorsF. Schluenzen (a), R. Zarivach (b), J. Harms (a), A. Bashan(b), A.Tocilj (a), A.Yonath (a,b) and F. Franceschi (c), Nature,413, 814-821 (2001); M. Pioletti (c), F. Schluenzen (a), J.Harms (a), R. Zarivach (b), M. Gluehmann (a), H. Avila (c),A. Bashan (a), H. Bartels (a), T. Auerbach (b), A.Yonath (a,b) and F. Franceschi (c) EMBO J. 20, 1829-1839 (2001).(a) Max-Planck-Res. Unit for Ribosomal Structure,Hamburg (Germany)(b) Dept. Structural Biology. Weizmann Inst. of Science,Rehovot (Israel)(c) Max-Planck-Inst. for Molecular Genetics, Berlin(Germany)
The Structure ofBacteriophage T7Endonuclease I: A HollidayJunction Resolving EnzymeThe rearrangement, or recombination, of DNA is an ancientand fundamental biological process. Recombination iscentral to many diverse biological processes such as thegeneration of genetic variation (and therefore evolution) andthe incorporation of viral DNA into host DNA, resulting insuccessful viral infection.
The process of DNA recombination occurs in distinct stages(Figure 13), with the formation of a four-way (Holliday)junction as a pivotal intermediate. The penultimate step inDNA recombination is regulated by a junction resolvingenzyme or ‘resolvase’. This enzyme cleaves the Hollidayjunction resulting in rearranged DNA strands. Bacteriophage
T7 encodes a protein, endonuclease I, which has beenshown to act as a four-way DNA junction resolvase.
In order to understand the mechanism by which a four-wayDNA junction resolving enzyme cleaves DNA we havesolved the structure of an inactive mutant of bacteriophageT7 endonuclease I (E65K), using X-ray crystallography.Extensive crystallisation trials showed that high qualityprotein crystals could only be obtained when the first 11 N-terminal amino acids were removed from the protein.Crystals of endonuclease I (∆N11, E65K) diffracted X-raysto 2.1 Å on station ID14-EH3.
The crystal structure was solved by the MAD method usingdata collected from a selenomethionine-substituted protein.However, endonuclease I (∆N11, E65K) does not containany endogenous methionine residues. For this reason amethionione containing mutant (I92M) was generated toallow selenomethionine incorporation (endonuclease I,∆N11, E65K, I92M). The junction cleavage activity of theprotein is unaffected by the introduction of this methionineresidue. Selenomethionine-substituted crystals diffracted X-rays rather more weakly than those of the native protein, andthree data-sets were collected to 3.0 Å and one to 2.5 Åusing station ID14-EH4. All four selenium sites in theasymmetric unit were identified by the SOLVE package, andelectron density maps were calculated using the CCP4 suiteof programs.The SOLVE derived phases were clear enoughto identify protein solvent boundaries and several secondarystructure elements, but were significantly improved bydensity modification and non-crystallographic symmetryaveraging. Models were initially built at 2.5 Å using data fromthe selenomethionine-substituted (∆N11, E65K, I92MSe)protein. Later in refinement, 2.1 Å data collected from acrystal of endonuclease I (∆N11, E65K) were introduced.
The structure shows that endonuclease I forms a symmetrichomodimer arranged in two well-separated domains
Fig. 13: The process of recombination.

HIGHLIGHTS 2001 14ESRF
Life Sciences
(Figure 14) and each domain is comprised of elements fromboth subunits in the dimer. An individual domain comprisesa central five-stranded mixed ß-sheet, flanked by five α-helices, with one strand and one helix contributed by theother subunit.
Mutagenesis experiments have previously identified anumber of potential active site amino acid residues.Examination of the 3-dimensional arrangement of theseresidues reveals a close similarity to residues found in theactive sites of a number of well-characterised restrictionendonucleases. In view of this it is likely that endonuclease Icleaves DNA using a mechanism similar to that of the typeII restriction endonucleases. How endonuclease Irecognises and cleaves the Holliday junction, while showingno reactivity towards duplex DNA remains an intriguingmystery. The structure of endonuclease I represents a steptowards understanding this process.
Principal Publication and AuthorsJ.M. Hadden (a), M.A. Convery (a, b), A.-C. Déclais (c),D.M.J. Lilley (c) and S.E.V. Phillips (a), Nat. Struct. Biol. 8,62-67 (2001).(a) Astbury Centre for Structural Molecular Biology,University of Leeds (UK).(b) Glaxo SmithKline (UK).(c) CRC Nucleic Acid Structure Research Group, Universityof Dundee (UK).
Insight into the Regulationof Microtubular AssemblyThe microtubule cytoskeleton is an essential component ofthe dynamic architecture of eucaryotic cells. Microtubulesserve as guides for the segregation of chromosomes duringcell division and constitute tracks along which cellularorganelles move. Microtubules are ~ 22 nm diameter hollow
tubes whose walls are constituted of parallel protofilamentsessentially made of tubulin, a heterodimeric proteinconstituted of two subunits noted α and ß. In order to fulfiltheir functions, microtubules assemble and disassemblecontinuously in a way regulated by several families ofproteins, among which are the stathmin phosphoproteinfamily. Proteins of the stathmin family are phosphorylated inresponse to various extracellular stimuli and have beenproposed to serve as relays integrating activated intracellularsignalling pathways [1]. All stathmin family proteins share astathmin-like domain which binds to tubulin to form a 2tubulin:1 stathmin-like domain ternary complex.
Crystals of a stathmin-like domain:tubulin complex havebeen obtained. Diffraction data to 4 Å resolution werecollected on beamlines ID14-2 and ID14-4. An initialstructure of the tubulin molecules of the complex wasdetermined by molecular replacement using as a model thestructure of tubulin determined by electron crystallography ofplanar sheets made of antiparallel protofilaments [2]. Usingphases derived from this model, difference electron densitymaps allowed us to locate a 90 residue stathmin-like α-helixthat runs along the complex. The current model of thestructure consists of this α-helix and two tubulin molecules.It has been refined to an R-factor of 27%. More recently, in apeak-SAD experiment on ID14-4, three seleno-methionineresidues (out of ca. 2000 residues in the complex) werelocated in the stathmin-like α-helix and allow a preliminaryassignment of its sequence.
The structure reveals a complex made of a curved head-to-tail assembly of two tubulin molecules, maintained by thestathmin-like α-helix that runs all along it (Figure 15). Twofeatures of the structure deserve notice: i) its curvatureresembles that of microtubule oligomeric disassemblyproducts; ii) the tubulin residues that contact stathmin in thecomplex are identical in the two αß heterodimers. Mostinterestingly, the spacing along the stathmin-like sequenceof the residues that contact tubulin is identical to the spacingof corresponding residues in an internal sequence
Fig. 14: (left) Overall structure of Endonuclease I.(right) Potential active site residues.
Fig. 15: Ribbon representation ofthe stathmin-tubulin complexshowing the stathmin-like α-helix.
2001 HIGHLIGHTSESRF
Life Sciences
15
duplication that has been found in all stathmin familyproteins.This strongly suggests that stathmin family proteinshave evolved to bind two tubulin molecules and that this istheir main function in the cell.
Because of its curvature, the stathmin-tubulin complex doesnot assemble into microtubules. The structure is fullyconsistent with a sequestering mechanism by which non-phosphorylated stathmin family proteins control microtubuleassembly by forming with tubulin a complex that is notincorporated in microtubules. In addition to providing insightinto the mechanism of action of stathmin, this study providesan X-ray structure of soluble tubulin. Higher resolution dataon this complex may allow rational improvement of anti-cancer drugs that target tubulin.
References[1] A. Sobel, Trends Biochem. Sci., 16, 301-305 (1991).[2] E. Nogales, S.G. Wolf and K.H. Downing, Nature, 391,199-203 (1998).
Principal Publication and AuthorsB. Gigant (a), P.A. Curmi (b), C. Martin-Barbey (a), R. Ravelli(c), A. Sobel (b) and M. Knossow (a), Cell, 102, 809-816(2000).(a) Laboratoire d’Enzymologie et Biochimie Structurales,C.N.R.S., Gif sur Yvette (France)(b) INSERM U 440, Institut du Fer à Moulin, Paris (France)(c) EMBL, Grenoble (France)
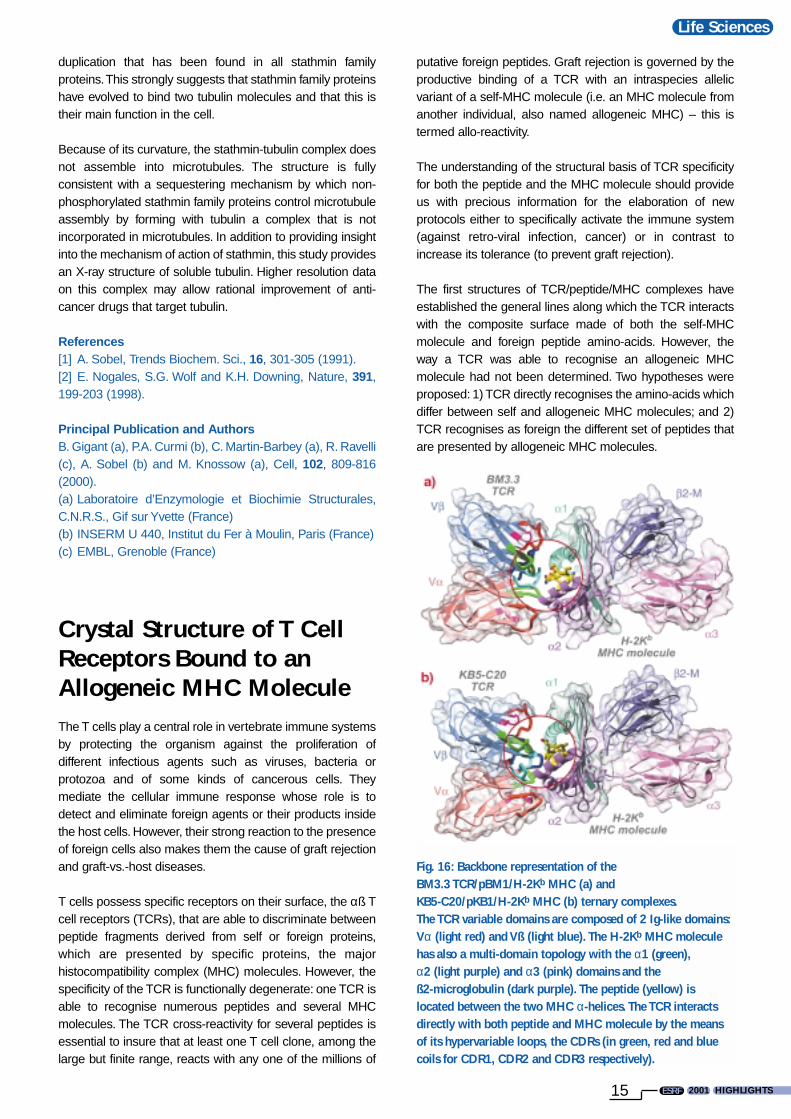
Crystal Structure of T CellReceptors Bound to anAllogeneic MHC MoleculeThe T cells play a central role in vertebrate immune systemsby protecting the organism against the proliferation ofdifferent infectious agents such as viruses, bacteria orprotozoa and of some kinds of cancerous cells. Theymediate the cellular immune response whose role is todetect and eliminate foreign agents or their products insidethe host cells. However, their strong reaction to the presenceof foreign cells also makes them the cause of graft rejectionand graft-vs.-host diseases.
T cells possess specific receptors on their surface, the αß Tcell receptors (TCRs), that are able to discriminate betweenpeptide fragments derived from self or foreign proteins,which are presented by specific proteins, the majorhistocompatibility complex (MHC) molecules. However, thespecificity of the TCR is functionally degenerate: one TCR isable to recognise numerous peptides and several MHCmolecules. The TCR cross-reactivity for several peptides isessential to insure that at least one T cell clone, among thelarge but finite range, reacts with any one of the millions of
putative foreign peptides. Graft rejection is governed by theproductive binding of a TCR with an intraspecies allelicvariant of a self-MHC molecule (i.e. an MHC molecule fromanother individual, also named allogeneic MHC) – this istermed allo-reactivity.
The understanding of the structural basis of TCR specificityfor both the peptide and the MHC molecule should provideus with precious information for the elaboration of newprotocols either to specifically activate the immune system(against retro-viral infection, cancer) or in contrast toincrease its tolerance (to prevent graft rejection).
The first structures of TCR/peptide/MHC complexes haveestablished the general lines along which the TCR interactswith the composite surface made of both the self-MHCmolecule and foreign peptide amino-acids. However, theway a TCR was able to recognise an allogeneic MHCmolecule had not been determined. Two hypotheses wereproposed: 1) TCR directly recognises the amino-acids whichdiffer between self and allogeneic MHC molecules; and 2)TCR recognises as foreign the different set of peptides thatare presented by allogeneic MHC molecules.
Fig. 16: Backbone representation of the BM3.3 TCR/pBM1/H-2Kb MHC (a) and KB5-C20/pKB1/H-2Kb MHC (b) ternary complexes. The TCR variable domains are composed of 2 Ig-like domains:Vα (light red) and Vß (light blue). The H-2Kb MHC moleculehas also a multi-domain topology with the α1 (green),α2 (light purple) and α3 (pink) domains and the ß2-microglobulin (dark purple). The peptide (yellow) islocated between the two MHC α-helices. The TCR interactsdirectly with both peptide and MHC molecule by the meansof its hypervariable loops, the CDRs (in green, red and bluecoils for CDR1, CDR2 and CDR3 respectively).

HIGHLIGHTS 2001 16ESRF
Life Sciences
In order to clarify this point, we have solved the structure oftwo murine TCRs (BM3.3 and KB5-C20) in complex with anallogeneic MHC molecule (H-2Kb) loaded with a self-peptide.The first structure has been determined last year [1]and the second one very recently, thanks to crystallographicdata collected at the ESRF beamline BM30A [2].
These two structures provide us with pioneering results onthe structural basis of TCR allo-recognition (Figure 16).They clearly support the second assumption i.e. that TCRrecognises as foreign the different set of peptides that arepresented by allogeneic MHC molecules. Our results showsthat allo-recognition requires self and allogeneic MHCmolecules to have nearly identical TCR-facing residues,implying that graft rejection and graft-vs.-host diseases areessentially mediated by the different peptide repertoirespresented by allogeneic MHC molecules. Consequently andquite surprisingly, an allogeneic MHC molecule thatsignificantly differs in its TCR facing residues may not elicit Tcell activation. Thus, when selecting graft donors, it may beuseful to look not only for MHC molecules identical to thoseof the graft host, but also for those displaying significantdissimilarities.
References[1] J.-B. Reiser, C. Darnault, A. Guimezanes, C. Grégoire,T. Mosser, A.-M. Schmitt-Verhultz, J.C. Fontecilla-Camps,B. Malissen, D. Housset and G. Mazza, Nature Immunol., 1,291-297 (2000).[2] J.-B. Reiser, C. Grégoire, C. Darnault, T. Mosser,A. Guimezanes, A.-M. Schmitt-Verhultz, J.C. Fontecilla-Camps, G. Mazza, B. Malissen and D. Housset, Immunity,accepted.
AuthorsJ.-B. Reiser (a), C. Darnault (a), J.C. Fontecilla-Camps (a),D. Housset (a), G. Mazza (b), T. Mosser (b), C. Grégoire (b),A. Guimezanes (b), A.-M. Schmitt-Verhultz (b) andB. Malissen (b).(a) LCCP, I.B.S. J.P. Ebel, CEA-CNRS-UJF, Grenoble(France)(b) C.I.M.L., INSERM-CNRS, Marseille (France)
Bacterial Origin of the ActinCytoskeletonA defining feature of bacterial cells has long been thought tobe the lack of a cytoskeleton, which in eukaryotes isindispensable for cell division, for the maintenance of cellshape, and numerous other functions. The cytoskeleton iscomposed of actin filaments, microtubules, and intermediatefilaments. Microtubules are thick polymers that, apart fromother functions, form the mitotic spindle to pull thechromosomes apart during cell division. The actin filamentsare relatively thin, and are cross-linked into larger structures
to obtain mechanical integrity. They are located justunderneath the cell cortex and are involved in determinationof the cell shape.
In recent years it became apparent that the microtubule-based cytoskeleton can be traced back to a bacterial proteincalled FtsZ (filamentous-temperature sensitive protein Z).FtsZ is structurally very similar to tubulin and forms filamentsin an analogous manner that mediate bacterial cell division.Despite the link between FtsZ and tubulin, the bacterialhomologue of actin remained obscure.
In March 2001, Laura Jones of the group of Jeff Errington(University of Oxford, UK) looked at the cellular distributionof MreB, a bacterial protein, predicted to be a member of theactin family. She showed by immunofluorescence that MreBfrom Bacillus subtilis forms spiral-like structures underneaththe cell membrane [1]. Depletion of MreB from B. subtiliscaused a defect in cell shape. The distribution of MreB-likegenes among the bacterial subkingdoms shows thatbacteria with a non-spherical cell possess one or moreMreB-like genes [1]. This strongly suggests that there is aMreB-based cytoskeleton in bacteria that maintains theircell shape.
If MreB would be the true actin homologue, could it self-assemble into filaments?
We have recently shown that purified MreB fromThermotoga maritima can form polymers in vitro undersimilar conditions to eukaryotic actin [2]. A closer look atthese polymers under the electron microscope showed thatthey consist of pairs of protofilaments, each being a string ofmonomers. The spacing between the monomers is 51 Å,which is very similar to the 55 Å spacing found forfilamentous actin [2]. The similarity between actin and MreBbecame even more convincing when the crystal structure ofT. maritima MreB was solved by MAD (multiple anomalousdispersion), at the ESRF beamline ID14-4.This showed thaton the structural level MreB and actin are the most closelyrelated proteins of the actin family.The trigonal MreB crystals(P3121, a = b = 51.58 Å, c = 292.37 Å) diffracted to 2.1 Å,and were partially twinned. A surprising property of thecrystals is that the subunits are already assembled intoprotofilaments. The crystals thus reveal a detailed look atthe interface between the subunits in the protofilament.A comparison between a single protofilament of actin andMreB shows that the subunits are in almost identicalorientation in the protofilament, resulting in a similar spacingbetween the monomers (Figure 17). Combining the X-rayand electron microscopic data, we conclude that MreB andactin form the same protofilaments when polymerised andthat MreB is the bacterial homologue of actin.
There is one striking difference between the MreB polymersand F-actin. In eukaryotic actin two protofilaments gentlytwist around each other to form a helical F-actin filament,whereas bacterial actin assembles into pairs of straight

2001 HIGHLIGHTSESRF
Life Sciences
17
protofilaments.This may indicate that the propensity of actinto form helical filaments has evolved after the eukaryotic celldeveloped from its bacterial origins.
References[1] L.J.F. Jones, R. Carballido-Lopez and J. Errington, Cell,104, 913-922 (2001).[2] F. van den Ent, L.A. Amos and J. Löwe, Nature, 413, 39-44 (2001).
AuthorsF. van den Ent, L.A. Amos and J. Löwe.MRC-Laboratory of Molecular Biology, Cambridge (UK)
The Crystal Structureof an Asymmetric Complexof the Two NucleotideBinding Components ofProton-TranslocatingTranshydrogenaseMembrane-bound ion translocators have importantfunctions in biology, but their mechanisms of action arepoorly understood. Transhydrogenase, found in animalmitochondria and bacteria, links the redox reaction betweenNAD(H) and NADP(H) to proton translocation across amembrane. The enzyme is a dimer in the membrane. Eachprotomer consists of three domains: dI and dIII protrude from
the membrane and bind NAD(H) and NADP(H),respectively; dII spans the membrane and provides achannel for proton translocation. Depending on enzymesource, the protomer may consist of 1, 2 or 3 polypeptidechains.
Under most physiological conditions, transhydrogenaseconsumes the proton electrochemical gradient (∆p)generated by the respiratory (or photosynthetic) electrontransport chain:NADH + NADP+ + H+
out → NAD+ + NADPH + H+in
Thus, the energy of ∆p is utilised to drive the reaction towardNADP+ reduction. NADPH is used subsequently inbiosynthesis and to reduce glutathione for detoxificationreactions. The transfer of hydride-ion equivalents betweenNAD(H) and NADP(H) in transhydrogenase is direct, and,therefore, it is envisaged that the nicotinamide rings of thetwo nucleotides are brought into apposition to effect theredox reaction.
Recombinant dI and dIII from R. rubrum spontaneously forman active complex in solution that can reduce NADP+ byNADH, even though dII, the membrane-spanning domain isabsent. Figure 18 shows the structure of a dI2:dIII1 complexfrom R. rubrum in the presence of both NAD+ and NADP+.Two equivalents of dI form a tight dimer. One dI (subunit A)has tightly-bound NAD+, while subunit B does not bindNAD+ tightly, but instead has a bound dIII containing tightly-bound NADP+. This remarkably asymmetric complex hasbeen shown by a number of techniques to be functionallyrelevant [1].
NAD+ from dI subunit A can be easily modelled into the,presumably, partially occupied, or empty, NAD(H)-bindingsite of subunit B. This shows that although the twonucleotides NADP+ and the modelled NAD+ are close inspace, they are too far apart for direct hydride transferbetween the two NC4 atoms to occur. However, by simple
Fig. 17: A comparison of a single protofilament of F-actin andMreB. Three subunits are shown from each polymer, eachcomposed of four domains, depicted in blue, yellow, red andgreen. The longitudinal spacing is similar for F-actin and MreB(55 and 51 Å, respectively).
Fig. 18: Structure of a dI2:dIII1 complex from R. rubrum.

HIGHLIGHTS 2001 18ESRF
Life Sciences
rotation about a few bonds, the nicotinamide ring of NAD+
can be brought into apposition of NADP+, allowing us tomodel the hydride-transfer step. Figure 19 shows the dI:dIIIinterface.
Together with earlier experimental observations, thisstructure is taken to indicate that proton pumping is achievedthrough an alternating NADP(H) binding changemechanism.
Reference[1] J.D.Venning, D.J. Rodrigues, C.J. Weston, N.P.J. Cotton,P.G. Quirk, N. Errington, S. Finet, S.A. White andJ.B. Jackson, J. Biol. Chem., 276, 30678-30685 (2001).
Principal Publication and AuthorsN.P.J. Cotton (a), S.A. White (a), S.J. Peake (a),S. McSweeney (b) and J.B. Jackson (a), Structure, 9,165–176, (2001).(a) School of Biosciences, University of Birmingham,Birmingham (UK)(b) ESRF
Local Structure ofSpider SilkOrb-weaving spiders produce up to 7 different silks, whichdiffer considerably in mechanical properties [1]. We have,however, only very limited knowledge on the structural
properties of these silks and how they vary between differentspecies. Scanning X-ray micro-diffraction (SXD) techniquesdeveloped at the beamline ID13 can be used to probe singlesynthetic- and biopolymer-fibres and can thus be applied tolarge range of silks. We used SXD to study silk produced bythe orb-weaving spider Eriophora fuliginea [2]. Orb websspun by Eriophora are unusually stretchy which contributesto their ability to intercept strong, crepuscular or night flyingmoths.
A scanning electron microscopy (SEM)-image of a sampleclassified as “support thread” shows that it is not ahomogeneous material (Figure 20). Two fibres,hypothesised to be of major ampullate (MA) gland origin, areabout 7 µm diameter (thick fibres) and form a central thread.A second thread of unspecified glandular origin, made ofabout 1 µm diameter fibres (thin fibres), is loosely attachedto the central thread. It resembles visually, however, silkderived from the minor ampullate glands. An SXD “image”was obtained by mapping the sample through a 3 µmdiameter X-ray beam with a 3*4 µm step resolution. Afterevery step, a 2D-diffraction pattern was recorded with aCCD detector. This allows reconstituting an “image” wherethe “pixels” correspond to individual fibre diffraction patternswith the ß L(polyalanine) structure (Figure 21).
Although the SXD-mapping resolution is less than for a SEMimage, one can recognise the essential macroscopicfeatures of the thick and thin fibres. The fibres show aremarkable homogeneity of unit cell parameters, particlesize and crystallinity, which suggests that the spider iscapable of maintaining control of the spinning process overmacroscopic distances. Our data suggest higher volumecrystallinity for the thin fibres as compared to the thick fibres.This could be due to a higher amount of crystal-formingpolyalanine blocks, as suggested for the fibroins of minor
Fig. 19: The dI:dIII interface.
Fig. 20: Scanning electron microscopy (SEM) image ofEriophora fuliginea support silk (courtesy: I. Snigireva, ESRF)

2001 HIGHLIGHTSESRF
Life Sciences
19
ampullate silk of Araneus diadematus [3]. For the centralthread, the orientation of the equatorial reflections is asexpected normal to the macroscopic fibre axis. In contrast,the equator is oriented nearly parallel to the macroscopicfibre axis in the thin fibre. To explain this difference, wepropose a ribbon-like morphology for the crystalline fractionof the thin fibres.This model implies a tilting of the equatorialline due to the projection of a helical structure on themacroscopic fibre axis. A ribbon-like morphology could alsoexplain the apparent flexibility of the thin fibres.
References[1] J.M. Gosline, M.E. DeMont and M.W. Denny, Endeavour,10(1), 37 (1986).[2] C. Riekel, C.L. Craig, M. Burghammer and M. Müller,Naturwissenschaften, 88, 67 (2001).[3] P. Guerette, D. Ginzinger, Bhf. Weber and J.M. Gosline,Science, 272, 112 (1996).
Principal Publication and AuthorsC. Riekel (a), M. Burghammer (a), C.L. Craig (b) andM. Müller (c), Naturwissenschaften, 88, 67 (2001).(a) ESRF(b) Tufts Biotechnology Center, Department of ChemicalEngineering, Tufts University, Medford (USA)(c) Institut für Experimentelle und Angewandte Physik, Kiel(Germany)
Sensory Rhodopsin StructureProvides First-Time DetailedInformation of theMechanism of PrimitiveVisionSensory rhodopsin is a membrane protein that absorbs lightand signals this information to flagellar components of thecell. The structure and function of this photoreceptor, whichis related to rhodopsin in the mammalian retina, providesinformation on a primitive form of vision.
In studies on sensory rhodopsin, a team of researchers atUC Irvine, USA, led by H. Luecke, has used the very intensemicrofocus beamline, ID13, at the ESRF. They haveelucidated a unique crystal structure [1] and for the first timeare learning how this membrane protein changes shape torecognise the sun’s emission spectrum. In addition, asurface binding site for downstream signalling proteins hasbeen identified that does not exist in other members of themicrobial rhodopsin family.
The three-dimensional structure of sensory rhodopsin IIprotein (NpSRII) (Figure 22) adds to our understanding ofhow it transforms when absorbing blue light, the mostintense kind in the sun’s emission spectrum. This highlyspecialised form of rhodopsin is a cell membrane proteinfound in a salt marsh-dwelling bacteria calledNatronobacterium pharaonis. When sensory rhodopsin isactivated, it sends a message through a second signalingprotein, called a transducer, telling the cell how to react. Abacterium may want to avoid the harsh blue light and movetoward a lower-energy form of light, when other forms ofrhodopsin pump ions into the cell to store energy. Themechanism of spectral tuning is now being recognised andthe structure also provides a crucial step to understandingthe mechanisms involved with trans-membrane cellsignalling. In capturing an image of sensory rhodopsin thatabsorbs blue light, a 1.1 Å shift of a charged group deepinside the molecule has been measured. This shift appears
Fig. 21: Scanning X-ray microdiffraction (SXD) image ofsupport silk sample shown in Figure 20. The SXD-image has tobe flipped vertically in order to correspond to the SEM imageorientation. Individual patterns from the thick and thin fibresare shown on the right. Arrows show the orientation of themacroscopic fibre axis.
Fig. 22: Electron density map and corresponding molecularmodel of the retinal binding pocket.

HIGHLIGHTS 2001 20ESRF
Life Sciences
to be largely responsible for the change in the wavelength ofabsorption when compared with other rhodopsins.
With respect to a unique binding site for the signallingactivity, inspection of the protein surface revealed anexposed amino acid, tyrosine, Tyr199, in the middle of thebilayer (Figure 23). This is believed to be one of theimportant sites where rhodopsin interacts with its transducerprotein, enabling recognition of the very fundamental signaltransduction with these molecules.
The structures of membrane proteins, such as rhodopsin [2],are still relatively rare due to difficulties in isolation,purification and crystallisation. This new structural andfunctional information from rhodopsin is becomingincreasingly important to understanding how G-proteincoupled receptors (GPCRs) work. GPCRs, a superfamily ofproteins that transduce signals across cell membranes, areproven to be excellent therapeutic targets. Nearly half of allknown drugs act on GPCRs.While sensory rhodopsin is nota GPCR, it provides a model structure for study.
The team of UC Irvine plans to further explore crystalstructures of rhodopsin molecules during differentphotocycle states in order to understand how the proteinalters its shape to send messages.
AuthorsH. Luecke (a), B. Schobert (a), J.K. Lanyi (a), E.N. Spudich(b) and J.L. Spudich (b).(a) UCI’s Department of Physiology and Biophysics, Irvine(USA)(b) University of Texas Medical School, Houston (USA)
References[1] H. Luecke, B. Schobert, J.K. Lanyi, E.N. Spudich andJ.L. Spudich, Science 293, 1499-1503 (2001).[2] H. Luecke, B. Schobert, H.-T. Richter, J.-P. Cartailler andJ.K. Lanyi, J. Mol. Biol. 291, 899-911 (1999).
The Weanling PigletCerebellum: a Surrogate forTolerance to MicrobeamRadiation Therapy in PediatricNeuro-oncologyMicrobeam radiation therapy (MRT) is directed towardsclinical applications. Theory and the rationale of preclinicalexperiments of MRT are based on dose-volume relationshipsthat shape tissue complications after ionising irradiation. Ingeneral, the smaller the irradiated macroscopic tissuevolumes, the higher the threshold absorbed doses fordamage to normal tissues. Present-day clinical applicationsof this principle include stereotaxic radiosurgery andconformal radiotherapy, using photon beams collimated inmillimetres.
Synchrotron radiation beams permit the production ofmicroscopic beams that practically do not divergencewithin the tissues. After high-intensity X-ray wiggler beamswith negligible divergence became available in the 1980s,dose-volume relationships were tested in the microscopicrange, first at Brookhaven National Laboratory’s (BNL)National Synchrotron Light Source. MRT was thenimplemented at the ESRF using an array of thin (20-30 µm), parallel, closely spaced microplanar beams from amultislit collimator installed at the ID17 beamline.The adultrat brain proved to be extraordinarily resistant to seriousdamage by MRT up to several hundred Gy, although someindividual brain cells directly in the path of the microbeamswere destroyed. Entrance doses of 10,000 Gy wererequired to destroy normal rat brain tissues.
Microplanar beams crossfired toward the target in parallelexposures at 100 µm intervals (entrance doses of 312 or 625Gy) considerably extended the median survival time of youngadult rats bearing advanced intracerebral gliosarcomas,ablating about half of them. Histopathologically recognisableloss of tissue was seen only within the cross-irradiatedvolume of the brain. In unidirectionally irradiated volumes ofthe brain, tissue damage was minor or nonexistent. Theresults suggested the possibility of a differential effectbetween normal and tumour tissue for microbeam irradiation.This biological selectivity is likely to be related to differencesbetween vasculature in tumours and in normal tissues. Themechanisms are as yet unknown. A better understanding of
Fig. 23: Exposed conserved tyrosine in middle of bilayer.The NpSRII surface is coloured according to amino acid type(red, negatively charged; blue, positively charged; yellow,polar; grey, hydrophilic).

2001 HIGHLIGHTSESRF
Life Sciences
21
the vascular events may require the use of a vasculature thatcan be observed in vivo, such as that of the chorio-allantoicmembrane in fertilised chicken eggs. MRT at the ESRF andat BNL, using only one exposure to parallel microplanarbeams was shown to be also palliative or curative in youngadult rats bearing lethal intracerebral gliosarcomas.
MRT might be able to palliate brain tumors in human infantsfor whom seamless beams of radiation deliveredconventionally may carry unacceptable risks of long-termneurological disability. The ultimate goal of radiotherapy iscessation of tumor growth without radiotoxic side effects. Inpractice, one uses the highest doses of radiation tolerated byvital tissues. We have studied the effect of therapeutic dosesof microbeams delivered laterally, unidirectionally through thehindbrains of normal suckling rats about two weeks afterbirth.The combination of a high skin-entrance dose (150 Gy)and narrow intervals (105 µm midslice-to-midslice) betweenirradiated tissue microslices (width ≈ 28 µm), in a relativelylarge (1 cm x 1 cm) swath of the hindbrain resulted in loss ofcerebellar and body weight, as well as in neurological andbehavioural dysfunction. Conversely, a significantly smallereffect was noted in rats that had been irradiated with a lowerdose and/or wider beam spacing.
The next step was to test tissue tolerance of the brain inlarger animals. The cerebellum of the weanling piglet wasused as a surrogate for the radiosensitive human infantcerebellum. Five weanlings in a 47-day-old litter of seven,and eight weanlings in a 40-day-old litter of eleven wereirradiated at the ESRF. A 1.5 cm-wide x 1.5 cm-high array ofmicrobeams was propagated horizontally through thecerebella of the prone, anesthetised piglets. Skin-entranceintra-microbeam peak absorbed doses were 150, 300, 425,
or 600 Gy. For ≈ 66 weeks (first litter; until euthanasia;Figure 24), or ≈ 70 weeks (second litter) after irradiation,the littermates were developmentally, behaviourally,neurologically and radiologically (Figure 25) normal asobserved and tested by experienced farmers and veterinaryscientists unaware of which piglets were irradiated or sham-irradiated. These observations give credence to MRT’spotential as an adjunct therapy for brain tumors in infancy.
References[1] J.A. Laissue, G. Geiser, P.O. Spanne, F.A. Dilmanian, J-O. Gebbers, M. Geiser,. X.Y. Wu, M.S. Makar, P.L. Micca,M.M. Nawrocky, D.D. Joel and D.N. Slatkin, Int. J. Cancer 78,654-660 (1998).
Principal Publication and AuthorsJ.A. Laissue (a), H. Blattmann (b), M. Di Michiel (c),D.N. Slatkin (a), N. Lyubimova (a), R. Guzman (d),W. Zimmermann (e), S. Birrer (e), T. Bley (f), P. Kircher (e),R. Stettler (e), R. Fatzer (f), A. Jaggy (f) , H. M. Smilowitz (g),E. Brauer (c), A. Bravin (c), G. Le Duc (c), C. Nemoz (c),M. Renier (c), W. Thomlinson (c), J. Stepanek (b) andH-P. Wagner (a), in Medical Applications of PenetratingRadiation, H.B. Barber, H. Roehrig, F.P. Doty, R.C. Schirato,E.J.Morton (Eds.), Proceedings of SPIE 4508, 65-73, (2001).(a) Institute of Pathology, University of Bern, (Switzerland)(b) Paul Scherrer Institute (PSI), Villigen, (Switzerland)(c) ESRF(d) Neuroradiology Division, Inselspital, University of Bern,(Switzerland)(e) Division of Porcine Diseases, Faculty of VeterinaryMedicine, University of Bern (Switzerland)(f) Division of Animal Neurology, Faculty of VeterinaryMedicine, University of Bern (Switzerland)(g) University of Connecticut Health Center, Connecticut(USA)
Fig. 24: Cerebellum of a piglet ≈ 15 months after irradiation(skin entrance dose: 300 Gy), stained horizontal tissuesection. The tissue maintains its normal architecture. The thinwhite horizontal parallel stripes, clearly visible in the inset,correspond to the paths of the microbeams; the beam spacingwas ≈ 210 µm. Two thick white horizontal lines show theanteroposterior limits of the array of microplanes.
Fig. 25: Magnetic resonance image of the brain ofa ≈ 3 month-old piglet of the first litter; metric scale.No differences were apparent between irradiated piglets andsham-irradiated littermates.

HIGHLIGHTS 2001 22ESRF
Chemistry deals with the composition,structure, and properties of substances andthe reactions and transformations that theyundergo. Understanding the chemistry of asystem requires knowledge of thearrangement of the atoms and theirelectronic structure. Diffraction andspectroscopic studies using synchrotronradiation are powerful ways to obtain suchdetail, as illustrated in the range ofexamples chosen for this chapter. Theseencompass systems at low temperature orat high temperature and pressure, staticand dynamic systems, solids and fluids,fossilised and new materials, the structureand activity of the planet and the structureand activity of an enzyme.
The first four examples involve diffractionstudies, on carbon nanotubes, on the low-temperature solid phases of refrigerantmolecules, on sulphur at high temperatureand pressure, and on iron reacting withaluminium oxide also at high temperatureand pressure. For the nanotubes, a topic ofmuch interest owing to their future use in anumber of technological applications, high-energy photons have been used to probethe structure and alignment of the tubes.For the refrigerants, the intermolecularforces that control the thermodynamicproperties, and the packing of themolecules in the crystalline state, are ofinterest. The crystal structures have beensolved from high-resolution powder-diffraction data, owing to the difficulties ofgrowing single crystals at the lowtemperatures of solidification.Investigations at high temperatures andpressures are technically challenging, butbecome possible with the high brilliance ofthe beam and expertise on the ESRF high-pressure beamlines. The phase diagram ofsulphur has been simplified fromperforming measurements in situ ,indicating that previous assignments havebeen based on metastable phases, formedon quenching from high pressure andtemperature. Chemical reaction betweeniron and aluminium oxide at hightemperature and pressure may influenceconditions in the Earth’s interior. In situdiffraction studies above 65 GPa and2000 K confirm that such reactions canoccur.
Chemical reactions can also be investigatedby X-ray absorption spectroscopy, giving
ESRF

2001 HIGHLIGHTSESRF
Chemistry
23
information about the rates of formationand the structure of intermediates. ForEXAFS there is no need for the sample tobe crystalline and investigation of multi-step reactions in solution is possible.Energy-dispersive EXAFS measurements onthe time scale of a millisecond havefollowed the oxidation of hydroquinone toquinone involving the loss of two protons,and the transfer of two electrons to iron(III)in solution. Even biological systems undernear-physiological conditions can now bestudied at room temperature, as illustratedby the measurement of rapid-scan EXAFSspectra from the tetra-manganese oxidationcomplex of the photosynthesis enzyme.
A micro-focussed beam has been used toinvestigate the oxidation states of sulphurtrapped in minute inclusions in olivinecrystals from basaltic volcanic magmas.From the XANES spectra, sulphur(IV) isidentified, which can be implicated in thecontinuous release of sulphur dioxide fromvolcanoes, such as Stromboli or Vesuvius.
The cause of the colour change of fossilisedivory on heating to form the turquoise-blueMediaeval gemstone odontolite has been amystery for centuries. The structural andelectronic changes responsible have finallybeen uncovered from EXAFS and XANESexperiments.
EXAFS and quantum-chemical methodshave been combined to determine thestructure of Np(VII) complexes in alkalinesolution. By comparing the structures ofthe Np(VII) and the corresponding Np(VI)complex, it is now possible to explain thereversibility of the Np(VII)/Np(VI) redoxcouple.
ESRF
Structural Studies ofOriented Carbon NanotubesCarbon nanotubes have become a major research topicsince their discovery in 1991 and offer many possibilities forfuture applications. The tubes consist of rolled up graphenesheets of sp2-bonded carbon atoms making a hexagonalnetwork, and may be formed as single or multi-walled tubes.The inner diameters are typically in the one-nanometrerange. Most structural studies have been made by directimaging techniques but the use of diffraction techniques [1]is an important complementary method. The high-energydiffraction beamline ID15B is ideally suited to this type ofinvestigation. Neutron diffraction measurements [2] havealso been made.
A typical diffraction pattern for a powder sample of multi-walled carbon nanotubes is shown in Figure 26. The firstpeak, 002, arises from the inter-layer spacing, which is a littlelarger than that for graphite. The other peaks show acharacteristic asymmetric profile arising from the intra-layercorrelations; the derived interference function can betransformed to give the pair correlation function. This spatialdistribution gives detailed information of the atom positionsin the graphene sheet and confirms the local graphitic orderup to about 5 Å, but shows deviations at larger distances dueto curvature and defects in the lattice. Carbon nanotubesfabricated by different processes exhibit a considerablevariation in structure.
Oriented carbon nanotubes will be needed for theconstruction of electronic devices. This can possibly beachieved by the use of a microporous alumina template forthe CVD process. A sample prepared by Kyotani [3] usingthis method has been studied on ID15B using the imageplate detector to measure the anisotropic scatteringdistribution. When the membrane is oriented with thechannels parallel to the beam direction, an isotropicscattering distribution is produced but if the membrane ispositioned edge-on to the beam, the channels areperpendicular and there is an anisotropy in the 2Ddistribution, as shown in Figure 27. The dark spotscorrespond to the 002 reflection and give an indication of thealignment of the nanotubes; the azimuthal variation indicates
Fig. 26: X-ray scattering from a carbon nanotube sample [3].

HIGHLIGHTS 2001 24ESRF
Chemistry
ESRF
a distribution with a half-width of approximately 17°. Otheranisotropic features in the distribution have sixfold symmetryand seem to suggest reflections relating to the intra-planestructure. However, these features are the result of orderedalumina crystallites created during the CVD process thatunexpectedly induces a phase transformation in theamorphous substrate.
The results confirm the partial alignment of the nanotubeaxes with the membrane channels.The full diffraction patternalso reveals the presence of defects in the nanotubestructure compared with materials produced by otherfabrication methods. Nevertheless, these initial studies havedemonstrated the advantages of the high-energy diffractionmethod for these systems; a typical run corresponding toFigure 28 takes only 10 minutes. Further work is in progress.
References[1] A. Burian, J.C. Dore, H.E. Fischer, V. Honkimaki,J.B. Nagy, T. Kyotani, J. Sloan and A. Szczygielska, Proc. 5th
National Symposium of Synchrotron Radiation Users,
Warsaw 1999, eds.: M. Lefeld-Sosnowska, J. Gronkowski,Warsaw University, 1999, p.7.[1] J.C. Dore, A. Burian and S. Tomita, Acta PhysicaPolonica A, 98, 495 (2000).[2] A. Burian, J.C. Dore, H.E. Fisher and J. Sloan, Phys RevB, 59, 1665 (1999).[3] T. Kyotani, L. Tsai and A. Tomita, Chem. Mater., 8,2109(1996).
Principal Publication and Authors J.C. Dore (a), A. Burian (b), T. Kyotani (c) and V. Honkimaki(d), in preparation.(a) University of Kent, Canterbury (UK)(b) University of Silesia, Katowice (Poland)(c) Tohoku University, Tohoku (Japan)(d) ESRF
High-resolution X-rayPowder-diffraction Studieson RefrigerantsIn a refrigeration cycle, a volatile fluid transports heat.The fluid vaporises under reduced pressure, absorbingheat that is released when the vapour recondenses underpressure. The fluid absorbs heat because the expansionduring vaporisation works against the forces ofattraction between the molecules, and vice-versa duringcondensation.
We are interested in the forces between refrigerantmolecules, such as the modern hydrofluorocarbons (HFCs)and hydrofluorochlorocarbons (HCFCs), because theycontrol the thermodynamic and heat-transporting propertiesof these substances. Measurements of physical propertiessuch as viscosity, heat capacity or speed of sound can beused to derive information about the intermolecularinteractions, which can then be used in theoreticalsimulations of the behaviour of the fluids.These interactionsalso determine how the molecules pack together in the solidstate, but the crystal structures of these compounds havenot been solved owing to the difficulties of growing singlecrystals at very low temperatures. A crystal structure can actas a rigorous test of the limitations and applicability of theintermolecular potentials, and moreover can be used toimprove the potentials derived from physical measurements.We have grown powdered samples of the crystalline solidsof a number of HFCs and HCFCs and solved their structuresfrom high-resolution powder diffraction measurements onbeamline BM16.
To carry out the measurements, we built a glass-capillarygas-condensation cell, which can be mounted on thediffractometer, cooled with a cold-gas blower, and connected
Fig. 27: The 2D intensity plot for scattering from carbonnanotubes in a templated alumina membrane
Fig. 28: The azimuthal variation of the diffraction intensity forthe 002 peak of carbon (from Figure 27), showing theorientational dependence of the nanotube axes.

2001 HIGHLIGHTSESRF
Chemistry
25 ESRF
to a gas-handling system (Figure 29). The gas condensesas a liquid. We seal the capillary by disconnecting the gasline, then lower the temperature to crystallise the solid. Thesample is spun on the axis of the diffractometer, as isstandard practice, for high-quality X-ray powder diffractionpatterns measurements.
As an example, the variation of the diffraction pattern of solidHFC 134a (1,1,1,2-tetrafluoroethane, CF3CH2F) is shown inFigure 30. Between the melting point (170 K) and about 110K there are only three peaks visible in the diffraction pattern.
The molecules form an arrangement where the centres ofmass of the molecules are ordered, forming a cubic lattice,but their orientations are disordered, because the moleculesstill have sufficient thermal motion to overcome some of theforces acting between them. Below 110 K, the diffractionpattern changes abruptly.The molecules can no longer resistthe forces of attraction between them; they order and changetheir arrangement (Figure 31) to optimise their mutualinteractions.The symmetry of the crystal structure is lowered.This change of structure had not previously been reported.
From the study of a series of compounds, it is clear thatother refrigerant molecules undergo orientational order-disorder transitions in the solid state. There is also a richvariety in the structures formed on ordering below thetransitions, as molecules align under the influence of dipolarand higher-order interactions, and the van-der-Waals forcesbetween them. To model this behaviour from intermolecularpotentials, both of the ordered structures and the transitionsto the orientationally-disordered form, represents a stiffchallenge to the techniques of theoretical chemistry andmolecular dynamics simulation.
Principal Publication and AuthorsM. Brunelli and A.N. Fitch, J. Appl. Cryst., submitted.ESRF
Sulphur at High Pressuresand TemperaturesSulphur has the largest number of allotropes of anyelement, forming n-member-ring and helical structures. Ofthe helical structures, few complete solutions exist. Vezzoliand Walsh [1] have proposed that their phase XII(assigned as a fibrous form) is present at pressures above~ 3 GPa and temperatures above 400°C. We undertook an
Fig. 29: The in situ gas-handling system built on BM16. A: partial view of the multianalyser detector arm employed atBM16. B: cold-nitrogen-gas blower, mounted coaxially withthe capillary in order to have a laminar gas flow.C: goniometer head, co-axially aligned with the axis of thediffractometer, on which the sample capillary is mounted.D: the blue tube is the gas line which connects the pressurisedbottle containing the sample to the capillary for thecondensation. Once the capillary is filled, it is disconnected.
Fig. 30: The temperature evolution of the diffraction pattern ofHFC 134a shows the order-disorder phase transition at about110 K on cooling.
Fig. 31: View of the low-temperature structure of HFC 134a.

HIGHLIGHTS 2001 26ESRF
Chemistry
ESRF
experiment using the Paris-Edinburgh press on ID30 to tryto elucidate the structure of this high-p,T form and itsrelationship to the reported Fddd structure, made of 8-member rings, which is the stable structure under ambientconditions.
We found that the Fddd phase transforms to produce asimpler diffraction pattern (Figure 32), indicative of anincrease in symmetry and a smaller unit cell, which could beindexed as hexagonal, indeed altogether different from theprevious description of phase XII. We solved the structurefrom the powder-diffraction data, measured in situ, using asimulated annealing and global optimisation algorithm,which resulted in non-chiral helical chains of sulphur in thetrigonal space group P3221. There are two unique sulphursites (6c and 3b) per unit cell, Figure 33. As expected (seedetailed discussion on proposed structures of helical formsof sulphur in Prins et al. [2]), the structure is very similar tothat of trigonal selenium, having a three-atom chain repeatalong the c-axis; but differs in that selenium has only one Se
site per unit cell [3].The relationship between this new phaseand that described as phase XII became clear when weslowly reduced the pressure on the sample aftertemperature quenching. A back transformation occurs to ametastable 4.04 Å fibrous-like phase at pressures less than~ 0.5 GPa (which, over a 9 month period, shows signs ofsharpening very slowly into a pattern with features akin tothe Fddd phase).
We can only conclude that the effects of annealing andpolymorphism of quenched phases has added complexity tothe phase diagram of S, (e.g. see [1]), whereas our morerecent in situ work on ID30 has indicated that it is reallymuch more simple. We hope that this study serves tohighlight the necessity of in situ observation in p, T phasediagram construction and the ability to solve structures bypowder diffraction methode with clean data collected usingthe Paris-Edinburgh/multi-slit collimator assembly at non-ambient condutions.
References[1] G.C. Vezzoli and P.J. Walsh, High Temp. High Press., 9,345-359 (1977).[2] J.A. Prins, J. Schenk and L.H.J. Wachters, Physica, 23,746-752 (1956).[3] P. Cherin and P. Unger, Inorg. Chem., 6, 1589-1591(1967).
Principal Publication and Authors W.A. Crichton, G.B.M. Vaughan and M. Mezouar, Z. Krist.,216, 417-419 (2001).ESRF
Chemical Interaction of Ironand Corundum at HighPressure and Temperature:Implication for the Earth'sDeep InteriorAccording to arguments based on cosmic abundance, Al2O3
is likely to be the next most abundant component in theEarth's lower mantle after MgO, FeO, and SiO2. Moreover,the D’’ layer is possibly enriched in refractories such as Al2O3
and CaO. Therefore, the possible chemical reactions in theFe-Al2O3 system can provide an important model forprocesses at the core-mantle boundary. It wasdemonstrated recently that even small amounts of Al candramatically change the relative proportion of Fe3+ in(Mg,Fe)(Si,Al)O3 perovskite [1]. Consequently, the chemistryof the Fe-Al-O system is important for the whole Earthmantle. Knowledge of exchange reactions at high pressuresand high temperatures between a metal from one side and
Fig. 32: In situ pattern obtained at 3 GPa and 400°C, red,calculated pattern, green, and difference, blue, obtained forour helical model. Peak positions are indicated by verticalmarkers.
Fig. 33: Unit cell contents, with c-axis vertical, of the high-p, Tform of sulphur showing two distinct helices; the central oneis composed entirely of S2, light yellow, on the 3b site aroundthe vertex of the cell and the other, S1 dark yellow, on the 6csite rotating around the 32-screw axis.

2001 HIGHLIGHTSESRF
Chemistry
27 ESRF
refractory oxides and silicates from another side is importantfor understanding the early Earth differentiation. Therefore,there are a number of reasons to study interactions betweenaluminum oxide and iron at the megabar pressure rangeand high temperatures.
At ambient pressure corundum and iron do not react. At thesame time, there are indications that such a reaction ispossible at much higher pressures. However, so far, nosystematic investigations of the interaction between iron andaluminum oxide at different pressures and temperatureshave been performed and we decided to conduct in situ andex-situ studies of the possible reactions between Fe andAl2O3 in electrically- and laser-heated diamond anvil cells(DAC) by means of X-ray powder diffraction on ID30, andMössbauer spectroscopy analysis.
In our experiments, a thin iron wire, 5 - 7 µm in diameter, washeated electrically (Figure 34) or by a Nd:YAG laser. At allpressures and temperatures up to 63(3) GPa and 1400(50)K, correspondingly, samples contained only the mixtureof ε-Fe and corundum (Figure 35) after heating. However, at65(3) GPa after heating at 2200(50) K, the diffraction patternshowed several rather weak additional reflections(Figure 35b). All these reflections could be interpreted asthose belonging to the rhombohedral FeO phase. Afterdecompression, the samples contained diffraction lines ofα-Fe and cubic wüstite (Figure 35c). While the latticeparameters of corundum did not change after theexperiment, the lattice parameter of iron increased.Moreover, the 110 reflection of α-Fe was slightly asymmetricfrom the side of higher d spacing (Figure 35c). Suchchanges in the diffraction pattern of iron correspond to theformation of Fe-Al alloy with approximately 2% Al by mass.
High-resolution synchrotron X-ray data can resolve thediffraction peaks from pure non-reacted iron (a = 2.8660(2)Å) and reacted iron alloyed with 3% Al (a = 2.8723(2) Å)(Figure 35d). Moreover, in one of the spots we observedadditional reflections at 3.346 Å and 2.897 Å, which belongto cubic Fe3Al (a = 5.7946(4) Å) (Figure 35e).
Summarising the results of our experiments, we concludethat at pressures below 65 GPa and temperatures up to2000 K corundum and iron do not react. At higher pressuresand high temperatures we observed a chemical reactionwhich can be described in general as
(2 + 3x)Fe + xAl2O3 → 2FeAlx + 3xFeO,
where x is varied from 0.02-0.03 to 0.25.
The results show that iron is able to reduce aluminium out ofoxides at the core-mantle boundary providing an additionalsource of light elements in the Earth’s core andheterogeneity at the core-mantle boundary.
References[1] C. A. McCammon, Nature, 387, 694-696 (1997).
Fig. 34: Schematic diagram of the electrical heating assembly.A rhenium gasket of 250 µm thickness was indented to 25-30 µm between diamonds with 300 µm culets, and a holeof 100-110 µm in diameter was drilled in it. The gasket wascovered by corundum-based cement and pure corundum wasplaced in the hole and around the wire. A platinum wire of0.2 mm diameter flattened to a thickness of less than 10 µmwas used as electrical leads. The iron wire was heated by a DCcurrent with a stabilised power supply operating at 18 V/20 Arange.
Fig. 35: Examples of X-ray diffraction patterns collected afterheating iron and corundum at different pressures andtemperatures: (a) at 63(3) GPa and 1400(50) K; (b) 65(3) GPaand 2200(50) K; (c) completely decompressed sample heatedat 65(3) GPa and 2200(50) K; (d) and (e) different spots of thesample heated at 56(2) GPa and 2000(150) K. Diffractionpatterns (a) to (c) of electrically-heated samples werecollected at a laboratory X-ray source. (C, corundum; Fe, α-Fe; W, wüstite; r-W, rhombohedral high-pressuremodification of FeO; FA; iron-aluminum alloy).

HIGHLIGHTS 2001 28ESRF
Chemistry
Principal Publication and AuthorsL. Dubrovinsky (a), N. Dubrovinskaia (a), H. Annersten (b),F. Westman (b), H. Harryson (b), O. Fabrichnaya (c) andS. Carlson (d), Nature, 412, 527-529 (2001).(a) Bayerisches Geoinstitut, Universität Bayreuth(Germany)(b) Department of Earth Sciences, Uppsala University(Sweden)(c) Max Planck Institut für Metallforschnung, Stuttgart(Germany)(d) ESRF
Energy-dispersive EXAFS toStudy Chemical Reactions:the Case of the Electron-Transfer Reaction ofHydroquinoneMost of the chemical processes that occur in nature takeplace in liquid media. For this reason, chemical reactions insolution have been widely studied for many years. Suchstudies have focused mainly on the mechanism of thereactions, whilst the structures of the species involved havereceived considerably less attention. This is mainly due tothe difficulties of determining experimentally the structuresof chemical species in liquid media. To date, this importantquestion has largely been addressed by the standardtechniques of UV-Vis and infrared spectroscopies.Unfortunately these techniques are seldom structurallyspecific, so the determination of the detailed chemical formof the majority of reactants has awaited the arrival of a fastand more structurally-focused method. Energy dispersive X-ray absorption spectroscopy (EDXAS), is ideal for thisnew class of experiments.
The key strength of this technique as used at beamline ID24is its ability to collect spectra on timescales as fast as amillisecond, yielding all the characteristic information thatcan be obtained by conventional X-ray absorptionspectroscopy, i.e. the specific local structure centred on aselected atomic species, such as inter-atomic distances,number and type of neighbouring atoms, and degree ofthermal and structural disorder.
As an example we followed the redox reaction ofhydroquinone with iron(III) perchlorate as the oxidisingreagent to form quinone. This reaction involves bothelectrons and protons coming from hydroquinone(Figure 36). In concentrated solutions the formation of ablue intermediate species has been observed by uv-visspectroscopy and is easily corroborated by directobservation [1]. The reaction was followed by XAFS spectra
collected at the Fe K-edge on beamline ID24. Different pHvalues of 1.0, 1.3, 1.6 and 1.9, were used to monitor theirinfluence on the rate of the reaction. For each pH value, 15spectra were collected as the reaction proceeded and eachspectrum was collected in 50 ms. The series of spectrataken for the two extreme pH values are shown in Figure 37.
The reaction is faster when the concentration of protons islower, in good agreement with the mechanism proposed andwith previous observations. However, the first step of thereaction and the proposed intermediate were not detected atany of the pH values. In an attempt to observe it, fast spectralseries at 10 and 1 ms per spectrum were taken. The initialstate and the first spectrum of the series were found to beidentical, in contradiction with the results of rapid-scanspectroscopy - the blue long-lived intermediate has a lifetimeof the order of 5ms [2]. The explanation for this apparentcontradiction is found in the structure of this intermediate.The substitution of a water molecule for hydroquinone doesnot produce a significant change in the electronicenvironment of Fe, and hence does not significantly perturbthe XAFS spectrum.
A series of 20 spectra was collected, following the reactionto completion. Each spectrum was acquired in 270 ms, withthe time between two consecutive spectra set to 500 ms(Figure 38). We can conclude that the reaction is finishedapproximately 13 s after the mixing of the reactants.
The XANES region of the first and the last spectra of theseries are identical to the initial and final state of the reaction,Fe(III) and Fe(II) respectively. These spectra correspond toan octahedral environment of water molecules around thecentral cation with distances Fe-O equal to 2.02 Å and
Fig. 36: Oxidation reaction of hydroquinone, showing the twodifferent steps proposed.
Fig. 37: Series of XANES spectra taken in 50 ms each atdifferent values of pH, corresponding to pH values of 1 and1.9 (a and b).

2001 HIGHLIGHTSESRF
Chemistry
29
2.10 Å. The analysis of the time-resolved series shows therelative proportions of Fe(III) and Fe(II) as a function of timethrough a linear combination of these initial and final statespectra.
References[1] B.S. Brunschwig, C. Creutz, D.H. Macartney, T-K. Shamand N. Sutin., Faraday Discuss. Chem. Soc., 74, 113 (1982).[2] A. Haim, Acc. Chem. Res., 8, 264 (1975).
AuthorsS. Diaz-Moreno (a), J. Evans (b), J.I. Perruchena (c), I. Diaz(d) and T. Neisius (a)(a) ESRF(b) Univ. Southampton (UK)(c) Instituto de Ciencia de Materiales de Sevilla, CSIC(Spain)(d) Instituto de Biologia Vegetal y Fotosintesis, CSIC (Spain)
BioXAS at RoomTemperature Understanding the relationship between structure andfunction is one of the main interests in the molecularbiosciences. X-ray absorption spectroscopy on biologicalsamples (BioXAS) is highly useful for characterisation of thestructure of protein-bound metal complexes. Progress in theperformance of synchrotron radiation sources and ofexperimental stations dedicated to the study of ultra-dilutebiological samples has made it possible to carry out newtypes of BioXAS experiments, which were impracticable inthe past [1].The first steps towards atomic-resolution studieson biological catalysis at quasi-physiological conditions(non-crystalline samples, room temperature) are reportedfor the manganese complex of photosynthesis.
Essentially all molecular oxygen (O2) in the Earth'satmosphere has been produced by light-driven water
oxidation at the tetra-manganese complex of photosystem II(PSII). The underlying chemistry seems to be unique and isof potential technological interest. Structural information hasbecome accessible by X-ray absorption spectroscopy at theMn K-edge carried out at liquid-helium temperatures [2].Previously detailed information on structure and oxidationstate of the PSII manganese complex at room temperaturewas not available, so we investigated the tetra-manganesecomplex at 290 K by XAS on PSII membrane particles.
The experiments were carried out at ID26, wheresimultaneous scanning of the monochromator and theundulator gap facilitates rapid measurement offluorescence-detected X-ray absorption spectra on ultra-dilute samples (Figures 39 and 40). Owing to the rapid-scancapabilities of ID26, i.e. collection of EXAFS spectra in lessthan 10 seconds, any significant influence of X-ray radiationdamage is avoidable, and advanced room-temperatureBioXAS investigations on the PSII in its native membraneenvironment become feasible. At 290 K, as well as at 18 K,the manganese complex in its dark-stable (S1) state isapparently a Mn(III)2Mn(IV)2 complex, comprising two di-µ2-oxo bridged binuclear manganese units characterised by thesame Mn-Mn distance of 2.71-2.72 Å. Most likely, themanganese oxidation states and the protonation state of thebridging oxides are fully temperature independent.Remarkably, at room temperature manganese-liganddistances of 3.10 Å and 3.65 Å are clearly discernible in theEXAFS spectra. The type of bridging assumed to result inMn-Mn or Mn-Ca distances around 3.1 Å is, possibly,temperature dependent as suggested by distancelengthening by 0.13 Å on cooling.
Room-temperature XAS investigations open a new way togain insights into the structure-function relationships.Structural investigations under defined (with respect to pH,redox equilibria, etc.) and 'almost-native' conditions become
Fig. 38: XANES region of the spectra collected in 270 ms.
Fig. 39: Sample simultaneously exposed to the X-ray beam andto visible light which drives photosynthetic water oxidation. Inthe photograph, the X-ray beam enters from the upper rightedge and passes through an ion chamber before it hits the PSIIsample (marked by the yellow arrow). The X-ray fluorescence isdetected at right angles by a photodiode (the round devicebehind the sample). The temperature of the sample is controlledby a stream of nitrogen delivered by the metallic pipe in the leftpart of the photograph. To drive the photoenzyme through itscatalytic cycle, samples are illuminated with a sequence ofnanosecond flashes of green laser-light.

HIGHLIGHTS 2001 30ESRF
Chemistry
viable. The ambiguity with respect to the relevance of low-temperature results is avoidable. Furthermore, the capabilityto investigate the metalloenzyme at its working temperatureis the prerequisite for time-resolved XAS investigationsaiming at observation of structural changes in real time(without using a freeze-quench approach). Recently, usinglaser-flash excitation of a sample exposed to the X-ray beamon ID26 (Figure 39), we succeeded in observing directly theadvancement in the catalytic cycle by XAS at roomtemperature (unpublished results).
References[1] H. Dau and M. Haumann, J. Synchrotron Rad.(submitted).[2] H. Dau, L. Iuzzolino and J. Dittmer, Biochim. Biophys.Acta 1503, 24-39 (2001).
Principal Publication and AuthorsC. Meinke (a), V.A. Solé (b), T. Neisius (b), P. Pospisil (c),M. Haumann (d) and H. Dau (d), Biochemistry 39, 7033-7040 (2000).(a) FB Biologie, Philipps-Universität Marburg (Germany)(b) ESRF(c) Harvard University, Cambridge (USA)(d) FB Physik, Freie Universität Berlin (Germany)
Presence of Sulfite (SIV) inMagmas: Implications forVolcanic Sulphur EmissionsExcess degassing of sulphur dioxide (SO2) during eruptionshas been detected at numerous volcanoes, particularly insubduction zones. There is a growing consensus thatgaseous sulphur-containing species (SO2, H2S) can betransferred into the magmatic vapour phase prior to eruptionduring either gas accumulation in long-lived shallowreservoirs or continuous gas segregation in open-conduitsystems. However, the actual degassing mechanism ofbasaltic magmas at the origin of outstanding SO2 release isnot satisfactorily explained by most of the geochemicalmodels involving the magmatic redox conditions. It iscommonly accepted that sulphur is transported exclusivelyas sulphide (SII-) or/and sulphate (SVI) by mantle-derivedmelts, before being released as SO2 and/or H2S in volcanicemissions [1].
This work provides the first direct and quantitativedetermination of the oxidation state of sulphur in a selectionof minute glass inclusions trapped in olivine crystals(Figure 41), using X-ray fluorescence microspectroscopy.The inclusions are representative of the variety of basalticmagmas that have supplied the activity of famous activevolcanoes, e.g. Piton de la Fournaise (Reunion island),Stromboli and Mt Vesuvius (Italy). The micro-X-rayAbsorption Near Edge Structure (XANES) experiments atthe sulphur K-edge (2472 eV) were carried out using the X-ray microscopy beamline, ID21. The synchrotron X-raysource was demagnified to a micro-probe by using Fresnelzone plate lenses [2].The spot size ranges from 0.5 x 0.5 to2 x 2 µm2. At the sulphur K-edge, energy scans wereprovided by a fixed-exit Silicon (111) monochromatordefining an energy resolution of 0.3 eV. The use of an X-rayfluorescence microprobe provides the required resolution inboth energy and space together with an appropriatedetection limit.
Fig. 40: a) Edge spectra of the intact PSII manganese complex(solid line) and of the Mn2+ ions (broken line) formed after150 s of X-ray exposure of the biological sample at 290 K. Thedisplayed spectrum was collected in 1 s; averaging of scanswas not employed. b) Fourier-transformed k3-weighted EXAFSspectra. Twelve EXAFS scans of 10 s duration had beenaveraged.
Fig. 41: Microphotograph of one olivine-hosted glass inclusion(Stromboli sample). The silicate melt is trapped at hightemperature during the olivine crystal growth and preservedas a glass inclusion within the mineral, upon cooling.

2001 HIGHLIGHTSESRF
Chemistry
31
Figure 42 illustrates the micro-XANES spectra of the glassinclusions ((a) to (f)), and of one sulphate-bearing silicateglass, given for comparison. The spectra of inclusionsindicate a clear predominance of sulphur dissolved assulphide (SII-) in ocean-island basalts (Spectrum (a)). Incontrast, they reveal the ubiquitous presence of sulphite(SIV) species in addition to sulphate (SVI) in inclusionsrepresentative of oxidised and water-rich basaltic magmasfrom subduction environments (Spectra (b) to (f)). The firstpeaks related to sulphite (SIV) and sulphate (SVI) areunequivocally identified at 2477.9 and 2482.1 eV,respectively, in each of these inclusions.
Therefore, considering the equilibrium SO32-
melt = SO2gas +O2-
melt the decomposition of sulphite is a suitable candidatereaction to promote the release of sulphur as SO2 into thegas phase. The reduction of sulphate in sulphite and that ofsulfite in SO2 may actually control the sulphur release intothe gas phase upon ascent of H2O-rich oxidised basalticmagmas. We propose a new model involving sulphite (SIV)as the intermediate species yielding highly efficientpartitioning of sulphur into the gas phase as the origin of theexcess SO2 release in subduction zones. This mechanism
may account for continuous sulphur release at open-conduitarc volcanoes, fed with water-rich basaltic magmas.Stromboli is one typical example of such volcanoes. Asimilar line of reasoning may apply to the pre-eruptivesulphur degassing of andesitic-type magmas and gaspressure build up in shallow reservoirs prior to majorexplosive eruptions.
References[1] M.R.Carroll and J.D.Webster, in Volatiles in magmas,M.R. Carroll, J.R. Holloway (Eds.), Amer. Mineral. Soc.,Washington D.C., 231-271 (1994).[2] C. David, et al., App. Phys. Lett. 77, 3851 (2000).
Principal Publications and AuthorsN.Métrich (a), M.Bonnin-Mosbah (b), J.Susini (c), B.Menez(a) and L. Galoisy (d), to be published.(a) Laboratoire Pierre Süe, CNRS - CEA, CE-Saclay, Gif surYvette (France) (b) INSTN/CFR, CEA, CE-Saclay, Gif sur Yvette (France)(c) ESRF(d) Laboratoire de Minéralogie-Cristallographie de Paris(France)
From Fossilised MastodonIvory to Gemstone In the Middle Ages, Cistercian monks created odontolite, aturquoise-blue gemstone, by heating fossilised mastodonivory found in 13 - 16 million year old Miocene geologicallayers next to the Pyrenees. They thought they hadproduced the mineral turquoise because of theresemblance of odontolite with this semi-precious stone.Odontolite was therefore used for the decoration ofmedieval art objects such as the reliquary bronze crossshown in Figure 43.
Fossilised ivory and its mysterious colour change uponheating have been investigated by several naturalists andgemmologists, among them Réaumur (1683-1757).Although vivianite, a blue-coloured iron phosphate, orcopper salts were proposed to be the colouring phases, wefound none of these minerals in odontolite. Our elementaland structural studies demonstrated that odontolite consistsof fluorapatite, Ca5(PO4)3F, containing trace amounts of iron,manganese, barium, lead, rare earth elements and uraniumand presenting crystallites of 100 to 500 nm in size. Thiscrystal size is about 10 times larger than that of unheatedfossilised ivory and suggests that odontolite was heated atabout 600°C [1]. As potential colouring agents manganeseand iron were then studied. Luminescence and opticalspectroscopy permitted the exclusion of iron as a colouringion and suggested that manganese ions could beresponsible for the colouration of odontolite.
Fig. 42: Micro-X-ray Absorption Near-Edge Structure (XANES)spectra at the sulphur K-edge of the glass inclusions (a) to (f)and of one sulphate-bearing reference silicate glass. Thesulphur concentration ranges from 950 to 2950 ppm. Forefers to the composition of the olivine crystal which containsthe inclusion [e.g., Fo89: [Mg/(Fe+Mg)] = 0.89].
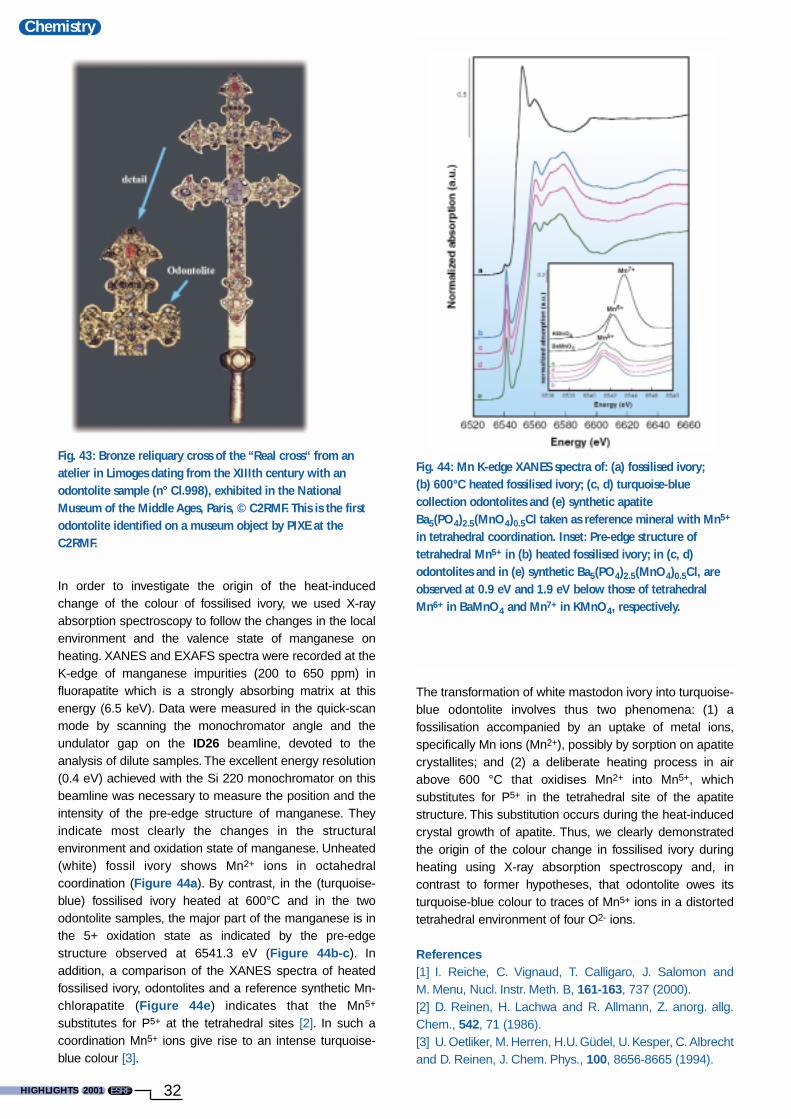
HIGHLIGHTS 2001 32ESRF
Chemistry
In order to investigate the origin of the heat-inducedchange of the colour of fossilised ivory, we used X-rayabsorption spectroscopy to follow the changes in the localenvironment and the valence state of manganese onheating. XANES and EXAFS spectra were recorded at theK-edge of manganese impurities (200 to 650 ppm) influorapatite which is a strongly absorbing matrix at thisenergy (6.5 keV). Data were measured in the quick-scanmode by scanning the monochromator angle and theundulator gap on the ID26 beamline, devoted to theanalysis of dilute samples. The excellent energy resolution(0.4 eV) achieved with the Si 220 monochromator on thisbeamline was necessary to measure the position and theintensity of the pre-edge structure of manganese. Theyindicate most clearly the changes in the structuralenvironment and oxidation state of manganese. Unheated(white) fossil ivory shows Mn2+ ions in octahedralcoordination (Figure 44a). By contrast, in the (turquoise-blue) fossilised ivory heated at 600°C and in the twoodontolite samples, the major part of the manganese is inthe 5+ oxidation state as indicated by the pre-edgestructure observed at 6541.3 eV (Figure 44b-c). Inaddition, a comparison of the XANES spectra of heatedfossilised ivory, odontolites and a reference synthetic Mn-chlorapatite (Figure 44e) indicates that the Mn5+
substitutes for P5+ at the tetrahedral sites [2]. In such acoordination Mn5+ ions give rise to an intense turquoise-blue colour [3].
The transformation of white mastodon ivory into turquoise-blue odontolite involves thus two phenomena: (1) afossilisation accompanied by an uptake of metal ions,specifically Mn ions (Mn2+), possibly by sorption on apatitecrystallites; and (2) a deliberate heating process in airabove 600 °C that oxidises Mn2+ into Mn5+, whichsubstitutes for P5+ in the tetrahedral site of the apatitestructure. This substitution occurs during the heat-inducedcrystal growth of apatite. Thus, we clearly demonstratedthe origin of the colour change in fossilised ivory duringheating using X-ray absorption spectroscopy and, incontrast to former hypotheses, that odontolite owes itsturquoise-blue colour to traces of Mn5+ ions in a distortedtetrahedral environment of four O2- ions.
References[1] I. Reiche, C. Vignaud, T. Calligaro, J. Salomon andM. Menu, Nucl. Instr. Meth. B, 161-163, 737 (2000).[2] D. Reinen, H. Lachwa and R. Allmann, Z. anorg. allg.Chem., 542, 71 (1986).[3] U. Oetliker, M. Herren, H.U. Güdel, U. Kesper, C. Albrechtand D. Reinen, J. Chem. Phys., 100, 8656-8665 (1994).
Fig. 43: Bronze reliquary cross of the “Real cross“ from anatelier in Limoges dating from the XIIIth century with anodontolite sample (n° Cl.998), exhibited in the NationalMuseum of the Middle Ages, Paris, © C2RMF. This is the firstodontolite identified on a museum object by PIXE at theC2RMF.
Fig. 44: Mn K-edge XANES spectra of: (a) fossilised ivory;(b) 600°C heated fossilised ivory; (c, d) turquoise-bluecollection odontolites and (e) synthetic apatiteBa5(PO4)2.5(MnO4)0.5Cl taken as reference mineral with Mn5+
in tetrahedral coordination. Inset: Pre-edge structure oftetrahedral Mn5+ in (b) heated fossilised ivory; in (c, d)odontolites and in (e) synthetic Ba5(PO4)2.5(MnO4)0.5Cl, areobserved at 0.9 eV and 1.9 eV below those of tetrahedralMn6+ in BaMnO4 and Mn7+ in KMnO4, respectively.
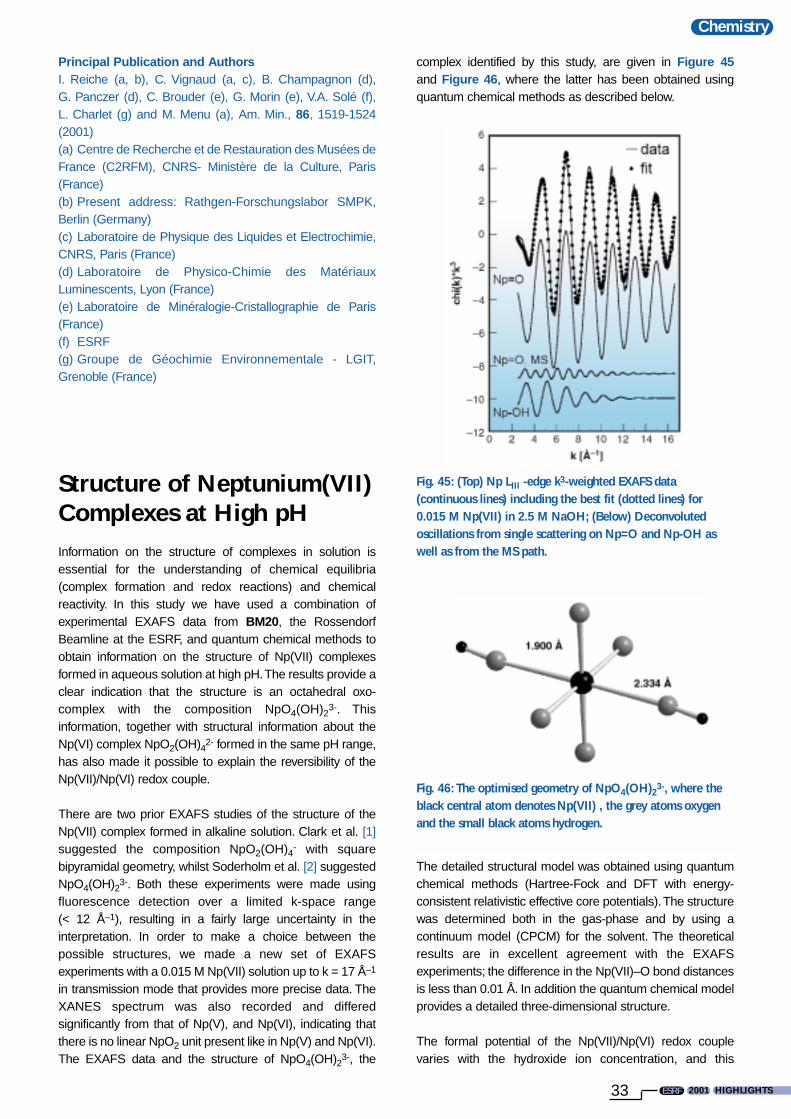
2001 HIGHLIGHTSESRF
Chemistry
33
Principal Publication and AuthorsI. Reiche (a, b), C. Vignaud (a, c), B. Champagnon (d),G. Panczer (d), C. Brouder (e), G. Morin (e), V.A. Solé (f),L. Charlet (g) and M. Menu (a), Am. Min., 86, 1519-1524(2001)(a) Centre de Recherche et de Restauration des Musées deFrance (C2RFM), CNRS- Ministère de la Culture, Paris(France)(b) Present address: Rathgen-Forschungslabor SMPK,Berlin (Germany)(c) Laboratoire de Physique des Liquides et Electrochimie,CNRS, Paris (France)(d) Laboratoire de Physico-Chimie des MatériauxLuminescents, Lyon (France)(e) Laboratoire de Minéralogie-Cristallographie de Paris(France)(f) ESRF(g) Groupe de Géochimie Environnementale - LGIT,Grenoble (France)
Structure of Neptunium(VII)Complexes at High pHInformation on the structure of complexes in solution isessential for the understanding of chemical equilibria(complex formation and redox reactions) and chemicalreactivity. In this study we have used a combination ofexperimental EXAFS data from BM20, the RossendorfBeamline at the ESRF, and quantum chemical methods toobtain information on the structure of Np(VII) complexesformed in aqueous solution at high pH.The results provide aclear indication that the structure is an octahedral oxo-complex with the composition NpO4(OH)2
3-. Thisinformation, together with structural information about theNp(VI) complex NpO2(OH)42- formed in the same pH range,has also made it possible to explain the reversibility of theNp(VII)/Np(VI) redox couple.
There are two prior EXAFS studies of the structure of theNp(VII) complex formed in alkaline solution. Clark et al. [1]suggested the composition NpO2(OH)4
- with squarebipyramidal geometry, whilst Soderholm et al. [2] suggestedNpO4(OH)23-. Both these experiments were made usingfluorescence detection over a limited k-space range(< 12 Å–1), resulting in a fairly large uncertainty in theinterpretation. In order to make a choice between thepossible structures, we made a new set of EXAFSexperiments with a 0.015 M Np(VII) solution up to k = 17 Å–1
in transmission mode that provides more precise data. TheXANES spectrum was also recorded and differedsignificantly from that of Np(V), and Np(VI), indicating thatthere is no linear NpO2 unit present like in Np(V) and Np(VI).The EXAFS data and the structure of NpO4(OH)23-, the
complex identified by this study, are given in Figure 45and Figure 46, where the latter has been obtained usingquantum chemical methods as described below.
The detailed structural model was obtained using quantumchemical methods (Hartree-Fock and DFT with energy-consistent relativistic effective core potentials).The structurewas determined both in the gas-phase and by using acontinuum model (CPCM) for the solvent. The theoreticalresults are in excellent agreement with the EXAFSexperiments; the difference in the Np(VII)–O bond distancesis less than 0.01 Å. In addition the quantum chemical modelprovides a detailed three-dimensional structure.
The formal potential of the Np(VII)/Np(VI) redox couplevaries with the hydroxide ion concentration, and this
Fig. 45: (Top) Np LIII -edge k3-weighted EXAFS data(continuous lines) including the best fit (dotted lines) for0.015 M Np(VII) in 2.5 M NaOH; (Below) Deconvolutedoscillations from single scattering on Np=O and Np-OH aswell as from the MS path.
Fig. 46: The optimised geometry of NpO4(OH)23-, where theblack central atom denotes Np(VII) , the grey atoms oxygenand the small black atoms hydrogen.

HIGHLIGHTS 2001 34ESRF
Chemistry
observation also indicates that there are two OH groupsmore in the Np(VI) complex than in the Np(VII) species.Together with the known structure of the correspondingU(VI) complex in strongly alkaline solution, UO2(OH)42-, thisobservation supports further the conclusion that the Np(VII)and Np(VI) complexes have the stoichiometry NpO4(OH)23-
and NpO2(OH)42-, respectively.
The solution structures of NpO4(OH)23- and NpO2(OH)4- areboth octahedral with fairly small differences in the Np–O andthe Np–OH distances between Np(VII) and the Np(VI). Thisis 0.07 Å for Np–O and 0.08 Å for Np–OH. NpO2(OH)4- canbe looked upon as the protonated form of NpO4(OH)23-.Thefast proton transfer reaction and the small changes in bondlength are prerequisites for fast electron transfer betweenNp(VII) and Np(VI) at an inert electrode and thereby to areversible redox potential.
References[1] D.L. Clark, S.D. Conradson, M.P. Neu, P.D. Palmer, W.Runde and C.D. Tait, J. Am. Chem. Soc. 119, 5259 (1997).[2] L. Soderholm, M.R. Antonio, C.W.Williams, J.C. Sullivan,S.R. Wasserman and J.-P. Blaudeau, J. Am. Chem. Soc.123, 4346 (2001).
Principal Publication and AuthorsH. Bolvin (a), U. Wahlgren (b), H. Moll (c), T. Reich (c),G. Geipel (c), T. Fanghänel (c) and I. Grenthe (d), J. Chem.Phys. A, 105, 11441-11445 (2001).(a) Institute of Chemistry, University of Tromsø (Norway), onleave from IRSAMC, Université Paul Sabatier, Toulouse(France).(b) Institute of Physics, Stockholm University (Sweden)(c) Institute of Radiochemistry, ForschungszentrumRossendorf e.V., Dresden (Germany)(d) Inorganic Chemistry, Department of Chemistry, RoyalInstitute of Technology (KTH), Stockholm (Sweden)

2001 HIGHLIGHTSESRF35
Soft condensed matter physics is a broadand rapidly evolving activity at the ESRF. Itaddresses questions concerning themicrostructure, kinetics, dynamics andrheology of complex materials such aspolymers, colloidal nanoparticles,macromolecules, often in 3-D or underreduced dimensionality. It involves in situprocessing, site-selective chemistry andtailoring of molecular assemblies, structuralinvestigations of thin films and membranesas well as diffraction from fibres, small unitcell systems and biological entities. Thetechniques used include micro-diffraction,time-resolved small- and wide-anglescattering (SAXS/WAXS), X-ray photoncorrelation spectroscopy and grazing-incidence techniques. Aided by constantprogress at the beamlines and ongoingrefinement of the probing techniques, onerealises that the borderlines withneighbouring disciplines such as lifesciences, surface- and interface physics,chemistry and materials science havebecome increasingly transparent.
This year, the beamlines have progressed inareas including the development of micron-and submicron sized X-ray beams,coherence-preserving optics and two-dimensional detectors with improvedspatial and temporal resolution. Importantdevelopments at ID2 were the addition ofan image-intensified CCD detector enablingsmall- and wide-angle scattering at a rate of10 images per second. This was used tostudy shear controlled polymercrystallisation and humidity-inducedstructural transitions in DNA. Thepermanent installation of the Bonse-Hartultra-small-angle X-ray scattering (USAXS)camera now allows time-resolvedmeasurements of phase transitions andgrowth kinetics in colloidal systems andlarge-scale reorganisation phenomena inpolymer networks.
At ID13 a second experimental hutch forscanning microbeam SAXS/WAXS is undercommissioning and the microgoniometer isnow routinely available for crystallographyapplications and fibre diffraction. Scanningmicrobeam diffraction from a single
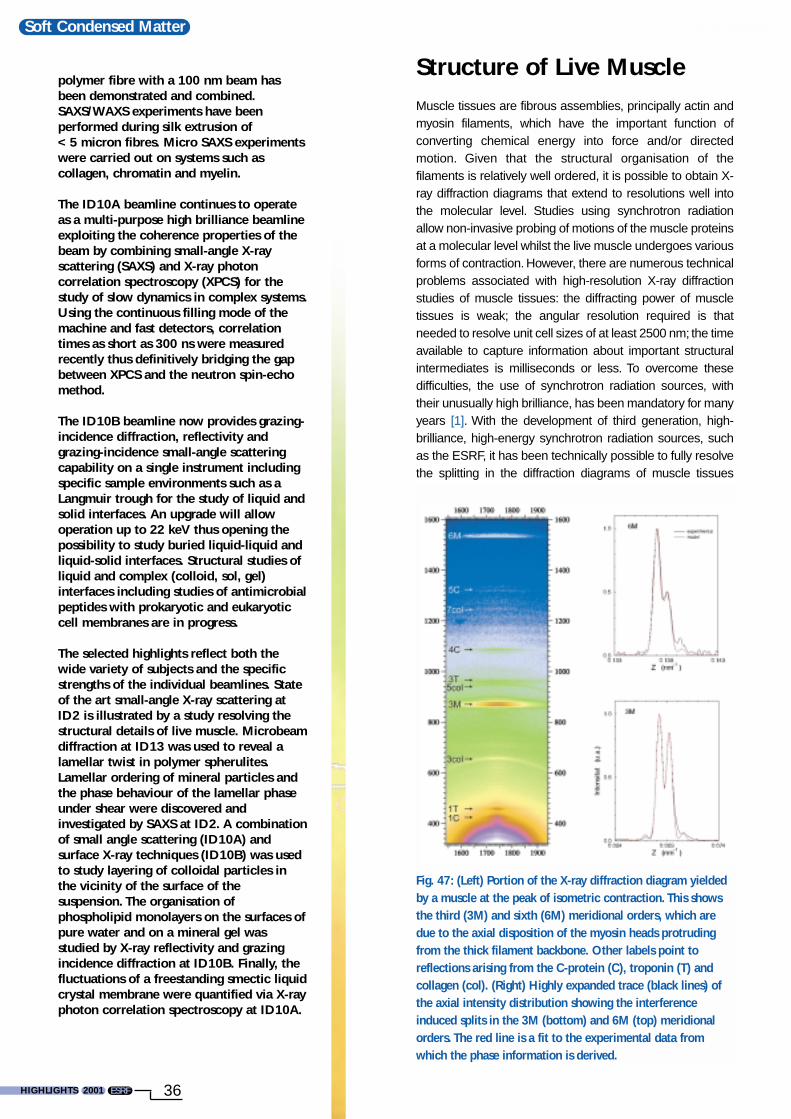
HIGHLIGHTS 2001 36ESRF
Soft Condensed Matter
polymer fibre with a 100 nm beam hasbeen demonstrated and combined.SAXS/WAXS experiments have beenperformed during silk extrusion of< 5 micron fibres. Micro SAXS experimentswere carried out on systems such ascollagen, chromatin and myelin.
The ID10A beamline continues to operateas a multi-purpose high brilliance beamlineexploiting the coherence properties of thebeam by combining small-angle X-rayscattering (SAXS) and X-ray photoncorrelation spectroscopy (XPCS) for thestudy of slow dynamics in complex systems.Using the continuous filling mode of themachine and fast detectors, correlationtimes as short as 300 ns were measuredrecently thus definitively bridging the gapbetween XPCS and the neutron spin-echomethod.
The ID10B beamline now provides grazing-incidence diffraction, reflectivity andgrazing-incidence small-angle scatteringcapability on a single instrument includingspecific sample environments such as aLangmuir trough for the study of liquid andsolid interfaces. An upgrade will allowoperation up to 22 keV thus opening thepossibility to study buried liquid-liquid andliquid-solid interfaces. Structural studies ofliquid and complex (colloid, sol, gel)interfaces including studies of antimicrobialpeptides with prokaryotic and eukaryoticcell membranes are in progress.
The selected highlights reflect both thewide variety of subjects and the specificstrengths of the individual beamlines. Stateof the art small-angle X-ray scattering atID2 is illustrated by a study resolving thestructural details of live muscle. Microbeamdiffraction at ID13 was used to reveal alamellar twist in polymer spherulites.Lamellar ordering of mineral particles andthe phase behaviour of the lamellar phaseunder shear were discovered andinvestigated by SAXS at ID2. A combinationof small angle scattering (ID10A) andsurface X-ray techniques (ID10B) was usedto study layering of colloidal particles inthe vicinity of the surface of thesuspension. The organisation ofphospholipid monolayers on the surfaces ofpure water and on a mineral gel wasstudied by X-ray reflectivity and grazingincidence diffraction at ID10B. Finally, thefluctuations of a freestanding smectic liquidcrystal membrane were quantified via X-rayphoton correlation spectroscopy at ID10A.
Life Sciences
Structure of Live MuscleMuscle tissues are fibrous assemblies, principally actin andmyosin filaments, which have the important function ofconverting chemical energy into force and/or directedmotion. Given that the structural organisation of thefilaments is relatively well ordered, it is possible to obtain X-ray diffraction diagrams that extend to resolutions well intothe molecular level. Studies using synchrotron radiationallow non-invasive probing of motions of the muscle proteinsat a molecular level whilst the live muscle undergoes variousforms of contraction. However, there are numerous technicalproblems associated with high-resolution X-ray diffractionstudies of muscle tissues: the diffracting power of muscletissues is weak; the angular resolution required is thatneeded to resolve unit cell sizes of at least 2500 nm; the timeavailable to capture information about important structuralintermediates is milliseconds or less. To overcome thesedifficulties, the use of synchrotron radiation sources, withtheir unusually high brilliance, has been mandatory for manyyears [1]. With the development of third generation, high-brilliance, high-energy synchrotron radiation sources, suchas the ESRF, it has been technically possible to fully resolvethe splitting in the diffraction diagrams of muscle tissues
Fig. 47: (Left) Portion of the X-ray diffraction diagram yieldedby a muscle at the peak of isometric contraction. This showsthe third (3M) and sixth (6M) meridional orders, which aredue to the axial disposition of the myosin heads protrudingfrom the thick filament backbone. Other labels point toreflections arising from the C-protein (C), troponin (T) andcollagen (col). (Right) Highly expanded trace (black lines) ofthe axial intensity distribution showing the interferenceinduced splits in the 3M (bottom) and 6M (top) meridionalorders. The red line is a fit to the experimental data fromwhich the phase information is derived.

2001 HIGHLIGHTSESRF
Soft Condensed Matter
37
undergoing contraction [2]. The work described here wascarried out on beamline ID2.
Thick myosin filaments adopt a polar disposition on eitherside of the so-called M-lines, which bisect the muscle cell.The myosin diffraction units thus disposed produce X-rayinterference phenomena (Figure 47) in a manner similar tothe classical two-slit interference effects.This can, of course,provide phase information from which electron density mapsof the axial disposition of the myosin heads can beconstructed giving direct structure information about thedisposition of the myosin heads during contraction.Resolution and measurement of the relative intensities of thepeaks in each cluster constituting the meridional reflectionsshows that during isometric contraction each myosin head ina crown pair has a distinct structural disposition. Given thestructure derived (Figure 48), it must be concluded that onlyone of the heads can stereo-specifically interact with the thinactin filament at any one time. This leads to the need torevise many of the assumptions usually made in theinterpretation of X-ray diffraction data, as well as opening upthe possibility to establish model-independent structuralinformation in other forms of contraction. Recent results(unpublished) have also included the determination of thestructural behaviour of the myosin heads during thetransition from isometric to isotonic contraction.
References[1] H.E. Huxley, A.R. Faruqi, J. Bordas, M.H.J. Koch andJ.R. Milch, Nature, 284, 140 (1980).[2] J. Bordas, J. Lowy, A. Svensson, J.E. Harries, G.P.Diakun, J. Gandy, C. Miles, G.R. Mant and E. Towns-Andrews, Biophys. J., 66, 99 (1995).[3] I. Rayment, W.R. Rypniewski, K. Schmidt-Base,R. Smith, D.R. Tomchick, M.M. Benning, D.A. Winkelmann,G. Wesenberg, and H.M. Holden, Science 261, 50-57(1993).
Principal Publication and AuthorsJ. Juanhuix (a), J. Bordas (a), J. Campmany (a),A. Svensson (b), M.L. Bassford (b) and T. Narayanan (c),Biophys. J. 80, 1429 (2001).(a) Laboratori de Llum Sincrotro, Campus UniversitatAutonoma de Barcelona, Bellaterra (Spain)(b) Department of Physics and Astronomy, LeicesterUniversity (UK)(c) ESRF
Lamellar Twist in Poly(3-hydroxybutyrate) SpherulitesMorphology influences most technological properties ofpolymer materials. The study of morphological aspects ofmacromolecular materials is therefore relevant to materialapplications. Polymers tend to crystallise from the melt withspherulitic morphology. Spherulites are polycrystallineaggregates with spherical symmetry constituted of ribbon-like crystals (lamellae) that grow outwards from a centralnucleus. Some polymer spherulites, when observedbetween crossed polarisers in an optical microscope, showconcentrical extinction bands. Investigation of structuraldetails in banded spherulites at the micron level by means ofX-ray diffraction has been severely limited in the past by theunavailability of small enough X-ray beams.
Poly(3-hydroxybutyrate), PHB, is a natural polyester thateasily develops a high degree of crystallinity and forms largebanded spherulites upon isothermal crystallisation from themelt at high temperature. An insight into structural variationswithin banded PHB spherulites was recently obtained at theESRF by investigating a 300 µm x 300 µm area of apractically two-dimensional spherulite portion, usingmicrofocus X-ray diffraction [1]. The results showed a closecorrelation between the observed structural changes andthe morphological features responsible for banding.
In the present experiment, PHB was isothermally crystallisedunder the constraint of two parallel surfaces at 140°C,obtaining a spherulite section with very wide extinction bands(band spacing 120 µm). The microfocus ID13 beamline wasused to analyse a 300 µm segment along the radius of thespherulite.The sample was tracked across the incident beamin 3 µm steps in order to collect a large number of diffractionpatterns inside each band. Figure 49 shows the polarisedoptical micrograph of the PHB spherulite investigated bymicrofocus X-ray diffraction. The radial segment analysed ishighlighted in the micrograph. The 100 X-ray diffractionpatterns collected during the radial scan are shown in thebackground of Figure 49. It is quite clear that the same typeof pattern appears two/three times at different positions alongthe scan, indicating a radial periodicity in the spherulitemicrostructure.The frames highlighted in pink and green (see
Fig. 48: Experimentally determined electron densitydistribution corresponding to the axial mass projection of thepair of myosin heads in a crown (circles). The line is thederived electron density distribution from the structure shownin the left panel [3]. Note that in the muscle the myosinfilament backbone runs vertically on the right hand side ofthis representation; the double helix formed by the actinfilament would run vertically on the left hand side.

HIGHLIGHTS 2001 38ESRF
Soft Condensed Matter
magnification) represent the two limit patterns.The reflectionsin each of the 100 frames collected were indexed and the unitcell orientation at each point was determined. Figure 50shows the change of intensity of reflections (020) and (002)while moving from frame to frame during the radial X-rayscan.The intensity of both reflections shows a periodicity thatperfectly reproduces the band spacing derived from opticalmicroscope observations (120 µm). The great number ofdiffraction patterns collected inside each band of the PHBspherulite by the microfocus X-ray technique yieldsconclusive evidence that during lamellar growth the unit cellsmoothly rotates around the radially-oriented a-axis [2].
References[1] M. Gazzano, M.L. Focarete, C. Riekel and M. Scandola,Biomacromolecules, 1, 604-608 (2000).[2] M. Gazzano, M.L. Focarete, C. Riekel, A. Ripamonti andM. Scandola, Macromol. Chem. Phys., 202, 1405-1409(2001).
AuthorsM. Gazzano (a), M.L. Focarete (b), C. Riekel (c),A. Ripamonti (b) and M. Scandola (a,b).(a) CSFM, CNR, Bologna (Italy)(b) Universita' di Bologna (Italy)(c) ESRF
A Mineral Liquid-CrystallineLamellar PhaseNanometre-scale ordering is well known to appearspontaneously when anisotropic organic moieties formliquid-crystalline phases. Though much less common, thisbehaviour is also observed for suspensions of anisotropicmineral nanoparticles and its study is currently a challengingand active research area in materials science [1-3]. In thiscontext, we have recently discovered that the low-dimensional layered solid state compound H3Sb3P2O14 canbe exfoliated in water to yield homogeneous, transparentsuspensions of extended covalent sheets. Moreover, wefound that these suspensions form a liquid-crystallinelamellar phase in a wide range of volume fractions φ(Figure 51). In this phase, the mineral extended sheets areparallel and regularly stacked. In a small-angle X-ray
scattering experiment on the ID2 beamline, a series of sharppeaks are observed and they can be indexed to the (00l)reflections of a lamellar structure (Figure 52). Experimentson very dilute suspensions show that the form factor of theparticles is the one of 2-dimensional (2-D) planar objects of
Fig. 49: Polarised optical micrograph of the investigated PHBspherulite (left). To the right, the 100 patterns registered alongthe yellow line. The coloured spots indicate the positionswhere the evidenced patterns were taken.
Fig. 50: Normalised intensities of reflections (0 2 0) and(0 0 2) as a function of the distance from the origin of thescanned segment (see Figure 49).
Fig. 51: Test tubes observed between crossed polarisers (a-f),the isotropic phase in (c) and (d) appears dark: (a) Lamellargel phase (φ = 1.98 %), (b) Lamellar fluid phase (φ = 0.93 %),(c) Biphasic sample (φ = 0.65 %), (d) Biphasic sample(φ = 0.03 %), (e) and (f) Magnetically aligned sampleobserved in two different orientations of the polariser-analysersystem, (g) Sample iridescence (φ = 0.75 %) observed innatural light due to light scattering by the lamellar phase ofperiod d = 225 nm.
Fig. 52: SAXS intensity curve of “powder” samples versusscattering vector modulus q, showing reflections up to thetenth order due to the lamellar period. Inset: Thin diffractionlines observed at wide angles.

2001 HIGHLIGHTSESRF
Soft Condensed Matter
39
at least 300 nm diameter. Wide-angle X-ray diffractionexperiments show the existence of fairly thin diffraction lineswhich prove that the covalent sheets keep their (2-D) long-range atomic positional order even at high dilution (Figure 52inset).Therefore, the mineral lamellar phase is very differentfrom its organic counterparts that are usually comprised ofliquid layers at such dilutions.
The lamellar period d increases as the volume fractiondecreases, i.e. as more water is inserted between themineral sheets. The lamellar phase can actually be swollento a very large extent. It remains stable down to φ ≈ 0.75 %where the lamellar period reaches 225 nm, to be comparedwith the covalent sheet thickness of only 1 nm. Thus, d canbe continuously tuned from 1.5 to 225 nm.When φ< 0.75 %,the suspensions are biphasic with a clear interface betweenthe birefringent lamellar phase and an isotropic phase. Thisbehaviour is indeed expected for the swelling of a lamellarphase: once the maximum swelling is reached, watermolecules can no longer be inserted into the interlamellarspace and excess water is expelled, leading to phaseseparation. Adding salt to the system leads to a decrease ofthe maximum lamellar period and to flocculation, whichstrongly suggests that electrostatic interactions areresponsible for the thermodynamic stability of the liquidcrystal.
This mineral lamellar phase can be very well oriented bymechanical shearing in a Couette cell mounted on thebeamline, resulting in a very anisotropic scattering pattern(Figure 53). The mineral sheets are then aligned parallel tothe shearing surfaces, as expected intuitively. This strongalignment was induced even at a very low shear rate anddoes not relax when the shearing is stopped. The lamellarphase can also be aligned by applying a strong magneticfield as the mineral sheets then orient their normal parallel tothe magnetic field. This property can be used to induce thepartial alignment of dissolved biomolecules. This phase,which has neither 13C nor 1H when prepared in D2O, seemsparticularly promising for the structural determination byliquid-state NMR of non-labelled biomolecules.
References[1] For a review, see: J.-C.P. Gabriel and P. Davidson, Adv.Mat., 12, 9 (2000).[2] A.B.D. Brown, C. Ferrero, T. Narayanan and A.R. Rennie,Eur. Phys. J. B, 11, 481 (1999).[3] F.M. van der Kooij, K. Kassapidou and H.N.W.Lekkerkerker, Nature, 406, 868 (2000).
Principal Publication and Authors J.-C.P. Gabriel (a), F. Camerel (a), B.J. Lemaire (b),H. Desvaux (c), P. Davidson (b) and P. Batail (a), Nature,413, 504 (2001).(a) FRE 2068 CNRS, Nantes (France)(b) UMR 8502 CNRS, Orsay (France)(c) URA 331 CEA/CNRS, Saclay (France)
Layering of SphericalParticles at the Air/WaterInterfaceThe liquid/vapour interface is well known in everyday life.Less well known is that interesting ordering phenomena canoccur in the vicinity of such an interface. These phenomenaappear as a consequence of the abrupt truncation of themedia by the interface. We have investigated a suspensionof colloidal silica particles in water. SAXS (small-angle X-rayscattering) data taken at beamline ID10A on bulk samplesindicate that the sample consists of randomly distributed“hard-sphere” like particles with an effective radius ofR = 175 Å. The air/liquid interface of the sample wascharacterised by X-ray reflectivity and GISAXS (grazingincidence small angle X-ray scattering) at ID10B.
X-ray reflectivity profiles taken on a concentrated sample, adilute sample, and on the water solvent are shown inFigure 54. The curves for the dilute sample and water areindistinguishable. They can be perfectly fitted with Fresnelreflectivity profiles (solid lines) multiplied by a Debye-Wallerterm to account for the "fuzziness" of the interface caused bythermally excited capillary waves. The curve for the
Fig. 53: SAXS 2-D scattering pattern of a sample sheared in aCouette cell, in the “tangential” geometry (d = 175 nm).
Fig. 54: X-ray reflectivity profiles of the concentrated (blue)and dilute sample (red), and of the water solvent (green). Thered and green curves have been offset by one and twodecades, respectively. The scattering length profile of theconcentrated sample is modelled by three gaussians asindicated by the inset in the figure.

HIGHLIGHTS 2001 40ESRF
Soft Condensed Matter
concentrated sample shows pronounced deviations fromthis simple behaviour. The larger critical angle reflects theincreased scattering length density (SLD) of the sample andthe oscillations of the profile indicate a varying SLD alongthe surface normal direction (z direction). The Parrattformalism was used to model the X-ray reflectivity profile(solid line) and the corresponding SLD profile is shown in theinset of Figure 54.This result indicates a layering of particlesparallel to the interface.
GISAXS was performed to probe the lateral arrangement ofparticles near the surface for both the dilute and theconcentrated sample. The ratio of the two profiles defines a“GISAXS structure factor” for the concentrated sample. Thepeak position and width of the GISAXS structure factorindicates a distance D = 570 Å between particles at thesurface, and a similar correlation length This shows that thelateral arrangement of particles at the surface is random, likein the bulk. The simplest possible model for the particleorganisation near the surface is shown in Figure 55. With D= 570 Å and R = 175 Å, we find z0 = 277 Å (see Figure 55)which is close to the distance between the surface and theposition of the first peak in the SLD profile (Figure 54, inset).Hence, in this model the particles are touching the interfacewith their perimeter and the oscillating SLD profile indicatesthe presence of particle layers that do overlap.
Principal Publication and AuthorsA. Madsen, O. Konovalov, A. Robert and G. Grübel, Phys.Rev. E., 64, 061406 (2001).ESRF
Free and Lipid-coveredWater and Gel SurfacesThe surface properties of gels are largely unexplored. Wehave studied phospholipid monolayers on the surface ofaqueous clay gels, which, beside their fundamental interest,have also many industrial applications. Our idea was toinvestigate the free and lipid-covered surface of a liquid solundergoing a sol-gel transition. Strong effects are expectedon the monolayer structure since the 2-D system will now becoupled to a 3-D substrate of increasing viscoelasticity. Weobtained for the first time detailed structural information onfree sol and gel surfaces and on the 2-D ordering ofphospholipid monolayers deposited on these phases.
The free surfaces of montmorillonite sol and gel phaseswere examined using X-ray specular reflectivity. Thereflectivity profiles for water, sol and gel phases exhibitsmooth structureless decays, as shown in Figure 56, andreveal that their surfaces are indistinguishable down toatomic length scales. The solid line is a fit to the data,assuming a simple refractive index step between air and thesubphase smeared by a roughness of 3.4 Å. As the sol andgel surfaces exhibit a molecular flatness which is preservedthrough the sol-gel transition, a deposition of an amphiphiliclipid layer was attempted to examine the effect of“solidification” on the organisation of this bidimensionalsystem. The experimental reflectivity curves for the DSPCphospholipid on water and on the gel phase are also shownin Figure 56. On both substrates, well-contrasted fringepatterns could be observed. The period of the fringes in thecase of the gel is however shorter than in the case of water.The data indicate a single adsorption layer of mineral discsunderneath the lipid headgroups that is induced byelectrostatic interactions between the anionic silicateparticles and the cationic tip of the DSPC headgroup(Figure 57). Electrostatic interactions induce a re-orientationof the lipid headgroup conformation and a reduction of thetilt angle of the lipid chains as indicated in Figure 57. Thisinterpretation was confirmed by grazing incidence diffractionexperiments.
Such an adsorption mechanism is backed by another seriesof experiments using another lipid, DPPA, bearing anegatively charged headgroup. In this case, no evidence forthe formation of a surface layer of mineral discs can beextracted from the reflectivity curves (Figure 56, inset).Repulsive interactions between mineral particles and DPPA“push” the head groups toward the water surface causing anincrease of tilt angle t of the chains (Figure 57).
Using X-ray surface techniques, we have shown that the freesurface of a montmorillonite gel is of the same quality as awater surface. We have also demonstrated that the
Fig. 55: Model for the spatial arrangement of colloidalnanoparticles near the air/water interface.
Fig. 56: X-ray reflectivity curves: ( ) free surfaces of water soland gel are identical; () DSPC monolayer on water; (O)DSPC monolayer on gel; (Inset) Reflectivity curves of DPPAon water () and DPPA on gel substrate (O).

2001 HIGHLIGHTSESRF
Soft Condensed Matter
41
deposition of an appropriate amphiphilic monolayer on amontmorillonite gel surface induces the formation of a layerof mineral discs aligned parallel to the lipid-covered surface.This lipid/mineral double layer may act as a barrier for thepermeation of various external species into the subphasebut also makes the aqueous interface hydrophobic andsustained by a solid-like gel substrate.
Principal Publication and Authors:B. Struth(a), F. Rieutord (b), O. Konovalov (a), G. Brezesinski(c), G. Grübel (a) and P.Terech (b), Phys. Rev. Lett., in print.(a) ESRF(b) UMR 5819 CEA-CNRS-Université J. Fourier, Grenoble(France)(c) Max-Planck Institute of Colloids and Interfaces, Golm(Germany)
Smectic Membranesin MotionAlthough liquid crystals have been known since the end ofthe 19th century, they continue to surprise us with theirvariety of low-dimensional phases and phase transitions. Inthe smectic-A phase, the elongated molecules areorganised in stacks of liquid layers in which the longmolecular axes are, on average, parallel to the layer normal.Hence a periodic structure exists in one dimension while thesystem remains fluid in the other two directions.The reduceddimensionality of the translation order leads to strongthermal fluctuations of the layers, with their mean-squaredisplacements diverging logarithmically with the samplesize. Smectic liquid crystals can be suspended over anopening in a solid frame.The surface area of such a smecticmembrane can be as large as several cm2, while thethickness can be varied from thousands of layers (tens ofµm) down to two layers (about 5 nm). Smectic membranesconstitute ideal model systems to investigate fundamentalaspects of fluctuations. The finite thickness changes thecontinuous bulk response spectrum into discrete responsemodes. The dynamics of these fluctuations are accessibleby coherent X-ray scattering.
The work has been carried out at beamline ID10A. Smecticmembranes were mounted in a horizontal scatteringgeometry (Figure 58) and illuminated by a small, 10 µm insize, partially coherent, 8 keV X-ray beam. If coherentradiation is incident on a random medium, the scatteredintensity shows a speckle pattern that reflects theinstantaneous arrangement of the scattering centres.Information about the dynamics of the scatterers isaccessible by X-ray photon correlation spectroscopy(XPCS), in which the time dependent intensity auto-correlation function of the speckle pattern is measured. Theexperiments were performed in the uniform filling mode ofthe ESRF storage ring; by applying fast avalanchephotodiode detectors, a technical lower cut-off of ~ 40-50 nsof the correlation functions was obtained. In principle, thisnumber can be reduced to a few ns, the limit being given bythe 2.8 ns electron bunch-to-bunch interval in the storagering. Early XPCS measurements of smectic membranesemploying soft X-rays indicated an exponential decay of the
Fig. 57: Model for the organisation of phospholipidmonolayers on water and gel substrates together with thecorresponding density profiles: (Top) DSPC monolayer at theair/water interface, t is the tilt angle of the chains; (Middle)DSPC monolayer at the montmorillonite gel/air interface;(Bottom) DPPA monolayer at the montmorillonite sol-gel/airinterface.
Fig. 58: Schematic scattering configuration for experiments onfluctuating smectic membranes.

HIGHLIGHTS 2001 42ESRF
Soft Condensed Matter
correlation functions with a relaxation time in the range oftens of µs [1]. The XPCS setup described here allowsobservation of relaxation times well below 1 µs. In addition tothe exponential decay of the correlation function, anoscillatory regime of fluctuation damping was observed forthin membranes (Figure 59). Thanks to the perfect matchbetween the millidegree mosaicity of the membranes(Figure 59, inset) and the high resolution of the setup, countrates up to 150 MHz were reached. This facilitated XPCS
measurements at off-specular positions by rocking thesample, which leads to disappearance of the oscillatorydamping. The correlation functions were fitted to theexpression aS2(t) + b, where S(t) is the dynamic structurefactor. The results are shown as the full lines in Figure 59and are in good agreement with recent theoreticalpredictions [2]. These experiments open a new area forstudying fast relaxations, particularly for complex membranesystems relevant to life sciences.
References[1] A.C. Price, L.B. Sorensen, S.D. Kevar, J. Toner,A. Ponierewski and R. Holyst, Phys. Rev. Lett., 82, 755-758(1999).[2] A.N.Shalaginov and D.E.Sullivan, Phys.Rev.E, 62, 699-710 (2000).
Principal Publications and AuthorsA. Fera (a), I.P. Dolbnya (b), G. Grübel (c), H.G. Muller (a),B.I. Ostrovskii (a, d), A.N. Shalaginov (e) and W.H. de Jeu(a), Phys. Rev. Lett., 85, 2316 (2000); I. Sikharulidze (a),I.P. Dolbnya, A. Fera, A. Madsen (c), B.I. Ostrovskii andW.H. de Jeu, Phys. Rev. Lett. (in press).(a) FOM-Institute for Atomic and Molecular Physics,Amsterdam (The Netherlands)(b) DUBBLE CRG, ESRF(c) ESRF(d) Institute of Crystallography, Moscow (Russia)(e) University of Guelph, Guelph (Canada)
Fig. 59: Autocorrelation functions of 2.83 µm thick membraneof the compound FPP at the specular position (1) and at off-specular positions (2, 3); (Inset) Rocking curve around theBragg position with the various settings. Curves 1 and 2 areshifted for clarity (by 0.2 and 0.1, respectively).

2001 HIGHLIGHTSESRF43
Highly brilliant X-rays are essential formany of the powerful techniques that allowthe routine study of surfaces and interfaces.While the pioneering work in surfacediffraction was focussed on clean surfacesunder ultra-high vacuum conditions, buriedsurfaces have gained interest in morerecent work, mainly due to the fact thatsuch interfaces are closer to those in realapplications. Nonetheless, the classicaltechnique of crystal truncation rod analysiscan still be exploited for buried interfacesas well as for fluorescence analysis duringstanding wave excitation. The idealmethods for studying complex near-surfacestructures involve scattering techniques atgrazing incidence and exit angles. Thesetechniques, grazing-incidence diffraction(GID) and grazing-incidence small-anglescattering (GISAXS), have been developedby several groups taking advantage of thehigh brilliance of the ESRF's X-rays. Since awide range of length scales can be studied,from the atomic to the micrometre scale,both parallel and perpendicular to theinterfaces, these techniques are ideallysuited to the characterisation of samplesrelevant for future developments in nano-technology.
There are several beamlines at the ESRFwhere such experiments can be performed.The newly formed ESRF group “Surface andInterface Science”, constituted by thebeamlines ID1, ID3 and ID32, provides allthe above mentioned techniques and awide variety of relevant sampleenvironments. ID1 is especially well suitedfor the grazing-incidence techniques, bothGID and GISAXS, which can be performedsimultaneously without the necessity ofremounting the sample and in combinationwith anomalous scattering. At the SurfaceDiffraction beamline ID3, an improvementon the monochromator has been veryrecently implemented which would allowfor increased flux at the sample. In additionto the “traditional” surface crystallographywork, studies of dynamic processes and ofsurface magnetism are performed in theUHV end-station. At ID32, diffraction(XSW - X-ray standing waves) and X-rayphotoelectron spectroscopy (XPS) can be

HIGHLIGHTS 2001 44ESRF
Surfaces, Interfaces and Nano-science
combined. An electron energyanalyser can be used for up to 4800 eV kinetic energies ofthe electrons. The surfacecharacterisation laboratory at ID32is now in full operation, with severalultra-high vacuum machines, ascanning tunnelling microscope andtransfer chambers to thediffractometer. In addition, thebeamline ID10B is available forsurface and interface studies usinggrazing incidence techniques. This isa multipurpose device allowing fornear-surface structural studies ofsolid and liquid interfaces thanks toa deflector that declines the beamdownwards.
The following reports highlight theresearch done at the ESRF during thepast year. The first contributionrepresents pioneering work infundamental research showing theimportance of non-dipolar effects inXPS for the proper analysis of XSWand high energy X-rayphotoemission data. In the twosuccessive studies from ID3,measurements of crystal truncationrods have been used to study thetransition from a clean to a coveredsurface in order to investigate thepossible structural changes of theburied interfaces. Approaching nowthe physics on the nanometre scale,the next contribution deals withstructural changes following laserexcitation. In the present case, thetimescale, which is limited by the X-ray pulse length, was reduced toan unprecedented 25 ps whichdemonstrates the unique potentialfor time-resolved measurements atID9. The last three examples usegrazing-incidence methods to studynano-structured materials. First,multilayers consisting of a periodicstack of bilayers with magnetic andnonmagnetic material have beeninvestigated. GISAXS, specularreflectivity and GID have beencombined to study the structure ofthe multilayer in order to confirmthat the predicted electronchannelling was not an artefact ofthe crystal perfection. In the nextcontribution the authors report onthe self-organisation of the stackingof GaN quantum dots embedded inAlN. This material is interesting foroptical applications in the blue-
ultraviolet wavelength range. AgainGISAXS and GID are shown to beideally suited for thecharacterisation of the internalstructure of quantum dotmultilayers. Finally, exit-angle-resolved GID measurements areused to investigate the re-orientationof micro-channels in thin zeolitefilms on Si wafers as a function ofthe film thickness.
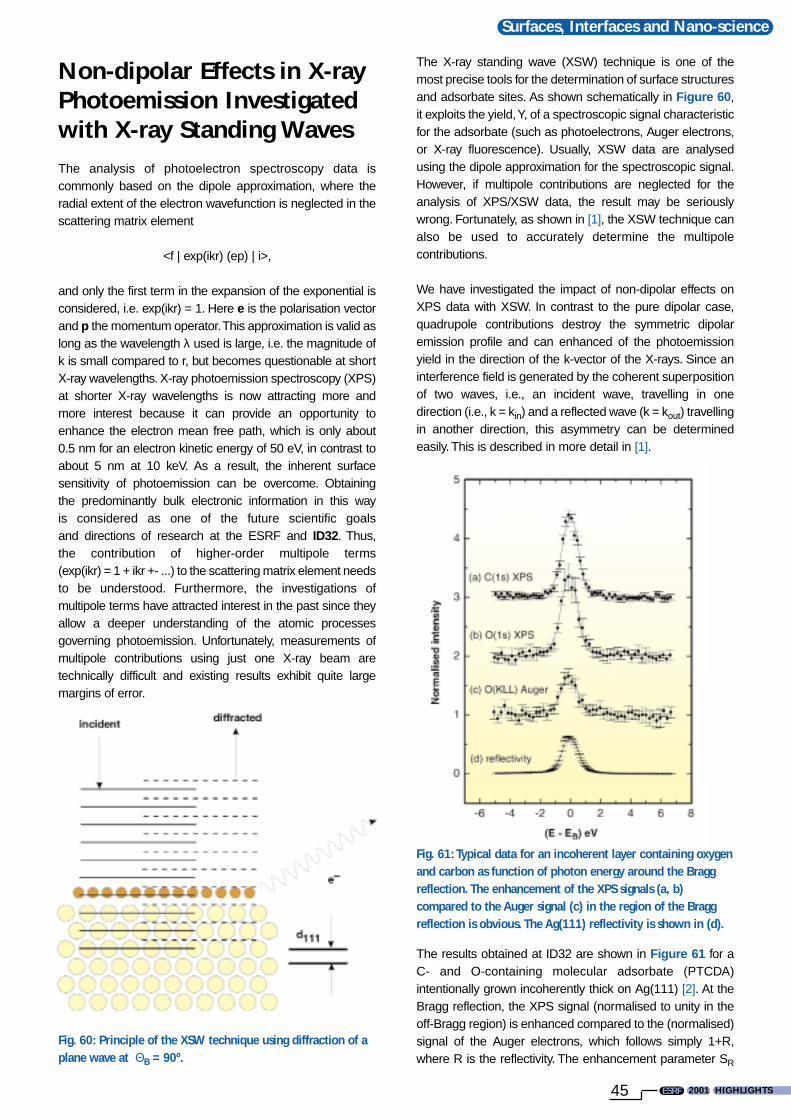
2001 HIGHLIGHTSESRF
Surfaces, Interfaces and Nano-science
45
Non-dipolar Effects in X-rayPhotoemission Investigatedwith X-ray Standing WavesThe analysis of photoelectron spectroscopy data iscommonly based on the dipole approximation, where theradial extent of the electron wavefunction is neglected in thescattering matrix element
<f | exp(ikr) (ep) | i>,
and only the first term in the expansion of the exponential isconsidered, i.e. exp(ikr) = 1. Here e is the polarisation vectorand p the momentum operator.This approximation is valid aslong as the wavelength λ used is large, i.e. the magnitude ofk is small compared to r, but becomes questionable at shortX-ray wavelengths. X-ray photoemission spectroscopy (XPS)at shorter X-ray wavelengths is now attracting more andmore interest because it can provide an opportunity toenhance the electron mean free path, which is only about0.5 nm for an electron kinetic energy of 50 eV, in contrast toabout 5 nm at 10 keV. As a result, the inherent surfacesensitivity of photoemission can be overcome. Obtainingthe predominantly bulk electronic information in this wayis considered as one of the future scientific goalsand directions of research at the ESRF and ID32. Thus,the contribution of higher-order multipole terms(exp(ikr) = 1 + ikr +- ...) to the scattering matrix element needsto be understood. Furthermore, the investigations ofmultipole terms have attracted interest in the past since theyallow a deeper understanding of the atomic processesgoverning photoemission. Unfortunately, measurements ofmultipole contributions using just one X-ray beam aretechnically difficult and existing results exhibit quite largemargins of error.
The X-ray standing wave (XSW) technique is one of themost precise tools for the determination of surface structuresand adsorbate sites. As shown schematically in Figure 60,it exploits the yield, Y, of a spectroscopic signal characteristicfor the adsorbate (such as photoelectrons, Auger electrons,or X-ray fluorescence). Usually, XSW data are analysedusing the dipole approximation for the spectroscopic signal.However, if multipole contributions are neglected for theanalysis of XPS/XSW data, the result may be seriouslywrong. Fortunately, as shown in [1], the XSW technique canalso be used to accurately determine the multipolecontributions.
We have investigated the impact of non-dipolar effects onXPS data with XSW. In contrast to the pure dipolar case,quadrupole contributions destroy the symmetric dipolaremission profile and can enhanced of the photoemissionyield in the direction of the k-vector of the X-rays. Since aninterference field is generated by the coherent superpositionof two waves, i.e., an incident wave, travelling in onedirection (i.e., k = kin) and a reflected wave (k = kout) travellingin another direction, this asymmetry can be determinedeasily. This is described in more detail in [1].
The results obtained at ID32 are shown in Figure 61 for a C- and O-containing molecular adsorbate (PTCDA)intentionally grown incoherently thick on Ag(111) [2]. At theBragg reflection, the XPS signal (normalised to unity in theoff-Bragg region) is enhanced compared to the (normalised)signal of the Auger electrons, which follows simply 1+R,where R is the reflectivity. The enhancement parameter SR
Fig. 60: Principle of the XSW technique using diffraction of aplane wave at ΘB = 90º.
Fig. 61: Typical data for an incoherent layer containing oxygenand carbon as function of photon energy around the Braggreflection. The enhancement of the XPS signals (a, b)compared to the Auger signal (c) in the region of the Braggreflection is obvious. The Ag(111) reflectivity is shown in (d).

HIGHLIGHTS 2001 46ESRF
Surfaces, Interfaces and Nano-science
of the XPS signal, which is about 1.8 for the present case,i.e., Y = 1 + SR R, directly reflects the quadrupolecontributions and exemplifies the sensitivity of the XSWtechnique to the higher order terms in the scattering matrixelement.
A comparison of these parameters with quantummechanical calculations is presently in progress. Obviously,the non-dipolar contributions can be significant, and theirknowledge is crucial for a proper analysis of XSW and forhigh-energy X-ray photoemission data. In the present study,we only determined the amplitude of the multipole matrixelement. Additionally, by employing the unique properties ofXSWs with a defined phase relationship between incidentand reflected wave, it is possible to determine both theamplitude and the phase of quadrupole contributions in thephotoelectric scattering process, which have not beenaccessed at all with any other method. This is the subject ofongoing experiments.
References[1] I.A. Vartanyants and J. Zegenhagen, Solid. State.Comm., 113, 299 (1999).[2] F. Schreiber, K.A. Ritley, I.A. Vartanyants, H. Dosch,J. Zegenhagen and B.C.C. Cowie, Surf. Sci. Lett., 486, L519(2001).
Principal Publication and AuthorsF. Schreiber (a), K.A. Ritley (a), I.A. Vartanyants (a, b),H. Dosch (a), J. Zegenhagen (c) and B.C.C. Cowie (c), Surf.Sci. Lett., 486, L519 (2001).(a) ITAP, Universität Stuttgart, and MPI-MF, Stuttgart(Germany)(b) Institute of Crystallography RAS, Moscow (Russia)(c) ESRF
Structure of the CleanNiAl(110) Surface and theAl2O3/NiAl(110) InterfaceSurfaces and interfaces possess properties that areimportant to a wide range of practical applications. Due tothe abrupt changes in structure and bonding, a variety ofnew and sometimes unexpected physical phenomena areobserved. Interfaces are buried and inaccessible to themajority of surface-sensitive techniques. However, becauseof the macroscopic penetration depth of X-rays, bothsurfaces and interfaces scatter in a similar way and give riseto diffraction features along the crystal truncation rods(CTR’s) perpendicular to the surface. Here we report ongrazing incident X-ray diffraction GID measurements forcharacterisation of the structure of the clean NiAl(110)surface and the Al2O3/NiAl(110) interface.
The experiments were carried out at beamline ID3. Theclean NiAl(110) surface was prepared by repeated cycles ofAr+ sputtering and annealing. The surface quality wasinferred from the CTR’s widths along the reciprocal space Hand K directions.The domain sizes ranged between 500 and800 Å. The Al2O3/NiAl(110) sample was prepared byrepeated cycles of oxygen doses on NiAl(110) at roomtemperature and subsequent annealing [1]. This procedurewas repeated until there was no further increase in theintensity of the superstructure reflections from the oxide filmsand no further decrease in the angular width.
The measured CTR's were fitted by a least squaresrefinement using a model with four NiAl layers forming theirrespective surface cells. The best-fit procedure for the cleanNiAl(110) surface was performed considering isotropictemperature dependence and a 1:1 compositionalstoichiometry between Ni and Al as in the bulk. The resultsare shown schematically in Figure 62a.The topmost ripplingamplitude obtained from this fit is RNi/Al = 0.16 ± 0.01 Å,which is significantly smaller than the value RNi/Al = 0.22 Åpreviously reported [2]. The topmost Al and Ni atoms move4.6 % outwards and 3.4 % inwards, respectively. Thedependence of the rippling amplitude with non-structuralparameters, such as anisotropic vibrations or chemicaldisorder, was also carefully checked. It remains practicallyunchanged. The second, third and fourth atomic layersexhibit almost negligible relaxations.
An identical analysis was made for the Al2O3/NiAl(110)interface. Figure 63 shows schematically the results of thebest-fit procedure for the (0,1), (1,0) and (1,1) measuredCTRs. Due to the non-commensurability of the thin Al2O3
film with the substrate, the oxide unit cell could be omittedduring the fit refinement procedure [1]. The resultingrippling amplitude of the topmost interface layer wasRNi/Al = 0.18 ± 0.02 Å. In the topmost substrate layer, the Alatoms move 7 % outwards while Ni atoms move 2% inwards
Fig. 62: Schematical side view projection of best-fit results for(a) the NiAl(110) surface and (b) the Al2O3/NiAl(110)interface, showing the rippling of the topmost surface layer.The atomic arrangement in the oxide structure has not yetbeen determined.

2001 HIGHLIGHTSESRF
Surfaces, Interfaces and Nano-science
47
similar to the clean surface (Figure 62b). No preferentialsegregation into the surface was detected. The surfaceroughness did not increase with the formation of an oxidefilm. This rules out any reconstruction of the top substratelayer.The Al2O3/NiAl(110) interface appears to be atomicallyabrupt and on the alloy side terminated by Al. No enrichmentof Ni could be detected in the X-ray structure analysis. Thisagrees with theoretical calculation [3], where the Al atoms aresupplied by exchange of Ni and Al in the top layers andsubsequent dissolution of Ni into the bulk by segregation ofNi vacancies. In order to study the thickness of the oxide layerand the projected electron density along the z-direction theextended reflectivity up to l = 3.8 has been measured. Anoxide layer thickness of 5.8 ± 0.1 Å is obtained from best-fitprocedure of the extended reflectivity (Figure 62b). This is inagreement with Al-O-bilayers sequences, with Al at thesubstrate side and O-termination at the vacuum side.
References[1] R. Franchy, Surface Science Reports, 38, 195 (2000).[2] H.L. Davis and J.R. Noonan, Phys. Rev. Lett., 54, 566(1985).[3] A.Y. Lozovoi, A. Alavi, and M.W. Finnis, Phys. Rev.Letters, 85, 610 (2000).
Principal Publication and AuthorsX. Torrelles (a), F. Wendler(b), O. Bikondoa (c, d), H. Isern(c), W. Moritz(b) and G.R. Castro (c, d), Surface Science,487, 97 (2001).(a) Institut de Ciència de Materials de Barcelona, C.S.I.C.,Bellaterra (Spain)(b) Institut für Kristallographie und Angew. Mineralogie,Univ. München (Germany)(a) SpLine, Spanish CRG Beamline, ESRF(b) Instituto de Ciencia de Materiales de Madrid, C.S.I.C.,Madrid (Spain)
The Adsorption of CarbonMonoxide on Ni(110)Above Atmospheric PressureInvestigated with Surface X-ray DiffractionSince the discovery in the nineteenth century that some gasmolecules adsorbed onto a metal surface are readilyconverted into other molecules, heterogeneous catalysishas achieved tremendous technological, environmental,and commercial importance. Understanding the gas-metalinteraction by determining the structures of adsorbedmolecules is a primary goal of modern surface science. Theadsorbate geometry of gases on metal surfaces has thusbeen determined and catalogued for more than onethousand systems under the extreme vacuum conditions of10-8 - 10-14 bar where appropriate techniques wereavailable. As most of the commonly employed techniques forsurface structure determination involve electrons (e.g.electron diffraction, photoemission) they are not suitable forinvestigating gas/solid interfaces at pressures nearatmospheric. Consequently, an essential question remainedunanswered: "Are the known vacuum structures also therelevant structures present under real catalytic conditionsnear 1 bar?"
Here, we answer that question affirmatively (at roomtemperature) and negatively (at elevated temperature) forthe archetypal case of CO over Ni(110). Based on X-raydiffraction measurements, the CO/Ni(110) structure wasdetermined in situ from 10-10 to 2.3 bar CO at 25°C.Interestingly, the vacuum structure persisted unchangedover ten orders of magnitude of pressure. A subsequentwarming to ~ 130°C at 2.3 bar then caused a massiverestructuring of the Ni surface consisting of the developmentof microfacets with (111) orientation and surface strainprobably due to carbon dissolution. These results confirmthe relevance of vacuum studies to catalysis and offer aglimpse at the complexity of elevated-pressure surfacechemistry.
Nickel catalysts are used most frequently to producemethane from carbon monoxide and hydrogen, attemperatures in the range 150 - 400°C and pressuresaround 1 bar. In vacuum, adsorbed CO on Ni(110) forms a2x1 structure consisting of an ordered zigzag arrangementof tilted molecules on short-bridge sites of the substrate asdepicted in Figure 64. The structural parameters obtainedfrom the most recent LEED (low energy electron diffraction)study [1] are given in Table 1.
The experiments reported here were performed at theSurface Diffraction Beamline ID3 with a specially designedultra-high-vacuum (UHV)/high pressure chamber. Wecollected two independent sets of crystallographic data in
Fig. 63: Measured (0,1), (1,0) and (1,1) CTR’s of theAl2O3/NiAl(110) interface. The lines are calculated curvesfrom the results of the best-fit procedure.
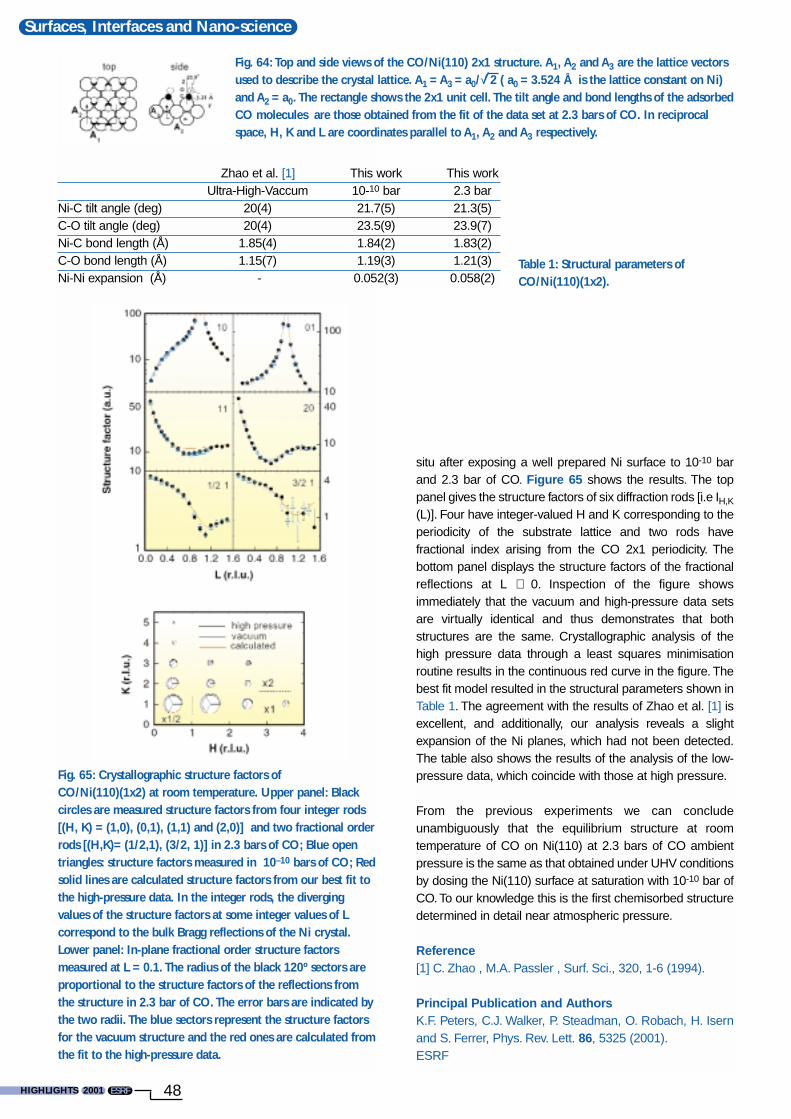
HIGHLIGHTS 2001 48ESRF
Surfaces, Interfaces and Nano-science
situ after exposing a well prepared Ni surface to 10-10 barand 2.3 bar of CO. Figure 65 shows the results. The toppanel gives the structure factors of six diffraction rods [i.e IH,K
(L)]. Four have integer-valued H and K corresponding to theperiodicity of the substrate lattice and two rods havefractional index arising from the CO 2x1 periodicity. Thebottom panel displays the structure factors of the fractionalreflections at L ≅ 0. Inspection of the figure showsimmediately that the vacuum and high-pressure data setsare virtually identical and thus demonstrates that bothstructures are the same. Crystallographic analysis of thehigh pressure data through a least squares minimisationroutine results in the continuous red curve in the figure. Thebest fit model resulted in the structural parameters shown inTable 1. The agreement with the results of Zhao et al. [1] isexcellent, and additionally, our analysis reveals a slightexpansion of the Ni planes, which had not been detected.The table also shows the results of the analysis of the low-pressure data, which coincide with those at high pressure.
From the previous experiments we can concludeunambiguously that the equilibrium structure at roomtemperature of CO on Ni(110) at 2.3 bars of CO ambientpressure is the same as that obtained under UHV conditionsby dosing the Ni(110) surface at saturation with 10-10 bar ofCO. To our knowledge this is the first chemisorbed structuredetermined in detail near atmospheric pressure.
Reference[1] C. Zhao , M.A. Passler , Surf. Sci., 320, 1-6 (1994).
Principal Publication and AuthorsK.F. Peters, C.J. Walker, P. Steadman, O. Robach, H. Isernand S. Ferrer, Phys. Rev. Lett. 86, 5325 (2001).ESRF
Fig. 64: Top and side views of the CO/Ni(110) 2x1 structure. A1, A2 and A3 are the lattice vectorsused to describe the crystal lattice. A1 = A3 = a0/√ 2 ( a0 = 3.524 Å is the lattice constant on Ni)and A2 = a0. The rectangle shows the 2x1 unit cell. The tilt angle and bond lengths of the adsorbedCO molecules are those obtained from the fit of the data set at 2.3 bars of CO. In reciprocalspace, H, K and L are coordinates parallel to A1, A2 and A3 respectively.
Zhao et al. [1] This work This workUltra-High-Vaccum 10-10 bar 2.3 bar
Ni-C tilt angle (deg) 20(4) 21.7(5) 21.3(5)C-O tilt angle (deg) 20(4) 23.5(9) 23.9(7)Ni-C bond length (Å) 1.85(4) 1.84(2) 1.83(2)C-O bond length (Å) 1.15(7) 1.19(3) 1.21(3)Ni-Ni expansion (Å) - 0.052(3) 0.058(2)
Table 1: Structural parameters ofCO/Ni(110)(1x2).
Fig. 65: Crystallographic structure factors ofCO/Ni(110)(1x2) at room temperature. Upper panel: Blackcircles are measured structure factors from four integer rods[(H, K) = (1,0), (0,1), (1,1) and (2,0)] and two fractional orderrods [(H,K)= (1/2,1), (3/2, 1)] in 2.3 bars of CO; Blue opentriangles: structure factors measured in 10–10 bars of CO; Redsolid lines are calculated structure factors from our best fit tothe high-pressure data. In the integer rods, the divergingvalues of the structure factors at some integer values of Lcorrespond to the bulk Bragg reflections of the Ni crystal.Lower panel: In-plane fractional order structure factorsmeasured at L = 0.1. The radius of the black 120º sectors areproportional to the structure factors of the reflections fromthe structure in 2.3 bar of CO. The error bars are indicated bythe two radii. The blue sectors represent the structure factorsfor the vacuum structure and the red ones are calculated fromthe fit to the high-pressure data.

2001 HIGHLIGHTSESRF
Surfaces, Interfaces and Nano-science
49
Picosecond Pump-and-probeStudies of Photo-excitedSilver NanoparticlesNanocrystal assemblies [1] possess intriguing properties fornovel material applications. Metal nanoparticles are used forfast optical applications such as light switching, or for three-dimensional micro patterning. Finite-size effects, such asparticle-plasmon resonances, determine the opticalproperties.These resonances in the visible spectrum can betailor-made through shape variation. A series of ultrafastenergy-relaxation processes is observed after excitationwith femtosecond laser pulses. These comprise plasmondecay, electron gas heating and lattice expansion throughelectron phonon coupling. Two channels of lattice reactionare excited, an incoherent heating of the particles which cooldown through interaction with the matrix in hundreds ofpicoseconds and a coherent nuclear motion described as(acoustic) phonons or shape oscillations with frequencies inthe picosecond range.
From optical spectroscopy [2] the nuclear motion can bemodelled under a free particle approximation, but no cleardistinction of the strain or disorder state of the lattice can bemade. Therefore X-ray diffraction is used here to focus onthe lattice dynamics of laser-excited silver particles in a glassmatrix. At ID09TR a time-resolved pump-and-probe setup isrealised allowing a study of the lattice reaction to afemtosecond laser pulse at 400 nm with a fixed time delaywith picosecond accuracy in a stroboscopical mode. Wecollected the powder diffraction from embedded silverparticles of sizes from 20 to 100 nm on a MarCCD.The shiftof the size-broadened (111) Debye-Scherrer ring allowsus to resolve lattice expansions in the range of 2·10–4
(Figure 66).
Figure 67 displays the shift of the (111) ring to lower anglesimmediately after the laser impact.This shows the presenceof an expanded lattice. Following the Bragg angle shift withthe delay time between X-ray and laser pulse, one canclearly determine the cooling rate of the particles by heattransfer to the matrix. As for the larger particles (100 nmdiameter) the surface to volume ratio is smaller, the coolingrate is considerably lower than for the particles of 60 nmdiameter (150 ps vs. 970 ps decay time). Under theassumption of a bulk expansion coefficient one can deducea maximal jump of the lattice temperature of 140 K for the60 nm particles.Yet the distinction between coherent motionand thermal expansion is not obvious and a line profileanalysis can give additional information.
In conclusion, we could resolve the transient expansion ofnanoparticles triggered by a short laser pulse. Theparameters of the heat transfer can serve as a valuableabsolute determination of lattice temperature and may helpto identify the coherent contribution to the motion.
References:[1] M. Kaempfe, T. Rainer, K.J. Berg, G. Seifert andH. Graener, Appl. Phys. Lett. 74, 1200 (1999).[2] M. Perner, S. Grésillon, J. Maerz, G. von Plessen andJ. Feldmann, J. Porstendorfer, K.-J. Berg and G. Berg; Phys.Rev. Lett. 85, 792 (2000).
Principal Publication and Authors:A.Plech (a), S. Grésillon (b), G. von Plessen (c), S. Kuerbitz(d), K.J. Berg (d), M. Kaempfe (d), H. Graener (d) andM. Wulff (a), submitted.(a) ESRF (b) ESPCI, Paris (France)(c) Sektion Physik der LMU München (Germany)(d) FB Physik der MLU Halle (Germany)
Fig. 66: Powder pattern from silver particles in a matrix. The(111) reflection of the fcc lattice is used for the tracking ofthe lattice dynamics. The insets show a TEM micrograph(lower) and the plasmon resonance curve in the opticalspectrum (upper).
Fig. 67: Shift of the Bragg angle as function of the delay timebetween laser excitation and X-ray probe. The onset time isdetermined by the temporal resolution of the X-ray pulse (80ps), whereas the decay of the transient reflects the heattransfer to the surrounding matrix. The inset displays the lineprofiles at different delay times for the 60 nm particles.

HIGHLIGHTS 2001 50ESRF
Surfaces, Interfaces and Nano-science
The Electron Waveguide inFeAu MultilayersThe electron waveguide effect, often called electronchannelling, was predicted by band structure andconductivity calculations. It has been suggested that thiseffect plays a role in giant magnetoresistance. Thechannelling occurs because the band structure of Fe is spindependent and although there is a good band matchbetween the majority bands (the spins that are parallel to themagnetisation) and the Au bands, there is a substantialmismatch between the minority Fe and the Au bands. Theupshot is that the minority spin electrons can be confined tothe Au layers by specular reflections at the Au/Fe interface.Recent magneto-transport measurements performed at theUniversity of Leeds have only now provided the firstexperimental evidence of the presence of this phenomenonin magnetic multilayers.
Measurements were performed on Fe/Au multilayers grownby molecular beam epitaxy on either (001) oriented MgO or(11
–20) oriented sapphire. The Fe/Au multilayers grew with
(001) and (111) orientation respectively on the twosubstrates. It was found that the conductivity in a saturatingmagnetic field was substantially higher for the (001)multilayers than for the (111) multilayers of equal thicknessof Au and Fe. Further, the gradient of the conductivity versusAu thickness, at constant Fe thickness, was higher for the(001) multilayers than for the (111) multilayers. Synchrotronradiation experiments undertaken at BM28 played a crucialrole in establishing that the result was not an artefact ofdiffering crystal perfection.
Grazing-incidence specular and diffuse scatteringestablished that the multilayers grown on MgO had aroughness amplitude about three times that of those grownon sapphire and that the in-plane correlation length of theroughness was very similar. The higher conductivity of the(001) orientation multilayers therefore did not arise from lowerscattering at smoother interfaces. High-resolution diffractionmeasurements showed comparable lattice perfection in adirection normal to the surface, with both systems exhibitingmany superlattice satellites around the 002 and 111
reciprocal lattice points respectively. From reciprocal spacemaps such as those illustrated in Figure 68, the mosaicdistribution has been determined and, for the first time, thevariation of the peak width transverse to the diffraction vectorhas been measured as a function of satellite order. As themosaic spread of the (111) multilayers is less than that of the(001) multilayers, this removes a further artefact from theinterpretation.
The in-plane mosaic structure has been measured usinggrazing-incidence surface diffraction from Bragg planesperpendicular to the surface. From the peak width in a scanin which the sample only is rotated about its surface normal,equivalent to a horizontal cut through the full in-planereciprocal space map shown in Figure 69, a direct measureof the mosaic spread can be obtained. Once again, the X-ray scattering measurements provided the crucial evidenceto demonstrate that the magneto-transport effects wereassociated with the electron channelling, rather than thedifferent layer or interface structure.
By studying in-plane reciprocal space maps such asFigure 69 as a function of Fe thickness, it has additionallybeen possible to determine the mechanism of the fcc. to bcc.transition that occurs for Fe growth on (111) Au.
Principal Publication and AuthorsD.T. Dekadjevi (a), P.A. Ryan (a), B.J. Hickey (a), T.P.A. Hase(b), B.D. Fulthorpe (b) and B.K. Tanner (b), Phys. Rev. Lett.,86, 5787-5790 (2001).(a) Dept. of Physics, University of Leeds (UK)(b) Dept.of Physics, University of Durham (UK)
Fig. 68: Reciprocal space map around the 002 reciprocallattice point for a Fe/Au multilayer grown on (001) MgO.
Fig. 69: In-plane reciprocal space map of a Fe/Au (111)multilayer grown on sapphire. The peaks at a detector angle of~ 45° are the Au (220) peaks. Those near detector angles of 30°show the coexistence of two Fe phases for 20 Å Fe layers.

2001 HIGHLIGHTSESRF
Surfaces, Interfaces and Nano-science
51
Strain and Stacking of GaNQuantum Dots inMultilayersThe current interest in self-organised growth of strainedsemiconductor nano-structures is based on the possibility ofachieving novel optical and electronic properties. Amongthem, nitride compounds are especially interesting due totheir application in the blue-ultraviolet wavelength range. Inthe system GaN/AlN (wurtzite phase), the in-plane latticemismatch amounts to 2.4%. The resulting strain, whichaccumulates during the molecular beam epitaxy of GaN onAlN induces the Stranski-Krastanov transition from a 2Dlayer-by-layer growth to a 3D growth of dislocation-freeislands. Embedded in the AlN matrix, these GaN islandsbehave like artificial atoms and are called quantum dots.
The electronic properties of the quantum dots areconsiderably influenced by their internal structure. It has
been shown that the growth of quantum dots in superlatticesresults in an improved size distribution and a good verticalstacking.These properties, which are difficult to observe withreal space methods can be obtained by X-rays, where theinformation is averaged over a macroscopic ensemble of thedots. Since the total thickness of the superlattice is typicallyonly some tens of nm thick, grazing-incidence X-rayscattering using synchrotron radiation allows us to studystrain and ordering of the quantum dots, even as a functionof depth. The GaN quantum dot multilayer samples aregrown in a commercial MECA 2000 MBE chamber. Themultilayer, consisting of 13 GaN/AlN bi-layers with a AlNspacer layer thickness of 4 nm, was deposited on a SiC(0001) substrate (Figure 70a).
The X-ray grazing incidence (GI) experiments have beenperformed at beamline ID1. The intensity is collected with alinear detector as a function of the angle 2θ, measured fromthe plane of incidence (Figure 70b). The corresponding q⊥and q// reciprocal space axis are aligned normal and parallelto the surface plane, respectively. In the grazing-incidencesmall-angle X-ray scattering regime (GISAXS), for small2θ values, the scattered intensity is governed by themorphological properties of the dot multilayer. In the grazing-incidence diffraction (GID) regime, at large 2θ values, thesurface Bragg peaks are exploited to measure the straindistribution in the superlattice.The variation of the incidenceangle αi allows depth sensitive measurements.
The reciprocal space intensity map, representing theGISAXS pattern, is shown in Figure 70c. Three intenseBragg sheets indicate the high replication of the quantumdots in vertical stacks. They permit the quantification of thedegree of vertical ordering [1]. We find that the dotsthroughout the whole superlattice deviate from an averagestack position by only about 4% of their diameter of 15 nm.From other quantum dot systems it is known that the verticalordering is mediated by strain, which here has beenmeasured by GID (Figure 71) performing radial scans closeto a (30-30) surface reflection. We observed that the laterallattice parameter distribution induces two maxima (apart
Fig. 70: (a) Sample; (b) Set-up used for grazing-incidencescattering methods; (c) GISAXS pattern showing Bragg sheetsof diffuse intensity.
Fig. 71: GID scans in radial direction qr at the (30-30) Braggreflection for different αi.

HIGHLIGHTS 2001 52ESRF
Surfaces, Interfaces and Nano-science
from the sharp SiC substrate peak) which can be attributedto the undistorted part of the AlN superlattice and bufferlayer and a broad peak (noted (A) and (B)) resulting fromGaN quantum dots strained to a lattice parameter smallerthan the bulk value of GaN. The green curve stems from ascattering depth of roughly 10 nm while the blue onerepresents the whole multilayer. The shift of the GaN peakfrom position (A) to (B) evidences an increase of latticerelaxation near the sample surface [2].
To conclude, we have shown that GISAXS and GID are well-suited techniques to quantify strain and ordering of self-assembled nanostructures in group III nitrides. Thesystematic investigation of samples with varying spacerlayer thickness is underway and aims to improve ourunderstanding of the growth mechanisms in this QD system.
References[1] I. Kegel, T.H. Metzger, J. Peisl, J. Stangl, G. Bauer andD. Smilgies, Phys. Rev. B 60, 2516 (1999).[2] V. Chamard, T.H. Metzger, and E. Bellet-Amalric,B. Daudin, C. Adelmann, H. Mariette and G. Mula, Appl.Phys. Lett., 79, 1971 (2001).
Authors:V. Chamard (a), T. Metzger (a), E. Bellet-Almaric (b), B.Daudin (b), H. Mariette (b, c) and C. Adelmann (b)(a) ESRF(b) Département de Recherche Fondamentale sur laMatière Condensée, CEA/Grenoble (France)(c) Laboratoire de Spectrométrie Physique, Université J.Fourier Grenoble 1 - CNRS UMR 5588, Saint Martind'Hères (France)
Self-organised Orientationof Microporous Channels inSilicalite-1 FilmsMicroporous materials have attracted considerable attentionin recent years as promising structures for a variety ofapplications such as supports for catalysts, separationmembranes, functional optical coatings, selective chemicalsensors, and templates for growing conductive materials. Avariety of deposition strategies have been explored for thepreparation of thin microporous films on different substratesincluding direct crystal growth in zeolite precursor mixtures,chemical modification of the substrates, and seeding withcolloidal crystals prior to further hydrothermal treatment[1,2]. The functional properties of the films could beimproved substantially by designing the orientation of thezeolite micro-channels, however, the correspondingprocesses of self-organised nucleation and crystallisationare not yet well understood.
In this work, thin silicalite-1 films, grown from colloidalsolution on pre-deposited seeded layers, have beeninvestigated by grazing-incidence diffraction (GID) mainly atID10B. This method yields 3D structural information on sizeand orientation of the silicalite-1 crystallites forming the film.Exploiting refraction effects at angles close to the criticalangle for total external reflection, αc, the structuralparameters are obtained as a function of depth, thusshedding light on the nucleation process during depositionand film growth. In GID only Bragg reflections with the latticevector G(hkl) parallel to the sample’s surface can beaccessed, except for those in the receptive range of theposition-sensitive detector (PSD) which is placedperpendicular to the surface (see Figure 70b). The intensitydistribution along the exit angle (αf) gives direct informationon the orientation of those crystallites, which contribute tothe Bragg reflection under investigation. The so-called “αf-spectra” expected for different grain orientation are depictedschematically in Figure 72. In all cases the intensitymaximum at αc is a direct measure of the density of the film.
Most important for the orientation properties of the silicalite-1 crystallites is the intensity ratio of the (-101) and(011), (200) and (020) reflections, as shown in Figure 73a.The measurements are performed at αI = 0.1°, which issmaller than the critical angle of 0.21° of the bulk material.The adsorbed seeded layer (S1) shows only the (011) and(020) Bragg reflections, which reveals that the crystals areoriented with the a-axes perpendicular to the substratesurface. In contrast, the grown films (S2, S3) contain onlyreflections with k = 0 i.e. (-101) and (200). These resultsclearly demonstrate the change in the crystal orientationwith the a-axes from being perpendicular to parallel to thesubstrate surface as a function of film thickness. The zeoliteorientation within the film was investigated by depth sensitive“αf-spectra” measurements at different angles of incidence(αi) for the grown film (S3). In Figure 73b the radial scans ofthe Bragg peaks are shown as a function of αi. In the near-surface region at about 8 nm (αi = 0.1), the crystals areoriented with the a-axes parallel to the surface, while at a
Fig. 72: The GID scattering geometry and three examples forthe intensity distribution along αf as a function of theorientation of the reciprocal lattice vectors G(hkl).

2001 HIGHLIGHTSESRF
Surfaces, Interfaces and Nano-science
53
scattering depth of about 277 nm (αi = 0.3°) most of thecrystallites are oriented with the a-axes perpendicular to thesurface. Two “αf-spectra” of the corresponding (011) and (-101) reflections are shown in Figure 74. For a highly-grazingangle of incidence αi = 0.05°, the intensity distribution alongαf indicates that a thin film with a low density (note thatαc = 0.1°) covers the sample which has the typical “coarsegrain structure”. In the case of a large penetration depth(αi = 0.3°), the main Bragg intensity stems from a well-oriented film showing a single crystal-like feature of the “αf-spectrum” (compare both cases with Figure 72).
In conclusion, the change in the orientation of microporoussilicalite-1 crystallites grown on silicon substrates is followedby depth-selective GID measurements. The straightchannels change their orientation as a function of filmthickness from being parallel to perpendicular to the surface.Laterally, the films remain in an untextured powder-like state.The underlying self-organised growth process will bestudied by in situ GID measurements in the near future.
References[1] S. Mintova, S. Mo and T. Bein, Chem. Mater., 10, 4030-4036 (1998).[2] S. Mintova, V. Valtchev, V. Engsrom, B.J. Schoeman andJ. Sterte, J. Microporous Mater., 11, 149-160 (1997).
Principal Publications and Authors [1] S. Mintova (a), T.H. Metzger (b) and T. Bein (a), Stud.Surf. Sci. Catal., Zeolites and Mesoporous Materials at theDawn of the 21st Century, (Eds. A. Galarneau, F. Di. Renzo,F. Fajula, J. Verdine), Elsevier, 135, A20o04 (2001).[2] T.H. Metzger, S. Mintova and T. Bein, Micropor. Mesopor.Mater., 43, 191-200 (2001).(a) University of Munich (Germany)(b) ESRF (France)
Fig. 73: Radial 2θ-scans of seeded layer (S1) and grown films(S2, S3) in the 2θ range 7-10°: a) αi = 0.1° constant b) depth-sensitive radial scans of sample S3 for different αi.
Fig. 74: The “αf-spectra” of grown zeolite film (S3) fordifferent αi.
54ESRF
The study of collective atom dynamics aimsto investigate the correlated motion ofatoms in materials at length scales rangingfrom below the typical interparticledistances up to macroscopic distances. Theuse of X-rays in this field represents one ofthe success stories of third-generationsources. This activity is still expanding, evenafter many years of operation. Besides thenumerous scientific challenges, this ispossible thanks to continuing instrumentaland conceptual developments on thededicated experimental stations. A largevariety of research programmes is currentlybeing pursued, ranging from the study ofthe dynamical properties of systems underhigh pressure to the investigation of thesubtle interplay between the crystal lattice,the electronic structure and phonons inincreasingly complex systems.
The present highlights try to give a flavourof the current trends and developments atthe ESRF.
An important milestone has been achievedin the study of optical phonon dispersion inhigh-temperature superconductors bycoherent inelastic X-ray scattering (IXS),where valuable information on possiblemechanisms responsible forsuperconductivity could be gained. For thisclass of materials, IXS is often the onlyspectroscopic tool to study phonondispersion, since inelastic neutronscattering (INS) techniques need fairly largesamples, not always available in sufficientcrystalline quality.
A pilot experiment has demonstrated thatabsolute cross-sections of molecularvibrational excitations can bestraightforwardly obtained, thus providing acomplementary spectroscopic tool to theestablished Raman scattering and infraredabsorption techniques. Other importantprogress has been made in the field ofnuclear inelastic scattering (NIS), atechnique that allows the determination ofthe element (Mössbauer isotope) specificphonon density of states (DOS). Themethod was extended to the 161Dy isotope,thus allowing studies - besides Fe, Sn andEu - on dysprosium containing materials.
HIGHLIGHTS 2001 ESRF

ESRF
Collective Atom Dynamics
55
Non-inelastic techniques can also giveinformation on dynamic properties. This isexemplified by the anomalous X-raydiffraction studies where electron densitymodulations, induced by a charge densitywave, or externally, by a surface acousticwave, give rise to satellite reflections,which in turn allow the quantitativecharacterisation of these modulations.
The selected highlights show that progressin the field of collective atom dynamics isintimately connected to a continuousdevelopment of instruments and methods,combined with an improved knowledge ofthe underlying physical principles, gainedthanks to the fruitful interplay betweendifferent experimental techniques andtheory.
2001 HIGHLIGHTSESRF
Anomalous Dispersion ofOptical Phonons in High Tc
SuperconductorsCopper oxide superconductors exhibit the highest criticaltemperature found so far. Since their discovery in 1986, themicroscopic mechanism at the origin of theirsuperconductivity is still unexplained [1]. While it is wellestablished that in conventional superconductors thecoupling between electrons and phonons (collectivevibrations) leads to charge carrier pairing, and thereforesuperconductivity, the role of this coupling in copper-oxidesuperconducting compounds is still the subject of intenseresearch efforts. Inelastic neutron scattering (INS) studieson some hole-doped high-temperature copper oxidesuperconductors revealed an anomalous behaviour of thehighest energy optical phonon mode, related to the Cu-O in-plane bond stretching vibrations [2]. This anomaly may berelated to a strong coupling between the lattice vibrationsand the charge carriers, as the conduction in the copperoxide superconductors takes place by charge hopping alongthe Cu-O bond in the CuO2 planes. Within this framework,the optical phonon anomaly is expected to be ubiquitous,and therefore should also be observed in electron-dopedcopper oxide superconductors, such as Nd2-xCexCuO4+δ.Phonon dispersion data are, however, not available to date,since accurate homogeneous doping and good structuralquality can only be achieved in single crystals of a few tensof µm3, a size too small for INS studies. This limitation canbe overcome by inelastic X-ray scattering (IXS), becauselateral X-ray beam sizes of a few tens of µm can routinely beobtained.
The experiment was carried out at beamline ID16.The probed scattering volume corresponded to about1.5 x 10–3 mm3. The sample was a single crystal grown bythe travelling-solvent floating-zone method at StanfordUniversity. It was mounted on the cold finger of a closed-loophelium cryostat, and cooled to 15 K. We chose lowtemperature and high momentum transfer (up to 12.5 Å-1) inorder to optimise the count rate on the high-frequencyoptical modes.
The right panel of Figure 75 displays the longitudinalphonon dispersions (o) for superconductingNd1.86Ce0.14CuO4+δ at T = 15 K along the a* direction,together with a lattice dynamics calculation (solid lines).Theexperimental frequencies and intensities are in agreementwith the calculations, except for the high-energy bond-stretching branches.The left panel shows an enlargement ofthis high energy part and the comparison with thelongitudinal phonon frequencies from INS spectra in theinsulating parent compound Nd2CuO4+δ (from [2]). Besidesan overall renormalisation, an anomalous softening of thehighest optical branch is clearly visible. This softening mightbe linked to an interaction between the in-plane oxygen

56ESRF
Collective Atom Dynamics
HIGHLIGHTS 2001 ESRF
vibration (see Figure 76) and a charge modulation with aperiodicity of about 3-4 a in the CuO2 planes.
In conclusion, the present results reveal that the anomaloussoftening previously observed in hole-doped compounds [2],is also present in the electron-doped cuprates, thereforesuggesting that this is a generic feature of the high-temperature superconductors. Furthermore, this studydemonstrates that high-energy resolution inelastic X-rayscattering has developed into a valuable tool for theinvestigation of the lattice dynamics of complex transitionmetal oxides, allowing measurements on small high-qualitysingle crystals.
References[1] J. Orenstein and A. J. Millis, Science, 288, 468 (2000).[2] L. Pintschovius et al. Physica B, 185-189, 156 (1993).
Principal Publication and AuthorsM. d'Astuto (a), P.K. Mang (b), P. Giura (a), A. Shukla (a),P. Ghigna (c), A. Mirone (a), M. Braden (d), M. Greven (e),M. Krisch (a) and F. Sette (a), submitted to Phys Rev. Lett.(a) ESRF(b) Department of Applied Physics, Stanford University,California (USA)(c) Dipartimento di Chimica Fisica ''M. Rolla'', Un. Pavia(Italy)(d) II. Physikalisches Inst., Univ. zu Köln (Germany)(e) Department of Applied Physics and Stanford SynchrotronRadiation Laboratory, Stanford, California (USA)
Optical PhononOverbending in DiamondDespite the fact that diamond and silicon are neighbouringelements in the group IV of the periodical table, possessingthe same crystal structure with tetrahedrally coordinatedcovalent bonds, their electronic band structure and latticedynamics are profoundly different. For example, diamond isa perfect insulator of unparalleled hardness, while silicon ismuch softer and a semiconductor. One of the unusualproperties of diamond, absent in silicon, which haveintrigued scientists since its first observation in 1947, is theexistence of a peak in the second order Raman spectra twotimes higher than the zone centre (Γ-point) one phononenergy. Various explanations were put forward, but only theadvent of reliable ab-initio computational methods allowedthe reproduction of this unique feature. These calculationssuggest that the peak is due to an "overbending" of thelongitudinal optic (LO) phonon dispersion branches with aminimum at the Γ-point, and maxima reached at somearbitrary points along all three high-symmetry directions [1].This prediction stimulated more detailed experimental workon this phonon mode, and an inelastic neutron scattering(INS) study, performed at the ILL, confirmed theoverbending for the LO phonon branch along the ∆-direction([1 0 0]) [2]. However, the results from a subsequent inelastic
Fig. 76: Atomic displacement pattern on the CuO2 plane (ab)for the high-energy optical mode along the a directions.
Fig. 75: Phonon dispersion in Nd2-xCexCuO4+δ along the a*direction.

ESRF
Collective Atom Dynamics
57 2001 HIGHLIGHTSESRF
X-ray scattering (IXS) study are not in agreementquantitatively with the INS results, and furthermore thepresence of overbending in the other directions wascontested [3]. In order to resolve this controversy andapparent disagreement between the theoretical predictionsand the IXS results, an accurate IXS study was performedon ID28.
The experiment was performed with a total energyresolution of 3 meV full-width-half-maximum (at 17794 eVincident energy). The diamond single crystal (4 mmdiameter) was of excellent quality as testified by the narrowwidth of its rocking curve of only 0.004°. The stability andreproducibility of the instrument was checked by recordingthe Stokes–anti-Stokes pair of a longitudinal acousticphonon near the Brillouin zone centre, and by repeatedscans of the Γ-point phonon. Figure 77 showsrepresentative spectra at reduced momentum transfervalues, q, as indicated in the figure, obtained along the Λ-direction ([1 1 1]), together with their best fits to a Lorentzianprofile.The data clearly reveal an overbending for 0.15 < q <0.25. We furthermore note that the measured Γ-pointphonon energy of 164.75 meV is in excellent agreementwith Raman data, which yield 165.18 meV. Figure 78 showsthe resulting dispersion relations for all three high-symmetrydirections, together with the INS results and the ab initiocalculations. The overbending, as determined by IXS,amounts to 1.5, 0.5 and 0.2 meV along the three high-symmetry directions (∆, Σ and Λ). The IXS data are in verygood agreement with both the INS results and thecalculations. These results unambiguously reveal the LOoverbending in all three high-symmetry directions, finallyproviding the physical origin for the anomalous peak in thetwo-phonon Raman spectrum. Furthermore, the presentwork demonstrates that the reproducibility of state-of-the-artIXS instruments, which is intimately linked to temperaturestability of the high energy resolution optical components onthe milli-Kelvin scale, can yield results reproducible within10-3 on the time scale of weeks.
References[1] W. Windl, P. Pavone, K. Karch, O. Schutt, D. Strauch,P.Gianozzi and S. Baroni, Phys. Rev. B 48, 3164 (1993).[2] J. Kulda, B. Dorner, B. Roessli, H. Sterner, R. Bauer, Th.May, K. Karch, P. Pavone and D. Strauch, Solid StateCommun. 99, 799 (1996).
[3] M. Schwoerer-Bohning, A.T. Macrander and D.A. Arms,Phys. Rev. Lett. 80, 5572 (1998).
Principal Publication and AuthorsJ. Kulda (a), H. Kainzmaier (b), D. Strauch (b), B. Dorner (a),M. Lorenzen (c) and M. Krisch (c), submitted Phys. Rev. Lett.(a) ILL(b) Institut f. Theoretische Physik, Universität Regensburg(Germany)(c) ESRF
Fig. 77: Experimental IXS data (circles) and their best fits(solid lines) for the longitudinal optic phonon along Λ. Thevertical line indicates the position of the Γ-point phonon andserves to emphasise the overbending.
Fig. 78: Experimental(IXS: red points;
INS: blue points) andcalculated (solid lines)
phonon dispersionrelations along the
three high-symmetrydirections in diamond.

HIGHLIGHTS 2001 58ESRF
Collective Atom Dynamics
ESRF
Molecular VibrationalSpectroscopy by Inelastic X-ray Scattering: the Case ofLiquid NitrogenThe vibrational properties of condensed matter are routinelystudied by Raman scattering and infrared absorptiontechniques, which generally ensure a high signal-to-noiseratio together with high resolution. With these spectroscopicmethods, it is generally easy to obtain precise information onthe frequency position of the vibrational bands and then tocompare them with theoretical models. Nonetheless thereare cases where additional information is required in orderto interpret the vibrational spectrum correctly (e.g. itsspectral intensity, or the dependence of the vibrationalexcitations on the wavenumber). In such cases, where thementioned techniques are not very helpful, the neutronscattering technique has already proven to be an importanttool [1]. Here, we want to show that the inelastic X-rayscattering (IXS) technique can provide similar andcomplementary information with respect to neutronscattering. For this purpose, we present the results of an IXSstudy of the vibrational band of liquid nitrogen.
The experiment was carried out at beamline ID16 using thevertical arm spectrometer for the scattered energy analysiswith an instrumental energy resolution of 10 meV (FWHM).
IXS spectra were collected in the 40-400 meV exchangedenergy range for several values of the exchangedmomentum, q, comprised between 1.45 and 11.8 Å-1. Thenitrogen sample was kept at a temperature of (76 ± 0.2) Kand at a pressure of (1 ± 0.1) bar. The final spectralintensities (Figure 79) are characterised by two distinctfeatures: a central band and a much weaker band at highenergy. The peak position of the latter band corresponds tothe stretching energy of the nitrogen molecule at 289 meV,while the former band is due to the roto-translationaldynamics of the molecule. As a general consideration, thecapability of IXS to access the vibrational dynamics in thecondensed phase, recently demonstrated at one q value forthe case of the O-H stretching band in liquid water [2], ishere clearly confirmed in a broad q range for the case ofliquid nitrogen.
The relative intensity of the vibrational band with respect tothe total spectral intensity, Sv(q) / S(q), can be readily workedout from the experimental data.Moreover, values for the totalspectral intensity S(q), which corresponds to the atomicstructure factor, can be obtained on an absolute scale.Therefore, the absolute scattering cross section per unitsolid angle, Ω, for the vibrational excitation, ∂σv (q) / ∂Ω =ro2 fq2 Sv(q) (ro classical electron radius; fq atomic formfactor), can be determined (Figure 80). These data can becompared with a semiclassical calculation where thecorrelations among translational, rotational and vibrationaldegrees of freedom were neglected – an approximationwhich is very well suited to the case of liquid nitrogen. Theresult of this calculation is also reported in Figure 80, andcompares well with the experimental data. Thisdemonstrates i) the good accuracy which is currentlyobtainable with IXS for the determination of the absolutecross-sections of vibrational excitations in a large q-range,and ii) how direct the comparison between experimentaldata and theoretical calculation can be made given thesimplicity of the expression for the IXS cross-section.
Fig. 79: IXS spectra of liquid nitrogen at several values of theexchanged momentum, q. The spectra are reported on asemilog scale in order to emphasise the weak vibrational bandat ≈ 289 meV.
Fig. 80: q-dependence of the absolute cross-section per unitsolid angle for the vibrational excitation of liquid nitrogen(full circles). The result of a theoretical calculation made insemiclassical approximation is also reported (dashed line), andcompares well with the experimental data.

2001 HIGHLIGHTSESRF
Collective Atom Dynamics
59 ESRF
References[1] S.W. Lovesey, Theory of neutron scattering fromcondensed matter, Clarendon Press, Oxford, Vol. 1, 239-282 (1986).[2] C. Halcoussis, T. Abdul-Redah, H. Naumann, G. Monacoand C.A. Chatzidimitriou-Dreismann, ESRF Newsletter 34,17 (2000).
Principal Publication and AuthorsG. Monaco (a), M. Nardone (b), F. Sette (a) and R. Verbeni(a), Phys. Rev. B, 64, 212102 (2001).(a) ESRF(b) Universita’ di Roma Tre, Rome (Italy)
Nuclear Inelastic Scatteringwith 161DyNuclear inelastic scattering (NIS) is an isotope-specifictechnique (and consequently element-specific), whichallows one to determine the phonon density of states (DOS)of atoms that possess a nuclear resonant level. Thetechnique is fast, precise, requires only a small amount ofmaterial, and can be applied to samples in variousaggregate states [1]. Since the start of its development in1995, the majority of studies were performed on systemsthat contain the “classical” 57Fe isotope. Later the techniquewas extended to the 119Sn and 151Eu isotopes. Here wereport on a first application of nuclear inelastic scattering to161Dy. This development was motivated by the role ofdysprosium in various fields of research. For instance, Dy isa constituent atom of several high-temperaturesuperconducting materials, and NIS studies may give newinsights into their lattice dynamics and thermodynamics.Furthermore, several Dy compounds have interestingmagnetic properties, where NIS could help clarifying theinfluence of magneto-acoustic interactions on the latticedynamics. Finally, Dy forms stable complexes withfullerenes, which are model objects for rotational dynamicsstudies.
We have elaborated a high energy-resolutionmonochromator for the 25.651 keV radiation of 161Dy with anenergy bandpass of 1 meV providing 5.7 x 10⁶ photons persecond at 90 mA current in the storage ring. Themonochromator consists of two ''nested” channel-cutcrystals. For the outer channel-cut crystal, an asymmetricSi(4 4 4) reflection was chosen with an asymmetry factorof 0.10. For the inner channel-cut crystal, a symmetricSi(18 12 6) reflection was used.
The experiment was performed at the nuclear resonanceend-station ID22N. The sample was a 50 µm thick foil of Dymetal with a 95.7% abundance of the resonant 161Dyisotope. The energy dependence of the nuclear inelastic
absorption is shown in Figure 81. It gives the probability ofnuclear inelastic absorption as a function of energy, obtainedfrom the lattice due to phonon annihilation (E < 0), ortransferred to the lattice for phonon creation (E > 0). At roomtemperature, the energy spectrum is dominated by multi-phonon contributions, while at 15 K the spectrum consistsmostly of single-phonon absorption with only a smallcontribution of multi-phonon components.
From the data at 15 K we derived the phonon DOS(Figure 82, open circles). These are compared to thephonon DOS at room temperature from ref. [2], where thedynamics of dysprosium was evaluated by an interpolationof data of the elastic constants from terbium and holmium.Our measurements give approximately a factor of twosmaller amount of phonon states in the soft part (E < 8 meV)of the spectrum. This difference may be explained by thedamping of lattice vibrations at higher temperatures.
Fig. 81: Energy dependence of inelastic nuclear absorption ofsynchrotron radiation in a 161Dy metal foil at roomtemperature and at 15K.
Fig. 82: Phonon density of states for Dy metal: open circlesand thin line (guide to the eye) show the phonon DOS asderived from the energy spectrum of nuclear inelasticabsorption measured at 15K. The solid line shows the resultsof theoretical calculations for room temperature [2].

HIGHLIGHTS 2001 60ESRF
Collective Atom Dynamics
In summary, we have demonstrated the feasibility of nuclearinelastic scattering for the 25.651 keV nuclear transition of161Dy. Applications making use of this technique for 161Dycan now be envisaged. Furthermore, by combining nuclearinelastic scattering with nuclear forward scattering, magneticand electronic properties may be probed simultaneouslywith the lattice dynamics.
References[1] A.I. Chumakov and W. Sturhahn, Hyp. Interact., 123/124,781 (1999).[2] R.R. Rao and C.S. Menon, J. Phys. Chem. Solids, 34,1879 (1973).
Principal Publication and AuthorsA.I. Chumakov (a), R. Rüffer (a), O. Leupold (a), A. Barla (a),H.Thiess (a), N.A.De Campos (b), H.V.Alberto (b), J.Gil (b),R. Vilao (b) and V.G. Kohn (c), Phys. Rev. B, 63, 172301(2001).(a) ESRF(b) Department of Physics, University Coimbra (Portugal)(c) Russian Research Center ''Kurchatov Institute'', Moscow(Russia)
Anomalous and High-resolution Diffraction Studyof the Charge-Density-Wavefor the Compound (TaSe4)2IThe physics of low-dimensional metals is the subject ofactive research due to their very peculiar electronic andelastic properties. The low dimensionality in the metal-metalinteractions strongly enhances the electron-electron,electron-phonon (e-ph) and spin-phonon coupling strengthswhich, under suitable conditions of temperature, pressure ormagnetic field, result in the partial or complete condensationof the free carriers by formation of a charge (and/or spin)density wave C(S)DW. A structural transition, the so-calledPeierls transition, occurs when a phonon mode (which isstrongly affected by the e-ph coupling) condenses belowT = TP, thus inducing below this temperature a structuralmodulation with the same period as the CDW. While otherCDW systems are now well characterised, the detailednature of the e-ph coupling mechanism in (TaSe4)2I was notfully understood, and has been the motivation for the presentstudy.
(TaSe4)2I, crystallises in the tetragonal I422 space groupand consists of infinite covalently bonded (TaSe4)n chainsalong the c-axis, with an average number of conductionelectrons per Ta equal to 0.5. A first diffraction experiment,conducted on BM2, the French CRG D2AM beamline, hasallowed us to characterise the domain structure in this
compound. The low-temperature charge modulation givesrise to 8 first-order satellites (Figure 83) around eachreflection, at q = (±0.05, ±0.05, ±0.08).This is consistent withprevious observations and confirms that the modulation hasa strong acoustic character, i.e. with all atoms moving alongthe same direction with the same amplitude, and that thedisplacements are mainly perpendicular to the chain axis(acoustic shear modes). Furthermore, the high-resolutiondiffraction images show a splitting of all reflections, whichdemonstrates that the sample consists of 4 degeneratedomains, each with a different modulation wavevector, thesplitting being due to a monoclinic distortion.
In a second, anomalous X-ray diffraction experiment,diffracted intensities were recorded as a function of theincident photon energy around the Ta LIII absorption edge inorder to determine specifically the displacements of thetantalum atoms. On intensities recorded for [hkl] reflectionswith l = 4n + 1 (Figure 84), only diffraction satellites withqz = +0.08 showed a notable anomalous signal, whilereflections with l = 4n – 1 showed a strong anomalous signalfor qz = -0.08 satellites. This behaviour is consistent withoptic-like Ta displacements along the metallic chainscorresponding to a LLSS pattern of long and short in-chainTa-Ta distances (Ta-tetramerisation modes). Thus, theoverall Ta displacements are the sum of (i) acousticdisplacements perpendicular to the chains, of amplitude~ 0.1 Å, and (ii) tetramerisation displacements along thechains, of amplitude ~ 0.015 Å.
These results strongly support a previously proposedscenario [1], in which the conduction electrons couple to
Fig. 83: (a) Reciprocal space sketch of the 8 satellites aroundeach reflection. (b) High-resolution diffraction image showingthe [16 4 4] reflection and its satellites. (c) Satellite indexationon the image. Note the splitting of all reflections, due to thedomain structure. Up to third-order satellites have beenobserved.

2001 HIGHLIGHTSESRF
Collective Atom Dynamics
61
zone centre optic modes and induce the above LLSSpattern along each chain. These modes in turn interact withlong-wavelength acoustic shear modes leading to thecondensation of a long-wavelength modulation of mixedacoustic-optic character.
References[1] J. E. Lorenzo et al., J. Phys. Condens. Matter 10, 5039(1998)
Principal Publication and AuthorsV. Favre-Nicolin (a,b), S. Bos (a), J.E. Lorenzo (a), J-L. Hodeau (a), J-F. Berar (a), P. Monceau (c), R. Currat (d),F. Levy (e) and H. Berger (e) Phys. Rev. Lett. 87, 15502(2001).(a) Laboratoire de Cristallographie-CNRS, Grenoble(France) (b) ESRF (c) CRTBT-CNRS, Grenoble (France) (d) ILL(e) EPFL, Lausanne (Switzerland)
Evidence of FriedelOscillations in Quasi-one-dimensional ConductorsLow dimensional, and in particular quasi-one-dimensional(1D) conductors, have been the object of extensive studies
in the past.Their peculiar properties are intimately related tothe instability of the 1D electron gas, which leads, throughelectron-phonon coupling, to the stabilisation of a periodiclattice distortion at the Peierls transition. The period of thecorresponding modulation of the electronic density, the so-called charge-density wave (CDW), is the inverse of twicethe Fermi wave vector kF, which is in general not an integermultiple of the underlying crystal lattice. In real crystals, thisincommensurate CDW is pinned by crystal defects, such asimpurity atoms, giving rise to local modifications of theelectron density, the Friedel oscillations (FO). These can beseen as a result of the screening of the impurity charge bythe conducting electrons. Detailed information on the FO’sand the pinning can be obtained by an intensity and profileasymmetry analysis of the X-ray diffraction CDW satellitereflections.
We have performed experiments on BM2, the French CRGD2AM beamline, on heavily vanadium-doped (2.8 at % V)blue bronzes (K0.3MoO3). These quasi-one-dimensionalmaterials consist of clusters of ten octahedra MoO6 stackedalong the b direction of the monoclinic lattice. Below itsPeierls transition (TP =183 K), satellite reflections appear ata reduced wave vector qc = (1, 0.748, 0.5).We have carefullymeasured the profile of pairs of ±qc-satellite reflections atlow temperature along the chain direction b* (Figure 85).The widths of these reflections are much larger that theexperimental resolution (0.008 Å-1 along b*), indicating theloss of the CDW long-range order. From the excess width,the CDW correlation length along the chains was estimatedto be lb* = 28.7 Å at 15 K, corresponding roughly to theaverage distance between impurities. Also, Figure 85 clearlyreveals profile asymmetries of the satellite reflections, not
Fig. 84: Anomalous variations (corrected forthe absorption) around the Ta LIII edge of the[1 0 13] reflection and its 8 satellites. Only thefour upper satellites (red curves), withqz = +0.08, exhibit a strong anomalousvariation, demonstrating a tetramerisation ofthe Ta atoms.

HIGHLIGHTS 2001 62ESRF
Collective Atom Dynamics
observed in pure materials, which we interpret to be due toFO around the V impurities.
In order to understand the unusual diffraction profiles ofFigure 85, we have modeled the distortion around theVanadium defect by a CDW/FO structure. In 1D, theoscillating part of the electronic density, δρ, around animpurity of charge Z, located at x = 0 (Figure 86a), reads:
δρ(x) = exp(-|x|/ξ)cos(2kF|x|+η)/|x|,
where ξ is the damping length, and η the phase shift of theelectronic wave function at the Fermi level. η is related to Zby the sum rule Z = (2/π) η. Physically, this relation meansthat the additional charge Z has to be screened by theconduction electrons by bringing a charge of opposite signinto the vicinity of the impurity. In blue bronze, the V5+ atomprovides a negative charge (Z = –1) with respect to themolybdenum Mo6+ background, and the induced phase shiftamounts to η = π/2. Figure 86b shows a tentativerepresentation of the CDW/FO structure. In a tiny 2ξ = 16 Ådistance around the defect, the FO dominates the chargemodulation while at larger distance the CDW is recovered(dotted line). The Fourier transform of this FO/CDW modelfits reasonably well with the experimental scattering,especially its asymmetric parts. It is important to point outthat the asymmetry effect is due to the phase shift η of theFO, while the regular part of the peak is due to the CDW.
In summary, our results provide convincing evidence ofFriedel oscillations in the vicinity of vanadium impurities inblue bronze.Additional experiments on crystals with differentdoping levels are planned in order to elucidate morequantitatively the microscopic features of the CDW pinningin low-dimensional materials.
References[1] For a review, see C. Schlenker, Low-DimensionalElectronic Properties of Molybdenum Bronzes andOxides, Kluwer Academic, Dordrecht, p. 159 (1989), and J.-P. Pouget, ibid., p. 87.
Principal Publication and AuthorsS. Ravy (a), S. Rouzière (a), J.-P. Pouget(a), S. Brazovskii (b)and J.-F. Bérar (c), Phys. Rev. B 62, R16231 (2000).(a) Laboratoire de Physique des Solides, CNRS UMR8502,Université Paris-Sud, Orsay (France)(b) Laboratoire de Physique Théorique et ModèlesStatistiques, CNRS UMR 8626, Université Paris-sud, Orsay(France)(c) Laboratoire de Cristallographie CNRS, Grenoble(France)
Characterisation of SurfaceAcoustic Wave Fields byHigh-resolution X-rayDiffractionElectronic devices based on surface acoustic waves (SAW)are widely used today in modern communication systems(mobile phones, TV, GPS, radars, etc.). This development isaccompanied by an increasing need for a precisecharacterisation of the acoustic fields in these devices,especially if higher frequency ranges above 1 GHz are to be
Fig. 85: High-resolution profile of the ±qc-satellite reflectionat 60 K. The solid line corresponds to the Fourier transform ofthe FO/CDW distortion shown in Figure 86.
Fig. 86: a) Representation of a pure Friedel oscillation.b) Oscillating part of the hole charge density around animpurity placed at the origin, as a function of the unit cellindex n. Circles represent the Mo atoms.
a)
b)
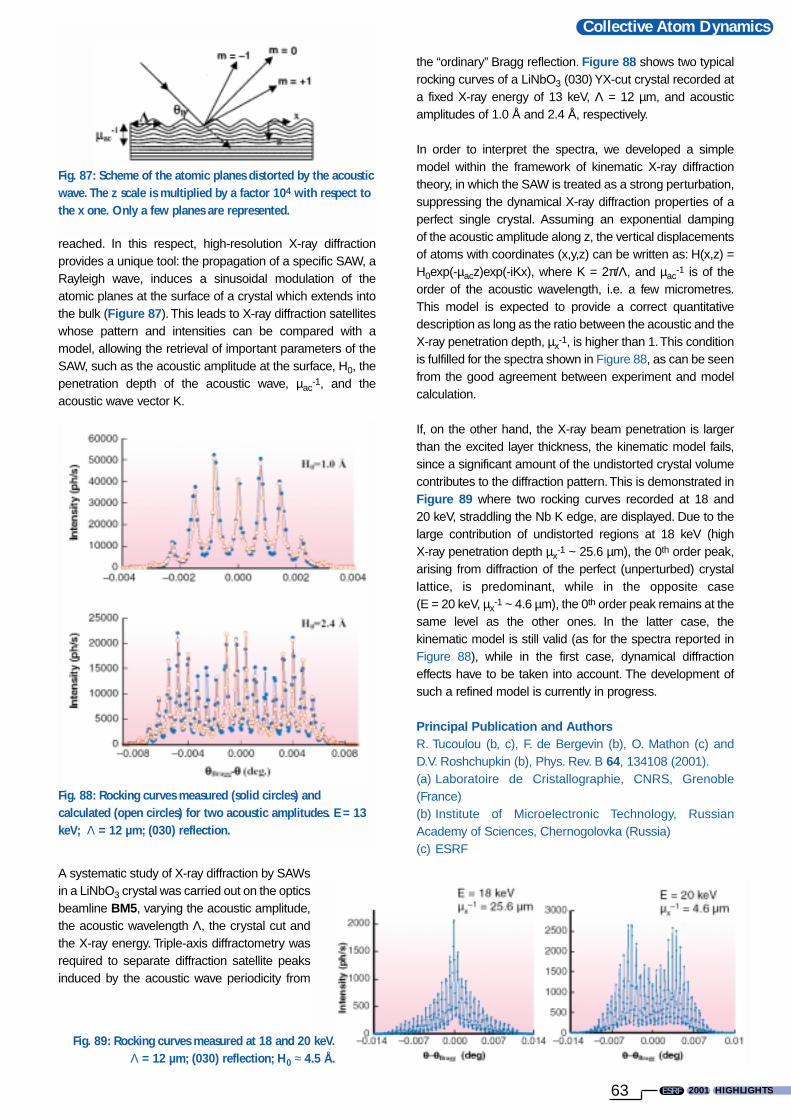
2001 HIGHLIGHTSESRF
Collective Atom Dynamics
63
reached. In this respect, high-resolution X-ray diffractionprovides a unique tool: the propagation of a specific SAW, aRayleigh wave, induces a sinusoidal modulation of theatomic planes at the surface of a crystal which extends intothe bulk (Figure 87). This leads to X-ray diffraction satelliteswhose pattern and intensities can be compared with amodel, allowing the retrieval of important parameters of theSAW, such as the acoustic amplitude at the surface, H0, thepenetration depth of the acoustic wave, µac
-1, and theacoustic wave vector K.
A systematic study of X-ray diffraction by SAWsin a LiNbO3 crystal was carried out on the opticsbeamline BM5, varying the acoustic amplitude,the acoustic wavelength Λ, the crystal cut andthe X-ray energy. Triple-axis diffractometry wasrequired to separate diffraction satellite peaksinduced by the acoustic wave periodicity from
the “ordinary” Bragg reflection. Figure 88 shows two typicalrocking curves of a LiNbO3 (030) YX-cut crystal recorded ata fixed X-ray energy of 13 keV, Λ = 12 µm, and acousticamplitudes of 1.0 Å and 2.4 Å, respectively.
In order to interpret the spectra, we developed a simplemodel within the framework of kinematic X-ray diffractiontheory, in which the SAW is treated as a strong perturbation,suppressing the dynamical X-ray diffraction properties of aperfect single crystal. Assuming an exponential dampingof the acoustic amplitude along z, the vertical displacementsof atoms with coordinates (x,y,z) can be written as: H(x,z) =H0exp(-µacz)exp(-iKx), where K = 2π/Λ, and µac
-1 is of theorder of the acoustic wavelength, i.e. a few micrometres.This model is expected to provide a correct quantitativedescription as long as the ratio between the acoustic and theX-ray penetration depth, µx
-1, is higher than 1.This conditionis fulfilled for the spectra shown in Figure 88, as can be seenfrom the good agreement between experiment and modelcalculation.
If, on the other hand, the X-ray beam penetration is largerthan the excited layer thickness, the kinematic model fails,since a significant amount of the undistorted crystal volumecontributes to the diffraction pattern.This is demonstrated inFigure 89 where two rocking curves recorded at 18 and20 keV, straddling the Nb K edge, are displayed. Due to thelarge contribution of undistorted regions at 18 keV (high X-ray penetration depth µx
-1 ~ 25.6 µm), the 0th order peak,arising from diffraction of the perfect (unperturbed) crystallattice, is predominant, while in the opposite case(E = 20 keV, µx
-1 ~ 4.6 µm), the 0th order peak remains at thesame level as the other ones. In the latter case, thekinematic model is still valid (as for the spectra reported inFigure 88), while in the first case, dynamical diffractioneffects have to be taken into account. The development ofsuch a refined model is currently in progress.
Principal Publication and Authors R. Tucoulou (b, c), F. de Bergevin (b), O. Mathon (c) andD.V. Roshchupkin (b), Phys. Rev. B 64, 134108 (2001).(a) Laboratoire de Cristallographie, CNRS, Grenoble(France)(b) Institute of Microelectronic Technology, RussianAcademy of Sciences, Chernogolovka (Russia)(c) ESRF
Fig. 87: Scheme of the atomic planes distorted by the acousticwave. The z scale is multiplied by a factor 104 with respect tothe x one. Only a few planes are represented.
Fig. 88: Rocking curves measured (solid circles) andcalculated (open circles) for two acoustic amplitudes. E = 13keV; Λ = 12 µm; (030) reflection.
Fig. 89: Rocking curves measured at 18 and 20 keV. Λ = 12 µm; (030) reflection; H0 ≈ 4.5 Å.

HIGHLIGHTS 2001 64ESRF
In this section, we present a small selectionof articles in the areas of magnetism andelectronic structure. In particular spin,orbital, charge order, and their interplayhave been studied in many differentmaterials. These articles are brieflyintroduced below.
Magnetic multilayers are very interesting aspotential new magnetic recording media.There have been many studies in the lastfew years and new phenomena are stillbeing discovered. For example, themagnetic coupling in 3d-5d materials isfound to be a case of a 'violation' of thepure intra-atomic Hund's rule picture(Wilhelm et al., page 65). Another obviousissue for recording materials, is the speedat which magnetic materials can beswitched. Time-resolved studies have shownthat dynamic magnetic coupling can bevery different from static (Bonfim et al.,page 66). A further important parameterfor a magnetic material is itsmagnetocrystalline anisotropy energy.The experimental verification of X-raymagnetic linear dichroism as a direct probeof this quantity is consequently of greatsignificance (Dhesi et al., page 67).Magnetic nanostructures have also beengrowing in importance, as the quest fordenser recording media becomes morepressing. Basic studies of ultrasmall Feislands show that, here again, unexpectedphenomena can be observed (Röhlsbergeret al., page 69).
X-ray resonant scattering is an increasinglyimportant probe of charge, magnetic andorbital ordering phenomena. Severalexamples are given: the existence of 1-dimensional charge order in Yb4As3 isdemonstrated (Staub et al., page 70), thefirst observation of quadrupolar order ofthe 5f electrons in UPd3 is made(McMorrow et al., page 71), and theinteresting coupling between spin and
ESRF
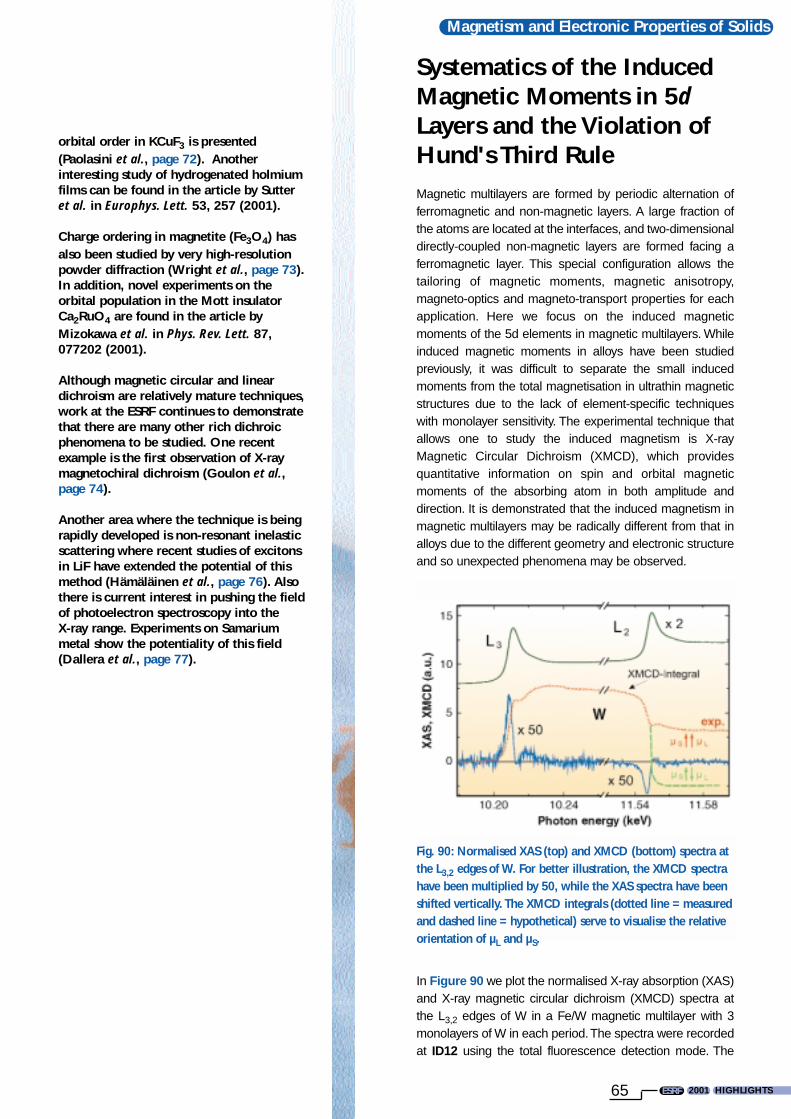
ESRF
Magnetism and Electronic Properties of Solids
65
orbital order in KCuF3 is presented(Paolasini et al., page 72). Anotherinteresting study of hydrogenated holmiumfilms can be found in the article by Sutteret al. in Europhys. Lett. 53, 257 (2001).
Charge ordering in magnetite (Fe3O4) hasalso been studied by very high-resolutionpowder diffraction (Wright et al., page 73).In addition, novel experiments on theorbital population in the Mott insulatorCa2RuO4 are found in the article byMizokawa et al. in Phys. Rev. Lett. 87,077202 (2001).
Although magnetic circular and lineardichroism are relatively mature techniques,work at the ESRF continues to demonstratethat there are many other rich dichroicphenomena to be studied. One recentexample is the first observation of X-raymagnetochiral dichroism (Goulon et al.,page 74).
Another area where the technique is beingrapidly developed is non-resonant inelasticscattering where recent studies of excitonsin LiF have extended the potential of thismethod (Hämäläinen et al., page 76). Alsothere is current interest in pushing the fieldof photoelectron spectroscopy into the X-ray range. Experiments on Samariummetal show the potentiality of this field(Dallera et al., page 77).
ESRF
Systematics of the InducedMagnetic Moments in 5dLayers and the Violation ofHund's Third RuleMagnetic multilayers are formed by periodic alternation offerromagnetic and non-magnetic layers. A large fraction ofthe atoms are located at the interfaces, and two-dimensionaldirectly-coupled non-magnetic layers are formed facing aferromagnetic layer. This special configuration allows thetailoring of magnetic moments, magnetic anisotropy,magneto-optics and magneto-transport properties for eachapplication. Here we focus on the induced magneticmoments of the 5d elements in magnetic multilayers. Whileinduced magnetic moments in alloys have been studiedpreviously, it was difficult to separate the small inducedmoments from the total magnetisation in ultrathin magneticstructures due to the lack of element-specific techniqueswith monolayer sensitivity. The experimental technique thatallows one to study the induced magnetism is X-rayMagnetic Circular Dichroism (XMCD), which providesquantitative information on spin and orbital magneticmoments of the absorbing atom in both amplitude anddirection. It is demonstrated that the induced magnetism inmagnetic multilayers may be radically different from that inalloys due to the different geometry and electronic structureand so unexpected phenomena may be observed.
In Figure 90 we plot the normalised X-ray absorption (XAS)and X-ray magnetic circular dichroism (XMCD) spectra atthe L3,2 edges of W in a Fe/W magnetic multilayer with 3monolayers of W in each period.The spectra were recordedat ID12 using the total fluorescence detection mode. The
Fig. 90: Normalised XAS (top) and XMCD (bottom) spectra atthe L3,2 edges of W. For better illustration, the XMCD spectrahave been multiplied by 50, while the XAS spectra have beenshifted vertically. The XMCD integrals (dotted line = measuredand dashed line = hypothetical) serve to visualise the relativeorientation of µL and µS.
2001 HIGHLIGHTS

HIGHLIGHTS 2001 66ESRF
Magnetism and Electronic Properties of Solids
ESRF
XMCD signals are very small compared to XAS, as the largescaling factor of 50 reveals. However, the signal-to-noiseratios are still large due to the high photon flux and degreeof polarisation offered at the ESRF. By knowing the directionof the magnetic field and the helicity of the beam weconclude that W is polarised antiparallel (AFM) to Fe, inagreement with previous reports for alloys.This behaviour isconsistent with the general trend for the transition metalswith a less-than-half-filled d shell. However, contrary to thethird Hund’s rule, the W spin µS and orbital µL magneticmoments are coupled in parallel (FM). This is visualised viathe XMCD integrals in Figure 90. The measured integral(dotted line) does not change sign showing that µL/µS > 0.For a negative sign (AFM coupling) the XMCD integralshould change sign as the hypothetical dashed line ofFigure 90 reveals. This can not be understood in a singleatomic picture. One has rather to consider interatomic spin-orbit coupling. We consider three types of interactionpossible: (i) the largest is the spin-spin coupling between Feand W, Jinter
. SzFe . Sz
W, (ii) in addition, we have the classicalintra-atomic spin-orbit coupling for W, λintra
. SzW . Lz
W. If thiswas all, µL should be AFM coupled to µS. To understand theopposite observation (FM coupling) one may propose (iii) aninteratomic Fe-W spin-orbit interaction λinter
. SzFe . Lz
W. Asshown in Figure 91, we conclude the inequality that theinteratomic spin-orbit coupling is smaller than the exchangecoupling but larger than the intra-atomic spin-orbit couplingof W. Such an effect is attributed to hybridisation effects atthe Fe/W interface [1].
Results for the ratio µL/µS and the total moment µtot
derived by application of the sum rules for the beginning(W) and the end (Ir,Pt) of the 5d series in magneticmultilayers are listed in Table 2 [2]. µL/µS is significantonly for Pt (≈ 0.2-0.3) revealing a large orbital magnetismcontribution. Moreover, we find µtot ≈ 0.2 µB/atom for bothIr and W, which is in fair agreement with recent ab initiocalculations.
Pt Ir WµL/µS 0.2-0.3 0.10 0.09µtot 0.17-0.29 0.2 -0.2
Table 2: Data for the ratio µL/µS and the total magneticmoment µtot for three 5d elements (Pt, Ir, W).
In conclusion, systematic trends for the induced magnetismof elements of the 5d series in multilayers are shown.Thesemultilayers may serve as a demonstration of a prototypeexperimental case of a ‘violation’ of the pure intra-atomicHund’s rule picture, which can be understood via theexistence of strong interatomic interactions at the 3d/5dinterfaces.
References[1] F. Wilhelm et al., Phys. Rev. Lett. 87, 207202 (2001).[2] P. Poulopoulos et al., Phys. Stat. Sol. (a) (in press).
AuthorsF. Wilhelm (a), P. Poulopoulos (a), H. Wende (a), A. Scherz(a), K. Baberschke (a), M. Angelakeris (b), N.K. Flevaris (b)and A. Rogalev (c).(a) FUB, Berlin (Germany)(b) AUTh, Thessaloniki (Greece)(c) ESRF
Element-selectiveNanosecond MagnetisationDynamics in Spin Valves Sub-nanosecond dynamics of magnetisation reversal in thinmagnetic films is essential for the future of magneticrecording and non-volatile magnetic memories, wherewriting and reading times already approach the nanosecondtimescale [1]. Commercial magnetic read heads use giant-magnetoresistance sensors based on spin valves, complexmultilayer systems in which a soft free layer is separatedfrom a hard magnetic layer by a non-magnetic metallicspacer. A complete understanding of the magnetisationdynamics of a spin valve requires the ability to probe themagnetisation of the individual layers as well as their mutualinteraction. This investigation is possible with the time-resolved X-ray Magnetic Circular Dichroism (XMCD)measurements, which we have developed at the ESRF.As an example, we show results obtained forNi80Fe20(5nm)/Cu/Co(5nm) spin valves.
XMCD experiments were carried out in single bunch modeon beamline ID12B. Time-resolution is achieved using apump-probe (stroboscopic) scheme by synchronising themagnetic pulses created by a microcoil (pump) with the X-ray photon pulses (probe), at the repetition frequency ofthe ESRF (357 kHz). X-ray absorption is measured in
Fig. 91: Schematic representation of the Fe/W layers and thevarious type of interactions that one needs in order todescribe the violation of the third Hund’s rule in a simpleatomic model.

2001 HIGHLIGHTSESRF
Magnetism and Electronic Properties of Solids
67 ESRF
fluorescence detection by mounting the sample in the gap ofthe microcoil. Chemical selectivity is obtained by tuning thephoton energy to the Co L3 or the Ni L3 white lines to studythe cobalt and the permalloy layers respectively.
The Ni80Fe20/Cu/Co sample is saturated in the negativedirection by a static field applied along the easymagnetisation axis of the sample and a short positivemagnetic pulse is applied to reverse the film magnetisation.The X-ray absorption of the two layers is measured at theselected energy as a function of the delay between pumpand probe, for right (σ-) and left (σ+) circular polarisation.Thedifference signal (σ- – σ+) gives the XMCD vs. delay andtherefore the time-dependence of the magnetisation of theprobed layer. An average of about 105 pulses are needed toobtain a good signal-to-noise ratio.
The quasi-static magnetisation cycles, measured by XMCD(Figure 92a), show that for 6 and 8 nm of Cu themagnetisation of the two magnetic layers are alignedparallel, with Co and Ni80Fe20 reversing simultaneously in acoercive field of 4-5 mT. For 10 nm of Cu the magnetic layersare nearly uncoupled and two separate hysteresis curvesare measured.
The results of the dynamic measurements obtained with30 ns-long pulses are shown in Figure 92b. For 10 nm and6 nm of Cu the dynamic behaviour is similar to the static case.For 10 nm of Cu the two layers are uncoupled while for 6 nmof Cu the dynamic response is identical for the two layers.
In the 8 nm Cu sample the two FM layers are stronglycoupled in the quasi-static regime but the dynamic reversalis different for the two layers. On the rising edge of the pulse,the two layers reverse with a different speed, the Ni80Fe20
magnetisation reversing well before Co. On the falling edge,the Ni80Fe20 magnetisation also decays faster than Co.
However, a tail in the magnetisation decay showsthat a fraction of the Ni80Fe20 layer remains coupledto Co. Apparently, in contrast with the static regime,there is a field range in the dynamic regime where anearly antiparallel configuration between the twolayers is achieved. This difference in magneticcoupling in static and dynamic regimes is illustratedhere for the first time thanks to the chemicalselectivity of XMCD. We attribute this behaviour to adifference in the reversal processes - dominated bydomain wall propagation in the static regime,dominated by nucleation in fast dynamics [2].
References[1] for a review see W.D. Doyle, S. Stinnett, C.
Dawson and L. He, J. Magn. Soc. Jpn 22, 91 (1998).[2] M. Bonfim, G. Ghiringhelli, F. Montaigne, S. Pizzini, N.B.Brookes, F. Petroff, J. Vogel, J. Camarero and A. Fontaine,Phys. Rev. Lett. 86, 3646 (2001).
Principal Publication and AuthorsM. Bonfim (a), G. Ghiringhelli (b), F. Montaigne (c), S. Pizzini(a), N.B. Brookes (b), F. Petroff (c), J.Vogel (a), J. Camarero(a) and A. Fontaine (a), Phys. Rev. Lett. 86, 3646 (2001).(a) Laboratoire Louis Néel, CNRS, Grenoble (France)(b) ESRF(c) Unité mixte CNRS/Thales, Domaine de Corbeville,Orsay (France)
Establishing X-ray MagneticLinear Dichroism as a Probeof the MagnetocrystallineAnisotropyThe magnetocrystalline anisotropy energy (MAE) is theenergy required to rotate the magnetisation (M) away fromthe easy direction of magnetisation and plays a key role inthe development of magnetic storage media. In magneticmultilayers the interface MAE stabilises perpendicularmagnetic anisotropy, which is important for high-storagedensity, and affects oscillatory exchange coupling, whichgoverns magnetoresistance in reading devices. Amicroscopic understanding of the interface MAE is thereforeimportant, but requires a probe which is element and site-specific. X-ray absorption spectroscopy (XAS) is a well-established element-specific probe of localised electronic
Fig. 92: Static and dynamic measurements of Co/Cu/Ni80Fe20
trilayers: (a) Static hysteresis loops measured by XMCD for theCo (open dots) and Ni80Fe20 (squares) layers; (b) Dynamicresponse of the permalloy (top) and cobalt layer (bottom) topulsed fields from 9 to 23 mT and width 30 ns.

HIGHLIGHTS 2001 68ESRF
Magnetism and Electronic Properties of Solids
ESRF
structure since it involves transitions from core levels tostates above the Fermi level. For transition metals, dipoleselection rules ensure that 2p core levels are excited into theunoccupied 3d levels which are the states driving themagnetism. In recent years, X-ray magnetic circulardichroism (XMCD), which is XAS combined with circularly-polarised light, has emerged as a unique element-specifictool for separating the spin and orbital magnetic moments inferri- and ferromagnetic systems. XMCD can then yield theorbital moment anisotropy, which is related to the MAE via aperturbation model. However, this approach is far from idealbecause the orbital moment anisotropy is strictly notproportional to the MAE. Since the MAE arises from thespin-orbit interaction, a technique probing this quantity wouldseem far more appropriate. XAS combined with linearly-polarised light, X-ray magnetic linear dichroism (XMLD), hasbeen proposed as a means of measuring the anisotropy inthe spin-orbit interaction which can be related to the MAEusing a straight forward sum rule [1]. XMLD also has theadded advantage that it is sensitive to antiferromagnetism aswell as ferri- and ferromagnetism.
In order to verify the proposed relationship between XMLDand the MAE a Cu crystal with 5 miscut surfaces, at an angleω from (001), was used as a substrate for growing ultrathinfilms of Co. For stepped Co surfaces, grown on Cu, it is
known from surface magneto-optical Kerr measurementsthat the MAE increases linearly with step density [2]. Theexperiments were carried out on beamline ID12B (now ID8)which is an intense source of polarised soft X-rays. Co XASspectra recorded for a stepped Co film grown on Cu (ω= 4°)with M perpendicular (solid line) and parallel (broken line) toE are shown in Figure 93 along with resulting XMLD (solidcircles). The double peaked structure arises due totransitions from the spin-orbit split 2p core levels tounoccupied 3d states. The inset of Figure 93 shows theintegral of the XMLD which should be zero if there is nocontribution from the charge anisotropy. Figure 94 showsthe MAE of the stepped Co films, determined using XMLD,as a function of step density. The same linear trend for theMAE determined using XMLD proves that XMLD is directlyrelated to the MAE. This establishes experimentally XMLDas a new element-specific tool for studying themagnetocrystalline anisotropy and opens up the possibilityof, for instance, magnetic anisotropy imaging using high-resolution photoelectron emission microscopy acrosssymmetry broken surfaces and exchange biased interfaces.
References[1] G. van der Laan, Phys. Rev. Lett. 82, 640 (1999).[2] R. Kawakami et al., Phys. Rev. B 58, R5924 (1998).
Principal Publication and AuthorsS.S. Dhesi (a), G. van der Laan (b), E. Dudzik (c) andA.B. Shick (d), Phys. Rev. Lett. 87, 067201 (2001).(a) ESRF(b) Daresbury Laboratory, Warrington (UK)(c) Hahn-Meitner-Insitut, Berlin (Germany)(d) University of California, Davis (USA)
Fig. 93: Co L2,3 XAS, from 6 monolayers of Co grown onCu(ω = 4º), measured with M perpendicular (solid line) and Mparallel (dashed line) to E. The XMLD (dots with guideline) isthe difference between the two XAS spectra and has anintegrated intensity close to zero (open circles in the inset).
Fig. 94: The Co MAE determined from the XMLD as a functionof step density. The straight line is a linear fit to the data. Theright axis has been calculated assuming a Co atomic volumeof 8.47x10⁻²⁸ m3.

2001 HIGHLIGHTSESRF
Magnetism and Electronic Properties of Solids
69 ESRF
Magnetic Order inUltrasmall Iron Islands onTungsten (110)The magnetic structure of nanoparticles is a fascinatingresearch area with many new and unexpected results. Itsrelevance results from fundamental aspects of spin structurein low-dimensional systems and technological applicationsin fields like magnetic recording as well. Magnetism in low-dimensional systems relies on various kinds of anisotropies.A well-established model system is the pseudomorphic Femonolayer on W(110) that exhibits a pronounced in-planeanisotropy.
At coverages below 0.58 monolayers, one observes theformation of stable and well-separated pseudomorphicislands with diameters of about 2 nm, as shown inFigure 95. These structures should exhibit a differentmagnetic order when compared to a continuous film, e.g.due to elastic strain and the change of interatomic distances.From previous studies it is already known that above 100 Kthese islands appear nonmagnetic due to thermalfluctuations of the magnetic moments (superparamagneticrelaxation). However, the magnetic order of these islands inthe low-temperature regime has not been studied so far.Surprisingly, we found strong evidence for a perpendicularspin orientation in this system below 100 K.
Studies of the magnetic order were performed at beamlineID18, employing nuclear resonant scattering at the 14.4 keVresonance of 57Fe. The Fe islands were prepared underUHV conditions on a clean W(110) surface, and coated withabout five monolayers of Ag. Time spectra of the grazing-incidence reflectivity were recorded at various temperatures.Two selected data sets are shown in Figure 96. From theanalysis of these spectra the magnitude and the orientationof magnetic fields in the sample can be derived [1]. Thealmost monotonous decay of the time spectrum at 300 Kindicates the system to be nonmagnetic. At lowtemperatures an additional modulation appears in the
spectra. This pattern is characteristic for a perpendicularspin orientation of the Fe islands with a magnetic hyperfinefield of 13.5 T. The right panel in Figure 96 shows thehyperfine field distributions as obtained from the theoreticalsimulation (red lines).
To understand this unexpected magnetic ordering one hasto investigate the contributions from different kinds ofmagnetic anisotropies if a continuous film breaks up intoseparated islands: First, due to the small island size theshape-anisotropy that favours an in-plane magnetisation isreduced, and, secondly, the relaxation of the elastic strain inthe film leads to a strong contribution to the magneto-elasticanisotropy.
This interpretation is supported by a striking elastic behaviourin this system that has been observed recently [2]. Bothcontributions and the influence of the Ag capping layer finallychange the total anisotropy to favour a perpendicular spinorientation. Future studies on size-selected nanoparticles willelucidate this relationship in more detail.
References[1] Special issues about Nuclear Resonant Scattering ofSynchrotron Radiation edited by E. Gerdau and H. deWaard, Hyperfine Interactions 123/124 (1999) and 125(2000).[2] D. Sander, A. Enders, and J. Kirschner, Europhys. Lett.45, 208 (1999).
Principal Publication and AuthorsR. Röhlsberger (a), J. Bansmann (a), V. Senz (a), K.L. Jonas(a), A. Bettac (a), O. Leupold (b), R. Rüffer (b), E. Burkel (a)and K.H. Meiwes-Broer (a), Phys. Rev. Lett. 86, 5597-5600(2001).(a) Universität Rostock, Fachbereich Physik, Rostock(Germany)(b) ESRF
Fig. 95: STM image of Fe islands on W(110) at a coverage of0.57 bulk monolayers, deposited at a temperature of 450 K.
Fig. 96: Time spectra of nuclear resonant grazing-incidencereflection from ultrasmall Fe islands on W(110). While thedata recorded at 300 K represent a nearly nonmagnetic state,the islands order magnetically at low temperatures with aperpendicular spin orientation. The corresponding hyperfinefield distributions are shown in the right panel.

HIGHLIGHTS 2001 70ESRF
Magnetism and Electronic Properties of Solids
Direct Observation of One-dimensional ChargeOrder in Yb4As3
Metal-insulator (MI) transitions have recently attractedrenewed interest due, in particular, to their relevance forsuperconductivity and colossal magnetoresistance. Themetal-insulator transition is often related to charge, orbitaland/or magnetic order.Yb4As3 is an exotic material, with anincomplete metal-insulator transition, which has beenproposed to be driven by a 1-dimensional charge order. Atroom temperature, Yb4As3 is a cubic metal. Assuming acharge of –3 for As, each Yb has an average non-integralvalence of +2.25. At TMI ~ 290 K, there occurs a first-order
structural phase transition from cubic to rhombohedralsymmetry, associated with the metal-insulator transition. Toquantitatively study the proposed 1-dimensional chargeorder, we have performed resonant X-ray diffraction at ID11on a tiny crystal (40 x 40 x 40 µm3). A small crystal has theadvantage that it is less likely to be destroyed when coolingthrough the transition.
The equally spaced Yb ions located along the body diagonalcan be viewed as forming a chain labelled A, and theremaining Yb ions are labelled B. The experiments havefocused on reflections for which the structure factor isproportional to (fA-fB). The difference in the scattering factorf of Yb2+ and Yb3+ far away from resonance is very small.However, in the vicinity of the Yb L3 resonances, which aresplit by 7 eV, the individual scattering factors are verydifferent. Therefore, the diffracted intensity is stronglyenhanced (Figure 97), giving direct evidence of the 1-dimensional charge order.
To reliably describe the energy dependence of thesereflections, knowledge of the real and imaginary parts of thescattering factors is required. This we obtained from X-rayabsorption data and the Kramers-Kronig transformation.Thecalculated energy-dependent intensity compares well withthe experiment and is a direct indication of the 1-dimensionalcharge order in Yb4As3. The proportionality of the resonantdiffracted intensity to (fA-fB)2 allows a quantitativedetermination of the temperature-dependent valences(Figure 98).
Our results have direct implications on the model, whichdescribes the electronically driven metal-insulator transitionin terms of a band Jahn-Teller effect of correlated electrons[1]. The Yb valence of site A decreases much less withincreasing temperature than predicted by the model.The Ybvalence can also be estimated from the length of the body-diagonal of the distorted cube. Surprisingly, the temperaturedependence of the valence determined in this way isdistinctly weaker than that of the hole concentration on thechain. This may be due to the strong Coulomb repulsionbetween ordered holes, to an electronic contribution to the
Fig. 97: Energy dependence of the real (f’; top), and theimaginary (f’’; center) parts of the scattering factors of Yb2+
and Yb3+, and of the 30–3 reflection, together with a fit to the
latter in the vicinity of the Yb L3-absorption edges in Yb4As3.
Fig. 98: Temperature dependence of the site-selective Ybvalence/hole concentration from resonant diffraction(open/closed circles), from the model [1] (broken curve) andfrom the structure (dotted curve).

2001 HIGHLIGHTSESRF
Magnetism and Electronic Properties of Solids
71
lattice expansion or to different fluctuation time scales of thecharge and the lattice distortions.
In conclusion, resonant X-ray scattering experiments onYb4As3 directly confirm the existence of the 1-dimensionalcharge order of holes on the Yb sites below TMI. In addition,a temperature-dependent hole ordering is obtained which,surprisingly, does not follow the structural distortion.
Reference[1] P. Fulde, B. Schmidt and P.Thalmeier, Europhys. Lett. 31,323 (1995).
Principle publication and AuthorsU. Staub (a), B.D. Patterson (a), C. Schulze-Briese (a),F. Fauth (a,b), M. Shi (a), L. Soderholm (c), G.B.M.Vaughan(b) and A. Ochiai (d), Europhys. Lett. 53, 72 (2001).(a) Swiss Light Source, Paul Scherrer Institute, Villigen(Switzerland)(b) ESRF(c) Chemistry Division, Argonne National Laboratory,Argonne, (USA)(d) Center for Low Temperature Science, Tohoku University,Sendai, (Japan)
Quadrupolar Order of the5f Electrons in UPd3 Studiedwith Resonant X-rayScatteringThe electron-shell specificity of X-ray resonant scattering(XRS) is now widely used to investigate a diversity ofordering phenomena in solids. Examples include magnetic,orbital and more recently quadrupolar order. Restrictionsimposed by accessible absorption edges often mean that itis difficult to probe the electron states responsible for theorder. Using XRS at the U MIV edge (3d3/2 – 5f5/2), we havestudied directly the anti-ferroquadrupolar (AFQ) order of the5f electrons in UPd3.
From earlier studies of bulk properties and neutronscattering it had been established that below T0 (≈ 7.6 K)UPd3 undergoes a sequence of transitions between differentAFQ structures (Figure 99). Neutron diffraction, which is notdirectly sensitive to the AFQ order, but does measure anyaccompanying lattice distortions, showed the existence oftwo distinct ordering wavevectors, q = (1,0,l), with l even orodd (orthorhombic notation).
Our XRS experiments were performed on ID20. At basetemperature (T = 1.6 K), superlattice peaks were observedat (1,0,3) and (1,0,4). Both peaks displayed resonant
behaviour close to the dipolar transition energy (3.728 keV)at the MIV edge of U, confirming that the peaks originatefrom ordering of the 5f electrons. At resonance, thepolarisation properties of each peak were then determinedas a function of temperature, and the results aresummarised in Figure 100. Particularly noticeable is theexistence of strong critical scattering at (1,0,3) for T > T0.
For the phase between T1 < T < T0, the (1,0,3) reflectionappears in the (π−π) channel at resonance. Detailedcalculations of the cross-section show that this is consistentwith the AFQ structure shown in Figure 99a. Below T1 the(1,0,4) reflection appears mainly in the (π−σ) channel, and a
Fig. 99: Proposed AFQ structures in UPd3. (a) The U 5fquadrupole moments on the quasi-cubic sites of the dhcp unitcell are represented as ellipsoids. Within one basal (x-y) planethere is a doubling of the unit cell along x. For the phasebetween T1 < T < T0 there is an anti- phase stacking ofquadrupole moments along z. (b) Possible structure of theAFQ phase below T1.
Fig. 100: Temperature dependence of the (a) (1,0,3) and (b)(1,0,4) superlattice peaks measured with a polarisationanalyser at the MIV edge of U. For each peak the unrotated(π−π) (filled symbols) and rotated (π−σ) (open symbols)components of the scattering were measured.

HIGHLIGHTS 2001 72ESRF
Magnetism and Electronic Properties of Solids
weak (π−σ) component also develops at (1,0,3). Thisindicates that below T1 the ellipsoids must distort away fromthe high-symmetry directions. A structure consistent with ourobservations is shown in Figure 99b.
In conclusion, our XRS experiments give direct evidence forAFQ ordering of the 5f electrons in UPd3, and provide newinsight into the nature of the phase transitions in thisfascinating compound.
Principal Publication and AuthorsD.F. McMorrow (a), K.A. McEwen (b), U. Steigenberger (c),H.M. Rønnow (a) and F. Yakhou (d), Phys. Rev. Lett. 87,057201 (2001).(a) Risø National Laboratory (Denmark) (b) University College London (UK)(c) ISIS Facility (UK) (d) ESRF
Coupling Between Spin andOrbital Order in KCuF3
The interplay between charge, orbital and spin degrees offreedom is the key ingredient underlying the physics oftransition-metal oxides. An ideal tool for studying theconsequences of such a correlation is provided by resonantX-ray scattering (RXS), a process in which photons arevirtually absorbed by exciting the core electron to emptystates, and subsequently re-emitted when the excitedelectrons and the core holes recombine. We applied thistechnique to a pseudo-cubic perovskite KCuF3, whereorbital order has been theoretically predicted belowTOO = 800 K, and three-dimensional antiferromagnetismobserved below TN = 38 K. The results show that magneticorder is driven by orbital ordering, and that the orbital orderparameter acts as a hidden parameter of the magnetictransition.
The experiment was performed on ID20 at the Cu K-absorption edge. The sensitivity to magnetic order at thequadrupole threshold, 1s-3d, has its origin in the spinpolarisation of the 3d states, whilst at the 1s-4p dipoletransition-energy the resonant enhancement for magneticreflections is due to the 4p-3d intra-atomic Coulombinteraction and to the mixing of the 4p with the 3d states ofneighbouring Cu atoms. RXS is also sensitive to theoccupancy of 3d valence orbitals, and has been used toprobe long-range orbital order in several transition-metaloxides [1, 2]. Forbidden reflections become permitted due tothe asphericity of the atomic electron density, giving rise toanomalous tensor susceptibility (ATS) components in theatomic scattering factor.
At the dipole resonance, superlattice reflections wereobserved at Bragg positions corresponding to a propagation
vector <111> and, below TN, <001>. The former indicate analternate occupation of 3dx2-z2 and 3dy2-z2 Cu2+ hole orbitals,the latter signal the occurrence of antiferromagnetic (AF)order. Both the magnetic and orbital peaks exhibit anoscillation with two-fold symmetry when the crystal is rotatedaround the scattering vector, as shown in Figure 101. Theshift of 45° between the two curves is a direct proof that theCu magnetic moments are directed along the [110] directionof the pseudocubic cell whilst the main contribution to orbitalsignal comes from the difference in px(y) density of states onthe two sublattices (inset of Figure 101).
As T is lowered, no variations are observed for the chargepeaks, neither in intensity nor in position and width. On the
Fig. 101: Angular dependence of the magnetic (005) andorbital (331) intensities. Data were taken at 12K in σ−π'channel using LiF(004) analyser, with the incident energytuned at E = 8.992 keV. The inset shows the crystal structureof KCuF3, with a possible ordered pattern of the Cu 3dorbitals. The arrows indicate the direction of the magneticmoments in the ordered phase.
Fig. 102: Temperature dependence of the integrated intensityof the (331) orbital ordering peak (blue circles) and themagnetic (441) Bragg reflection (red circles). The qualitativebehaviour of the orbital order parameter ψ as a function oftemperature, computed in the mean-field approximation, isshown in the inset.

2001 HIGHLIGHTSESRF
Magnetism and Electronic Properties of Solids
73
other hand, the intensity of the orbital peaks, which ispractically constant down to 43 K, increases below thistemperature and saturates below 38 K (Figure 102). Asimilar increase in intensity of the orbital peaks, in atemperature region where the orbital order parameter y isexpected to be saturated, has been reported near TN forseveral manganites [2].
An account for the behaviour of ψ vs T, can be givenassuming that magnetic order is driven by orbital order, inthe sense that the exchange constants betweenneighbouring atoms are determined by the relativeorientation of the occupied orbitals. A simple Landaueffective free-energy F, which assumes that TN isdetermined by the exchange constants and that those are inturn related to ψ, can be easily written as a function of ψ andthe magnetic order parameter S. At high temperature,T > TOO, both ψ and S are zero. As T becomes smaller thanTOO, ψ begins to grow, with S still vanishing until TN isreached. For T < TN, also S is non vanishing; the equationdetermining ψ is then modified, being given by theminimisation of F with respect to both order parameters. Asshown in the inset of Figure 102, a steeper rise and a largersaturation value of ψ is obtained as the temperature furtherdecreases below TN, in agreement with the experiment.
References[1] Y. Murakami et al., Phys. Rev. Lett. 80, 1932 (1998);Y. Murakami et al., ibidem 81, 582.[2] L. Paolasini et al., Phys. Rev. Lett. 82, 4719 (1999).
Principal Publication and AuthorsL. Paolasini (a), R. Caciuffo (b), A. Sollier (a) P. Ghigna (c)and M. Altarelli (d), Phys. Rev. Lett., in press (2002).(a) ESRF(b) INFM and Dipartimento di Fisica, Università di Ancona(Italy)(c) Dipartimento di Chimica Fisica, Università di Pavia (Italy)(d) Sincrotrone ELETTRA, Trieste (Italy)
Charge Ordering inMagnetite Below the VerweyTransitionMagnetite (Fe3O4) is the eponymous magnetic material,whose properties were first recorded by Greek writers in~800 B.C. At ambient temperatures magnetite isferrimagnetic and electrically conducting, with a cubicinverse spinel crystal structure. Below the 122 K Verweytransition [1], the conductivity falls by a factor of ~100 and asmall structural distortion is observed. This transition hasbeen assumed to be the result of Fe2+/Fe3+ charge ordering,although a detailed picture of the low temperature phase hasyet to emerge.
In order to further characterise the low temperature structurewe have refined the crystal structure of magnetite at 90 Kusing very highly resolved powder X-ray (BM16) andneutron diffraction data (HRPD, ISIS). The compression ofthe three dimensional reciprocal space into one dimensionin the powder diffraction pattern is compensated by avoidingmany of the technical difficulties associated with singlecrystal experiments for this sample, which include severetwinning, extinction and multiple scattering effects.
The refined model represents an averaging of the true lowtemperature structure, as a smaller unit cell and non-crystallographic symmetry constraints were required forconvergence of the refinement. Despite these limitations themodel accounts well for the intensities of the vast majority ofthe superstructure reflections, with only very few weakreflections remaining unindexed. The model is similar toprevious results [2] but shows that two of the four uniqueoctahedral iron sites have, on average, significantly longerFe-O distances than the other two. This provides directcrystallographic evidence for at least partial long-rangecharge ordering in magnetite, with an apparent difference of0.2e- between the average charges at the two sets of sites.Figure 103 shows a small region of the fit to the X-ray data,plotted on a logarithmic scale so that the weaksuperstructure peaks can be seen. Data collected above theVerwey transition, at 130 K, are also shown displaced abovethe fit for comparison.
It is possible to account for the pattern of displacements ofthe ions in terms of a [001] charge density wave in thereduced unit cell that was used for refinement. Alternatively,charge-ordered models can be proposed by generating allpossible charge-ordering schemes consistent with the largerunit cell and comparing them to the refined model in thesmaller unit cell. Figure 104 shows the model having thelowest electrostatic repulsion energy while remainingconsistent with the data. While our results do not distinguishbetween these alternatives, it is clear that none of the
Fig. 103: Profile fit to BM16 powder diffraction data forFe3O4. Upper and lower tick marks refer to Fe2O3 (0.8 wt.%)and Fe3O4 respectively.

HIGHLIGHTS 2001 74ESRF
Magnetism and Electronic Properties of Solids
charge-ordering schemes that give the minimal electrostaticrepulsion are consistent with the refined model. Thus,charge-ordering schemes consistent with our refinement donot meet the widely accepted Anderson criterion ofminimum electrostatic repulsion. This indicates that the lowtemperature structure of magnetite is a compromisebetween electrostatic repulsion and structural distortionsand suggests that the transition is driven by an [001]electronic instability, which opens a band gap through acharge density wave mechanism.
References[1] E.J.W. Verwey, Nature, 144, 327-328 (1939).[2] M. Iizumi, T.F. Koetzle, G. Shirane, S. Chikazumi,M. Matsui and S.Todo, Acta. Cryst, B38, 2121-2133 (1982).
Principal Publication and AuthorsJ.P. Wright (a), J.P. Attfield (b) and P.G. Radaelli (c), Phys.Rev. Lett., 87, 266401 (2001).(a) ESRF(b) Chemistry Department, University of Cambridge (UK)(c) ISIS Facility, Rutherford Appleton Laboratories, Chilton(UK)
X-ray MagnetochiralDichroism: A New Probe forParity-violating MagneticSolidsNatural Optical Activity (OA) of visible light was discoveredearly in the 19th century. In contrast, natural OA of X-rayswas discovered quite recently [1]. Unlike magneto-optical
spectroscopies, e.g. Faraday rotation, Magnetic Circular orlinear dichroisms (MCD,MLD), which are all consistent withthe usual electric dipole approximation, OA mixes multipolemoments of opposite parity and thus requires odd spaceparity. Typically, OA of X-rays is caused by electric dipole-electric quadrupole E1.E2 interference terms [1]. It has longbeen argued that OA effects could be either even or odd withrespect to time-reversal: time-reversal even OA propertiesare called natural whereas time-reversal odd properties arecalled non-reciprocal. A non-reciprocal X-ray magnetic lineardichroism (nr-XMLD) has recently been measured at theESRF [2]. We report below another non-reciprocal effect inthe X-ray range which we called X-ray MagnetochiralDichroism (XMχD). We stress that XMχD, unlike X-raymagnetic circular dichroism (XMCD), does not require apolarised beam since it is a property of the Stokescomponent S0.
Magnetoelectric (ME) solids are good candidates to detectXMχD since magnetoelectric properties are odd withrespect to Parity (P) and time reversal (Θ) but are invariantin the product PΘ. The generic example of ME crystals isCr2O3: it has the centrosymmetric corundum space group(R
–3c) but it belongs to the non-centrosymmetric
–3’m’ space-
time group below the Néel temperature. The spin momentscan order in either one of the two 180° domains shown inFigure 105. One can grow such single domains bymagnetoelectric annealing: it consists in heating the crystalin the paramagnetic phase and in applying simultaneouslyalong the c axis a modest electric field E (5 kV/cm) plus aweak magnetic field H (± 0.5T). XMχD experiments werecarried out at the ESRF beamline ID12, all spectra beingrecorded in the fluorescence excitation mode using the mostconvenient backscattering configuration. We producedartificially unpolarised light by incoherent superposition offluorescence excitation spectra recorded with right and leftcircularly polarised incident photons: F0 = F[Rcp] + F[Lcp].We have reproduced in Figure 106 the XMχD spectrummeasured at T = 50K of a (001) Cr2O3 single crystal with thec axis parallel to the wavevector k. It is shown that the signal
Fig. 104: A model charge-ordering scheme for the lowtemperature phase of Fe3O4. Labels 1-4 refer to distinctcrystallographic sites with black and yellow circles indicatingFe2+ and Fe3+, respectively.
Fig. 105: Magnetic structure of the two 180° domains grownby magnetoannealing.

2001 HIGHLIGHTSESRF
Magnetism and Electronic Properties of Solids
75
can be as large as 1.6% due to the strong contribution of theE1E2 interference terms in the X-ray regime. It also appearsfrom Figure 106 that the same XMχD spectrum can beobtained using a powdered pellet of Cr2O3: the price to bepaid is, however, a reduction (1:6) of the amplitude of thesignal whereas the theory of XMχD predicts a slightlysmaller reduction (1:5). Whereas X-ray natural circulardichroism (XNCD) can only be detected in single crystals, itis quite remarkable that XMχD can be measured in apowder due to the fact that the orientational isotropy isbroken by the ME order.
At this stage, there is no existing ab initio computer programwhich would allow the proper simulation of the XMχDspectra but, nevertheless, some valuable information canyet be extracted from the edge selective OA sum rulesderived recently by Carra and co-workers. The effectiveoperator Ωz
– which describes the mixing in the ground stateof p and d atomic orbitals at the Cr absorbing site wasidentified with the orbital anapole. According to grouptheory, the universally cited magnetic group
–3’m’ of Cr2O3 is
not compatible with an invariant anapole moment. There is,however, no deep contradiction with our experiment: ourXMχD spectra reveal that this magnetic group may besuitable to describe the spin configuration but not the overallmagnetic symmetry including orbital moments and currents.In other words, the spin anapole moment of Cr2O3 certainlyvanishes but it is our interpretation that the true space-timesymmetry is most probably only
–3’ since this group admits
the orbital anapole moment Ωz– as invariant.
References:[1] J. Goulon, C. Goulon-Ginet, A. Rogalev, V. Gotte,C. Malgrange, Ch . Brouder and C.R. Natoli, J. Chem. Phys.108, 6394-6403 (1998).[2] J. Goulon, A. Rogalev, C. Goulon-Ginet, G. Benayoun,L. Paolasini, Ch. Brouder, C. Malgrange and P.A. Metcalf,Physical Review Letters, 85, 4385-8 (2000).
Principal Publication and Authors:J. Goulon (a), A. Rogalev (a), F.Wilhelm (a), C. Goulon-Ginet(a,b), P. Carra (a), D. Cabaret (c) and Ch. Brouder (c),submitted to Physical Review Letter (2002).(a) ESRF(b) Université J. Fourier Grenoble-I, Faculté de Pharmacie,La Tronche (France)(c) Universités Paris VI-VII, Laboratoire de Minéralogie-Cristallographie associé au CNRS, Paris (France)
Advances in X-rayDichroism and ResonantDiffraction In the X-ray region, novel dichroic phenomena have beeninvestigated at the ESRF by Goulon and his collaborators,who reported the observation of two effects:
• X-ray natural circular dichroism (XNCD), probed inNa3Nd(digly)3 ⋅ 2NaBF4 ⋅ 6H2O [1] and in α-LiIO3 [2]. (Theeffect was observed at the Nd L3 edge and at the iodineL edges.) • X-ray nonreciprocal linear dichroism (XNLD), detected atvanadium K edge in the low-temperature insulating phase ofa Cr-doped V2O3 crystal [3].
We remind the reader that XNCD measures the differencein absorption between right and left circularly-polarisedradiation. XNLD implies a difference in absorption betweenradiation with linear polarisation parallel or perpendicular toa local symmetry axis.
It is crucial to observe that both phenomena stem from theinterference between electric-dipole (E1) and electric-quadrupole (E2) transitions that raise an inner-shell electronto empty valence orbitals. Detecting a nonvanishing signalthus requires an ordered structure (crystal) and the breakingof space inversion.
The work of Goulon and his collaborators is of particularimportance as it identifies new directions in the microscopicanalysis of materials using X-ray absorption spectroscopy. Infact, simple symmetry considerations indicate that XNCDand XNLD are, respectively, sensitive to the electric andmagnetoelectric properties of crystals.
It is known that X-ray dichroism probes crystalline orderings,which are described by magnetic (orbital momentum andspin) and centrosymmetric charge order parameters, in thecase of pure electric multipole transitions.
Recent work by scientists in the ESRF's Theory Group [4]has shown that E1-E2 dichroism is described by space-inversion-odd electron operators, revealing the presence of
Fig. 106: Comparison of the XMχD spectra recorded with a(001) Cr2O3 single crystal and with a powdered pellet fork //E//H. Note the 1:6 amplitude reduction factor for thepowdered sample.

HIGHLIGHTS 2001 76ESRF
Magnetism and Electronic Properties of Solids
parity nonconserving interactions. XNCD and XNLD arethus sensitive to additional order parameters, which can beobtained from the following fundametal operators: thefamiliar orbital angular momentum L, an electric dipolen = r/r, and Ω = (n x L – L x n)/2, a magnetoelectric vector.Two classes of order parameter are identified:
• Space-odd and time-odd operators, obviously invariantunder the combined symmetry Spaceinversio ⋅ Time-reversal and thus describing magnetoelectric properties ofcrystals.• Time-even and space-odd operators corresponding toone-electron polar properties, which arise from anoncentrosymmetric distribution of charge.
These afford a microscopic interpretation of XNCD andXNLD experiments. (For the readers convenience, asummary of X-ray dichroic effects is provided in Table 3).
As a concluding remark, we would like to observe that theforegoing ideas are readily extended to E1-E2 X-rayresonant scattering. In this case, the form of the scatteringamplitude indicates that ferroelectric and antiferroelectricstructures can be studied using X-rays at resonance. It isbelieved that a confirmation that this is indeed the case isprovided by the change with temperature of the (0,0,3)Hreflection in (V0.972 Cr0.028)2O3 measured by Paolasini et al.[5].
References [1] L. Alagna, T. Prosperi, S. Turchini, J. Goulon, A. Rogalev,C. Goulon-Ginet, C.R. Natoli, R.D. Peacock and B. Stewart,Phys. Rev. Lett. 80, 4799 (1998).[2] J. Goulon, C. Goulon-Ginet, A. Rogalev, V. Gotte,C. Malgrange, C. Brouder and C.R. Natoli, J. Chem. Phys.108, 6394 (1998).[3] J. Goulon, A. Rogalev, C. Goulon-Ginet, G. Benayoun,L. Paolasini, C. Brouder, C. Malgrange, and P.A. Metcalf,Phys. Rev. Lett., 85, 4385 (2000).[4] P. Carra, A. Jerez and I. Marri, cond-mat/0104582.[5] L. Paolasini, S. Di Matteo, C. Vettier, F. de Bergevin,A. Sollier, W. Neubeck, F. Yakhou, P.A. Metcalf andJ.M. Honig, J. Elec. Spec. Rel. Phen. 120, 1 (2001).
AuthorP. CarraESRF
Fluorine K-edge CoreExciton in LiFNon-resonant inelastic X-ray scattering (NRIXS) gives verydetailed information about electronic excitations and theunderlying electronic structure of materials. The measuredinelastic scattering cross-section is proportional to thedynamic structure factor S(q,ω), which is related to thedielectric function e(q,ω) via the fluctuation-dissipationtheorem. The dielectric function then directly couples theelectronic structure and the macroscopic behaviour of amaterial, and it is also measurable via the reflectance andrefractive index, for example. Therefore, severalcomplementary methods, including electron energy-lossspectroscopy, can be used to determine the dielectricresponse. However, the uniqueness of the NRIXS techniquelies on the fact that both the energy and the momentumtransfers (ω and q) to the scattering target can be varied, incontrast to optical spectroscopy, for example.
Depending on the momentum and energy transfer values,various elementary excitations can be probed using NRIXS,giving diverse information on the scattering target. In thehigh-momentum-transfer limit (Compton regime), informationabout the ground-state momentum density can be obtained.If the dynamic structure factor is written using time-dependent formalism as a Fourier transform of the density-density correlation function, it is easy to see that certain typesof collective excitations (plasmons) can be studied as well.Scattering of hard X-rays can also generate single-particleexcitations between valence and conduction bands withenergy losses of only about 1-10 eV, comparable to opticalabsorption, where information on the joint density of statescan be obtained. However, in the case of NRIXS, hard X-rayscan give genuine bulk information even on opaque samplesand can excite electrons across an indirect band gap [1].
We have studied NRIXS from relatively deep-lying fluorine1s core states (often referred to as non-resonant Ramanscattering) of LiF. In the case of inner-shell excitations, thetransition matrix elements become simpler, and it has beenshown that in the low-momentum-transfer limit the scatteringcross-section is directly proportional to the absorptioncoefficient. However, in inelastic scattering the direction ofthe momentum transfer determines the reference coordinatesystem instead of the direction of the polarisation, which isthe case in X-ray absorption.
Nature of Order Parameter X-ray Dichroism Space Inversion Time Reversal X-ray TransitionCharge Linear + + PureMagnetic Magnetic Circular + – E1 or E2Electric Natural Circular – + InterferenceMagnetoelectric Nonreciprocal – – E1-E2
Table 3: Orderparameters and X-ray dichroiceffects.
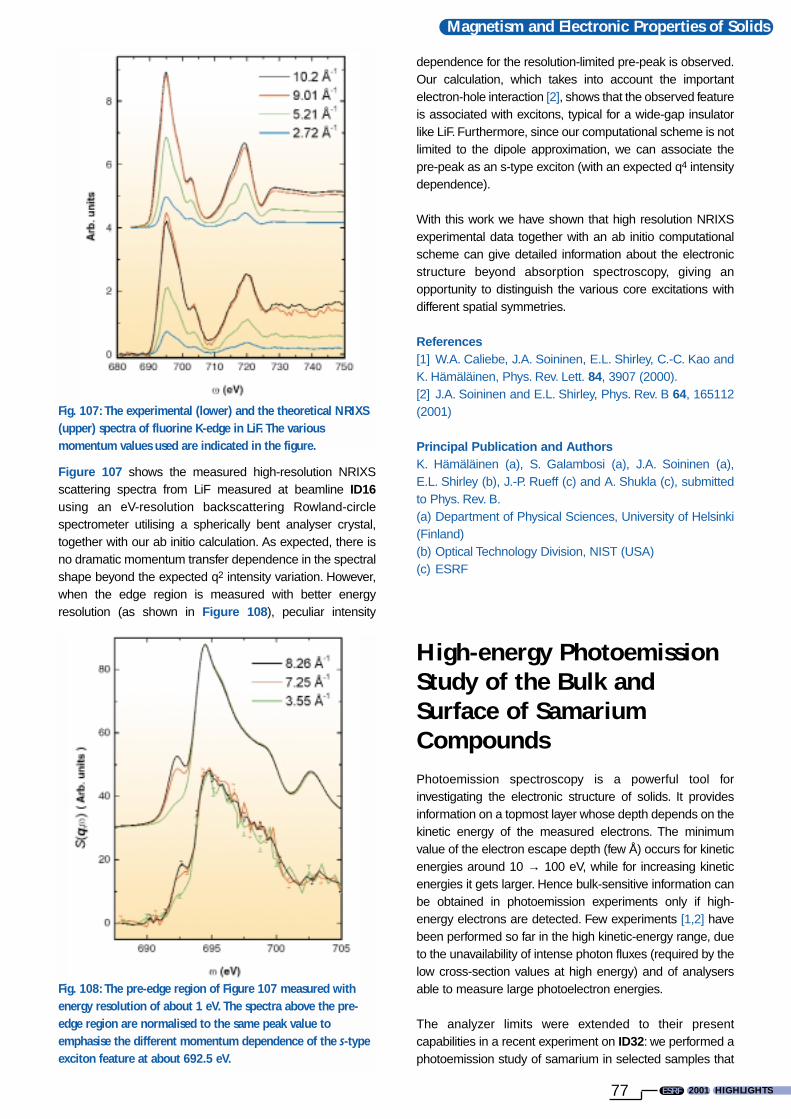
2001 HIGHLIGHTSESRF
Magnetism and Electronic Properties of Solids
77
Figure 107 shows the measured high-resolution NRIXSscattering spectra from LiF measured at beamline ID16using an eV-resolution backscattering Rowland-circlespectrometer utilising a spherically bent analyser crystal,together with our ab initio calculation. As expected, there isno dramatic momentum transfer dependence in the spectralshape beyond the expected q2 intensity variation. However,when the edge region is measured with better energyresolution (as shown in Figure 108), peculiar intensity
dependence for the resolution-limited pre-peak is observed.Our calculation, which takes into account the importantelectron-hole interaction [2], shows that the observed featureis associated with excitons, typical for a wide-gap insulatorlike LiF. Furthermore, since our computational scheme is notlimited to the dipole approximation, we can associate thepre-peak as an s-type exciton (with an expected q4 intensitydependence).
With this work we have shown that high resolution NRIXSexperimental data together with an ab initio computationalscheme can give detailed information about the electronicstructure beyond absorption spectroscopy, giving anopportunity to distinguish the various core excitations withdifferent spatial symmetries.
References[1] W.A. Caliebe, J.A. Soininen, E.L. Shirley, C.-C. Kao andK. Hämäläinen, Phys. Rev. Lett. 84, 3907 (2000).[2] J.A. Soininen and E.L. Shirley, Phys. Rev. B 64, 165112(2001)
Principal Publication and AuthorsK. Hämäläinen (a), S. Galambosi (a), J.A. Soininen (a),E.L. Shirley (b), J.-P. Rueff (c) and A. Shukla (c), submittedto Phys. Rev. B.(a) Department of Physical Sciences, University of Helsinki(Finland)(b) Optical Technology Division, NIST (USA)(c) ESRF
High-energy PhotoemissionStudy of the Bulk andSurface of SamariumCompoundsPhotoemission spectroscopy is a powerful tool forinvestigating the electronic structure of solids. It providesinformation on a topmost layer whose depth depends on thekinetic energy of the measured electrons. The minimumvalue of the electron escape depth (few Å) occurs for kineticenergies around 10 → 100 eV, while for increasing kineticenergies it gets larger. Hence bulk-sensitive information canbe obtained in photoemission experiments only if high-energy electrons are detected. Few experiments [1,2] havebeen performed so far in the high kinetic-energy range, dueto the unavailability of intense photon fluxes (required by thelow cross-section values at high energy) and of analysersable to measure large photoelectron energies.
The analyzer limits were extended to their presentcapabilities in a recent experiment on ID32: we performed aphotoemission study of samarium in selected samples that
Fig. 107: The experimental (lower) and the theoretical NRIXS(upper) spectra of fluorine K-edge in LiF. The variousmomentum values used are indicated in the figure.
Fig. 108: The pre-edge region of Figure 107 measured withenergy resolution of about 1 eV. The spectra above the pre-edge region are normalised to the same peak value toemphasise the different momentum dependence of the s-typeexciton feature at about 692.5 eV.

HIGHLIGHTS 2001 78ESRF
Magnetism and Electronic Properties of Solids
have different valence in the bulk and at the surface: Sm asa pure metal is divalent at the surface and trivalent in thebulk, in SmSe it is mixed valent, and in SmPd3 it is trivalent.Spectra of 3d core levels measured with high-energyexcitation are largely bulk sensitive and allow the valence ofthe rare-earth component in the volume to be determined.Photon energies from 3 to 6 keV were used in order toinvestigate the change of the surface vs. bulk sensitivity.
Figure 109 shows photoemission spectra of the 3d levels ofSm in the different samples, excited at hν = 6 keV.The peaksrelated to the Sm2+ and Sm3+ configuration are wellseparated and reflect the different valence states. It isinteresting to compare the photoemission spectra withabsorption spectra of the Sm L3 edge in the samecompounds (inset of Figure 109): the two techniques havesimilar bulk-sensitivity (sampled depth ~ 40 Å) but the largerlifetime broadening of the 2p levels hides the small divalentsurface component of metallic samarium in the absorptionspectrum. SmSe, at variance with the previous samples,shows a clear Sm2+ feature.
The change of the surface vs. bulk contribution to thespectral shape is shown in Figure 110. Our photoemissionspectra of the Sm 3d core levels are compared with aspectrum excited with a conventional X-ray tube. Thespectral weight at lower binding energies originates from thedivalent configuration present in the outer layers ofsamarium. A striking decrease of the surface componentintensity is seen in the bulk sensitive spectra excited at 3 and6 keV. The decrease of the divalent intensity whenincreasing the photon energy from 3 to 6 keV is slower thanexpected from the anticipated square root dependence ofthe escape depth on the photoelectron kinetic energy. Thismight perhaps indicate the presence of a divalent
component in the bulk, or a trend of the escape depthdifferent from what was derived from earlier data. Bothhypotheses are challenging and deserve being studied onfurther samples and in a wider photon-energy range.
AuthorsC. Dallera (a), L. Duò (a), G. Panaccione (b), G. Paolicelli (c),L. Braicovich (a) and A. Palenzona (d).(a) INFM-Politecnico di Milano (Italy)(b) INFM-Elettra, Trieste (Italy)(c) INFM- Unita'di Roma III (Italy)(d) INFM-Università di Genova (Italy)
Fig. 109: Photoemission spectra of samarium 3d levels in threesamples with different weight of the divalent and trivalentcomponent in bulk and surface, after background subtraction.The L3 edge absorption spectra (inset) show less structure dueto the larger lifetime broadening.
Fig. 110: Photoemission spectra of 3d levels in pure metallicsamarium. Spectra at 3 and 6 keV were measured at ID32while the spectrum excited at 1486 eV was taken with an X-ray tube. A relevant decrease of the divalent surfacecomponent with increasing energy is seen.

2001 HIGHLIGHTSESRF79
Materials science research involves theinvestigation of the relationship betweenthe structure of the materials and theirproperties. The structure-propertyrelationship is the basis for the rationaldesign of new materials with specificproperties. Materials research is thus theunderlying motivation for a large fractionof research at the ESRF. This sectionpresents some examples that cannot easilybe fitted into specific chapters.
The clear tendency in materials research isthe utilisation of the unique properties ofthe X-ray source i.e. the high brilliance, thehigh energy, the microfocussing capabilityand its coherence. Many of the experimentsthus deal with time-resolved studies, non-ambient conditions such as high pressure ortemperature, and mapping of stresses andstrains.
The first two studies deal with liquids orliquid alloys. An EXAFS study of the Hg-Rbliquid alloy has been performed in order tounderstand the difference in conductivityof mercury if non-alkali or alkali metals areadded. The study suggests that the alkalimetals are involved in a solvation processwith the mercury reducing the conductivityof the alloy. The second example deals withthe nucleation process in under-cooledliquid metals. This study presents a novelgeneral method for determining thenucleation rates. In this case palladiumdroplets dispersed in Al2O3 powders arestudied. The method is based on a non-destructive use of the phase-sensitivity of X-ray absorption above the core-electronabsorption edges.
Microstructure and grain structure areimportant factors determining theproperties of materials. The new “3D-microscope” at ID11 has been used todevelop an in situ method for determiningthe tensile deformation on many individualgrains, of sizes down to a micrometre. Thestudy indicates that present models are notsufficient for predictions of the effect ofdeformations. Magnetic elements exhibitinteresting nanostructural properties. In anEXAFS experiments on Co atoms implantedin an Ag matrix, the effect of heattreatment of the samples showed that Codimers or larger clusters are formed as afunction of temperature.

HIGHLIGHTS 2001 80ESRF
Materials
Three examples illustrate the widespread useof high pressures to study materials. The firstexample deals with the novel superconductorMgB2. Here the structural properties havebeen studied by angle-resolved X-raydiffraction up to pressures of 40 GPa. X-raydiffraction shows no structural instability. The observation of colossalmagnetoresistance in perovskite manganiteshas prompted a high-pressure study ofLaMnO3 up to pressures of 40 GPa. In thehigh-pressure study it was observed thatbetween 18 and 32 GPa an intermediateinsulating structure with suppressed JahnTeller distortion is found showing that theinsulating phase is not caused by the JTeffect. The final high-pressure example dealswith covalent semiconductors. The III-IVzincblende structures are expected totransform from a NaCl structure to a CsClstructure under pressure. Here it is shownthat InAs does not convert to a CsClstructure at high pressures but rather to asite-disordered orthorhombic Pnmastructure.
The high X-ray intensities available make itpossible to perform fast in situ studies. In afirst example the oxidation ofSrFe0.97Cr0.3O2.8 occurring at hightemperatures when a N2 atmosphere isreplaced by O2 has been studied showing atwo-step oxidation process. In the finalexample, an in situ study of a working Li-ionbattery is presented. Very high X-ray energies(87.5 keV) were used to penetrate thelithium battery and record powderdiffraction patterns as a function of thecharging cycle.
The Structure of Liquid Hg-alkali AlloysMercury, the liquid metal by excellence, has alwaysfascinated scientists and even artists. Whereas the mercuryfountain of Alexander Calder continuously cycles its contentat the Miro museum of Barcelona, scientists try to enter themysteries of this particular liquid. The advent of 3rd
generation X-ray sources such as the ESRF has made itpossible to overcome the technical impediments for solvingone of the longstanding mysteries of mercury: that itsconductivity decreases with the addition of alkali metals.Thisis even more surprising as we know that the addition of non-alkali simple metals to mercury decreases its anomalouslyhigh electrical resistivity down to the typical values of simpleliquid metals. The work of P.D. Adams [1], N.F. Mott [2], andothers, at the beginning of the seventies provided anunderstanding of the behaviour of mercury and its alloyswith non alkali metals within the near free electron modelframework. However, the behaviour of mercury-alkaliamalgams remained unexplained. N.F. Mott concluded thatsomething different due to a charge transfer, such as thesolvation of Hg by alkali atoms, should take place. Manyyears have passed and still no one has been able to proveMott's hypothesis. This is not surprising as mercury is anextremely good X-ray and neutron absorber and this hasimpeded the structural studies.
EXAFS spectroscopy excels in the structural studies ofalloys because of its atomic selectivity. We have chosen tostudy Hg-Rb liquid amalgams, because the accessibility ofHg and Rb edges allowed probing of the local structurearound both atoms. The toxicity of Hg, the spontaneousignition of Rb in the atmosphere, in addition to the corrosiveproperties of the liquid alloy, imposed severe safetyconstraints as shown in Figure 111. In the particular case ofHg-Rb liquid alloys we can take advantage of additionalselectivity (due to the strong contrast of photoelectronscattering amplitudes): not only are we able to distinguishthe central atom selected, but also the nature of theneighbours contributing to the EXAFS signal. In fact, at both
Fig. 111: Scientistchecking the sealing of theHg-Rb cell at the BM29beamline.

2001 HIGHLIGHTSESRF
Materials
81
Rb K and Hg L edges, only Hg neighbours are resolved,providing respectively a direct signature of the Rb-Hg andHg-Hg neighbour correlations (i.e. the low distance part ofthe partial radial distribution functions).
Already, without the need of a detailed analysis, the mainresults are very clear. We observe in Figure 112 that at theRb K-edge, the amplitude of the EXAFS signal increaseswith the Hg content. This is what would be expected in anyordinary alloy: if we progressively add Hg atoms, thenumber of Hg neighbours around Rb increases. Thesituation is dramatically different when we look at theEXAFS signal at the Hg edges: the distribution of Hgneighbours around Hg does not change. In addition thisdistribution is markedly different from the one of pure liquidmercury. The data analysis shows that this behaviour isclosely related to what has been observed in crystalline Hg-alkali amalgams where mercury associates in units of 4-5atoms encaging the alkali atoms. This is also observed inZintl-type compounds forming clathrate-type structuresvery similar to the ones of the Hg-alkali crystallineamalgams. Mott's suspicion, even if not totally right, was agood starting point.
References[1] P.D. Adams., Phys. Rev. Lett. 20, 537 (1968).[2] N.F. Mott, Philos. Mag. 26, 505 (1972).
Principal Publication and AuthorsA. San-Miguel (a), G. Ferlat (a), J.F. Jal (a), A. Mizuno(b),T. Itami(b) and M. Borowski(c), submitted to Phys. Rev. B.(a) Département de Physique des Matériaux, CNRS,Université de Lyon (France)(b) Department of Chemistry, Hokkaido University, Sapporo(Japan)(c) ESRF
Nucleation of UndercooledLiquid Metals
Many liquids can be cooled, without observing solidification,far below their equilibrium melting temperature into ametastable undercooled liquid state. In the absence ofexternal forces which may trigger the so-calledheterogeneous nucleation process, the crystallisation of anundercooled liquid is driven by localised fluctuations in theconfiguration space, leading to the spontaneous formationof a stable crystalline nucleus (homogeneous nucleation)[1].
The crystallisation process of an undercooled drop can beschematised by the sequence of two steps: i) theappearance of a critical crystalline nucleus; ii) thepropagation of the crystal front through the volume of themelt. In the case of liquid metals, the timescale to completethe transformation is largely dominated by the time requiredto form the crystalline nucleus.
The nucleation phenomenon can then be described by aphysical quantity I defined as the number of crystallisationnuclei that are formed in the melt per second per volume (ormass) unit.This rate is strongly temperature dependent.Thefunctional dependence of I(T) from fundamental quantities ofundercooled liquids is illustrated by the standard theory ofhomogeneous nucleation. The study of nucleationphenomena and the experimental determination of I(T)are of crucial importance for the understanding of thephysics of metastable liquids. In fact, I(T) is linked tobasic thermodynamical quantities, and the nucleationphenomenon itself has critical implications in somemetallurgical processes and in materials science.
We have developed a new experimental non-destructivemethod to measure I(T) in undercooled liquid metals. Themethod is based on the phase sensitivity of the X-rayabsorption coefficient above core-electron absorption edges[2]. It can be applied to emulsions of liquid droplets orpowder mixtures at high temperatures. By tuning the photonenergy to a high solid-liquid contrast value, and duringsuitable sample temperature scans, one can accuratelymeasure the liquid total mass fractions Xl(t) as a function oftemperature (or time). Because of the intrinsic properties ofthe steady state nucleation process mechanism, once theXl(t) are determined, it is possible to directly calculate theI(T) by a numerical solution of an appropriate integralequation. When compared with conventional one-particletechniques, the power of this new method relies on the factthat a large number of particles are probed simultaneously,thus largely improving the statistics of the measurement.
As an example, we show how this method can be applied tothe crystallisation of undercooled liquid palladium dropletsdispersed in sintered Al2O3 powder. To measure I(T) over a
Fig. 112: EXAFS oscillations as a function of Rb content.

HIGHLIGHTS 2001 82ESRF
Materials
wide temperature interval, we prepared three differentsamples A, B and C, characterised by substantially differentPd grain mass distribution. In Figure 113 we present thetypical liquid fraction Xl[T(t)] curves measured by X-rayabsorption temperature scans, at several cooling rates. Thedifferent slopes and limiting nucleation temperatures in thevarious curves have to be attributed to the spread in thecooling rates and to the differences in the size distributionsamong the three samples.The nucleation rate data obtainedfrom those curves are reported in Figure 114, where wepresent the I(T) of undercooled liquid Pd spanning overabout 6 orders of magnitude. By applying this method, onecan obtain nucleation rates which are overlapping within the
experimental errors, when starting from totally separatedXl(t) curves.
References[1] P.B. Debenedetti, Metastable Liquids, PrincetonUniversity Press, Princeton, NJ (1994).[2] A. Filipponi, M. Borowski, P.W. Loeffen, S. De Panfilis,A. Di Cicco, F. Sperandini, M. Minicucci and M. Giorgetti,J. Phys.: Condens. Matter 10, 235 (1998).
Principal Publication and AuthorsS. De Panfilis (a) and A. Filipponi (b), J. Appl. Phys. 88, 562-570 (2000).(a) UdR INFM and Dipartimento di Fisica, Camerino (Italy)(b) UdR INFM and Dipartimento di Fisica, L'Aquila (Italy)
Grain Rotations duringDeformation of Polycrystals Metals are polycrystalline, with physical, mechanical andchemical properties that to a large extent depend on thestructure of the grains and the topology of the grainboundaries. For instance, strength and ductility is a functionof grain size, lattice orientation, and the structural relationbetween neighbouring grains. When deformed theindividual grains have to change their shape and orientationto comply with the external forces. Hence, the topology ofthe polycrystal is altered in all aspects. To predict theproperties of the processed material, it is thereforenecessary to describe the plastic response of the grains.However, to date experiments have been confined tostudies of the macroscopic evolution of texture (surfaceinvestigations are not representative due to strainrelaxation). Such data are not very powerful in terms ofdistinguishing between models, and as a consequencepresent-day models of deformation are simplistic ones,formulated at the beginning of the 20th century [1]. Provisionof better deformation models is vital in other fields, includinggeophysics, where the formation history of rocks isdeduced from the grain morphology.
Here we present a universal technique for in situ studies ofthe plastic deformation of the individual grains. It has beendeveloped at the 3DXRD microscope at ID11, whichprovides focused hard X-rays in the energy range of 50-100keV. Hence, millimetre to centimetre thick specimens can beinvestigated, as required by typical deformation processes.The experimental principle is sketched in Figure 115.Diffraction spots are produced by the rotation method usinga monochromatic beam.They are sorted with respect to thegrain of origin by the indexing program GRAINDEX [2,3],which can handle about 100 grains simultaneously. Knowingthe orientation of the grains at each strain level, the rotationsare found.
Fig. 113: Liquid fractions Xl[T(t)] curves as obtained fromdifferent X-ray absorption temperature scans. In each set ofcurves the cooling rate is larger when lower freezingtemperatures are reached.
Fig. 114: Nucleation rate for undercooled liquid Pd in Al2O3
as determined by the new method described in this work.

2001 HIGHLIGHTSESRF
Materials
83
The first results for the tensile deformation of 4 deeplyembedded grains in a pure Al sample is shown inFigure 116. Compared to predictions of the standard Sachsand Taylor models, the models are found to fail in terms ofboth the direction and the rate of the rotation. At the sametime information on the sub-grain scale (grain sub-division)is provided from the width of the diffraction spots. Theexperiment was later repeated, providing a reference dataset of 100 grain rotations. Likewise, the methodology wasexpanded to include the evolution of the elastic strain tensorof the embedded grains [3].
The method is universally applicable provided grains arelarger than 1 micrometre. Furthermore, it can be combinedwith other 3DXRD methods to provide 3D maps of the grainboundaries and their dynamics during processing [3].
References[1] G. Sachs, Z. Ver. Deu. Ing. 72-22, 734 (1928).[2] E.M. Lauridsen, S. Schmidt, R.M. Suter andH.F. Poulsen. J. Appl. Cryst., 34, 744-750 (2001).[3] H.F. Poulsen, S.F. Nielsen, E.M. Lauridsen, S. Schmidt,R.M. Suter, U. Lienert, L. Margulies, T. Lorentzen and D. JuulJensen. J. Appl. Cryst., 34, 751-756 (2001).
Principal Publication and AuthorsL. Margulies (a, b), G. Winther (a), and H.F. Poulsen (a),Science, 291, pp 2392-2394 (2001)(a) Risø National Laboratory, Roskilde (Danemark)(b) ESRF
Evidence of Co Dimers in AgClusters of magnetic elements [1] exhibit very excitingproperties in the frontier field of nanostructures. Of particularinterest is the distinction between interior and interfacecontributions of large agglomerates embedded into a matrix.In order to confine small Co clusters in a silver matrix, cobaltwas implanted at 50 keV in an Ag layer 50 nm thick, grownby molecular beam epitaxy (MBE), with a homogeneousconcentration of 0.1 at%. Other methods were also usedsuch as MBE co-evaporation of Ag and Co, and Coimplantation during the silver layer growth, for dilutions up to6 at%.The samples were observed at several temperatures(77, 125, 175, 225 K) by the XAFS technique at BM8, theGILDA CRG beamline, to investigate the local configurationaround a Co absorber. The spectra, analysed by standardmethods, clearly showed first, second, and thirdcoordination shells around Co, with Co and Ag features verywell resolved in each shell. From the coordination numberand distance of each contribution we can easily deduceseveral important conclusions about the local aggregation ofcobalt. Depending on the dilution and on the thermaltreatment different scenarios can be drawn: the first isconcerned with the presence of Co dimers slightlycontracted in the matrix in quasi substitution configuration inthe fcc silver lattice; they appear in a chainlike order witheach dimer at 90° from each other, along opposite squarefaces of the silver lattice, as shown in Figure 117.This resultwas obtained for the as-prepared sample at low dilution. Athigher concentration we detected small cobalt clusters asCo8 at 6 at% (co-evaporated sample) and Co20 at 1.9 at%(implanted sample). After suitable thermal treatment largerclusters can grow: we observed in fact Co80 and Co136
agglomerates. Here, the separation of the interface bondsfrom the homoatomic interactions is particularly valuable.The evolution of the raw absorption spectra in the near edge
Fig 115: Experimental principle. All of the grains within thechannel illuminated by the beam will give rise to diffractedspots during scanning of ω. During straining these diffractionspots rotate. By indexing the spots the orientation changes ofthe grains can be inferred.
Fig 116: The rotation of four embedded Al grains duringtensile deformation up to 11%. The experimental data (o) areshown as inverse pole-figures, that represent the position ofthe tensile axis in the reciprocal space of the grains. Acomparison is performed with the evolution path from 0% to11% (––) as predicted by a Sachs model.

HIGHLIGHTS 2001 84ESRF
Materials
region demonstrates another interesting feature shown inFigure 118. A clear phase transition is visible from thecomparison of the shape and features of a hcp Co foil withrespect to the nanoaggregates and to the dimers. Whereasthe spectrum of the largest Co cluster looks very similar tothe Co foil spectrum, the dimers, in the fcc configuration ofthe silver lattice, present strongly shifted features, showingevidence of a fcc → hcp phase transition as the number ofatoms/cluster is larger than about 100. Furthermore, thegradual evolution, as the size of the clusters increases,towards the bulk cobalt structure could indicate the presenceof fcc/hcp stacking faults and/or a combination of hcpclusters with a more diluted cobalt in Ag precursor stage.Finally, we point out that the vibrational behaviour of eachconfiguration vs. temperature permitted the determination ofthe Debye temperature; we mention only the higherhardness of the Co-Co dimer bond with respect to Co-Ag,and the Debye temperature (200 K) of the interface bondsCo-Ag for the largest clusters.
Reference[1] J. Kortright et al., J. Magn. Magn. Mater. 207, 7 (1999).
Principal Publications and AuthorsG. Faraci (a), A.R. Pennisi (a), A. Balerna (b), H.Pattyn (c),G.E.J. Koops (c) and G. Zhang (d), Phys. Rev. Lett. 86, 3566(2001); Physics of Low Dimensional Systems, J.L. Morán-Lopez (Ed.), Kluwer Academic/Plenum Publishers, NewYork, 33-46, (2001).(a) Dipartimento di Fisica, Università and Istituto Nazionaleper la Fisica della Materia, Catania (Italy)(b) Laboratori Nazionali Frascati, INFN, Frascati, (Italy)(c) Instituut voor Kern- en Stralingsfysica, Phys. Dept.,Leuven, (Belgium)(d) Institute of Nuclear Research, Academy of Science,Shanghai, (China)
High-Pressure Study of the40 K Superconductor MgB2
The report by the team of Akimitsu [1] of a superconductingtransition temperature as high as 40 K in MgB2, a compoundwhich has been known for a long time, was probably one ofthe most unexpected discoveries of year 2001 in the field ofsolid-state physics. It soon led to a large variety ofexperimental and theoretical work aimed at understandingthe reasons for such a high Tc in this simple compound.Among these, the knowledge of the high-pressure behaviourcan provide insight into the origin of superconductivity, aswas demonstrated in the case of the high Tc cuprates. Wehave therefore undertaken a study of the electrical andstructural properties of MgB2 up to 40 GPa.
Magnesium diboride has the AlB2-type hexagonal(P6/mmm) structure, with a = 3.08Å, c = 3.51 Å (inset ofFigure 119). The structure can be described as thealternate stacking of planes of boron atoms forming ahoneycomb lattice, and planes of magnesium atomsforming a triangular one. The equation of state of MgB2
was determined up to ≈ 39 GPa by angle-resolved X-raydiffraction (λ = 0.3738Å) at ID30, the high-pressurebeamline, using a membrane-driven diamond anvil cellwith diamond tips of diameter 300 µm and stainless-steelgaskets with holes of 120 µm. Nitrogen was used as thepressure transmitting medium in order to keep goodhydrostatic conditions.The pressure was determined usingthe ruby fluorescence method. The diffraction patternswere recorded with a Mar345 image plate detector locatedat 360 mm from the sample and transformed into powderdiffractograms using the Fit2D software. These data weresuccessfully refined by the Rietveld technique with theAlB2-type structure up to the highest pressure of ≈ 39 GPainvestigated.
Fig. 117: A possible configuration of 4 Co dimers in quasisubstitutional positions in the silver fcc lattice. The dimers,contracted and disposed orthogonally to each other, form akind of rotating chain on parallel square faces.
Fig. 118: Near-edge structure of the spectra showing dramaticmodifications in the threshold features, clearly shifted withrespect to the reference Co foil.

2001 HIGHLIGHTSESRF
Materials
85
In Figure 119 we show the observed p(V) dependence; theline represents the fit to the observed points using the Vinetequation of state:
1 – fν 3p = 3B0 –––––exp[––(B’0 – 1)(1 – fν)],
fν2 2
where fν = (V/V0)1/3, and B0, B'0 and V0 are the bulkmodulus, its derivative and the cell volume at room pressure,respectively. The values obtained were B0 = 150(5) GPa,B' = 4.0(3) and V0 = 29.00(4) Å3, the latter being in excellentagreement with theoretical calculations. Figure 120 showsthe evolution with pressure of the a and c cell parametersand c/a ratio. Both cell parameters decrease monotonicallywith increasing pressure. No sign of a phase transition isseen.The solid line in the figure represents a linear fit to thedata, with a slope of –1.3 10–3 GPa–1. The similar values ofthe a- and c-axis compressibility (1.9 10–3 GPa–1 and 3.110–3 GPa–1) indicate an almost isotropic behaviour,contrasting with the layered-type structure and the differentnature of the chemical bonds in the in-plane and out-of-plane directions.
Our resistivity measurements under pressure suggest thatthe dependence of Tc can be naturally explained byconsidering that the 2D pxy holes are the driving carriers for
superconductivity. Although a structural instability has beenreported by others in Al substituted compounds, we do notobserve any crystallographic transition despite the fact thatwe reach values of the cell parameters at the highestpressures, which are smaller than those of AlB2.
Reference[1] J. Nagamatsu, N. Nakagawa, T. Muranaka, Y Zenitaniand J. Akimitsu, Nature 410, 63 (2001).
Principal Publication and AuthorsP. Bordet (a), M. Mezouar (b), M. Nùnez-Regueiro,M. Monteverde (c), M.D. Nùnez-Regueiro (d), N. Rogado,K.A. Regan, M.A. Hayward, T. He, S.M. Loureiro andR.J. Cava (e), Phys. Rev. B64, 172502 (2001).(a) Laboratoire de Cristallographie, CNRS, Grenoble(France)(b) ESRF(c) CRTBT, CNRS, Grenoble (France)(d) Grenoble High Magnetic Field Laboratory, MPI-KFK andCNRS, Grenoble (France)(e) Department of Chemistry and Materials Institute,Princeton University (USA)
Pressure-induced Quenchingof the Jahn-Teller Distortionand Insulator-MetalTransition in LaMnO3
Perovskite-type manganites have recently received renewedinterest after the observation of a negative colossalmagneto-resistance (CMR) effect in La1-xCaxMnO3 andrelated materials. Correlated magnetic and metal-insulatortransitions are observed as a function of temperature,magnetic field, and doping along with charge and orbitalordering/disordering phenomena [1,2]. The complexelectronic properties of both doped manganites and pureLaMnO3 originate from an intimate interplay of lattice andelectronic degrees of freedom. At ambient conditionsLaMnO3 is an insulator with an orthorhombic perovskitestructure (space group Pnma, see Figure 121). Alternatinglong and short Mn–O2 distances in the ac plane of thestructure are a sign of orbital ordering, which arises from acooperative Jahn-Teller (JT) distortion.
High pressure is a means to tune the interplay betweenlattice and electronic degrees of freedom in LaMnO3. Wehave studied the effect of hydrostatic pressure to 40 GPa onits crystal structure by monochromatic (λ = 45.09 pm) X-raypowder diffraction at the beamline ID9. These experimentswere complemented by Raman spectroscopy, opticalreflectivity, and electrical resistance measurements at highpressures.
Fig. 119: Experimental data and fit to the equation of state forMgB2 (the crystal structure is shown in the inset).
Fig. 120: Variation of cell parameters with applied pressure forMgB2.

HIGHLIGHTS 2001 86ESRF
Materials
Up to 15–20 GPa, the compression of LaMnO3 is anisotropicwith the soft direction along the a axis (Figure 122). Its initialcompressibility is ~ 4 times larger than those of the b and caxes. LaMnO3 remains orthorhombic to at least 40 GPa.
Rietveld analysis of the powder diffraction data allows us torefine the full crystal structure up to 11 GPa.The three Mn–O
distances of the distorted MnO6 octahedra decrease underpressure (Figure 122).This effect is most pronounced for theMn–O2(a) distance which relates to the large a-axiscompressibility at low pressures. Extrapolation of the datasuggests that Mn–O bond lengths become nearly equalaround 18 GPa. The cooperative Jahn-Teller effect isreduced with increasing pressure, a process that appears tobe completed near 18 GPa.
A pressure-induced insulator-metal transition takes placeat pressures much higher than required to suppress theJahn-Teller effect. It occurs at ~ 32 GPa as evidenced byoptical reflectivity and electrical resistance measurements(Figure 123).
Our results suggest the existence of three distinct regimes:(i) an insulating one with JT distortion and orbital ordering[P < 18 GPa], (ii) an intermediate one with suppressed JTdistortion and no orbital ordering, but still insulating[18–32 GPa], and (iii) a metallic phase without JT effect[P > 32 GPa]. For a certain range of pressures, undopedLaMnO3 thus appears to exist in an insulating state, whichis not caused by the JT effect. This supports the view thatLaMnO3 basically is a Mott (or charge-transfer) insulator.
The pressure-induced decreases of the Mn–O distancesand of the octahedral tilting both enhance the Mn-O-Mninteractions and hence enlarge the bandwidth arising fromthe eg orbitals. In the intermediate insulating state the eg
electrons are already sufficiently delocalised to suppress theJT effect, but still not itinerant enough to make the systemmetallic. It cannot be excluded from our data that thestabilisation of this insulating state involves other instabilities,e.g. a charge-density wave formation similar to thatobserved in the isoelectronic (t3
2ge1g) Fe4+ oxide CaFeO3. In
contrast to the CMR materials, the insulator-metal transitionin LaMnO3 is driven by an increased bandwidth and not bychemical doping.
The notion of delocalisation of eg (or t2g) electrons withoutmetallisation seems also of relevance for other transitionmetal oxides with Jahn-Teller electron configurations, e.g.Fe4+ oxides, rare earth nickelates, and LaTiO3. At ambientpressure many of these materials are close to the insulator-metal borderline and some reveal insulating states withoutsigns of orbital ordering.
References[1] A.P. Ramirez, J. Phys.: Cond. Matter 9, 8171 (1997).[2] J.M.D. Coey, M. Viret, and S. von Molnár, Adv. Phys. 48,167 (1999).
PublicationI. Loa (a), P. Adler (a), A. Grzechnik (a), K. Syassen (a),U. Schwarz (b), M. Hanfland (c), G.Kh. Rozenberg (d),P. Gorodetsky (d) and M.P. Pasternak (d), Phys. Rev. Lett.87, 125501 (2001).(a) MPI für Festkörperforschung, Stuttgart (Germany)
Fig. 121: Crystal structure of LaMnO3.
Fig. 123: Structural, electrical and optical properties indicatethree distinct regimes/phases in LaMnO3: insulating with JT-distortion, insulating without JT-distortion, and metallic.
Fig. 122: Lattice parameters and Mn–O distances in LaMnO3
as a function of pressure.

2001 HIGHLIGHTSESRF
Materials
87
(b) MPI für Chemische Physik fester Stoffe, Dresden(Germany)(c) ESRF(d) Tel Aviv University (Israel)
Absence of the High-pressure CsCl Phase in InAsOne of the common properties of covalent semiconductorsis that all of them present first order phase transitions underpressure that transform their open four-fold coordinatedstructures to more dense six-fold coordinated structures.The higher density structures to which tetrahedrallycoordinated compounds were thought to transform arestructures that exist at ambient pressure in more ionicA(n)B(8-n) octet compounds. For example, III-V zincblende(ZB) semiconductors were expected to transform into theNaCl phase and eventually to the CsCl phase [1].
However, recent theoretical work [2] predicts that, whilestatically stable, the CsCl phase is dynamically unstable athigh pressures for the more ionic III-V semiconductors. Byanalysing the destabilising transverse acoustic modes ofCsCl the authors were able to identify two candidatestructures, InBi (P4/nmm) and AuCd (Pmma) that couldpossibly replace CsCl. Experimental examination of thesepredictions was obviously required.
We have examined the InAs compound, because it isamong the more ionic III-V semiconductors and has thelowest predicted transition pressure to CsCl.
No direct investigation of the pressure evolution of the localstructure using X-ray absorption spectroscopy (XAS) has, toour knowledge, been reported on InAs. However, XAS canplay an important complementary role in identifying the localstructure and the degree of short range chemical (site)ordering in new phases, since it probes selectively the local
environment of the absorber atom and is sensitive to thesurrounding neighbours. The high pressure XAS and XRDmeasurements were carried out on beamlines ID24 andID30 respectively.
Figure 124 reports XRD integrated profiles: the observedstructural sequence is the following: F-43m → Fm3m →Cmcm → Pmma, with transition pressures 7.5(5) GPa, 15(1)GPa and 30(3) GPa. While we are unable to address thelong range site ordering issue from our high pressure XRDdata, we can yield valuable short range chemicalorder/disorder (sr-co / sr-cd) information using our XANESdata (Figure 125a). We compared the latter to full multiplescattering calculations using a self-consistent energydependent exchange correlation Hedin Lundqvist potential.The variations as a function of pressure in the features of theXAS spectra (Figure 125b) can be associated to thefollowing structural sequence:F-43m → sr-co Fm3m → sr-co Cmcm → sr-cd Pmma.
In conclusion, using X-ray diffraction and absorptiontechniques, we have demonstrated that InAs does nottransform to the CsCl phase as previously thought, but to
Fig. 124: XRD profiles, Rietveld refinements and residuals at0.6 GPa (F-43m), 14 GPa (Fm3m), 25 GPa (Cmcm) and at60 GPa (Pmma).
a)
b)
Fig. 125: a) XAS spectra and b) edge region at i) 7.3, ii) 14, iii)20, and iv) 40 GPa. The inset shows the trend on thederivatives. c) energy shift of the absorption onset, defined asthe position of the maximum of the first derivative at the edge(full dots) and absorption at 11869.1 eV (empty dots). Darkand light areas correspond respectively to single phase(Zincblende, NaCl, Cmcm) and phase coexistence regions(Zincblende-NaCl, NaCl-Cmcm, Cmcm-Pmma).

HIGHLIGHTS 2001 88ESRF
Materials
a short range chemically-disordered Pmma phase, inagreement with recent phonon dynamics calculations. Thisfinding has important implications for the structuralsystematics of semiconductors. InAs is the first of the III-Vsemiconductors for which existence of a theoreticallypredicted phase is verified a posteriori. This leave theexperimental examination of the remaining systems,foreseen to have a similar behaviour, InP, GaP and GaAs, tobe undertaken.
References[1] J.C. Phillips, Bonds and Bands in Semiconductors,Academic Press, New York, p. 200 (1973).[2] K. Kim, V. Ozolins and A. Zunger, Phys. Rev. B 60, R8449(1999).
Principal Publication and AuthorsS. Pascarelli (a), G. Aquilanti (a), W. Crichton (a), T. Le Bihan(a), M. Mezouar (a), S. De Panfilis (b), J.P. Itié (c) andA. Polian (c), submitted.(a) ESRF(b) Unita di Ricerca INFM and Dip. di Fisica, Universitá diCamerino (Italy)(c) Physique des Milieux Condensés, C.N.R.S.,UniversitéPierre et Marie Curie, Paris (France)
Fast Time-resolved in situPowder-diffraction Studiesof High-temperatureOxidation/ReductionReactionsIn order to perform fast time-resolved in situ powderdiffraction experiments of chemical reactions, a rotating-slitsystem for the MAR345 imaging-plate system has beendeveloped for BM01B (SNBL) (Figure 126). A screen with awedge-shaped opening is rotated in front of the MAR345image-plate detector.The time resolution can be adjusted byvarying the slit size and the rotation speed. In situ powderdiffraction data have been collected with a time resolutionaround 100 ms.
The rotating-slit system has been used in time-resolved insitu powder diffraction studies of the fast oxidation/reductionreactions of oxygen ion conducting perovskite type materialsat high temperature, 400-800°C.
Perovskite type oxides with composition (A1-xA’x)BO3±δ,(A = La, Y; A’ = Sr, Ca; B = Mn, Fe, Co) are of interest forapplications such as catalysis, oxygen permeablemembranes, solid oxide fuel cells and colossal magneto-resistance. For these materials, catalytic activity, magnetism
and oxygen ion conductivity, are closely related to oxygenstoichiometry, crystal structure and redox properties. Theoxidation/reduction reactions are of topotactic nature andare completed within a few seconds at 800°C. Therefore,very fast data collection is required. High-quality powderdiffraction data must be collected in order to monitorstructural changes during the reaction, preferable by meansof Rietveld analysis.
A capillary based micro reaction cell, allowing a flow of gasto pass through the sample, was used for the experiments[1,2]. Using a remote-controlled three-way valve, abruptchanges between nitrogen and oxygen gas can beachieved, allowing kinetic information to be extracted fromvariation of intensity or position of selected Bragg reflections.Samples were contained in 0.7-1mm quartz glass capillariesmounted in a Swagelok fitting.The sample was heated usinga hot air blower.
Results are presented for oxidation of SrFe0.97Cr0.03O2.6 at700-800°C. Switching from a nitrogen to an oxygenatmosphere is done while the slit is rotating continuously infront of the imaging plate (one rotation in 15 seconds).Figure 127 shows the changes in one of the reflections as
Fig. 126: The rotating slit system at the MAR345diffractometer at SNBL. A capillary-based in situ microreaction cell and a hot air heater are mounted on thediffractometer (inset).
Fig. 127: Changes in position and intensity of one diffractionpeak during oxidation of SrFe0.97Cr0.03O3-δ at 800°C.
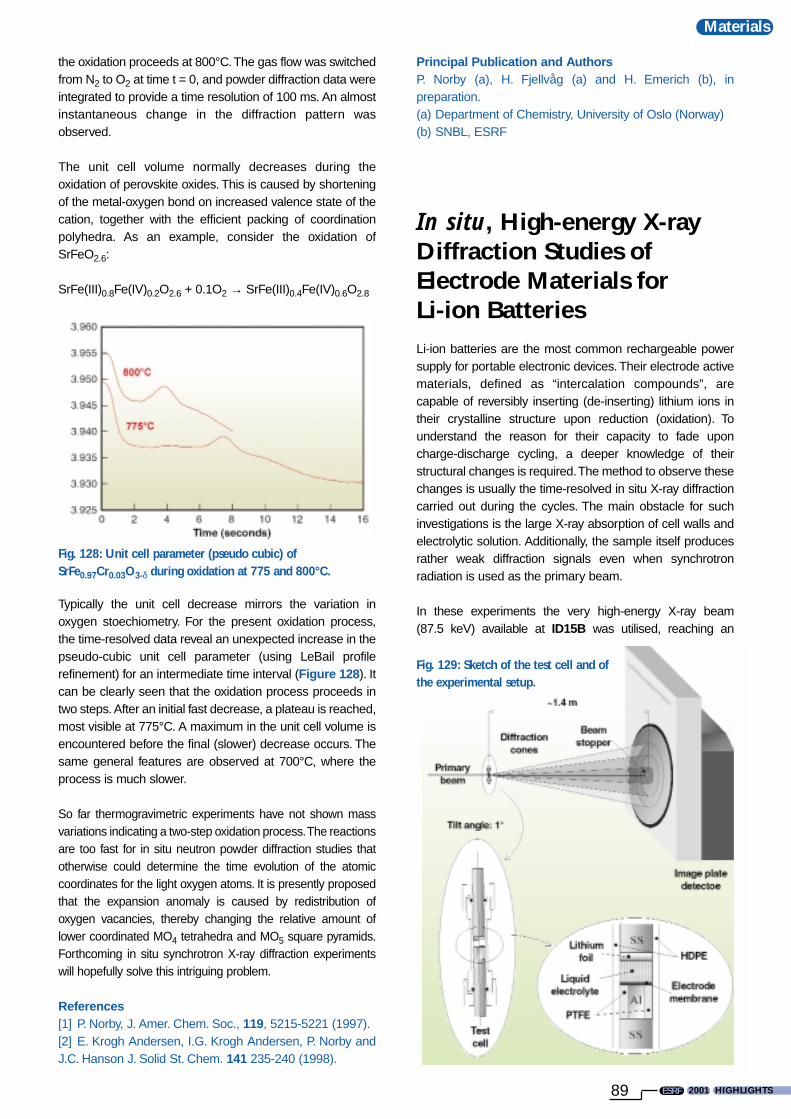
2001 HIGHLIGHTSESRF
Materials
89
the oxidation proceeds at 800°C.The gas flow was switchedfrom N2 to O2 at time t = 0, and powder diffraction data wereintegrated to provide a time resolution of 100 ms. An almostinstantaneous change in the diffraction pattern wasobserved.
The unit cell volume normally decreases during theoxidation of perovskite oxides. This is caused by shorteningof the metal-oxygen bond on increased valence state of thecation, together with the efficient packing of coordinationpolyhedra. As an example, consider the oxidation ofSrFeO2.6:
SrFe(III)0.8Fe(IV)0.2O2.6 + 0.1O2 → SrFe(III)0.4Fe(IV)0.6O2.8
Typically the unit cell decrease mirrors the variation inoxygen stoechiometry. For the present oxidation process,the time-resolved data reveal an unexpected increase in thepseudo-cubic unit cell parameter (using LeBail profilerefinement) for an intermediate time interval (Figure 128). Itcan be clearly seen that the oxidation process proceeds intwo steps. After an initial fast decrease, a plateau is reached,most visible at 775°C. A maximum in the unit cell volume isencountered before the final (slower) decrease occurs. Thesame general features are observed at 700°C, where theprocess is much slower.
So far thermogravimetric experiments have not shown massvariations indicating a two-step oxidation process.The reactionsare too fast for in situ neutron powder diffraction studies thatotherwise could determine the time evolution of the atomiccoordinates for the light oxygen atoms. It is presently proposedthat the expansion anomaly is caused by redistribution ofoxygen vacancies, thereby changing the relative amount oflower coordinated MO4 tetrahedra and MO5 square pyramids.Forthcoming in situ synchrotron X-ray diffraction experimentswill hopefully solve this intriguing problem.
References[1] P. Norby, J. Amer. Chem. Soc., 119, 5215-5221 (1997).[2] E. Krogh Andersen, I.G. Krogh Andersen, P. Norby andJ.C. Hanson J. Solid St. Chem. 141 235-240 (1998).
Principal Publication and AuthorsP. Norby (a), H. Fjellvåg (a) and H. Emerich (b), inpreparation.(a) Department of Chemistry, University of Oslo (Norway)(b) SNBL, ESRF
In situ, High-energy X-rayDiffraction Studies ofElectrode Materials for Li-ion BatteriesLi-ion batteries are the most common rechargeable powersupply for portable electronic devices. Their electrode activematerials, defined as “intercalation compounds”, arecapable of reversibly inserting (de-inserting) lithium ions intheir crystalline structure upon reduction (oxidation). Tounderstand the reason for their capacity to fade uponcharge-discharge cycling, a deeper knowledge of theirstructural changes is required.The method to observe thesechanges is usually the time-resolved in situ X-ray diffractioncarried out during the cycles. The main obstacle for suchinvestigations is the large X-ray absorption of cell walls andelectrolytic solution. Additionally, the sample itself producesrather weak diffraction signals even when synchrotronradiation is used as the primary beam.
In these experiments the very high-energy X-ray beam(87.5 keV) available at ID15B was utilised, reaching an
Fig. 128: Unit cell parameter (pseudo cubic) ofSrFe0.97Cr0.03O3-δ during oxidation at 775 and 800°C.
Fig. 129: Sketch of the test cell and ofthe experimental setup.

HIGHLIGHTS 2001 90ESRF
Materials
extremely small attenuation (<1%) of the beam through thecell. The data collection was carried out by using an imageplate detector (model MAR 345), which allows a completecollection of the Debye-Scherrer rings, which furtherimproved the counting statistics. Furthermore, the high-energy of the beam guaranteed a good angular resolutiondespite the grazing-incidence geometry (Figure 129)required for the experiment. Indeed, if the radiation energy isincreased, the Bragg reflections are produced at lowerangles. Therefore, to keep the q-range unchanged, thedetector must be moved away from the sample. As aconsequence, the X-ray beam spot on the sample will appearsmaller when seen from the detector and the Fraunhoferdiffraction condition (point-like sample) is approached.
These favorable conditions enabled real-time measurementof the lattice parameter a variation of the spinel Li4/3Ti5/3O4,usually defined as “zero-strain” compound because of theextremely small changes (∆a/a<1‰) it exhibits when used asan anode material. Such a high structural stability isconsidered as the main reason for the long cycle life of thiscompound.
Figures 130a and 130b represent two intermediate stagesof data processing.They show that even minimal systematiceffects induced by the X-ray beam cannot be neglectedwhen very accurate measurements are necessary. InFigure 130a, the time evolution of the a parameter is shownwhen neither the thermal drift of the monochromator, whichinduces a progressive shift of the beam energy, nor the slightvertical movement of the X-ray beam upon storage ring
refilling are taken into account. In Figure 130b, the data arecorrected for the first effect only; in Figure 130c for both.
The result reported in the latter figure shows thatLi4/3Ti5/3O4, commonly considered as an almost idealmaterial, undergoes structural variations qualitatively similarto other common electrode materials, although on a muchsmaller scale. The high sampling rate permitted the firstobservation of a trend variation the Li4/3Ti5/3O4 a curve,which can be attributed to the presence of single-phase(shaded areas) and bi-phase domains.
The high statistics and high frequency sampling alsoallowed us to accurately follow the real time changes of thewell-known LiNi0.8Co0.2O2 cathode material, in order toobserve its phase transitions upon cycling.
In Figure 131, two regions of the collected diffraction patternsequence are shown.The peak evolution in the (4.2-4.8) Å–1
q-range during the first 14 hours of the cell working(Figure 131a) clearly reveals an irreversible transitionbetween the two hexagonal (both R
–3m ) phases, H1 and
H2, occurring during the first charge. Another region,corresponding to the (3.25-4.3) Å–1 q-range and to the wholeexperiment duration, is reported in Figure 131b. In this case,
Fig. 130: Progressive refinement of experimental data (a andb) to obtain the final curve (c) of the time evolution of thelattice parameter a of Li4/3Ti5/3O4 (see text). The trend of the ccurve clearly follows the cell voltage profile reported below.Shaded areas represent the intervals in which a unique phaseis present; elsewhere a coexistence of two phases occurs.
Fig. 131: Two regions in which an irreversible (a) and areversible (b) phase transition in LiNi0.8Co0.2O2 can beobserved. The former is revealed by the final disappearance ofthe 113(H1) peak; the latter, by the disappearance andreappearance of the 105(H2) and 107(H2) peaks. Peakslabelled with (Al) are produced by diffraction of thealuminum substrate.

2001 HIGHLIGHTSESRF
Materials
91
a second reversible phase transition from R–3m (H2) to
P–3m1 (H3) is observed at very high cell voltage.
Principal Publications and AuthorsV. Rossi Albertini (a), P. Perfetti (a), F. Ronci (b), P. Reale (b) andB. Scrosati (b), Appl. Phys. Lett., 79(1), 27, (2001); F. Ronci,P. Reale, S. Panero (b), B. Scrosati, V. Rossi Albertini, P. Perfetti,M. di Michiel (c) and J. Merino (c), J. Phys.-Chem. B, in press.(a) Istituto di Struttura della Materia-CNR, Rome (Italy)(b) University of Rome “La Sapienza” (Italy)(c) ESRF
Stress Measurements in ThinFilms using SynchrotronRadiationThe in situ determination of stress is an importantapplication of X-ray diffraction in materials science. Themeasurement of strain along several directions allows thedetermination of different components of the strain tensor.However, when thin films are considered, thesemeasurements can prove to be difficult because the weakintensity of the scattering prevents the accuratedetermination of the Bragg peak positions, which is theprincipal way of evidencing stresses in stiff materials. Inaddition, large anisotropies are usually expected in thin filmsdepending on the orientation with respect to the surface.
The flux of synchrotron radiation and its small divergenceare necessary for these kinds of measurements.Here weshow that standard z-axis surface goniometers can be usedwith several advantages for stress measurements.
Needs for stress measurements in thin films appear in manyareas of materials science ranging from nuclear industry tomicro-electronics. The example below deals with zirconiathin films, formed on zirconium alloys used as fuel claddingmaterials in pressurised water reactors.
On the coolant (water) side, an oxide layer forms, made ofboth monoclinic and tetragonal zirconia. Due to the thermalinsulating properties of this layer, control of the factorsaffecting its growth is technologically very important. Thestresses in this layer are key parameters in the control of thecorrosion rate: they might induce crack formation in theoxide, stabilisation of the normally unstable tetragonalzirconia and alter the diffusion rate of oxygen through theoxide. Many experiments have been performed at roomtemperature on thick oxides showing a high compressivestress in the gigapascal (GPa) range. If one wishes tomeasure the true stress level related to the oxidationmechanism, it is necessary to perform, an experiment at thetemperature at which the oxides are grown (i.e. 300°C in our
case) in order to avoid contributions from the differentexpansion coefficients of the oxide and the metal.
When one is interested in the first stages of oxide growth(thin films), the use of synchrotron radiation is necessary tohave an intense and nearly parallel incident beam. Thisbeam is projected into the oxide at a small angle ofincidence to control the penetration depth and avoidilluminating the diffraction lines of the metal substrate.Simultaneously the wavelength can be adjusted to tuneabsorption and to increase the scattering angles.
Fig. 132: Geometry for strain measurements in grazingincidence conditions.
The geometry used (Figure 132) has some analogy with astandard surface scattering experiment: the incident anglealpha is kept fixed while scanning the 2θ angle at constanttilt angle ψ (ψ is the angle between the probed hkl planesand the normal to the sample). Rotating the sample aroundits normal also allows one to keep the azimuth angle φconstant when 2θ is scanned.
A series of peaks recorded for different values of the tiltangle ψ are shown in Figure 133.The shifts of several Braggpeak positions as a function of the tilt angle ψ are measuredfrom these curves. When plotted as a function of sin2ψ, thestrains exhibit a straight line which allow the determination ofboth in plane and perpendicular components of the straintensor using the standard “sin2ψ” method.
Fig. 133: Evolution of the Bragg lines as a function of the tiltangle.

HIGHLIGHTS 2001 92ESRF
Materials
Knowing the elastic constants of the material, the stress canbe obtained. It was shown in our case that the stress level inboth direction (σ1 and σ3) decreases as a function of theoxide thickness (see Figure 134).
Fig. 134: Evolution of in-plane (σ1) and normal (σ3) stressesas a function of oxide thickness for Zircaloy-4.
Among the results from such studies on zirconia thin filmsone should mention the evidence that:- residual stresses in the GPa range are present in thinzirconia films at high temperature.- the stress levels decreases when the oxide grows.- cooling the sample back to room temperature induces arelaxation of several hundreds of MPa.
References[1] M. Parise, O. Sicardy and G. Cailletaud, J. Nucl. Mat.,256, 35-46 (1998).[2] O.Sicardy, I Touet, F. Rieutord and J. Eymery, J. Phys IV,10 (2000).
Principal publication and AuthorsO. Sicardy (a), I.Touet (a), F. Rieutord (b) and J. Eymery (b),Journal of Neutron Research 9, 263-272 (2001).(a) CEA-Grenoble, DRT/DEN, Grenoble (France)(b) CEA-Grenoble, DSM/DRFMC Grenoble (France)
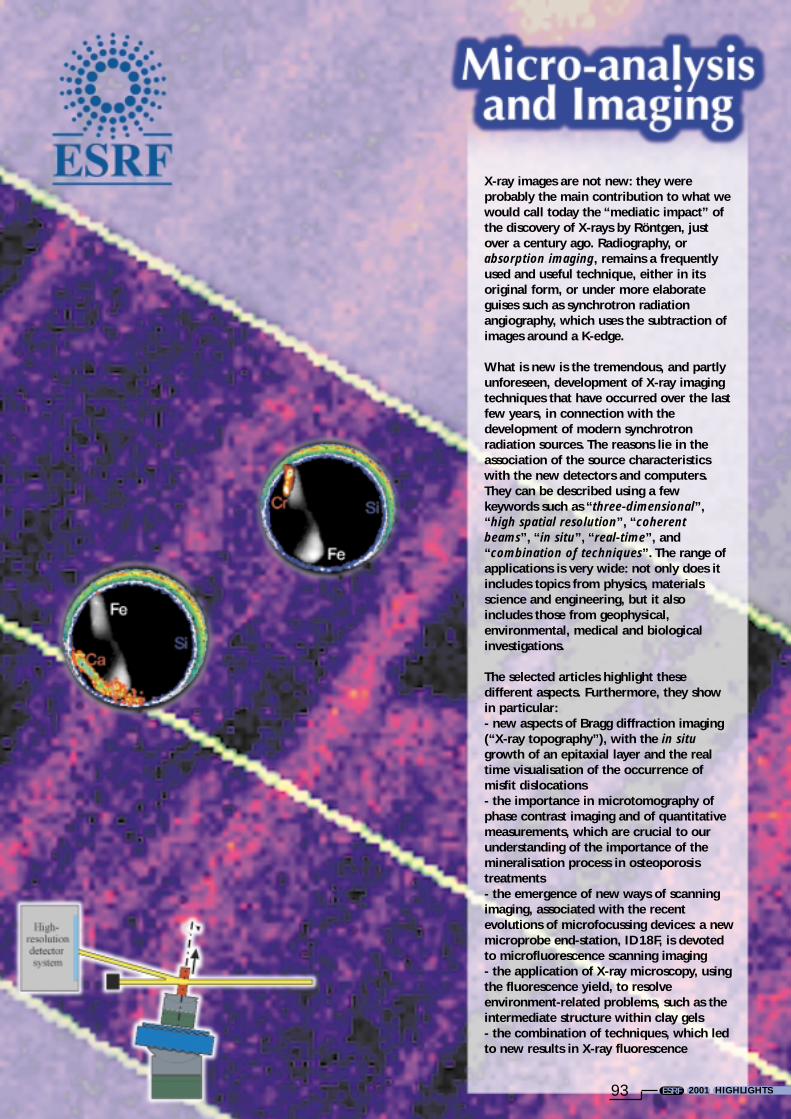
2001 HIGHLIGHTSESRF93
X-ray images are not new: they wereprobably the main contribution to what wewould call today the “mediatic impact” ofthe discovery of X-rays by Röntgen, justover a century ago. Radiography, orabsorption imaging, remains a frequentlyused and useful technique, either in itsoriginal form, or under more elaborateguises such as synchrotron radiationangiography, which uses the subtraction ofimages around a K-edge.
What is new is the tremendous, and partlyunforeseen, development of X-ray imagingtechniques that have occurred over the lastfew years, in connection with thedevelopment of modern synchrotronradiation sources. The reasons lie in theassociation of the source characteristicswith the new detectors and computers.They can be described using a fewkeywords such as “three-dimensional”,“high spatial resolution”, “coherentbeams”, “in situ”, “real-time”, and“combination of techniques”. The range ofapplications is very wide: not only does itincludes topics from physics, materialsscience and engineering, but it alsoincludes those from geophysical,environmental, medical and biologicalinvestigations.
The selected articles highlight thesedifferent aspects. Furthermore, they showin particular:- new aspects of Bragg diffraction imaging(“X-ray topography”), with the in situgrowth of an epitaxial layer and the realtime visualisation of the occurrence ofmisfit dislocations- the importance in microtomography ofphase contrast imaging and of quantitativemeasurements, which are crucial to ourunderstanding of the importance of themineralisation process in osteoporosistreatments - the emergence of new ways of scanningimaging, associated with the recentevolutions of microfocussing devices: a newmicroprobe end-station, ID18F, is devotedto microfluorescence scanning imaging- the application of X-ray microscopy, usingthe fluorescence yield, to resolveenvironment-related problems, such as theintermediate structure within clay gels- the combination of techniques, which ledto new results in X-ray fluorescence
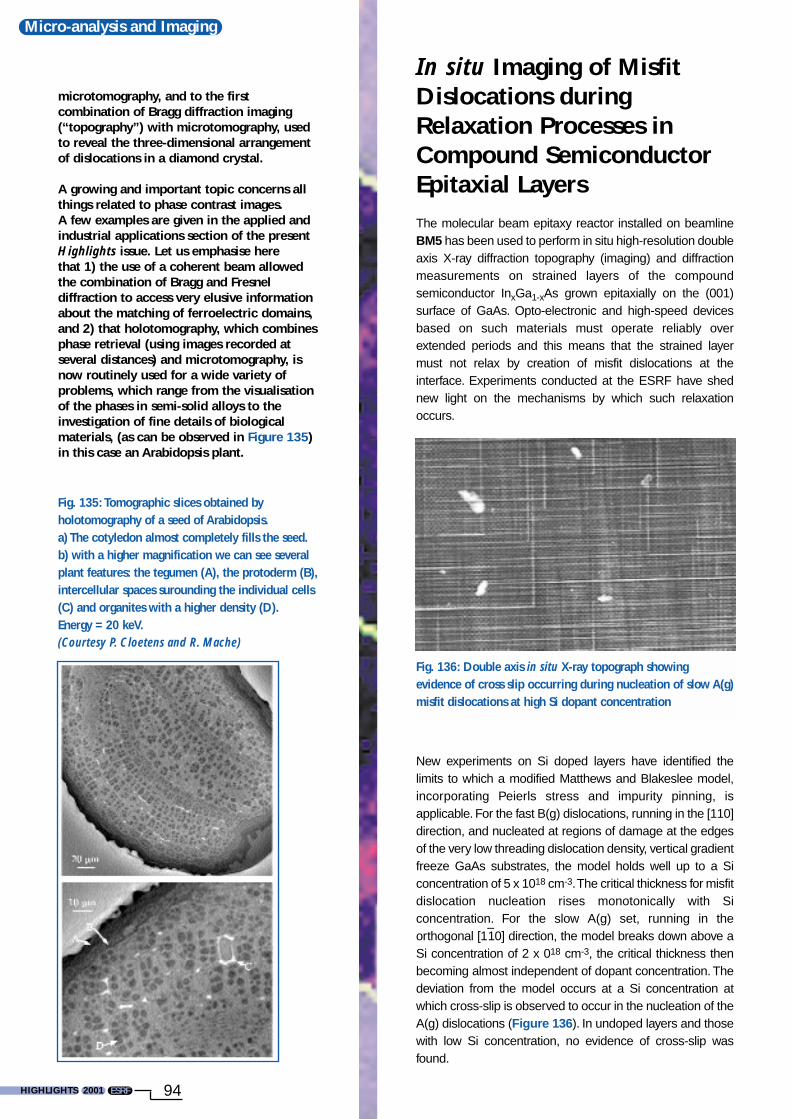
HIGHLIGHTS 2001 94ESRF
Micro-analysis and Imaging
microtomography, and to the firstcombination of Bragg diffraction imaging(“topography”) with microtomography, usedto reveal the three-dimensional arrangementof dislocations in a diamond crystal.
A growing and important topic concerns allthings related to phase contrast images.A few examples are given in the applied andindustrial applications section of the presentHighlights issue. Let us emphasise herethat 1) the use of a coherent beam allowedthe combination of Bragg and Fresneldiffraction to access very elusive informationabout the matching of ferroelectric domains,and 2) that holotomography, which combinesphase retrieval (using images recorded atseveral distances) and microtomography, isnow routinely used for a wide variety ofproblems, which range from the visualisationof the phases in semi-solid alloys to theinvestigation of fine details of biologicalmaterials, (as can be observed in Figure 135)in this case an Arabidopsis plant.
In situ Imaging of MisfitDislocations duringRelaxation Processes inCompound SemiconductorEpitaxial Layers The molecular beam epitaxy reactor installed on beamlineBM5 has been used to perform in situ high-resolution doubleaxis X-ray diffraction topography (imaging) and diffractionmeasurements on strained layers of the compoundsemiconductor InxGa1-xAs grown epitaxially on the (001)surface of GaAs. Opto-electronic and high-speed devicesbased on such materials must operate reliably overextended periods and this means that the strained layermust not relax by creation of misfit dislocations at theinterface. Experiments conducted at the ESRF have shednew light on the mechanisms by which such relaxationoccurs.
New experiments on Si doped layers have identified thelimits to which a modified Matthews and Blakeslee model,incorporating Peierls stress and impurity pinning, isapplicable. For the fast B(g) dislocations, running in the [110]direction, and nucleated at regions of damage at the edgesof the very low threading dislocation density, vertical gradientfreeze GaAs substrates, the model holds well up to a Siconcentration of 5 x 1018 cm-3.The critical thickness for misfitdislocation nucleation rises monotonically with Siconcentration. For the slow A(g) set, running in theorthogonal [1
–10] direction, the model breaks down above a
Si concentration of 2 x 018 cm-3, the critical thickness thenbecoming almost independent of dopant concentration. Thedeviation from the model occurs at a Si concentration atwhich cross-slip is observed to occur in the nucleation of theA(g) dislocations (Figure 136). In undoped layers and thosewith low Si concentration, no evidence of cross-slip wasfound.
Fig. 135: Tomographic slices obtained byholotomography of a seed of Arabidopsis. a) The cotyledon almost completely fills the seed. b) with a higher magnification we can see severalplant features: the tegumen (A), the protoderm (B),intercellular spaces surounding the individual cells(C) and organites with a higher density (D).Energy = 20 keV. (Courtesy P. Cloetens and R. Mache)
Fig. 136: Double axis in situ X-ray topograph showingevidence of cross slip occurring during nucleation of slow A(g)misfit dislocations at high Si dopant concentration
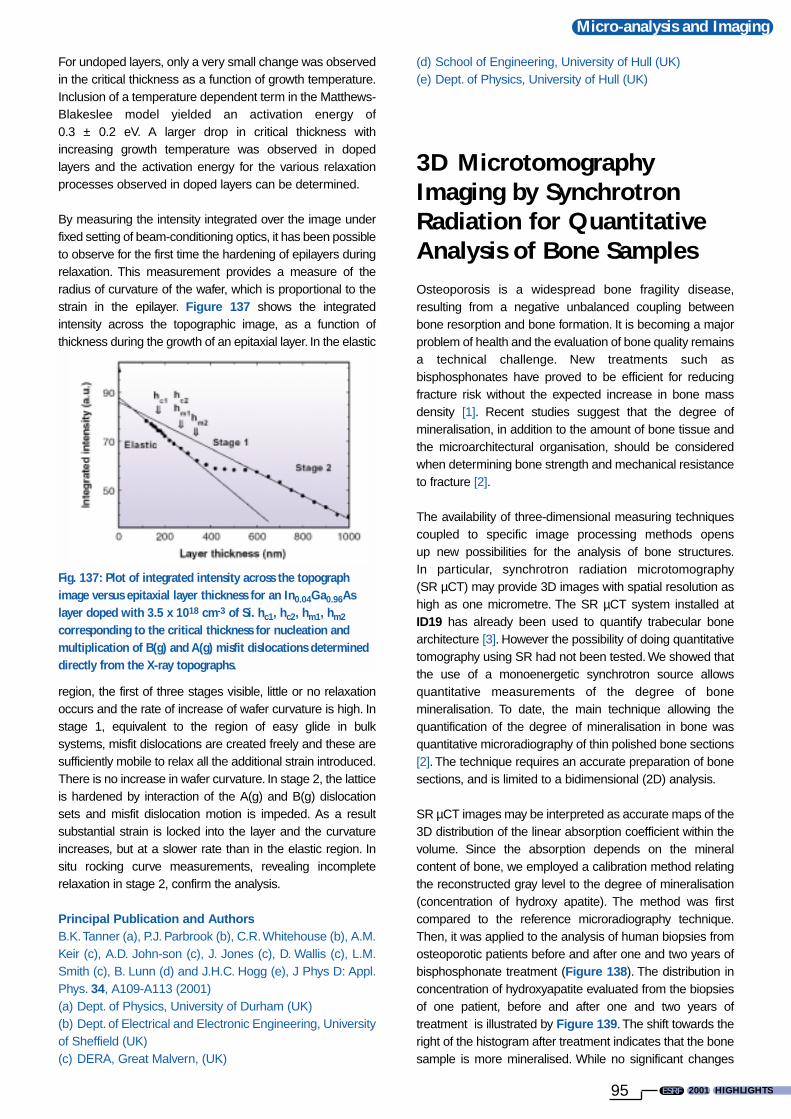
2001 HIGHLIGHTSESRF
Micro-analysis and Imaging
95
For undoped layers, only a very small change was observedin the critical thickness as a function of growth temperature.Inclusion of a temperature dependent term in the Matthews-Blakeslee model yielded an activation energy of0.3 ± 0.2 eV. A larger drop in critical thickness withincreasing growth temperature was observed in dopedlayers and the activation energy for the various relaxationprocesses observed in doped layers can be determined.
By measuring the intensity integrated over the image underfixed setting of beam-conditioning optics, it has been possibleto observe for the first time the hardening of epilayers duringrelaxation. This measurement provides a measure of theradius of curvature of the wafer, which is proportional to thestrain in the epilayer. Figure 137 shows the integratedintensity across the topographic image, as a function ofthickness during the growth of an epitaxial layer. In the elastic
region, the first of three stages visible, little or no relaxationoccurs and the rate of increase of wafer curvature is high. Instage 1, equivalent to the region of easy glide in bulksystems, misfit dislocations are created freely and these aresufficiently mobile to relax all the additional strain introduced.There is no increase in wafer curvature. In stage 2, the latticeis hardened by interaction of the A(g) and B(g) dislocationsets and misfit dislocation motion is impeded. As a resultsubstantial strain is locked into the layer and the curvatureincreases, but at a slower rate than in the elastic region. Insitu rocking curve measurements, revealing incompleterelaxation in stage 2, confirm the analysis.
Principal Publication and AuthorsB.K.Tanner (a), P.J. Parbrook (b), C.R.Whitehouse (b), A.M.Keir (c), A.D. John-son (c), J. Jones (c), D. Wallis (c), L.M.Smith (c), B. Lunn (d) and J.H.C. Hogg (e), J Phys D: Appl.Phys. 34, A109-A113 (2001)(a) Dept. of Physics, University of Durham (UK)(b) Dept. of Electrical and Electronic Engineering, Universityof Sheffield (UK)(c) DERA, Great Malvern, (UK)
(d) School of Engineering, University of Hull (UK)(e) Dept. of Physics, University of Hull (UK)
3D MicrotomographyImaging by SynchrotronRadiation for QuantitativeAnalysis of Bone SamplesOsteoporosis is a widespread bone fragility disease,resulting from a negative unbalanced coupling betweenbone resorption and bone formation. It is becoming a majorproblem of health and the evaluation of bone quality remainsa technical challenge. New treatments such asbisphosphonates have proved to be efficient for reducingfracture risk without the expected increase in bone massdensity [1]. Recent studies suggest that the degree ofmineralisation, in addition to the amount of bone tissue andthe microarchitectural organisation, should be consideredwhen determining bone strength and mechanical resistanceto fracture [2].
The availability of three-dimensional measuring techniquescoupled to specific image processing methods opensup new possibilities for the analysis of bone structures.In particular, synchrotron radiation microtomography(SR µCT) may provide 3D images with spatial resolution ashigh as one micrometre. The SR µCT system installed atID19 has already been used to quantify trabecular bonearchitecture [3]. However the possibility of doing quantitativetomography using SR had not been tested. We showed thatthe use of a monoenergetic synchrotron source allowsquantitative measurements of the degree of bonemineralisation. To date, the main technique allowing thequantification of the degree of mineralisation in bone wasquantitative microradiography of thin polished bone sections[2]. The technique requires an accurate preparation of bonesections, and is limited to a bidimensional (2D) analysis.
SR µCT images may be interpreted as accurate maps of the3D distribution of the linear absorption coefficient within thevolume. Since the absorption depends on the mineralcontent of bone, we employed a calibration method relatingthe reconstructed gray level to the degree of mineralisation(concentration of hydroxy apatite). The method was firstcompared to the reference microradiography technique.Then, it was applied to the analysis of human biopsies fromosteoporotic patients before and after one and two years ofbisphosphonate treatment (Figure 138). The distribution inconcentration of hydroxyapatite evaluated from the biopsiesof one patient, before and after one and two years oftreatment is illustrated by Figure 139. The shift towards theright of the histogram after treatment indicates that the bonesample is more mineralised. While no significant changes
Fig. 137: Plot of integrated intensity across the topographimage versus epitaxial layer thickness for an In0.04Ga0.96Aslayer doped with 3.5 x 1018 cm-3 of Si. hc1, hc2, hm1, hm2
corresponding to the critical thickness for nucleation andmultiplication of B(g) and A(g) misfit dislocations determineddirectly from the X-ray topographs.

HIGHLIGHTS 2001 96ESRF
Micro-analysis and Imaging
regarding structural parameters were observed withtreatment, the statistical analysis exhibited a positive trendtowards higher mineralisation. Thus, SR µCT appears as aunique tool for analysing bone samples both in terms ofmicroarchitecture and bone mineral content.
References[1] D.A. Hanley, G. Ioannidis and J.D. Adachi, Journal ofClinical. Densitometry, 3:1, 79-95 (2000).[2] G.Y. Boivin, P.M. Chavassieux, A.C. Santora, J.Yates andP.J. Meunier, Bone 27, 687-694 (2000).[3] F. Peyrin, M. Salomé, S. Nuzzo, P. Cloetens, A.M. Laval-Jeantet and J. Baruchel, Cell. Mol. Biol., 46(6), 1089-1102(2000).
Principal Publication and AuthorsS. Nuzzo (a, b), F. Peyrin (a, b), E. Martín-Badosa (c), M.H.Lafage-Proust (d) and G. Boivin (e), IEEE Transaction onNuclear Science 48:(3), 859-863 2001.(a) ESRF(b) CREATIS, INSA, Villeurbanne (France)(c) Laboratori d'Òptica, Departament de Física Aplicada iÒptica, Universitat de Barcelona (Spain)(d) INSERM, St Etienne (France)(e) INSERM, Lyon (France)
ID18F: A New X-rayMicroprobe End-stationA new User end-station, ID18F (Figure 140), dedicated toprecise and reproducible X-ray microprobe measurements,has been constructed in the third experimental hutch of theID18F beamline in collaboration with the MiTAC laboratoryof the University of Antwerp, Belgium.The activities are alsofunded through the EU Project (Growth Programme),MicroXRF.
The goal of the end-station is to improve procedures ofmicro-X-ray fluorescence analysis in order to reach 5-10%average accuracy of quantification down to sub-ppmconcentration levels for elements of Z > 13. In order toachieve this goal, high reproducibility of the measurementgeometry and instrumental parameters, and very good shortand long-term stability and precise monitoring (< 1%) of theintensity variation of the incoming beam, are required.
The end-station uses the optics infrastructure of the ID18beamline: the energy of the monochromatic radiation can betuned in the 6-28 keV range by changing the undulator gapand employing a fixed-exit double crystal Si(111)monochromator.
The micro-probe setup is positioned on a movable granitetable. Compound refractive lenses are used for focusing.Theroutinely achievable spot size is 1-2 micrometres verticallyand 12-15 micrometres horizontally. Ionisation chambers andphotodiodes monitor the intensities of the incoming, focusedand transmitted beam. A miniature ionisation chamber withan aperture of 50 micrometres in diameter as an entrancewindow was developed at the ESRF (M. Kocsis, J. Surr) formeasuring the intensity of the focused beam close (< 5 cm)to the sample. The 3-5 % precision available by using themeasured signal of the mini-ionisation chamber fornormalisation purposes will be improved further in the future.
Characteristic X-ray line intensities are detected by a Si(Li)detector (GRESHAM) of 30 mm2 active area, 3.5 mm activethickness and 8 micrometre thick Be window placed in 90°geometry to the incoming linearly polarised X-ray beam. Fastscanning XRF measurements (> 0.1 s live time/spectrum)are possible. The AXIL software package is used for the on-line evaluation of X-ray fluorescence spectra. Quantification
a) b)
Fig. 138: Reconstructed image of iliac crest biopsy sample: 3Ddisplay (a) and first 2D slice (b). Voxel size = 10.13 µm.
Fig. 140: Experimental setup of ID18F.
Fig. 139: Distribution of hydroxyapatite (HA) concentration incortical bone for one patient before treatment (Ø), after oneyear of treatment (1) and after two years of treatment (2).
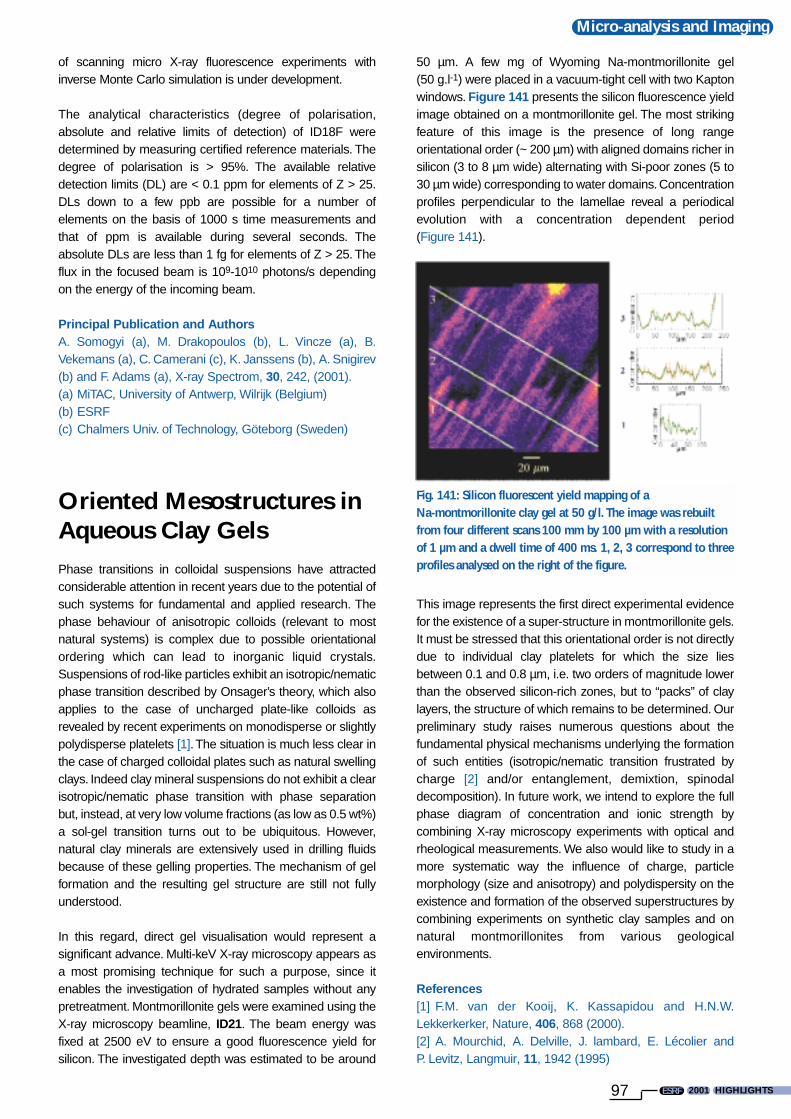
2001 HIGHLIGHTSESRF
Micro-analysis and Imaging
97
of scanning micro X-ray fluorescence experiments withinverse Monte Carlo simulation is under development.
The analytical characteristics (degree of polarisation,absolute and relative limits of detection) of ID18F weredetermined by measuring certified reference materials. Thedegree of polarisation is > 95%. The available relativedetection limits (DL) are < 0.1 ppm for elements of Z > 25.DLs down to a few ppb are possible for a number ofelements on the basis of 1000 s time measurements andthat of ppm is available during several seconds. Theabsolute DLs are less than 1 fg for elements of Z > 25. Theflux in the focused beam is 109-1010 photons/s dependingon the energy of the incoming beam.
Principal Publication and AuthorsA. Somogyi (a), M. Drakopoulos (b), L. Vincze (a), B.Vekemans (a), C. Camerani (c), K. Janssens (b), A. Snigirev(b) and F. Adams (a), X-ray Spectrom, 30, 242, (2001).(a) MiTAC, University of Antwerp, Wilrijk (Belgium)(b) ESRF(c) Chalmers Univ. of Technology, Göteborg (Sweden)
Oriented Mesostructures inAqueous Clay GelsPhase transitions in colloidal suspensions have attractedconsiderable attention in recent years due to the potential ofsuch systems for fundamental and applied research. Thephase behaviour of anisotropic colloids (relevant to mostnatural systems) is complex due to possible orientationalordering which can lead to inorganic liquid crystals.Suspensions of rod-like particles exhibit an isotropic/nematicphase transition described by Onsager’s theory, which alsoapplies to the case of uncharged plate-like colloids asrevealed by recent experiments on monodisperse or slightlypolydisperse platelets [1].The situation is much less clear inthe case of charged colloidal plates such as natural swellingclays. Indeed clay mineral suspensions do not exhibit a clearisotropic/nematic phase transition with phase separationbut, instead, at very low volume fractions (as low as 0.5 wt%)a sol-gel transition turns out to be ubiquitous. However,natural clay minerals are extensively used in drilling fluidsbecause of these gelling properties. The mechanism of gelformation and the resulting gel structure are still not fullyunderstood.
In this regard, direct gel visualisation would represent asignificant advance. Multi-keV X-ray microscopy appears asa most promising technique for such a purpose, since itenables the investigation of hydrated samples without anypretreatment. Montmorillonite gels were examined using theX-ray microscopy beamline, ID21. The beam energy wasfixed at 2500 eV to ensure a good fluorescence yield forsilicon. The investigated depth was estimated to be around
50 µm. A few mg of Wyoming Na-montmorillonite gel (50 g.l-1) were placed in a vacuum-tight cell with two Kaptonwindows. Figure 141 presents the silicon fluorescence yieldimage obtained on a montmorillonite gel. The most strikingfeature of this image is the presence of long rangeorientational order (~ 200 µm) with aligned domains richer insilicon (3 to 8 µm wide) alternating with Si-poor zones (5 to30 µm wide) corresponding to water domains. Concentrationprofiles perpendicular to the lamellae reveal a periodicalevolution with a concentration dependent period(Figure 141).
This image represents the first direct experimental evidencefor the existence of a super-structure in montmorillonite gels.It must be stressed that this orientational order is not directlydue to individual clay platelets for which the size liesbetween 0.1 and 0.8 µm, i.e. two orders of magnitude lowerthan the observed silicon-rich zones, but to “packs” of claylayers, the structure of which remains to be determined. Ourpreliminary study raises numerous questions about thefundamental physical mechanisms underlying the formationof such entities (isotropic/nematic transition frustrated bycharge [2] and/or entanglement, demixtion, spinodaldecomposition). In future work, we intend to explore the fullphase diagram of concentration and ionic strength bycombining X-ray microscopy experiments with optical andrheological measurements. We also would like to study in amore systematic way the influence of charge, particlemorphology (size and anisotropy) and polydispersity on theexistence and formation of the observed superstructures bycombining experiments on synthetic clay samples and onnatural montmorillonites from various geologicalenvironments.
References[1] F.M. van der Kooij, K. Kassapidou and H.N.W.Lekkerkerker, Nature, 406, 868 (2000).[2] A. Mourchid, A. Delville, J. lambard, E. Lécolier andP. Levitz, Langmuir, 11, 1942 (1995)
Fig. 141: Silicon fluorescent yield mapping of a Na-montmorillonite clay gel at 50 g/l. The image was rebuiltfrom four different scans 100 mm by 100 µm with a resolutionof 1 µm and a dwell time of 400 ms. 1, 2, 3 correspond to threeprofiles analysed on the right of the figure.

HIGHLIGHTS 2001 98ESRF
Micro-analysis and Imaging
Principal Publication and Authors I. Bihannic (a), L.J. Michot (a), B.S. Lartiges (a), D. Vantelon(a), J. Labille (a), F. Thomas (a), J. Susini (b), M. Salomé (b)and B. Fayard (b), Langmuir, 17, 4144 (2001).(a) Laboratoire Environnement et Minéralurgie, CNRS-INPL-ENSG UMR 7569, Vandoeuvre lès Nancy (France) (b) ESRF
New Results in X-rayFluorescence ComputedMicrotomographyXFCMT is a non-destructive, non-invasive imaging methodthat has started to play an increasing role in microanalysisduring the last three years [1]. It complements transmissionimaging by offering the much-needed elemental sensitivitydown to trace element concentrations with the samemicrometre-sized spatial resolution.
The method has been described extensively [1 andreferences therein], and currently ID22 performsfluorescence tomography with resolutions as high as1 micrometre, using the microprobe setup with compoundrefractive lenses with fluxes as high as 109 to 1010 ph/s in thebeamspot, for energy in the range 14 – 25 keV, while PINKbeam mode allows flux increases of 10-20 times with theexpected slight degradation in the bandwidth.
The sample imaged was a micro-fragment from theTatahouine meteorite, fallen in 1931 and promptly stored atthe Natural History Museum in Paris. The grain analysedwas recently retrieved from the original site and compared tothe pristine ones retrieved in 1931. A series of experimentsin SEM and TEM [2] were performed, in order to study theremnants of pleomorphic bacteria present in fractures andfault lines of the meteorite.
The grain was placed in a sealed thin (≤ 10 µm thick) silicacapillary to guarantee the non-destructiveness of themeasurement – since we wanted to perform IRspectroscopy afterwards. As the scattering peaks produceda non negligible background, it was necessary to use theAXIL fitting package for online data analysis, particularly forthe low energy lines which are subject to self-absorption.
The microbiological study of this meteorite revealedbacteriomorphs of sizes between 0.1 to 0.6 µm, which wereobtained by cultures of the soil surrounding the grains.Hence, it was postulated that these bacteria appear at thefracture sites of the grain, following fluid circulation ofcarbonates from the soil due to terrestrial weathering.Therefore, our study aimed at identifying and locating non-invasively carbonate phases as well as pyroxenes andchromites specific to the grain. The grain was analysed
through the silica walls of the capillary which posed noproblems for the imaging of any elements with the exceptionof Si which was the main constituent of the capillary walls. InFigure 142 is shown the distribution of Fe, Cr and Caparticular to the phases expected, with a resolution of 2 µmusing the ART reconstruction algorithm.
These analyses were completed by high-resolution (1 µm)3D-transmission tomography that revealed the location andsizes of cracks and fractures as well as phases denser thanthe bulk of the grain. The tomographic set of data collectedallowed us to obtain a rich image of the grain and to non-destructively characterise its morphology and structure,prior to the other analyses which require sample preparationand possibly alteration of the grain. This study is part of aCNES/NASA benchmark to establish the feasibility of suchdetailed analyses on Martian meteorites in the quarantinephase through the walls of a mini-P4 sample holder.
In the near future, the ID22 group will continueimprovements of XFCMT, by upgrading both theexperimental setup as well as the methodology of datacollection, analysis and reconstruction, to enlarge the limitsof the applicability of this technique.
References[1] A. Simionovici, M. Chukalina, M. Drakopoulos, I. Snigireva,A. Snigirev, Ch. Schroer, B. Lengeler, K. Janssens and F.Adams, IEEE Trans. Nucl. Sci., 47, 2736 (2000).[2] Ph. Gillet, J.A. Barrat, Th. Heulin, W. Achouak,M. Lesourd, F. Guyot and K. Benzerara, Earth & Planet. Sci.Lett. 175, 161 (2000).
Principal Publication and AuthorsA. Simionovici (a), M. Chukalina (b), B. Vekemans (c),L. Lemelle (d), Ph. Gillet (d), Ch. Schroer (e), B. Lengeler (e),W. Schröder (f) and T. Jeffries (g), Developments in X-raytomography III, ed. U. Bonse, SPIE 4503 (2001).(a) ESRF(b) IMT RAS, Chernogolovka (Russia)(c) MITAC, Univ. of Antwerp (Belgium)(d) École Normale Supérieure, Lyon (France)(e) RWTH, Univ. of Aachen (Germany)(f) IBI, FZ Jülich (Germany)(g) British Natural History Museum, London (UK)
Fig. 142: Fluorescence tomograms of a micrometeorite graininside a silica capillary. Reconstructions (using ART) of the Kαlines for Si (capillary), Fe, Cr and Ca are shown. Resolution ≈2 µm, Integration time = 2 sec/pt.

2001 HIGHLIGHTSESRF
Micro-analysis and Imaging
99
3D Imaging of Crystal Defectsby “Topo-Tomography”X-ray diffraction topography is a well-established method forthe visualisation and analysis of crystal defects in high-quality single crystals. Distortions of the crystal lattice, suchas those provoked by individual dislocations, give rise, in thelow absorption case, to locally enhanced X-ray reflectivity.They can be observed as line-shaped contrasts (so-called“direct image” contrast [1]). However, in a single diffractiontopograph, the 3D dislocation structure is projected into twodimensions. Therefore, more refined methods are requiredto determine the spatial arrangement of the dislocations inthe bulk of the crystal.
Provided the direct image is the dominant contrastmechanism, the intensity distribution in the diffraction imageis a good approximation to a 2D projection of the localreflectivity along the direction of the diffracted beam.Consequently, if one succeeds in measuring a large numberof such projections while turning the sample around a fixedrotation axis, the principles of computed tomography can beapplied in order to reconstruct the unknown 3D distributionof the local reflectivity. However, compared to conventionalabsorption tomography, there is the additional constraint thatthe crystal, during its turn around the rotation axis, has tostay in diffraction for a given reflection.This can be achievedby an experimental setup as depicted in Figure 143, whichallows precise alignment of the rotation axis a and thereciprocal lattice vector g associated with the chosensample reflection.
Figure 144a shows one of the 500 diffraction topographsrecorded from a 7 x 7 x 2 mm3 sized synthetic diamondsample. As can be seen from this diffraction image, thecrystal contains a large number of individual dislocations,which superpose in this single projection. Figure 144bshows the result of the tomographic reconstruction: thedepicted slice corresponds to a virtual section of the crystal
at the position of the dashed line AA’, indicated inFigure 144a. One can clearly distinguish the trapezoidaloutline of the sample cross-section and a number of isolatedpoint-like contrasts. These contrasts correspond to thepositions where the dislocations thread through the layer.Applying a simple intensity threshold to the 3D data set, onecan easily visualise the 3D arrangement of the dislocationlines with standard volume rendering software. Such a 3Drendition of a small part of the crystal (indicated by the boxin Figure 144a) is finally shown in Figure 144c. One canobserve different families of line-shaped contrasts, whichcorrespond to dislocations with preferential orientations inthe crystal lattice.
To summarise, “topo-tomography” may be regarded as anew three-dimensional crystal characterisation technique,based on the combination of X-ray diffraction topographyand computed microtomography.The approach is applicableto high-quality single crystals and yields an approximation ofthe three-dimensional distribution of the local Braggreflectivity in the bulk of the crystal.
Reference[1] B.K. Tanner, X-ray Diffraction Topography, PergamonPress, Oxford (1976).
Principal Publication and AuthorsW. Ludwig (a), P. Cloetens (a), J. Härtwig (a), J. Baruchel (a),B. Hamelin (b) and P. Bastie (c), J. Appl. Cryst., 34, 602-607(2001).(a) ESRF(b) ILL(c) Laboratoire de Spectrométrie Physique, UMR UJF-CNRS Grenoble (France)
Fig. 143: Experimental setup used for topo-tomographic dataacquisition. During the tomographic scan, the crystal is turnedaround the rotation axis a (angle ω). The crystal has to bealigned such that the diffraction vector g is parallel to a.
Fig. 144: (a) Integrated, monochromatic beam X-raydiffraction topograph (2D) of diamond sample (whitecorresponds to higher diffracted intensity). (b) 2Dtomographic slice (plane AA’ in (a)), reconstructed from aseries of 500 diffraction topographs. (c) 3D rendition of thesmall part of the crystal, indicated in (a).

HIGHLIGHTS 2001 100ESRF
Following the tendency of recent years, asubstantial increase in proprietary researchat the ESRF was seen during 2001: Around300 shifts were purchased, representing anincrease of 35% with respect to 2000.
Macromolecular crystallography datacollection was the main activity (80% ofshifts in 2001). A dozen companiesregularly take advantage of the ESRFfacilities in this area, both largepharmaceutical companies and start-upsdriven by proteomics – a promising activitygenerated by genomics.
In order to better meet the requirements ofindustrialists, a “Fedex” service has beenlaunched whereby companies can sendtheir samples by post and the datacollection is carried out by ESRF scientistswho are specialised in industrialbiocrystallography. This new procedure willallow the optimisation of beam time useand will avoid many expensive and time-consuming trips for industrialists.
Another growing activity forpharmaceutical companies is X-ray powderdiffraction for characterising the crystallinefine state of drugs. Mastering the crystallinecharacteristics, i.e. amorphous versuscrystalline content, size of crystallites andcrystalline lattice, is of utmost importancefor the manufacturing process. Sometimestiny changes can only be detected using theESRF's high-resolution diffractometers; thisaspect is illustrated in this section by onecontribution.
Other industrial activities are concernedmainly with materials, with diverseapplications such as microelectronics, glass,cosmetics, petroleum, construction orplastics. Four examples are given here. Two describe applications ofmicrotomography in various domains.

2001 HIGHLIGHTSESRF
Applied and Industrial Research
101
A series of microtomography imagesillustrate the capabilities of this techniquefor characterisation, control and processdevelopment. The two other examples arerelated to microelectronics, more preciselyto the control of silicon carbide processingby synchrotron topography, and to thecharacterisation of defects in silicon afterion implantation and annealing using thepromising grazing incidence diffuse X-rayscattering (GIDXS) technique. The ESRF isideally suited to exploit this technique tostudy defects induced in the process offabricating shallow junction by sub-keVdopant implantation.
Finally the last article deals with the latestresults from the industrial facility that hasbeen installed at the ESRF to fulfil therequirements of the semiconductorindustries in terms of contaminationcontrol.
Structural Transformationsand Physical Properties ofZopiclone Racemic zopiclone (a cyclopyrrolone hypnotic drugmarketed as Zimovane® tablets) crystallises in twocentrosymmetric forms: monoclinic dihydrate (I) (Figure145) and monoclinic anhydrous (II). Zopiclone is also knownto form a non-centrosymmetric orthorhombic anhydrousstructure (III). Motivation for the study of the structural basisof the reversible transformation I ↔ II (and the subsequentsolid-state chiral separation II → III) came from reports ofsignificant batch-to-batch variation in physical form amongstcommercial samples of zopiclone.
Figure 146 shows XRPD patterns collected on BM16 in therange 2.2-3.6° 2θ (λ = 0.8 Å) for the three forms of zopiclone.Form II was produced in situ from the starting sample of
form I by breaking the sealed end of the capillaryand exposing the sample to a warm N2 stream.Thetransformation was monitored via the growth onheating of the diagnostic (1 0 0) reflection at ca.3.23°, which occurs at the expense of the dihydrate(1 0 0) reflection at ca. 2.96°. Further heatingtransformed II → III, as evidenced by theappearance of the form III (0 0 2) reflection at ca.2.57°.The crystal structures of all three forms weredetermined directly from the XRPD data using thesimulated annealing procedure describedpreviously [1] which is now implemented in theDASH computer program [2].
Fig. 145: The conformation of zopiclone in the crystalstructure of form I.
Fig. 146: The transformations ofzopiclone on heating.

HIGHLIGHTS 2001 102ESRF
Applied and Industrial Research
The molecular conformations and basic packing motif informs I and II are strikingly similar, with the zopiclonemolecules arranging themselves in bilayer sheets whichremain essentially unchanged in the dehydration process asthe water molecules are removed from the crystal structure.The process is energetically straightforward since theprincipal structural change during dehydration is the close-packing of each bilayer sheet by 6.61 Å along the c axis and1.48 Å along the a axis, both relative to the form I unit cell.This close structural similarity also accounts for the easewith which hygroscopic form II reverts to form I on exposureto high relative humidity at room temperature.
The exothermic transformation of form II → III at elevatedtemperature is a rare example of a spontaneous resolutionof enantiomers in the solid state and is accompanied by asignificant change in molecular conformation. There is nodoubt that the (R) and (S) enantiomers separate during thetransformation, although the XRPD experiment cannotdistinguish between formation of racemic twins or a racemicconglomerate – either possibility is consistent with thediffraction data. However, the sharpness of the powderdiffraction lines indicates domain sizes in excess of 1000 Å.
In summary, the monoclinic centrosymmetric form ofzopiclone dihydrate undergoes a sequential, two-steptransformation in the solid state upon heating which resultsin enantiomer separation. Central to detailing thetransformations at molecular level was the requirement toproduce a sharply diffracting sample of form II and thensolve its crystal structure. In this regard the high instrumentalresolution and count rate offered by BM16, plus the efficientglobal optimisation method, was ideally suited to theexperiment and demonstrates the power of structureelucidation in ‘troubleshooting’ pharmaceutical processingproblems.
References[1] ESRF Highlights, 23 (1999).[2] W.I.F. David, K. Shankland, J. Cole, S. Maginn, W.D.S.Motherwell and R. Taylor, DASH User Manual, CambridgeCrystallographic Data Centre, Cambridge (2001).
Principal Publication and AuthorsN. Shankland (a,), W.I.F. David (b), K. Shankland (b),A.R. Kennedy (c), C.S. Frampton (d) and A.J. Florence (a),Chem. Commun., 2204-2205 (2001)(a) Department of Pharmaceutical Sciences, University ofStrathclyde (UK)(b) ISIS Facility, Rutherford Appleton Laboratory (UK)(c) Department of Pure and Applied Chemistry, University ofStrathclyde (UK)(d) Roche Discovery Welwyn, Welwyn Garden City (UK)
First Direct 3D Visualisationof Microstructural ChangesDuring SinteringSintering is the material preparation process that allowsdensification of powders at temperatures lower than theirmelting point. Mass transfers that take place to minimisesurface energies induce various microstructural changessuch as intergranular porosity disappearance and graingrowth. Since the sixties, much research has been done tounderstand and model sintering phenomena. The datacollected for those studies came from large-scaletechniques or was obtained by averaging 2Dmeasurements. Consequently, predictions of densificationphenomena are generally limited to the case of ideal grainarrangements [1]. Recent developments of the X-raycomputed microtomography technique opened the path tonon-destructive 3D characterisation at the micrometre scaleof samples during sintering, offering an entirely newviewpoint for sintering mechanisms analysis.
The material considered was a soda-lime glass powderconstituted of spherical particles (average diameter of120 µm).This size was chosen to have a significant numberof spheres in the X-ray beam while a high voxel resolutionwas kept (2 µm). Isothermal sintering treatments andmicrotomography measurements were performedsequentially on pre-sintered samples at ID19.
Fig. 147: 3D image of the CT-reconstructed volume of aquarter of a pre-sintered sample.

2001 HIGHLIGHTSESRF
Applied and Industrial Research
103
A 3D reconstructed image of a quarter of a sample in theinitial state (pre-sintered) is presented in Figure 147. Grainsappear as spheres lightly connected to each other which isthe typical microstructure of a powder compact at the verybeginning of sintering. More complete measurements havebeen obtained from a given sub-volume of the compact(200 x 200 x 200 µm3), extracted from the sample at differenttimes. The 3D microstructural evolution of that sub-volumeduring sintering is illustrated in Figure 148, for the solid part(left) and the porous part (right). These views give anunprecedented description of the 3 stages of sintering. Firststage (a): formation of necks between particles and grainrearrangement without pore elimination. Second stage (b):neck growth, changes in grain shape and pore elimination.Third stage (c): final densification and pore closure. Suchimages clearly depict the complex geometrical changes thattake place all along the sintering process; the classicaldescription of pores as cylinders in the intermediate stage isquite far from reality.
Some relevant parameters relative to sintering phenomenahave been extracted from these images. For example,porosity evolution has been calculated both in the wholesample and in the sub-volume in order to study the influenceof large packing defects on surrounding particles duringdensification. More interesting is the time evolution of neckconnecting particles. First results suggest that necks formedduring the process increase in the same way as those that
were initially present. Accordingly, neck growth can actuallybe described using a unique law within that glass material.This observation agrees with numerical calculationsperformed on such glass powder systems [2] showing that,at least at the beginning of the process, neck growth ismainly governed by the local minimisation of surface energyand is almost independent of the grain surroundings.
This conclusion must be reinforced by more global andprecise analysis of the data, but it clearly reveals thepotentiality offered by this technique.
References[1] R.M. German, Sintering theory and practice. Wiley-interscience publication, ed. John Wiley & sons, New York(1996).[2] D. Gendron, Numerical and experimental study ofsintering at the grain scale, PhD. Thesis, UniversityBordeaux 1 (2001).
AuthorsD. Bernard (a), D. Gendron (b) and J.-M. Heintz (a)(a) Institut de Chimie de la Matière Condensée deBordeaux, CNRS, Pessac (France)(b) CERMEP, Grenoble (France)
Industrial MicrotomographyApplications at ID19X-ray imaging techniques, and in particular X-ray computedmicrotomography (CMT) [1], provides a valuable tool forapplied research.These techniques are non-destructive andgive access to three-dimensional (3D) images of variousmaterials at the micrometer scale.
Over the past three years, an increasing number of industrialcompanies have used CMT, on the ID19 beamline, to solveproblems they encounter.This is performed either by payingfor beam time and expertise, or through collaboration withuniversities or research groups and peer-reviewedproposals. One of the keys to this success is that, in additionto confidentiality and rapid access, the ESRF now proposesa complete service, which includes the preparation of theexperiment (discussion about the experimental feasibility,mechanical and electronic device preparation, whenrequired), the experiment itself and data analysis (volumereconstruction in CMT, image processing, etc.).
Three selected industrial applications are presented, withthe agreement of the industrial companies concerned. Thefirst two originate from the cosmetics industry, which is oneof the sectors of activity that benefit highly frommicrotomography, and the third from the chemical industry,more specifically for polyurethane foam processing.
Fig. 148: Morphological evolution of the solid phase (left) andof the porosity (right) as a function of sintering time.(a) ts = 20 min., (b) ts = 120 min., (c) ts = 270 min.

HIGHLIGHTS 2001 104ESRF
Applied and Industrial Research
Imaging of SoapsDifferent kinds of soaps at different manufacturing stageswere investigated. Figure 149 shows particle distribution involume (3D rendering), with a voxel size of 1 micrometre.The aim of such an experiment was to identify the varioussoap components using quantitative information such as thelinear attenuation coefficient, and to determine their shape,number and size.
Density Mapping of HairUsing the holotomography technique [1], a study on hair wasperformed at very high resolution (pixel size: 0.33 µm).Figure 150 shows the result of 3D density mapping ofhuman hair.This figure represents a 3D rendering of the hair,which shows the medulla as a lower density area within thecortex [2].
Polyurethane Foam ProcessingThe large pixel size range (from 40 to 0.3 micrometres)available at ID19 allows complete studies in the domain offoam processing. The characterisation of foam closed-celldetails on a large scale, with good statistics is possible.Thisimplies the consecutive use of optics with a large field of
view at low resolution and a small field of view at very highresolution in the same foam. Figure 151 shows tworeconstructed slices of the same foam, using low and highresolutions, respectively.
It is clear that microtomography is well adapted to theresolution of many types of industrial problems, and it isexpected that the number of industrial experiments and therange of topics will extend over the next few years. The newexperimental hutch of the ID19 beamline, together withinstruments entirely devoted to microtomography, will allowa fast and easy access, as well as better management of thebeam time for industrial experiments.
References[1] X-ray Tomography in Material science, Eds. J. Baruchel,J.-Y. Buffière, E. Maire, P. Merle and G. Peix, Hermès Edition(2000).[2] P. Cloetens, E. Boller, W. Ludwig, J. Baruchel andM. Schlenker, Europhysics News, March/April, 46-50(2001).
AuthorE. BollerESRF
Fig. 149: 3D rendering of soap - 512*512*256 voxels (voxelsize: 0.95 µm3).
Fig. 150: 3D rendering ofhuman hair (voxel size:0.33 µm3).
Fig. 151: Reconstructed slices of the same closed-cell foam atlow (pixel size: 30 µm) and high (pixel size: 0.95 µm)resolutions.

2001 HIGHLIGHTSESRF
Applied and Industrial Research
105
Structural Defects in SiCSchottky Diodes Thanks to its excellent thermal, mechanical and electronicproperties such as large band gap and high mobility, 4Hsilicon carbide (4H-SiC) is an important semiconductor forhigh-temperature, high-power and high-frequency devices.The behaviour of SiC devices depends on the structuralquality and purity of the substrate, and on the deviceprocessing. Structural defects in SiC crystals are misorienteddomains, inclusions, macrodefects, dislocations andmicropipes [1]. X-ray topographic investigations wereperformed in order to separate and identify defects alreadypresent in the substrate and those induced during processingof Schottky diodes.
An n-type 6 µm thick epilayer with about 1016 cm-3 dopingwas grown using the CVD technique at about 1450°C on thefront side of a 35 mm 4H-SiC 8° off axis wafer, 0.5 mm thick,purchased from CREE.Titanium was deposited as Schottkymetal on top of the epilayer, and patterned, to make diodeswith surface ranging from 0.1 to 2.3 mm2.The ohmic contactwas obtained at the backside of the substrate, with a fullsheet metallisation, and subsequent annealing. Thesynchrotron topography (diffraction imaging) was performedat the ID19 and BM5 beamlines.
Structural defects were investigated, on bare wafers, afterepitaxy and after metallisation. The wafer curvature wasexamined using the so-called “zebra” pattern technique [2]. Itconsists of illuminating the crystal with a monochromaticbeam and a step by step rocking of the sample around agiven Bragg reflection peak. Due to the narrow wavelengthselected by the monochromator and the dispersive geometryused, only some regions of the crystal diffract at a fixedsample position. Figure 152 gives a typical example of the“zebra” pattern recorded on a non-processed wafer and
indicates the non-homogeneity of the structural defectdensity over the wafer and the presence of residual stresses.The radius of the curvature of the wafer is approximately 6m. The dislocation, micropipe and subgrain boundarydensities were not modified with processing. A detailedanalysis shows that Schottky process did not generate newstructural defects. On the other hand, the wafer curvaturewas modified from 6 m to 50 m after epitaxy and 11 m afterthe metallisation. The first modification is induced by anannealing phenomenon during epitaxy. The second one isdue to the residual stress after polishing the backside of thewafer.This step is necessary in order to obtain a good ohmiccontact.
Figure 153 is an optical micrograph of a whole wafer withprocessed diodes. Figure 154 shows the 000l white beamback reflection topograph of a part of the wafer. The largewhite spots correspond to micropipes. The smaller spots areelementary screw dislocations.Each processed diode can bedirectly located on the topograph due to the stress introducedby the metal contacts. Diodes with or without defects havebeen selected in order to correlate the presence of defectswith the electrical behaviour of the diodes.
Schottky diodes were tested using an HP4156Semiconductor Parameter Analyzer, by measuring I (V)
Fig. 152: “Zebra” pattern recorded on a non-processed SiCwafer (35 mm diameter), monochromatic beam withE = 18 keV used. The rotation step between consecutiveexposures was 0.005°.
Fig. 153: Optical micrograph in reflection of a SiC wafer(35 mm diameter) with Schottky diodes.
Fig. 154: White beam back reflection topograph of a part ofthe wafer shown in Figure 153.

HIGHLIGHTS 2001 106ESRF
Applied and Industrial Research
characteristics in the forward and reverse mode. Acorrelation between the presence of subgrain boundary andleakage under low reverse voltage (20 V) was established.No influence of screw dislocations or micropipes wasdetected. A more detailed characterisation is underway,involving more devices and higher reverse voltages.
References[1] R. Madar, M. Anikin, K. Chourou, M. Labeau, M. Pons,E. Blanquet, J.M. Dedulle, C. Bernard, S. Milita and J. Baruchel,Diamond and Related Materials, 6, 1249-1261 (1997).[2] S. Kikuta, K. Kohra and Y. Sugita, Jap. J. of App. Phys., 5,1047-1055 (1966).
Principal Publication and AuthorsE. Pernot (a), E. Neyret (b), C. Moulin (b), P. Pernot-Rejmánková (c), F.Templier (b), L. Di Cioccio (b), T. Billon (b)and R. Madar (a), Material Science Forum, in press.(a) LMGP-ENSPG, St Martin d’Hères (France)(b) CEA/LETI, Grenoble (France)(c) ESRF
The "Lifetime" of Defectsin Silicon after Ion-Implantation and AnnealingOne of the major issues of concern for the future sub-micrometre integrated circuit technology is the fabrication ofultra-shallow junctions (< 100 nm) by dopant ionimplantation in silicon at different energies (≤ 1 keV for B andsome keV for As) and rapid thermal processing (RTP).These junctions will be necessary for the next CMOStechnology nodes, where channel lengths of 0.13 µm in2001 and 0.09 µm in 2004 are expected (InternationalTechnology Roadmap for Semiconductors, ITRS, 2000update). In the last few years, leading companies haveproduced big efforts to construct innovative ion beamlines, inorder to support this new frontier of ion implantation. Ionbeams are now available with energies even below 1 keVand currents, high enough to ensure high wafer throughputfor dopant ions of technological interest (boron, arsenic).
Lattice point defects and their agglomerates, introduced insilicon by the implantation process, play a crucial role inseveral processes used in the fabrication of electronicdevices. Despite the immense technological interest in thesedefects, many of their properties are still unclear, due to thedifficulty of determining the atomic configuration of complexcluster structures. The expected size of the defects inducedby implants with keV energies and ion masses of B and Aslies above that of simple point-like defects and below that ofextended defects. Severe difficulties arise when the defectcomplexity increases and surface damaged layers ofthickness of the order of 10 nm have to be investigated withconventional (laboratory) experimental techniques.Therefore, we have started an intense investigation by thetechnique of grazing incidence diffuse X-ray scattering(GIDXS) of the damage introduced into Si by ionimplantation. GIDXS was chosen because of its highsensitivity to very shallow surface layers and to differentatomic defect configurations.
The GIDXS has been developed and used on boron dopantatoms implanted in silicon at higher energies (35 keV). Wehave demonstrated the strength of the method to follow thedefect transformation as a function of annealing treatments[1,2]. In essence, defect clusters consisting of B and Siinterstitials of a diameter of about 4 nm are formed afterimplantation and low temperature annealing. After RTP the
Fig. 156: Growth and dissolution of the extrinsic stacking faults as a function of annealing time at a RTP temperature of 1060°C(measurements performed at SSRL and ESRF).
Fig. 155: GIDXS reciprocal space map of the intensitydistribution close to the (220) surface reflection caused byextrinsic stacking faults on 111 planes. a) qz points along[001] and qradial along the [110] direction. The intensity alongqz is measured by a PSD (green bar).

2001 HIGHLIGHTSESRF
Applied and Industrial Research
107
clusters dissolve and the corresponding diffuse intensityclose to Bragg peaks (Huang scattering) decreasesdramatically. The boron atoms become electrically active.The surplus silicon self-interstitials are condensed inextrinsic stacking faults on 111 planes, which producecharacteristic intensity streaks along the <111> directions(Figure 155). The width of these streaks perpendicular to<111> is used to determine the size of the stacking faults,the integrated intensity is a measure of the number of self-interstitials bound in stacking faults. Depending on thetemperature of the RTP, the kinetics of growth anddissolution of the stacking faults can be monitored by GIDXSas shown in the figure for the case of 1060°C. It is clearlydemonstrated that within a short time-window of only 80seconds the stacking faults grow and disappear almostcompletely (Figure 156).
We have started a project called IMPULSE (Ion Implantationat Ultra-Low Energy for Future Semiconductor Devices),financed by the European Commission and involvingscientists from five European institutions and a company inGermany. Due to the highly brilliant beam and the multi-circle diffractometer, beamline ID1 is ideally suited to theapplication of this promising technique for the first study ofsub-keV energy implanted Si with dopants (B, As). Theresults obtained by GIDXS will be correlated with those ofMEIS and TEM and with the depth profiles of the dopantsmeasured by SIMS and SRP.
References[1] U. Beck, T.H. Metzger, J. Peisl and J.R. Patel, Appl. Phys.Lett. 76, 2698, (2000).[2] K. Nordlund, U. Beck, T.H. Metzger and J. Patel, Appl.Phys. Lett. 76, 846 (2000).
Authors T.H. Metzger (a), M. Sztucki (a) and M. Servidori (b)(a) ESRF(b) LAMEL, Bologna (Italy)
How Synchrotron Light canHelp Develop FasterComputersThe continuing drive for the production of faster electronicdevices requires technological developments in all stagesof chip manufacture. The improvement of themanufacturing process can only be effective whenappropriate metrology techniques are available formonitoring during both the development and productionphase. A key parameter for yield and reliabilitymanagement in the fabrication cycle is contaminationcontrol and consequently a wide variety of analyticaltechniques are employed to monitor the cleanliness of both
the manufacturing processes and the raw materialsinvolved. One of the most demanding structures in silicon-based transistor technology is the insulating SiO2 gateoxide which separates the transistor gate contact from theSi channel for current flow between the source and drainelectrodes. The trend towards a reduction in the lateraldimensions of transistor structures is necessarilyaccompanied by a reduction in the thicknesses of this film– the current technology uses insulating film thicknessesof as little as 25 atoms. Metallic contaminant atoms in thisoxide film can “poison” its insulating properties causingshort circuits and hence device failure.
Faced with these difficulties, device manufacturers havedeveloped sophisticated procedures to ensure thecleanliness of the wafer surfaces prior to oxide formation andother processing steps. Among the methods employed toevaluate the levels of surface contamination, total-reflectionX-ray fluorescence (TXRF) is widely used. TXRF is a non-destructive, quantitative, surface chemical analysistechnique based upon the detection of characteristic X-rayfluorescence emission from elements excited by a primaryX-ray beam incident at grazing angles on a sample. Incommon with most other X-ray fluorescence techniques, themeasurement consists of the acquisition of an X-rayspectrum (counts vs energy) using an energy-dispersivedetector. The energies of the observed peaks allow anidentification of the elements present (each element givingrise to a discrete and well-defined fluorescence signature).The intensities of the observed peaks are related to theconcentrations of the elements in the X-ray beam excitedregion. TXRF uses the phenomenon that a flat smoothsubstrate (such as a typical silicon wafer) will totally reflectan X-ray beam which impinges upon the surface at a
Fig. 157: SR-TXRF spectrum from a ultra-clean wafer usedas across calibration test between SSRL and ESRF TXRFfacilities. The Cr, Fe and Ni contaminants are in the orderof few 108 at/cm2 and the lower limit of a detection in107 at/cm2 scale.

HIGHLIGHTS 2001 108ESRF
Applied and Industrial Research
sufficiently small, “critical” angle. Under these conditionsthe beam penetration into the substrate is reduced to asurface layer of a few tens of Ångström thickness. As aconsequence, the characteristic fluorescence contributionfrom the substrate is minimised and the sensitivity to surfacelocalised elements is greatly enhanced.
Although TXRF is extensively used as an in-fab analysistool for wafer quality control and characterisation, thelimited beam intensity of conventional tube or rotatinganode based X-ray sources restricts the sensitivity of themeasurements. By coupling the TXRF technique with ahigh brightness synchrotron X-ray source, the combinationof increased beam flux, energy tunability and reducedbackground allows an improvement in the attainable
detection limits which satisfies the metrology needs for thenext generation of semiconductor devices. Figure 157shows a TXRF spectrum acquired from a 200 mm ultra-clean silicon substrate at the ID27 TXRF facility whichprovides an analytical service for contamination control forindustrial users. The detected contamination levels are ofthe order of 108 atoms/cm2 and the spectra indicate aminimum detection limit for the transition elements of a fewseveral 107atoms/cm2: equivalent to a number ofcontaminant atoms of a few hundredths of a millionth of asilicon monolayer!
AuthorsR. Barrett and F. CominESRF

2001 HIGHLIGHTSESRF109
Exploiting the full potential of the ESRFstorage ring sources remains a permanentchallenge for the experimentalist. Theoptics used today to adapt the X-ray beamproperties to the experiments are notalways of the quality needed to reach thediffraction limit. For example, the spot sizeproduced by focusing elements such ascurved mirrors is still about an order ofmagnitude above the theoretically possiblelimit, situated at about 50 nanometres. Thedetector can also severely reduce the dataflux compared to what could be reached inan ideal situation, in particular whenrecording two-dimensional images. Effortsare required to improve the performance ofthe instrumentation, both before and afterthe sample, so that our Users will be in aeven better position to carry outoutstanding experiments. Diversification ofboth optical elements and detectors isneeded to better match the beamproperties to the experiment and thusoptimise the resolution-flux-count ratechain.
The present chapter reports on severaltechnical developments that go along theselines: to improve the experiments andincrease their scope by providing betterperformance and more diverse choices.We begin with “simple” slit systems, wherenew “clean” slits have been developed thatdo not create artefacts by blade roughnessand that are compatible with thecoherence properties of the X-ray beams.Once its cross-section is well defined, thebeam must be further conditioned and inmany cases focused to very smalldimensions, often below a micrometre, inorder to assess structural information onthe mesoscopic scale. This can be done byseveral methods according to the specificexperimental technique employed.A beautiful example of a micro-focusingexperiment is the microcrystallographicstudy of samples of historical interestusing a recently developed X-ray waveguidethat compresses the beam down to0.1 micrometres. The vertical aperture ofthis one-dimensional beam condenser is,however, quite small and therefore focusingelements accepting wider beams and ableto focusing in two dimensions must be

HIGHLIGHTS 2001 110ESRF
Methods and Instrumentation
available. A well-known system is thedouble-focusing Kirkpatrick-Baez (KB)mirror device where two curved substrates,coated either by a single metallic layer orby a stack of multilayers, concentrate thebeam to a very small spot. The focusingefficiency depends on the quality, i.e.roughness and figure of the mirrors ormultilayers. Here substantial progress hasbeen achieved recently and the fabricationof several KB systems is envisaged.
Focusing can also be produced by singlecrystals, which, in addition to focusing,select a narrow bandwidth out of a whitebeam. Usually the crystals must be bent todo so, but the clever use of refractioneffects that always occur at single crystaldiffraction, allows us to create a convergingbeam. This very recent and novel techniquehas the obvious advantage that no complexand accurate mechanical structures areneeded for bending. It appears that it alsoprovides some energy tunability. It is veryunlikely that focal dimensions smaller thanabout 10 micrometres can be reached, butthis is sufficient for many applications.With respect to more flexibility, thedevelopment of “tailored” multilayers witha very wide or a narrow spectral windowwill allow the user to choose between morepossibilities and thus to find a bettercompromise between resolution andintensity.
Finally, in the last contribution to thischapter the most recent state-of-the-art ofdetector performance and development atthe ESRF is described presenting impressiveachievements and perspectives in this veryimportant field of synchrotroninstrumentation.
Coherent Diffraction by SlitsHigh-brilliance third-generation synchrotron sources provideintense beams of sizes down to less than 10 µm. Highangular resolution and small beam sizes need to becombined when micrometre scale objects are probed, aswell as in ultra SAXS or in coherent scattering experiments.The beam size ∆x and the resolution ∆q are, however,restricted by the diffraction limit: ∆x ∆q > 1/2. If slits are to beused to reduce the beamsize, it is a challenging task toobtain well-defined beams for small apertures, since inaddition to strong diffraction phenomena, slits may causeintense parasitic streaks when the aperture has the samesize as the typical length-scale of the surface roughness ofthe slit blades.
We have developed slits using polished cylinders to reducethe roughness. The performance of such a slit systemdepends on the radius and the material of the cylinders:either the incident photons are totally reflected from thecylinder of radius R (for incident angles αi < αc) or they areabsorbed by them (for αi > αc), provided that the penetrationlength µ-1 is small enough (µ-1 << 2Rαc). At 8 keV radiation,this is readily accomplished by molybdenum cylinders with aradius R = 1 mm [1]. A typical result obtained on ID1 inconditions of coherence is shown in Figure 158 with a2 µm x 2 µm aperture. The diffraction pattern showsFraunhofer interference fringes with a high contrast. Cross-terms of interference are also visible. The asymmetry of thediffraction pattern is explained by the intrinsic asymmetry ofthe slit, which can be determined quantitatively by analyticalcalculations [1,2].
In Figure 158, a strong background is observed due to slitdiffraction. For SAXS experiments this strong scatteringneeds to be further reduced by inserting a “guard slit”between pinhole and sample, the configuration of which is
Fig. 158: Diffraction pattern of two crossed slits made ofpolished molybdenum cylinders.

obviously dictated by two limiting cases: while closing theguard slits to the size of the pinhole aperture, they willdevelop their own diffraction pattern and opening them canonly be done to an extent where they still reduce thediffraction of the aperture pinhole significantly. Moreover, therelative position of pinhole, guard slits and sample needs tobe optimised. A too small distance between pinhole andguard slits is inefficient to reduce the background to signalratio. On the other hand, it cannot be too large because ofthe front wave propagation. It can be shown [1] that for highresolution experiments, the guard slit has to be located closeto the sample and at Λ = a2/2*λ from the pinhole (a is theaperture).
2001 HIGHLIGHTSESRF
Methods and Instrumentation
111
From diffraction theory one can estimate that the diffractedintensity of two successive slits, though strongly reduced,still decays with a q-2 dependence perpendicular to thebeam. For a more precise calculation, numerical simulationshave been performed [1], which result in a minimum of theparasitically diffracted intensity as a function of the slitopening (Figure 159). For a 10 µm pinhole at 8 keV forexample, the slit diffraction can be reduced by more than twoorders of magnitude for the guard slit closed to 27 µm andlocated a2/2*λ = 40 cm downstream. The experimental testof this prediction is displayed in Figure 160. It confirms thata well-chosen setting of two cylindrical slits permits thepreparation of a well-defined primary X-ray beam with apeak to background ratio larger than 2 x 10⁴.
References[1] D. le Bolloc’h, F. Livet et al., Submitted to J. SynchrotronRad.[2] E. Vieg, S.A. De Vries, J. Alvarez and S. Ferrer, J.Synchrotron Rad. 4 210 (1997).
AuthorsD. Le Bolloc’h (a,b), F. Livet (c), T. Schulli (a), F. Bley (c),H.T. Metzger (a) and M. Veron (c)(a) ESRF(b) Present address: Laboratoire de Physique des Solides,Orsay (France)(c) LTPCM-ENSEEG, UMR-CNRS/INPG/UJF BP75, SaintMartin d’Hères (France)
Microcrystallography withan X-ray WaveguideX-ray microdiffraction experiments on the micrometre scaleare now routinely performed at third-generation synchrotronradiation sources, such as ESRF [1]. With this in situtechnique, samples can be scanned with microscopicpositional resolution. There is growing interest in achievingeven smaller beam sizes in the sub-micrometre range inorder to investigate structural details on mesoscopic lengthscales, i.e., between microscopic (micrometres) and atomicdistances (nanometres). Examples include biomaterials,polymers and phase analysis in inhomogeneous mixtures(see below).
X-ray waveguide optics is a promising approach for sub-micrometre crystallography. These devices have beenshown to provide beams of 0.1 µm in one dimension [2].Thewaveguide used in the present study has a Mo/C/Mosandwich structure with a carbon spacer of 80 nm. Radiationtransport in the waveguide takes place through the lightelement layer by total reflection at the opposing metalliclayers. The experiment was carried out on ID13, theMicrofocus Beamline, at an energy of 13 keV. A gradedmultilayer mirror was used to focus the beam horizontally to
Fig. 159: Calculated background for a 10 µm pinhole forvarious apertures of the guard slit located 40 cm downstream.A clear background minimum appears for a 27 µm optimalaperture.
Fig. 160: Primary beam intensity on a log scale obtained byusing the experimental setup described in the text. The directillumination CCD camera (pixel size: 22 µm) is located at1.75 m from the guard slit. The primary beam has a maximumintensity of 2 x 10⁴ cps and covers 3 pixels only.

HIGHLIGHTS 2001 112ESRF
Methods and Instrumentation
3 µm while the waveguide focussed the beam to 0.1 µm inthe vertical direction. The flux at the sample position is109 photons/s in the 0.1 x 3 µm2 spot at a storage ringcurrent of 200 mA.The scanning setup developed at ID13 isshown in Figure 161. Two video microscopes allow forprecise sample alignment. A three-axis piezo translationstage enables positioning and scanning of the sample withbetter than 0.1 µm repeatability.
When compared with standard experiments using largebeam sizes, X-ray microdiffraction on phase mixtures cangive more interesting and informative results. A roughclassification of the expected scattering patterns is possibleby comparing the beam size (S) with the size of thecoherently scattering object (L):
1. L > S means single crystal diffraction with only a few spotson the detector.2. For L ≈ S one expects the presence of spikes on theDebye-Scherrer (powder) rings.3. L < S implies powder rings.
As an example for all of these cases, we chose a grain fromthe handle of a Koan transport amphora used duringthe period 300 BC to 100 AD. It shows a complex phasemixture, which is typical for ceramics samples.The scanningelectron microscope (SEM) image (Figure 162a) suggestscompositional changes on different length scales.Correspondingly, the diffraction pattern (transformed to polarcoordinates, Figure 162b) shows that the size of coherentlyscattering objects varies considerably. Spikes are anindication for scattering objects of the same size as thebeam (case 2); weaker continuous lines below the spikessuggest the presence of fine powder grains (case 3); inaddition, strong reflections from larger single crystallites areobserved (case 1).
The two averaged powder patterns shown in Figure 162cwere collected at sample positions that are 17 µm apart.Thecalculated positions of reflections suggest the presence ofmagnesian calcite, diopside and quartz. The strong 101quartz reflection (red curve of Figure 162c) is clearly visibleas a prominent single crystal reflection (Figures 162b and162d). The present data demonstrates that with sub-micrometre beam sizes the signals from small amounts of arare component can be detected and discriminated againstthe strong contributions of quartz or calcite.
References[1] C. Riekel, Rep. Prog. Phys., 63, 233-262 (2000).[2] A. Cedola, S. Lagomarsino, S. Di Fonzo, W. Jark,C. Riekel and P. Deschamps, J. Synchrotron Rad., 5, 17-22(1998).
Principal Publication and AuthorsM. Müller (a,b), M. Burghammer (a), D. Flot (a), C. Riekel (a),C. Morawe (a), B. Murphy (c,b) and A. Cedola (d), J. Appl.Cryst., 33, 1231-1240 (2000).
(a) ESRF(b) now at: Institut für Experimentelle undAngewandte Physik, Universität Kiel(Germany)(c) Daresbury Laboratory, Warrington(UK)(d) Instituto di Elettronica dello StatoSolido, Roma (Italy)
Fig. 161: Schematic view of the sub-micrometre scanningsetup on ID13 with combined mirror and waveguide optics.
Fig. 162: SEM and X-ray microcrystallography results fora grain from the handle of a Koan transport amphora.

2001 HIGHLIGHTSESRF
Methods and Instrumentation
113
Kirkpatrick-Baez Optics forSub-Micrometre FocusingMicroanalysis covers an important area of research withsynchrotron radiation. Its applications require the highestpossible spatial resolution.The small source size (a few tensof micrometres) and low divergence (a few tens of micro-radians) of the X-ray beams produced by the ESRF storagering provide excellent starting conditions to create smallbeams. Still high-performance X-ray optics are needed todemagnify the source by focusing it onto the sample understudy. Many optical devices have been developed toconcentrate X-ray beams to very small spots, sometimeseven smaller than 100 nanometres.
Focusing methods based on reflection by curved surfacescoated with a single layer (mirror) or a stack of many layers(multilayer) present a number of advantages such as highirradiance gain, wide energy range, large acceptance, evenat high energy with high efficiency. Here we want to reporton a crossed mirror system that has been developed at the
ESRF. It is based on the so-called Kirkpatrick-Baez (KB)design. Two orthogonal coated silicon substrates are bentinto elliptical shapes by mechanisms based on flexurehinges. This device provides both very high accuracy andflexibility. It uses precise motors to tune the substrate shapeto the experimental conditions such as focal distance andenergy. Eight degrees of freedom are needed for alignmentand focusing. The length of the substrates of the systemsdeveloped ranges from 92 to 300 mm.The surface quality ofthe substrates and the reading accuracies have to be veryhigh. Typically, the final shape can be obtained to within afew nanometres. Novel figuring techniques will allow us toachieve a shape accuracy around 1 nanometre and maybeeven below [1].
Figure 163 shows a specific setup studied on beamlineID19. At about 140 m from the source the dimensions of themonochromatic beam of 19 keV energy were defined byprecise slits 0.2 mm x 0.25 mm wide. This beam was firstreflected by a 170 mm long vertically focusing platinumcoated mirror set at 3 milliradian grazing incidence. Then itwas focused horizontally onto the sample by the 96 mm longsecond mirror. An X-ray sensitive CCD camera was used forcomputer-aided alignment of the mirrors with respect to thebeam. A linear wavefront optimisation technique [2] servedto shape the mirrors correctly. A 43 µm wide platinum stripedeposited on a polished silicon substrate set at a glancingangle of 2.8 milliradian was used as a very narrow reflectivepseudo-slit, 0.12 µm wide, and scanned across the focus.The measured full widths at half maximum (FWHM) were0.2 µm horizontal and 0.6 µm vertical (see Figure 164).These values were bigger than both the ideal source imageand the diffraction-limited spot sizes of 48 by 65nanometres. Vibrations were clearly identified as a majorcontribution to blurring.The irradiance gain was estimated to3.5 x 105.Fig. 163: Microfocusing Kirkpatrick-Baez setup.
Fig. 164: Vertical and horizontal scans through the focus by a 0.12 micrometre width reflective slit. Inset: projection image of a goldgrating with minimum periods of 300 nm.
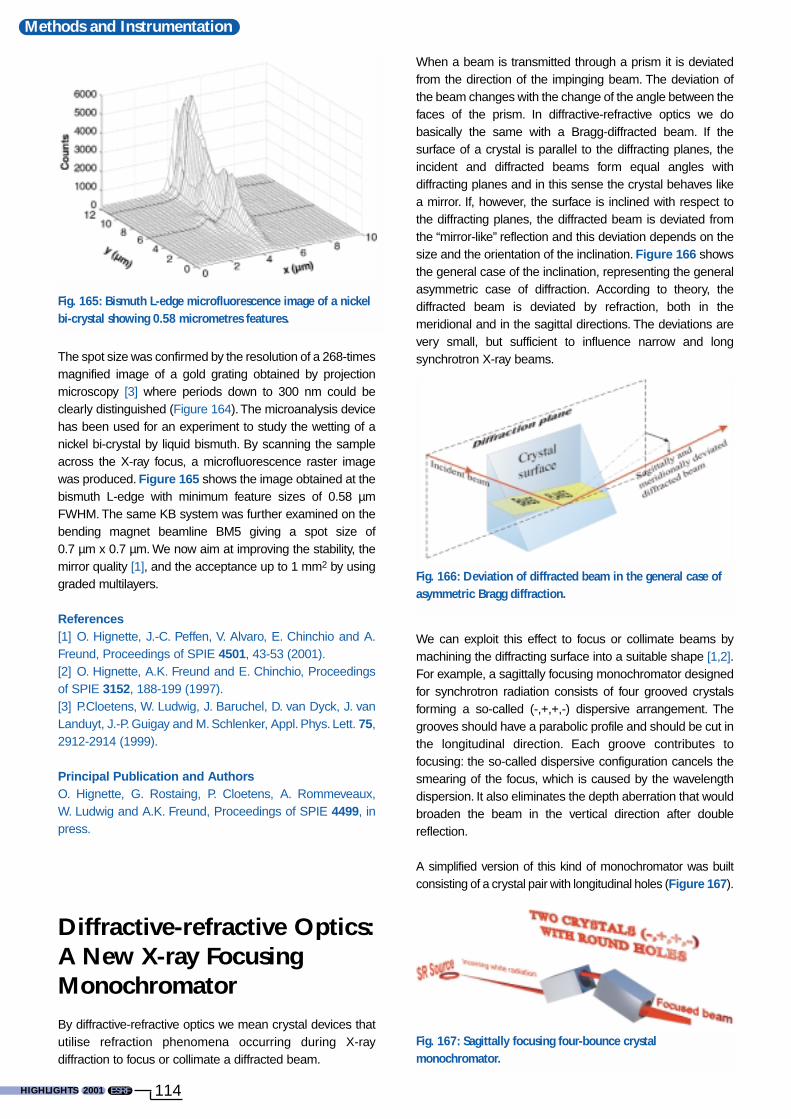
HIGHLIGHTS 2001 114ESRF
Methods and Instrumentation
The spot size was confirmed by the resolution of a 268-timesmagnified image of a gold grating obtained by projectionmicroscopy [3] where periods down to 300 nm could beclearly distinguished (Figure 164).The microanalysis devicehas been used for an experiment to study the wetting of anickel bi-crystal by liquid bismuth. By scanning the sampleacross the X-ray focus, a microfluorescence raster imagewas produced. Figure 165 shows the image obtained at thebismuth L-edge with minimum feature sizes of 0.58 µmFWHM. The same KB system was further examined on thebending magnet beamline BM5 giving a spot size of0.7 µm x 0.7 µm. We now aim at improving the stability, themirror quality [1], and the acceptance up to 1 mm2 by usinggraded multilayers.
References[1] O. Hignette, J.-C. Peffen, V. Alvaro, E. Chinchio and A.Freund, Proceedings of SPIE 4501, 43-53 (2001).[2] O. Hignette, A.K. Freund and E. Chinchio, Proceedingsof SPIE 3152, 188-199 (1997).[3] P.Cloetens, W. Ludwig, J. Baruchel, D. van Dyck, J. vanLanduyt, J.-P. Guigay and M. Schlenker, Appl. Phys. Lett. 75,2912-2914 (1999).
Principal Publication and AuthorsO. Hignette, G. Rostaing, P. Cloetens, A. Rommeveaux,W. Ludwig and A.K. Freund, Proceedings of SPIE 4499, inpress.
Diffractive-refractive Optics:A New X-ray FocusingMonochromatorBy diffractive-refractive optics we mean crystal devices thatutilise refraction phenomena occurring during X-raydiffraction to focus or collimate a diffracted beam.
When a beam is transmitted through a prism it is deviatedfrom the direction of the impinging beam. The deviation ofthe beam changes with the change of the angle between thefaces of the prism. In diffractive-refractive optics we dobasically the same with a Bragg-diffracted beam. If thesurface of a crystal is parallel to the diffracting planes, theincident and diffracted beams form equal angles withdiffracting planes and in this sense the crystal behaves likea mirror. If, however, the surface is inclined with respect tothe diffracting planes, the diffracted beam is deviated fromthe “mirror-like” reflection and this deviation depends on thesize and the orientation of the inclination. Figure 166 showsthe general case of the inclination, representing the generalasymmetric case of diffraction. According to theory, thediffracted beam is deviated by refraction, both in themeridional and in the sagittal directions. The deviations arevery small, but sufficient to influence narrow and longsynchrotron X-ray beams.
We can exploit this effect to focus or collimate beams bymachining the diffracting surface into a suitable shape [1,2].For example, a sagittally focusing monochromator designedfor synchrotron radiation consists of four grooved crystalsforming a so-called (-,+,+,-) dispersive arrangement. Thegrooves should have a parabolic profile and should be cut inthe longitudinal direction. Each groove contributes tofocusing: the so-called dispersive configuration cancels thesmearing of the focus, which is caused by the wavelengthdispersion. It also eliminates the depth aberration that wouldbroaden the beam in the vertical direction after doublereflection.
A simplified version of this kind of monochromator was builtconsisting of a crystal pair with longitudinal holes (Figure 167).
Fig. 165: Bismuth L-edge microfluorescence image of a nickelbi-crystal showing 0.58 micrometres features.
Fig. 166: Deviation of diffracted beam in the general case ofasymmetric Bragg diffraction.
Fig. 167: Sagittally focusing four-bounce crystalmonochromator.

2001 HIGHLIGHTSESRF
Methods and Instrumentation
115
The X-rays are diffracted twice inside each channel-cut hole.In this case, the parabolic shape of the diffracting surface isreplaced by a circular one, which does create a smallaberration. Fortunately, this drawback is compensated by thesimplicity of the device.We have clearly demonstrated at boththe ESRF and the APS that this scheme works – even for along focusing distance of 20 m. Figure 168a shows theimage of an 8 keV X-ray beam diffracted by the sagittallyfocusing monochromator using Si(111) crystals with an indexof asymmetry of 18.2 and a hole diameter of 4.5 mm. Theimage was taken close to the monochromator, and the beamsize was 3.2 mm. Figure 168b shows the focus at thefocusing distance of 2 m. The size of the focus was 140micrometres.
Our experiments show that with this method it is possible toreach a focal width of several hundreds of micrometreswithout any special treatment of the diffracting surface.These focusing monochromators are simple and compact,their focusing distance remains practically constant within acertain energy range. Due to the dispersive four-bounceconfiguration, they also keep the position of the exit beamfixed.
References[1] J. Hrdy, J. Synchrotron Rad., 5, 1206 (1998).[2] J. Hrdy and J. Hrdá, J. Synchrotron Rad., 7, 78 (2000).
Principal Publications and AuthorsJ. Hrdy (a), N. Artemiev (a), A. Freund (b) and J. Quintana(c), Proc. SPIE 4501, 88-98 (2001).(a) Institute of Physics ASCR (Czech Republic)(b) ESRF(c) APS (USA)
Tailored Multilayers: Narrowor Wide BandpassTypical multilayers used as optical elements at third-generation synchrotrons provide a spectral bandwidth of 1 to5%. During the past year, the ESRF multilayer laboratoryhas developed new types of multilayer structures to extendthe range of energy resolution to higher as well as to lowervalues.
To obtain narrow bandpass multilayers it is necessary toincrease the number of layers contributing to a Braggreflection. This can be achieved by using materials of lowabsorption and low optical contrast at the given photonenergy. From the variety of available systems we havechosen Al2O3/B4C multilayers [1] that fulfil the aboverequirements for a wide energy range and that also allowsmooth layer growth with low interface roughness. Al2O3/B4Csamples containing up to 800 layer pairs were characterisedon a high-resolution reflectometer installed on BM5, theOptics beamline. We obtained a spectral bandwidth of only0.27 % (see Figure 169) with a reasonable peak reflectivityof about 35 %. However, residual errors in the stack affect theperformance and a further work will be necessary to improvethe sample quality. Here, extremely stable depositionparameters are mandatory.
A different approach has been applied to fabricate widebandpass multilayers. In this case, depth-graded structuresare required to fulfil the Bragg condition either for fixedenergy and varying angles or vice versa.The key problem isto find the vertical layer composition profile that will producea given reflectivity profile. We have based our study ontheoretical work done by Kozhevnikov et. al. [2] who used acombination of an analytical approximation followed by anumerical fit calculation to obtain the required sequence oflayers. As a first example, we have designed a multilayerproviding a constant reflectivity of about 20% at 8048 eV
a) b)
Fig. 168: a) Image of a beam recorded close to the exit of thefocusing monochromator; b) Image of the same beamrecorded at the focusing distance of 2 m after themonochromator.
Fig. 169: Spectral bandwidth of a [Al2O3/B4C]680 multilayermeasured at 12 keV as compared to that of a conventional[Ru/B4C]80 multilayer.
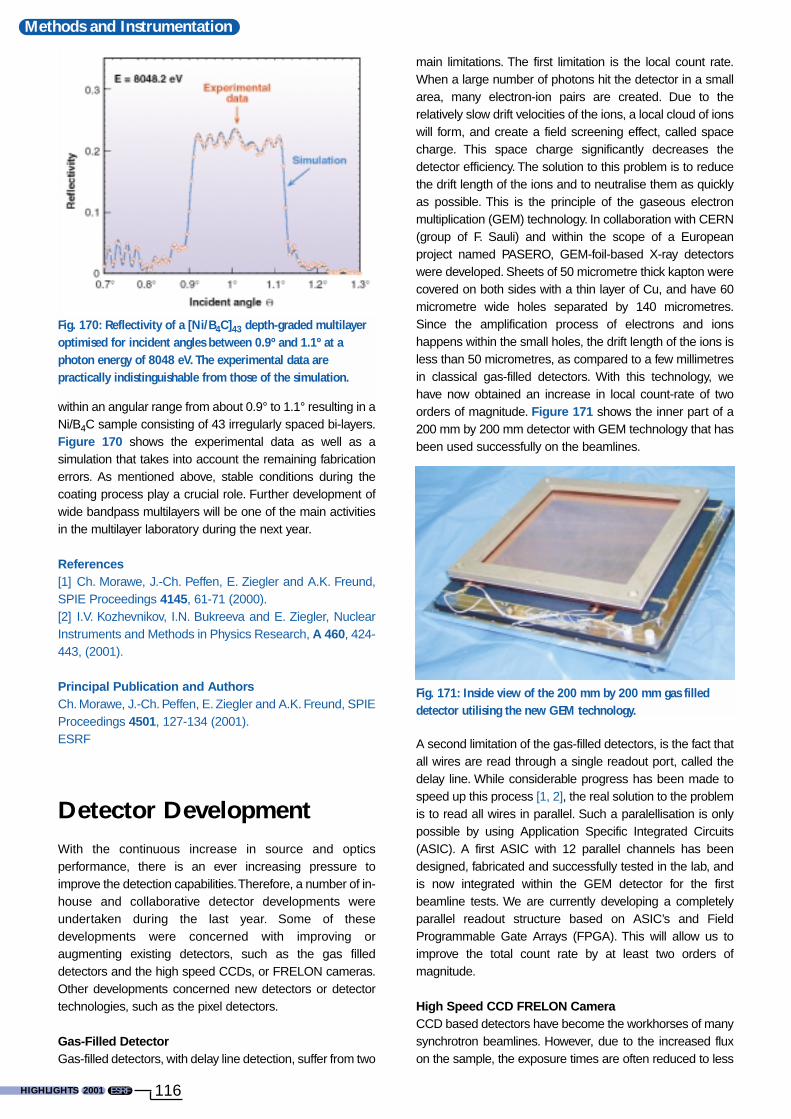
HIGHLIGHTS 2001 116ESRF
Methods and Instrumentation
within an angular range from about 0.9° to 1.1° resulting in aNi/B4C sample consisting of 43 irregularly spaced bi-layers.Figure 170 shows the experimental data as well as asimulation that takes into account the remaining fabricationerrors. As mentioned above, stable conditions during thecoating process play a crucial role. Further development ofwide bandpass multilayers will be one of the main activitiesin the multilayer laboratory during the next year.
References[1] Ch. Morawe, J.-Ch. Peffen, E. Ziegler and A.K. Freund,SPIE Proceedings 4145, 61-71 (2000).[2] I.V. Kozhevnikov, I.N. Bukreeva and E. Ziegler, NuclearInstruments and Methods in Physics Research, A 460, 424-443, (2001).
Principal Publication and AuthorsCh. Morawe, J.-Ch. Peffen, E. Ziegler and A.K. Freund, SPIEProceedings 4501, 127-134 (2001).ESRF
Detector DevelopmentWith the continuous increase in source and opticsperformance, there is an ever increasing pressure toimprove the detection capabilities.Therefore, a number of in-house and collaborative detector developments wereundertaken during the last year. Some of thesedevelopments were concerned with improving oraugmenting existing detectors, such as the gas filleddetectors and the high speed CCDs, or FRELON cameras.Other developments concerned new detectors or detectortechnologies, such as the pixel detectors.
Gas-Filled DetectorGas-filled detectors, with delay line detection, suffer from two
main limitations. The first limitation is the local count rate.When a large number of photons hit the detector in a smallarea, many electron-ion pairs are created. Due to therelatively slow drift velocities of the ions, a local cloud of ionswill form, and create a field screening effect, called spacecharge. This space charge significantly decreases thedetector efficiency. The solution to this problem is to reducethe drift length of the ions and to neutralise them as quicklyas possible. This is the principle of the gaseous electronmultiplication (GEM) technology. In collaboration with CERN(group of F. Sauli) and within the scope of a Europeanproject named PASERO, GEM-foil-based X-ray detectorswere developed. Sheets of 50 micrometre thick kapton werecovered on both sides with a thin layer of Cu, and have 60micrometre wide holes separated by 140 micrometres.Since the amplification process of electrons and ionshappens within the small holes, the drift length of the ions isless than 50 micrometres, as compared to a few millimetresin classical gas-filled detectors. With this technology, wehave now obtained an increase in local count-rate of twoorders of magnitude. Figure 171 shows the inner part of a200 mm by 200 mm detector with GEM technology that hasbeen used successfully on the beamlines.
A second limitation of the gas-filled detectors, is the fact thatall wires are read through a single readout port, called thedelay line. While considerable progress has been made tospeed up this process [1, 2], the real solution to the problemis to read all wires in parallel. Such a paralellisation is onlypossible by using Application Specific Integrated Circuits(ASIC). A first ASIC with 12 parallel channels has beendesigned, fabricated and successfully tested in the lab, andis now integrated within the GEM detector for the firstbeamline tests. We are currently developing a completelyparallel readout structure based on ASIC’s and FieldProgrammable Gate Arrays (FPGA). This will allow us toimprove the total count rate by at least two orders ofmagnitude.
High Speed CCD FRELON CameraCCD based detectors have become the workhorses of manysynchrotron beamlines. However, due to the increased fluxon the sample, the exposure times are often reduced to less
Fig. 170: Reflectivity of a [Ni/B4C]43 depth-graded multilayeroptimised for incident angles between 0.9º and 1.1º at aphoton energy of 8048 eV. The experimental data arepractically indistinguishable from those of the simulation.
Fig. 171: Inside view of the 200 mm by 200 mm gas filleddetector utilising the new GEM technology.

2001 HIGHLIGHTSESRF
Methods and Instrumentation
117
than a second, whereas CCD readout times are typically afew seconds. To eliminate this mismatch, the ESRF hasdeveloped a Fast Readout Low Noise CCD camera, calledFRELON. This camera has been used successfully onseveral beamlines for a number of years. To increase thespeed, a 2000 x 2000 pixel version and a streaking mode ofoperation has been developed this year. In this mode only afew lines of the CCD are used for exposure and the rest ofthe lines serve as buffers.The streaking mode has been usedsuccessfully at ID17, the medical beamline. Furthermore,one camera has been coupled to a fibre optic taper, giving a95 x 95 mm2 input field and a spatial resolution of 110 µm (fullwidth at half maximum). It features an interchangeablephosphor mount for easy adaptation to various energies andresolutions. A picture of the fibre optic coupled camera isgiven in Figure 172.
Pixel DetectorsSince August 2000, the ESRF has been a partner of theMedipix-2 collaboration. This is a collaboration of 15European laboratories co-ordinated by CERN. Its goal is toproduce a readout chip (ASIC) with 256 x 256 pixels of55 µm pitch, as well as complete photon-counting pixeldetector assemblies. Photon-counting pixel detectorsdistinguish themselves from CCD detectors by the fact thatevery pixel has its own data acquisition and processingelectronics (amplifier, discriminator, counter). Since it is acounting detector, it has a certain energy resolution.Therefore, one can discriminate between X-ray signals andelectronic noise and so virtually eliminate the noise.
Several beamline tests have already been done using thecurrent chip version (Medipix-1 [3]) with 64 x 64 square pixelsof 170 µm pitch bonded to a pixellated silicon sensor. Thedetector easily discriminates 8 keV X-rays from noise counts,as illustrated in Figure 173, and provides significantadvantages in terms of spatial resolution and dynamic rangewhen comparing with state-of-the-art CCD-based detectors.Figure 174 shows a small-angle scattering pattern obtainedat ID10, showing an intensity range extending over fiveorders of magnitude above background. Another distinctadvantage of the pixel detector is its possibility of fastreadout. We have achieved acquisition rates of 100 Hz withthe Medipix-1 chip at BM5 [4].
These results show that photon-counting pixel detectorshave now reached an operational state, with performancessurpassing those of current area detector systems.
References [1] C. Herve, Nucl. Instr. and Meth. A, Accepted forpublication.[2] M.Kocsis, Nucl. Instr. and Meth. A 471, 103-108 (2001).[3] M. Campbell et al., IEEE Transactions on NuclearScience, 45, 751-753 (1998).[4] C. Ponchut et al., Submitted to Nucl. Instr. and Meth. A.
AuthorsH. Graafsma, M. Kocsis, C. Ponchut, C. Hervé andJ.C. LabicheESRF
Fig. 172: FRELON 2000 x 2000 pixel camera coupled to a95 mm by 95 mm input fibre optic taper.
Fig. 173: Threshold scan of a MEDIPIX-1 assembly at ID10.The solid line gives the number of counts above a certainenergy. The dash-dotted line is the derivative of the solid lineand gives the number of counts at a certain energy.The 8.12 keV X-ray peak is clearly separated from theelectronic noise. The energy resolution, ∆E/E, is 23%.
Fig. 174: SAXS pattern of a SiO2 colloidal solution at 8.12 keVenergy. The exposure time is 100 seconds. Only a few non-counting pixels (the black ones) can be seen.

HIGHLIGHTS 2001 118ESRF
The X-ray Source

2001 HIGHLIGHTSESRF
The X-ray Source
119
The lifetime, bunch length and energy spread depend on thefilling pattern. They are given in Table 6 for a fewrepresentative filling patterns. Note that in both the 16 bunchand single bunch modes, the energy spread and bunchlength decay with the current, the value indicated in the tablecorresponding to the maximum current. The bunch lengthsare given for the usual RF accelerating voltage of 8 MV.
Filling pattern Uniform 16-bunch SinglebunchMaximum current [mA] 200 90 20Lifetime [h] 75 9 6Rms energy spread [%] 0.11 0.12 0.22Rms bunch length [ps] 20 48 73
Table 6: Current, lifetime, bunch length and energy spread invarious representative filling modes.
Summary of MachineOperationThe year 2000 was already a year in which records ofavailability and mean time between failures (MTBF) wereset. In 2001, once again, these records were surpassed. Atotal of 675 shifts (5400 hours) were scheduled for beamdelivery to the Users. Nine more shifts (72 hours) werededicated to radiation tests or personnel safety systemchecks. Out of these 5400 scheduled hours for user servicemode (USM), 5224 hours were actually delivered, whichrepresents a record of availability of 96.8 % (compared to96.4 % in 2000). The remaining hours are spread betweenthe unavoidable dead time for refills: 76.6 hours for 532 refills(i.e., 1.4 % of the USM time) and the time taken up byfailures: 98.2 hours (i.e. 1.8 % of USM time) for 117 beaminterruptions. This gives a new record mean time betweenfailures (MTBF) of 46.1 hours (compared to 38 hours in2000). It is worth highlighting that these results, and inparticular these low failure rates, are exceptional in the worldof X-ray sources! The figures are presented in more detail inTable 7.
Introduction Throughout 2001, the Machine Division continued its effortsto improve the performance of the X-ray source andundertook a number of new developments that aredescribed in this section.
Machine ParametersTable 4 presents a summary of the characteristics of theelectron beam of the storage ring.
Energy [GeV] 6.03Maximum Current [mA] 200Horizontal emittance [nm] 4Vertical emittance(*minimum achieved) [nm] 0.025 (0.010*)Coupling (*minimum achieved) [%] 0.6 (0.25*)Revolution frequency [kHz] 355Number of bunches 1 to 992Time between bunches [ns] 2816 to 2.82
Table 4: Main global parameters of the electron beam.
Table 5 gives the main optics functions, electron beam sizesand divergences, at the various source points. For insertiondevice source points, the beta functions, dispersion, sizesand divergences are computed in the middle of the straightsection. Two representative source points of bendingmagnet radiation have been selected corresponding to anangle of observation of 3 mrad (9 mrad) from the exit, theycorrespond to different fields. Electron beam profiles areGaussian and the size and divergence are presented interms of rms quantities. The associated fwhm sizes anddivergences are 2.35 larger. Beam sizes and divergencesare given for the uniform filling modes and apply to almost allfilling patterns, except the single bunch for which a slightlylarger size and divergence is reached due to the increasedenergy spread of the electron beam.
Even ID Section Odd ID Section Bending Magnet Bending Magnet (ID2,ID6…) (ID1,ID3 …) 3 mrad 9 mrad
Field [T] Depends on ID Depends on ID 0.4 0.85
Horiz. Beta Functions [m] 35.2 0.5 1.41 0.99Horiz. Dispersion [m] 0.137 0.037 0.061 0.045Horiz. rms e- beam size [µm ] 402 59 100 77Horiz rms e- divergence [µrad] 10.7 90 116 111
Vert. Beta Functions [m] 2.52 2.73 34.9 34.9Vert. rms e- beam size [µm ] 7.9 8.3 29.5 29.5Vert. rms e- divergence [µrad] 3.2 3 0.85 0.85
Table 5: Beta functions, dispersion, rms beam sizes and divergences for the various source points.

HIGHLIGHTS 2001 120ESRF
The X-ray Source
Filling PatternsThe major difference noted for the year 2001 whencompared to 2000 is the greater demand for uniform fillingmode. This mode, first delivered in 2000 at a rate of 3%, isnow delivered at the same rate as for the 2 * 1/3 filling, i.e.,a share of 30-35% for each of these 2 modes.The remaining35% is shared between the 16 bunch, the single bunch andthe hybrid 1 modes (Figure 175).The main advantage of theuniform filling mode is a long lifetime, greater than 75 hoursat 200 mA hence reducing the heat stroke on the Users’monochromators during the refilling of the storage ring. Inaddition, it makes better use of the limited dynamic range ofthe X-ray detectors.
Fig. 175: Distribution of the filling modes during the year2001.
Nonlinear Optics StudiesTouschek scattering can have a detrimental effect on lifetimeof the electron beam, even for a high-energy ring like theESRF. In particular, Touschek lifetime is critical for time-structured modes of operation (single bunch, 16-bunch). Itcan be minimised by achieving a large momentumacceptance.
For a long time, the comparison between experimental off-momentum lattice characteristics (orbit, tunes, ß-functions,synchrotron frequency…) and predictions from trackingsoftware had shown significant discrepancies at large ∆p/p
values. Several effects have been investigated to account forthis divergence:- Tracking: off-momentum tracking always implies someapproximations in the description of elements. Howeversimilar results are obtained from different tracking software(BETA, MAD…).- Non-linear effects due to higher-order field components ofmagnetic elements: even a significant scaling of themeasured multipolar components does not remove thediscrepancy.- Approximation of the thin sextupoles by a single thin lensor by a succession of thin lenses. Given the variation of ß-functions along sextupoles, this turns out to be the mostsignificant effect.
Starting from this revised description of the optics, a newsextupole model has been established that relates sextupolestrengths and currents. It results from a global fit on allsextupoles to minimise the differences between measuredand predicted tune shifts with energy over a wide range of∆p/p values and a large number of sextupole settings. Thevery non-linear, off-momentum behaviour of the lattice isnow well reproduced in simulations, as illustrated inFigure 176. This gives us confidence in the fact that themodel may be used for pursuing the optimisation of theenergy acceptance of the machine.
Fig. 176: Comparison of measured (plain) and predicted(dashed) tune shifts with energy.
RUN NUMBER TOTAL 2001-01 2001-02 2001-03 2001-04 2001-05 TOTAL2000 2001
Start 19/01/01 16/03/01 18/05/01 17/08/01 19/10/01
End 07/03/01 09/05/01 25/07/01 10/10/01 17/12/01
Total number of shifts 870 141 161.875 204 162 177 845.9
Number of USM shifs 694 105.9 130.875 165.0 132.0 141.1 674.9
Beam available for users (h) 5351.7 821.4 1032.0 1273.4 1014.7 1083.1 5224.6
Beam availability 96,4 % 97.0 % 98.6 % 96.5 % 96.1 % 95.9 % 96.8 %
Dead time for failures 2.5 % 1.8 % 0.8 % 2.0 % 2.5 % 2.6 % 1.9 %
Dead time for refills 1.1 % 1.2 % 0.6 % 1.5 % 1.4 % 1.5 % 1.3 %
Average intensity (mA) 143 145 184 138 160 101 144.8
Number of failures 146 23 15 29 29 21 117.0
Mean time between failures (h) 38.0 36.8 69.8 45.5 36.4 53.8 46.1
Mean duration of a failure (h) 0.9 0.7 0.5 0.9 0.9 1.2 0.9
Table 7: Generalfigures for 2001,detailed run by run.

2001 HIGHLIGHTSESRF
The X-ray Source
121
Investigating the LatticeFocusing ErrorsThe correction of optics asymmetry due to quadrupole errorsis of great importance in reaching the ideal performance of thestorage ring. Following the success of utilising the off-diagonalorbit response matrix to deduce skew quadrupole errors forthe analysis and correction of coupling, the extraction ofnormal quadrupole errors has recently been attempted. Errorsare deduced by fitting the diagonal response matrix of themodel to the measured. The start is from a symmetricalsolution and the steerer calibration found in the averagedresponse matrix analysis. An iterative solution of a linearisedequation is made with the singular value decomposition (SVD)method. An application was made to the response matrixmeasured with all quadrupole correctors switched off. Theerror distribution obtained (Figure 177) gives a reasonablygood fit in both planes.
Fig. 177: Quadrupole error distribution along the ringcircumference deduced from the response matrix.
Twiss parameters and the invariant of motion can beextracted from the phase space constructed at every straightsection using the mille-tour beam position monitors(MTBPMs). Beta and phase advances are obtained at eachBPM by analysing the spectral amplitude and phase on thetune frequency.The excellent precision of MTBPMs enabledus to detect a quad error of 10-4 in strength deliberatelyintroduced into the lattice. Such an error was detected as astep change in the phase advance. An application was alsomade to study the origin of betatron tune shift with beamcurrent, by taking the difference in phase advance between5 and 200 mA.Contrary to the case of the localised error, theresult showed a smooth increase in the phase difference,which is consistent with the hypothesis that the origin is thewake field generated in low-gap chambers distributedaround the ring.
Figure 178 presents a comparison of the beta functionsalong the ring circumference by both methods (responsematrix and MTBPMs) showing a remarkable agreement. Onthe basis of the quadrupole error distribution obtained, anonline correction of the optical asymmetry is underway.To beable to iterate the correction, a partial response matrixacquisition on a limited number of steerers will be made to
speed up the process. The linking of this scheme to theconventional correction of half-integer resonances will alsobe pursued. As opposed to the classically applied correctionof the closest half integer resonance, this method shouldcorrect a large number of resonances simultaneously.
In-vacuum UndulatorsIn 2001, a significant effort went towards the construction offour 2 metre-long in-vacuum undulators (Table 8,Figure 179). Their operation at a much smaller magneticgap than conventional undulators, in which the magnets arelocated in the air outside of the vacuum chamber, permits in-vacuum undulators to produce higher photon fluxes andbrilliance.This is particularly important at energies above 30keV. They are short period devices based on nickel coatedpermanent magnet blocks of type Sm2Co17. Compared toNdFeB, Sm2Co17 offers a good compromise between highpeak field and temperature resistance (vacuum baking at150°C) and radiation damage.
Device Period [mm] ID straight Installation statusU23 23 ID22 InstalledU17 17 ID9 Winter 2001/2002U21 21 ID29 Winter 2001/2002U18 18 ID13 Summer 2002Table 8: The new in-vacuum undulators
Fig. 178: Horizontal beta measured along the ringcircumference for an uncorrected lattice. A good agreement isreached between the response matrix and the MTBPMs typeof measurement.
Fig. 179: In-vacuum undulator installed in the tunnel of thestorage ring.

HIGHLIGHTS 2001 122ESRF
The X-ray Source
The usual magnetic field correction methods used forconventional undulators are applicable to in vacuumundulators (Figure 180). In particular, spectrum shimminghas a significant impact on the potential use of highharmonics of undulator spectra in the energy range of 50 to
100 keV. Figure 181 shows the computed photon fluxesversus energy in a finite square aperture (1mm x 1mm) at30 m from the source (U23 with a gap of 6 mm). The redcurve is the spectrum computed with the actual magneticfield (including residual errors) and the blue curvecorresponds to the output from an ideal (error free). In bothcases the calculations assume standard ESRF electronbeam (I = 200 mA), emittance 4 nm (40 pm) horizontally(vertically) and a device installed in a high beta straight suchas ID22.The differences between both spectral fluxes areessentially visible on the high harmonics. In particular thelosses observed on the harmonic 15 (E = 95 keV) are lowerthan 30%.
The construction of in-vacuum undulators will be pursued in2002.
3 Tesla Permanent MagnetWigglerA 3 Tesla permanent magnet wiggler [1] has been installedin the ID15 straight section (Figure 182). It replaces the 4
Tesla super conducting wiggler. This prototype consists intwo periods of 380 mm. The magnetic field is asymmetric toproduce circular polarisation at high energy. The magneticstructure has been optimised for the highest achievable field(3.12 T) at a magnetic gap of 11 mm. The field integralcorrection versus magnetic gap is particularly delicate due toa high hysteresis of the poles. Note that this is by far thehighest magnetic field ever achieved by a permanent wiggleron any synchrotron source.
Reference[1] J. Chavanne, P.Van Vaerenbergh, P. Elleaume, Nucl. Inst.Meth. in Phys. Res. A421 352-360 (1999).
Progress with NEG-coatedVacuum ChambersThanks to a collaboration with CERN during the last fewyears, there are now 10 insertion device vacuumchambers in operation on the ring that are pumped by anon evaporable getter (NEG) coating.The getter material ismade of titanium, vanadium and zirconium, which providesboth a low photo desorption and pumping. It is depositedon the inner wall of the chamber by magnetron sputtering.The pumping efficiency of one such coating was previouslytested with some 11 mm internal aperture chambers bymeasuring the bremstrahlung generated on the axis of thestraight section. In 2001, the NEG coating was applied tothe 8 mm internal aperture vacuum chambers. Five ofthese narrow chambers are now in user operation. All 8mm chambers were pre-conditioned on a dedicatedstraight section and then moved to their final destination.The other five NEG coated chambers are 15 mm thick andmade of aluminium. To date, all chambers have beencoated at CERN. The vacuum group is now developing itsown facility to coat the future chambers in house. This willalso serve to investigate the coating of other types ofstorage ring chambers such as the quadrupole and crotchvacuum vessels.
Fig. 180: Field measurement of an in-vacuum undulator.
Fig. 181: Spectral fluxes computed from measured magneticfield (red) and an error free undulator (blue).
Fig. 182: 3 Tesla permanent magnet wiggler in the ring tunnel.

2001 HIGHLIGHTSESRF
The X-ray Source
123
Status of TransverseInstabilities StudiesBetatron tune shifts with current have long been a puzzle.They have opposite signs for the horizontal and vertical andbecome larger than two synchrotron-side bands at theoperating current of 200 mA (Figure 183). When verifyingthat the effect is not related to a closed-orbit drift anddepends only on the average current, the resistive-wall wakefield was suspected owing to its long-range nature. In fact,studies have recently been made elsewhere showing thatresistive-wall chambers with an asymmetric cross sectiongenerate a quadrupolar mean field. A program wasdeveloped at the ESRF to compute the transverse wakefields and was applied for the 10 and 15 mm stainless steelID vacuum chambers that contribute in a major way to theinstabilities. Incoherent tunes of each bunch were thencomputed, taking into account the actual configuration oflow-gap chambers in the ring, the beam-filling structure aswell as the multi-turn effect.
The results showed firstly that the single turn effect is muchtoo small to explain the measured tune shifts, suggestingthe importance of multi-turn build-up of the wake field, andsecondly that the tune shift is much stronger horizontallythan vertically due to the different horizontal and verticallattice functions in the ID straight sections. To verify thefindings, head to tail tune shifts in a bunch train weremeasured experimentally because they are expected torepresent the single turn effect. Both horizontal and verticaltune shifts were found to be in good agreement withexpectations. Numerical studies also revealed a significantdetuning in single bunch due to the strong short-rangecomponent of the resistive-wall wake field, which goes wellwith observations such as a high sensitivity of the singlebunch at high current to the horizontal half-integerresonance and an increase of horizontal coherent modefrequency with chromaticity (Figure 184a). In particular, atzero chromaticity, the mode 0 is only slightly detuned, whileother head-tail modes are focused by a similar degree(Figure 184b). It may be that the mode zero is under theinfluence of counteracting inductive impedance and amean resistive-wall field, while others are only focused bythe latter.
Fig. 184: a) Coherent tune versus chromaticity; b) detuning ofhead-tail modes in the mode-merging regime, measured in thehorizontal plane.
Besides the peculiar behaviour of mode frequency shifts, amarked reduction has been recently observed in the singlebunch threshold current horizontally (Figure 185). Inparticular, the horizontal transverse mode coupling instabilitythreshold around 2 mA can no longer be regarded as highcompared to the vertical current threshold of 0.8 mA. Whilethe vertical instabilities, which are more critical, were studiedextensively within the framework of a PhD thesis presentedin 2000, horizontal investigations have been initiated thisyear. The study is currently focused on quantifying theincoherent tune shift, which should be subtracted from thetotal tune shifts observed in order to estimate the horizontalimpedance.
Damping Links to AttenuateGirder VibrationsIn order to attenuate the fundamental resonant vibration ofthe ESRF machine girder around 7 Hz, and to improvebeam stability, damping links (a damping device) werecompletely implemented in the storage ring after the 2001March shutdown.
Fig. 183: Measured current-dependent tune shifts, with andwithout orbit correction.
Fig. 185: Current threshold as a function of the horizontalchromaticity.

HIGHLIGHTS 2001 124ESRF
The X-ray Source
The damping link design adds a viscoelastic link betweenthe girder and the floor. It consists of three parts(Figure 186):• a sandwich structure with Aluminum plates and VEM (Al +VEM + Al)• a girder mounting fixture (GMF) links the sandwichstructure to the girder• a floor mounting fixture (FMF) links the sandwich structureto the floor.
Our aim was to use the sandwich structure with VEM toabsorb the dynamic strain energy of the girder assemblyrelated to the rocking motion. The damping links wereinstalled on the two extremities of the girder and floor (asshown in Figure 186) in parallel to the existing jacks.
Vibration tests were performed on quadrupoles before andafter the damping link installation. The peak value in thefrequency response function at the fundamental resonantfrequency is the ‘so-called’ Q-value. The average Q-value ofall the quadrupoles was, respectively, 43.4 and 7.6 beforeand after the installation of the damping links. The reductionfactor is 5.8.
The motion of the electron beam was permanentlymonitored during the installation of the damping links. Ther.m.s amplitude of the horizontal motion in the frequencyrange 4-12 Hz, where the damping links are efficient, isshown in Figure 187. The amplitude was reduced from10 µm initially to 2.7 µm (factor 4) after completion of theinstallation. In broadband (4-200 Hz), the rms. amplitude isreduced from 12 µm to 4 µm, which still significant. Note thatthe installation of damping links was started during the July2000 shutdown.
The power spectral density (PSD) of the horizontaldisplacement of the electron beam, before and afterinstallation, is shown in Figure 188. Initially, there was amain peak at 6.8 Hz in the horizontal displacement PSD.Once the storage ring had been equipped completely withdamping links, the peak at 6.8 Hz in the PSD wasdramatically attenuated by a factor of 49. A broad peakaround 30 Hz was also observed on the PSD. The dampinglinks are inefficient there, because this peak is due to thelateral rocking motion of the quadrupole QF2 (or QF7)relative to the girder. The resonant motion of thequadrupoles QF2 and QF7 at 30 Hz is excited by the waterflow in the cooling circuits. As the girder does not move forthis vibration mode, the damping links are therefore noteffective for the vibration of the quadrupoles, as well as forthe motion of the electron beam around 30 Hz. Somecountermeasures to reduce the vibrations of quadrupolesQF2 and QF7 have been studied by finite elementsimulation, and could be very effective.
The significant enhancement of the electron beam stabilitywas also observed on the X-ray beam. As an example,Figure 189 shows the spectra of the X-ray beam intensityvariation measured with the ID14-EH1 beamline in January2000 and in April 2001. Damping links for the machinegirders were installed between these two dates.The spectraare expressed as a percentage of the DC value. Thefluctuation of intensity should be as small as possible,
Fig. 186: Damping link and installation on a G20 magnetgirder assembly.
Fig. 187: Rms horizontal amplitude (4-12 Hz) of the electronbeam motion along the installation of the damping links in thestorage ring.
Fig. 188: Horizontal displacement PSD of the electron beambefore and after the installation of the damping links in thestorage ring.
GMF:Girder Mounting Fixture
VEM:Visco Elastic Material
FMF:Floor Mounting Fixture

2001 HIGHLIGHTSESRF
The X-ray Source
125
therefore the spectral value should be significantly smallerthan 1. The peak at 6.8 Hz in the X-ray bean intensityspectra was removed completely after the installation of thedamping links in the storage ring. Note that a local feedbackon the electron beam was able to significantly reduce theintensity variation around the peak frequency 6.8 Hz, but thepeak was still visible.
Time-resolved Beam LossDetectionThe existing beam loss detectors have been adapted inorder to resolve in time, turn by turn, the rate of electron lossfollowing the injection process. The time-resolved study ofthe losses following injection allows the study of themechanism of different loss processes. An understanding ofthe significance of the different loss processes is importantin order to improve the overall efficiency and to control theradiation dose produced during the injection.
The electrons lost during the injection process are detectedvia the shower of secondary particles created due to theirpassage through the vacuum chamber and the magnetblocks. This secondary radiation scattered towards theinside wall of the tunnel causes scintillation in a 60 cm longby 25 mm diameter Perspex rod. The visible light soproduced is guided towards a photo multiplier tube at oneend. The whole apparatus is protected from synchrotronradiation and stray light by a 1 cm thick lead tube.The signalfrom the anode can then be coupled directly into a 50 ohmcable and viewed on an oscilloscope in the control room.Typical signals received after the cell 6 scraper are shownin Figure 190. With this diagnostic system we were able todistinguish for the first time, losses from the end of thetransfer line, losses due to transverse phase spaceacceptance and also due to the longitudinal captureprocess. Intense losses are seen during the first tens ofturns due to the large horizontal betatron oscillation of the
beam followed by distributed losses over several hundredturns due to the longitudinal dynamics of the injected beam.By looking just at the losses when exiting the TL2 transferline, we see that they account for a 1% loss of the beam andthe size of the beam was determined to be 1 mm FWHM.The fact that the injection losses extend over manysynchrotron periods was at first puzzling, but has since alsobeen observed at other light sources such as BESSY II.
Progress in the Evaluation ofthe Longitudinal andTransverse MachineImpedance The increase in the number of chambers of irregular shapein the machine, in particular transitions to vessels of smallvertical aperture, has had detrimental effects on the beam.The machine’s performance is suffering (along with othereffects) from the strong detuning of the working point withincreasing current resulting in low values of the current,thresholds of longitudinal and transverse instabilities [1].Theunderlying effect is characterised by a deformation of theself-field of the beam (wake field) which leads to aninhomogeneous deceleration and acceleration of theindividual bunches in the longitudinal as well as in thetransverse direction. The effect is formally expressed in thequantities known as longitudinal and transverse machineimpedance.
Determination of the machine impedance requires thecalculation of the geometrical wakefield produced by eachpiece of the vacuum chamber of the ring. The computation
Fig. 189: Spectra of the X-ray beam intensity variationmeasured with the ID14-EH1 beamline.
Fig. 190: Electron losses versus time during injection fordifferent accelerating RF voltages. The full time window is 4 ms.

HIGHLIGHTS 2001 126ESRF
The X-ray Source
is made in three dimensions with a dedicated program [2]which requires significant computer resources.This task wasinitiated in 2000 and is advancing. So far it has beenrestricted to the vertical plane.The main purpose consists inunderstanding the detuning of the single bunch as a functionof current. The vertical transverse impedance of all tapers(including in-vacuum undulators), cavities, scrapers, RF-fingers and pumping slots have already been calculated.The contribution from each element is weighted by its localvertical beta-function. Simulations show that the contributionfrom some components located at a spot where the verticalbeta-function is high plays a much more important role thanoriginally expected. This is true in particular for the RF-fingers (located inside the bellows) whose change in cross-section from one extremity to the other is found to producethe dominant contribution of the total transverse impedance,even assuming perfect electrical contact of the fingers.
At present, the simulations can account for one half of themeasured detuning. The study will be continued to identifythe other elements having an important vertical transverseimpedance contribution. It will also be extended to thehorizontal plane. Such studies allow the ab initiocomputation of the impedance contributions generated byeach new piece of vacuum chamber and can therefore beused to find a satisfactory engineering solution minimisingthe impact on beam stability.
References[1] J.L. Revol, R. Nagaoka, P. Kernel, L. Tosi,E. Karantzoulis, EPAC 2000 Vienna.[2] W. Bruns, GdfidL: A Finite Difference Program withReduced Memory and CPU Usage, PAC 97,Vancouver, p.2651.[3] ESRF Highlights 2000.
Stripline Type ElectrodesSeveral stripline type electrodes have been developed andinstalled on the ring.
The stripline electrode is more sensitive than the classicalcapacitive type electrodes used for the beam positionmonitors. Figure 191 presents a view of such an electrode.The coupling with the beam is quite high compared to theelectrostatic button pick-ups used for the BPM. Thefrequency bandwidth is large. It is limited in the lowfrequency domain by the length of the line, and in the highfrequency by the quality of the feedthrough connector.When used as a pick-up electrodes, the high sensitivityallows the detection of a single bunch of less than 10 µA.This is of high importance to tune the orbit during injectionwithout producing excessive dose rates of neutrons andgammas. When used as a kicker, its large frequencybandwidth allows the selective excitation of a single bunch
which greatly simplifies the removal of the undesirablebunches in the hybrid mode of operation (process alsoknown as cleaning).
Microwave Cavity Pick-upsThe microwave pick-up is shown in Figure 192.
These microwave pick-ups are resonant to a high frequencyof 10 or 18 GHz with a bandwidth of 20 Mhz. They providesignals that probe the microwave oscillation modes of theelectron beam both along the vertical and longitudinal axis.The plots in Figure 193 show the build up of a coherentlongitudinal microwave oscillation above a threshold currentof 5 mA per bunch.
Fig. 191: Stripline electrode installed on a short chamberbetween two flanges.
Fig. 192: Drawing of the microwave pick-ups attached aboveand below the vacuum chamber.
Fig. 193: Signal delivered by the microwave pick-up: a) showsa single peak the frequency of which is a high harmonicnumber of the revolution frequency (recorded with a 5 mAcurrent); b) a set of sideband lines typical of the microwaveinstability (recorded at 10 mA).
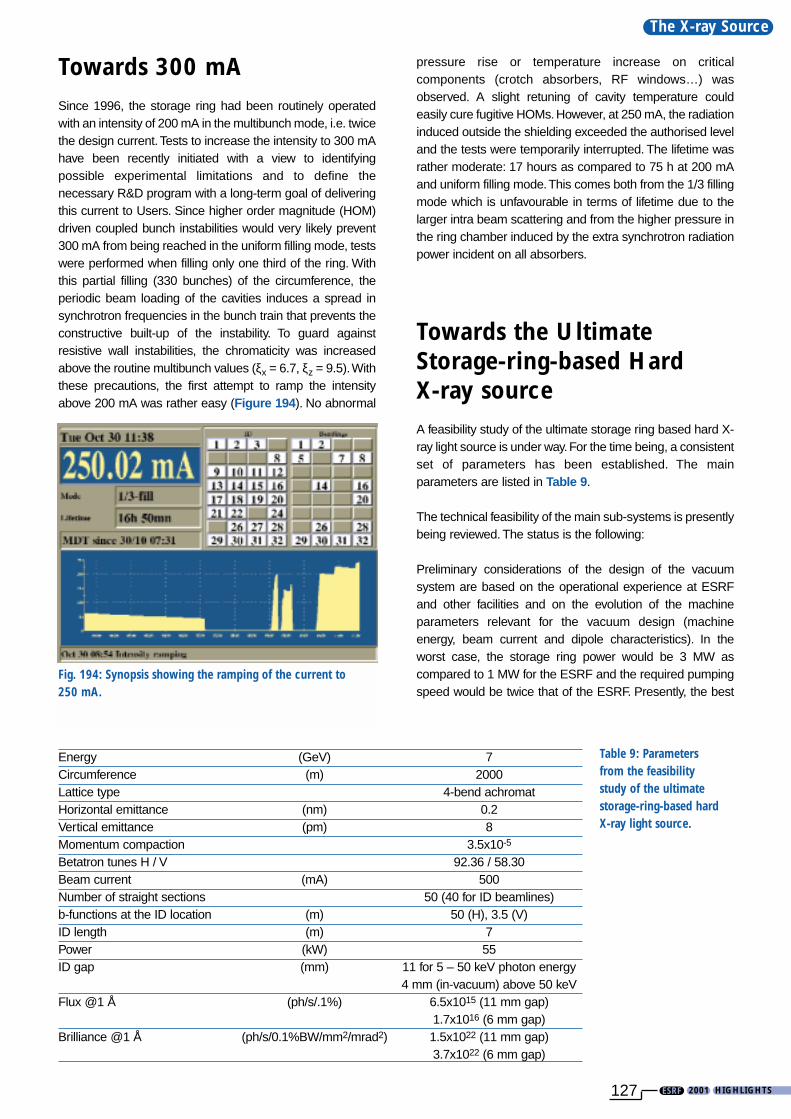
2001 HIGHLIGHTSESRF
The X-ray Source
127
Towards 300 mASince 1996, the storage ring had been routinely operatedwith an intensity of 200 mA in the multibunch mode, i.e. twicethe design current.Tests to increase the intensity to 300 mAhave been recently initiated with a view to identifyingpossible experimental limitations and to define thenecessary R&D program with a long-term goal of deliveringthis current to Users. Since higher order magnitude (HOM)driven coupled bunch instabilities would very likely prevent300 mA from being reached in the uniform filling mode, testswere performed when filling only one third of the ring. Withthis partial filling (330 bunches) of the circumference, theperiodic beam loading of the cavities induces a spread insynchrotron frequencies in the bunch train that prevents theconstructive built-up of the instability. To guard againstresistive wall instabilities, the chromaticity was increasedabove the routine multibunch values (ξx = 6.7, ξz = 9.5).Withthese precautions, the first attempt to ramp the intensityabove 200 mA was rather easy (Figure 194). No abnormal
pressure rise or temperature increase on criticalcomponents (crotch absorbers, RF windows…) wasobserved. A slight retuning of cavity temperature couldeasily cure fugitive HOMs. However, at 250 mA, the radiationinduced outside the shielding exceeded the authorised leveland the tests were temporarily interrupted. The lifetime wasrather moderate: 17 hours as compared to 75 h at 200 mAand uniform filling mode.This comes both from the 1/3 fillingmode which is unfavourable in terms of lifetime due to thelarger intra beam scattering and from the higher pressure inthe ring chamber induced by the extra synchrotron radiationpower incident on all absorbers.
Towards the UltimateStorage-ring-based Hard X-ray sourceA feasibility study of the ultimate storage ring based hard X-ray light source is under way. For the time being, a consistentset of parameters has been established. The mainparameters are listed in Table 9.
The technical feasibility of the main sub-systems is presentlybeing reviewed. The status is the following:
Preliminary considerations of the design of the vacuumsystem are based on the operational experience at ESRFand other facilities and on the evolution of the machineparameters relevant for the vacuum design (machineenergy, beam current and dipole characteristics). In theworst case, the storage ring power would be 3 MW ascompared to 1 MW for the ESRF and the required pumpingspeed would be twice that of the ESRF. Presently, the best
Fig. 194: Synopsis showing the ramping of the current to250 mA.
Energy (GeV) 7Circumference (m) 2000Lattice type 4-bend achromatHorizontal emittance (nm) 0.2Vertical emittance (pm) 8Momentum compaction 3.5x10⁻⁵
Betatron tunes H / V 92.36 / 58.30Beam current (mA) 500Number of straight sections 50 (40 for ID beamlines)b-functions at the ID location (m) 50 (H), 3.5 (V)ID length (m) 7Power (kW) 55ID gap (mm) 11 for 5 – 50 keV photon energy
4 mm (in-vacuum) above 50 keVFlux @1 Å (ph/s/.1%) 6.5x10¹⁵ (11 mm gap)
1.7x10¹⁶ (6 mm gap)Brilliance @1 Å (ph/s/0.1%BW/mm2/mrad2) 1.5x10²² (11 mm gap)
3.7x10²² (6 mm gap)
Table 9: Parametersfrom the feasibilitystudy of the ultimatestorage-ring-based hardX-ray light source.

HIGHLIGHTS 2001 128ESRF
The X-ray Source
solution for the vacuum system appears to be a bakeable,NEG-coated constant-cross-section vacuum chamber,produced by extruding aluminium with massive pumping atthe crotch and absorber location.
To avoid a growth of the electron energy spread that wouldspoil the undulator brilliance at high harmonics, it is of primeimportance to avoid the HOM driven coupled bunchinstability. Two possiblilities have been reviewed: the use ofroom temperature cavities with heavy HOM dumpers (suchas those developed for PEP-II or DAFNE) or the use ofsuperconducting RF cavities. In this respect a schemewhere 6 SOLEIL-type cavities would occupy three straightsections is a possible solution. One of the key features forthe RF system will be the number of closed insertion devicegaps. They will strongly influence the RF working point
(voltage, power, optimum coupling) since the energy lossper turn varies by more than a factor of 2, depending on thenumber of insertion devices in operation.
As far as transverse instabilities are concerned, one of thecritical issues is the machine impedance. Even if themachine is operated with a large number of bunches andlow bunch current, the evolution of the instability relatedparameters with the lowering of the emittance (smallermomentum compaction, smaller synchrotron tune, shorterbunch length, longer damping times) is expected to have asevere impact on thresholds. The use of feedback systemsand the minimisation of the impedance are mandatory forachieving the intensity target goal. When compared to theESRF impedance, the impedance would have to be reducedby at least a factor of 3 to 5.

2001 HIGHLIGHTSESRF129

HIGHLIGHTS 2001 130ESRF
Facts and Figures
The BeamlinesAll thirty of the ESRF public beamlines have beenoperational since 1999. Two of these possess two end-stations, so there are thirty-four end-stations in total,which can be run independently. An additional fifteenbeamline branches, situated on bending magnets, aredevoted to Collaborating Research Groups (CRG). Ten ofthe CRG beamlines are now in operation (includingGRAAL), the others are in the phases of planning,construction or commissioning. Figure 195 shows thelocation of the beamlines in the experimental hall; a list ofthe public beamlines is presented in Table 10; and a listof the CRG beamlines in Table 11.
Following management proposals, the Council decided inJune 2000 that the MAD beamline BM14 will be operatedjointly by British and Spanish CRG teams until the year2002. By then the Powder Diffraction beamline will havebeen transferred from a bending magnet, BM16, to aninsertion device, ID31. BM16 will then become a SpanishCRG line retaining full MAD capability and BM14 willbecome a completely British CRG.
Additionally, there is an industrial beamline, ID27, whichis used for impurity analysis on silicon wafers. This linehas capacity for further expansion to other fields ofindustrial interest.
Fig. 195: Experimental hall with the operational andscheduled beamlines (public and CRG beamlines).
Public beamlines (operational) 30Number of independent end-stations 32
Insertion device ports for the machine 2
CRG beamlines (operational) 11
Free bending magnet ports 6
ID27
(IN
DU
ST
RY
)
3231
30
29
28
2726
2524
23
22
21
20
1918
17 1615
14
13
12
1110
98
76
5
4
321
ID1BM1 (SW/NOR CRG)
ID2BM2 (D2AM CRG)ID3
BM5
ID6 (MACHINE)
BM
7 (GR
AA
L)
BM
8 (GILD
A C
RG
)ID10
ID11
ID12
ID13
ID14
(MAD CRG1) B
M14ID15ID16BM16ID17
ID18
ID19
ID20
ID24
BM29
ID32BM32 (IF CRG)
Optics lab.
ID9
BoosterSynchrotron
Storage Ring
Central Building
ID26
ID21
ID22
ID30
ID31BM30 (FIP CRG)
ID29
BM
28 (X
MA
S C
RG
)
ID28
BM
27
BM
26 (
DU
BB
LE C
RG
)
BM
25 (S
PAN
ISH
-SP
LIN
E C
RG
)
BM
23
(MA
CH
INE
TES
T) ID23BM
22
BM20 (ROBL CRG)
BM19
BM18
ID8
BM31

2001 HIGHLIGHTSESRF
Facts and Figures
131
SOURCE NUMBER OF BEAMLINE STATUSPOSITION INDEPENDENT NAME
END-STATIONS
ID1 1 Anomalous scattering Operational since 07/97
ID2 1 High brilliance Operational since 09/94
ID3 1 Surface diffraction Operational since 09/94
ID8 1 Dragon Operational since 02/00
ID9 1 White beam Operational since 09/94
ID10A 1 Troika I + III Operational since 09/94
ID10B 1 Troika II Operational since 04/98
ID11 1 Materials science Operational since 09/94
ID12 1 Circular polarisation Operational since 01/95
ID13 1 Microfocus Operational since 09/94
ID14A 2 Protein crystallography EH 1 Operational since 07/99
Protein crystallography EH 2 Operational since 12/97
ID14B 2 Protein crystallography EH 3 Operational since 12/98
Protein crystallography EH 4 Operational since 07/99
ID15A 1 High energy diffraction Operational since 09/94
ID15B 1 High energy inelastic scattering Operational since 09/94
ID16 1 Inelastic scattering I Operational since 09/95
ID17 1 Medical Operational since 05/97
ID18 1 Nuclear scattering Operational since 01/96
ID19 1 Topography Operational since 06/96
ID20 1 Magnetic scattering Operational since 05/96
ID21 1 X-ray microscopy Operational since 12/97
ID22 1 Microfluorescence Operational since 12/97
ID24 1 Dispersive EXAFS Operational since 02/96
ID26 1 X-ray absorption on ultra-dilute samples Operational since 11/97
ID27 1 Industry Operational since 08/00
ID28 1 Inelastic scattering II Operational since 12/98
ID29 1 Multiwavelength anomalous diffraction Operational since 01/00
ID30 1 High pressure Operational since 06/96
ID32 1 SEXAFS Operational since 11/95
BM5 1 Optics - Open Bending Magnet Operational since 09/95
BM16 / ID31 1 Powder diffraction Operational since 05/96
BM29 1 X-ray absorption spectroscopy Operational since 12/95
Table 10: List of the ESRF public beamlines in operation.
SOURCE NUMBER OF BEAMLINE FIELD STATUSPOSITION INDEPENDENT NAME OF RESEARCH
END-STATIONS
BM1 2 Swiss-Norwegian BL X-ray absorption & diffraction Operational since 01/95
BM2 1 D2AM (French) Materials science Operational since 09/94
BM7 1 GRAAL (Italian / French) Gamma ray spectroscopy Operational since 06/95
BM8 1 Gilda (Italian) X-ray absorption & diffraction Operational since 09/94
BM14 1 MAD CRG 1 MAD Operational since 01/01
BM16 1 MAD CRG 2 MAD Design phase
BM20 1 ROBL (German) Radiochemistry & ion beam physics Operational since 09/98
BM25 2 SPLINE (Spanish) X-ray absorption & diffraction Construction phase
BM26 2 DUBBLE (Dutch/Belgian) Small-angle scattering & interface diffraction Operational since 12/98 Protein crystallography + EXAFS Operational from 06/01
BM28 1 XMAS (British) Magnetic scattering Operational since 04/98
BM30 2 FIP (French) Protein crystallography Operational since 02/99FAME (French) EXAFS Construction phase
BM32 1 IF (French) Interfaces Operational since 09/94
Table 11: List of the Collaborating Research Groupbeamlines in operation, in construction or in design phase.
Transfer to ID31,begin. 2002
Transferred from ID2
Transferredfrom ID12
BM14 = British/Spanish → British in 2002BM16 → Spanish in 2002
*
**

HIGHLIGHTS 2001 132ESRF
Facts and Figures
User OperationDuring the year 2001 the full complement of 30 publicbeamlines, together with 8 additional beamlines operatedby Collaborating Research Groups (CRGs), were open foruser experiments. Requests for beam time, and thenumbers of users carrying out experiments continued toincrease, this can be seen in Figure 196.This figure showsthe number of applications for beam time and experimentscarried out, together with numbers of scientists’ visits since1996.
Proposals for experiments are selected and beam timeallocations are made through peer review. ReviewCommittees of specialists from European countries, Israeland the rest of the world have been set up in the followingscientific areas:• chemistry• hard condensed matter: electronic and magnetic
properties• hard condensed matter: structures• materials engineering and environmental matters• life sciences• methods and instrumentation• soft condensed matter• surfaces and interfaces
The Review Committees met twice during the past year,some six weeks after each deadline for submission ofproposals (1 March and 1 September). They reviewed atotal of 1582 applications for beam time, and selected 745(47%), which were then scheduled for experiments.
Features of this period have been the increasing number ofprojects concerned more with applied than basic researchin materials science, engineering and environmentalmatters. As shown in Figure 197, experiments in theseareas accounted for 11% of the total number ofexperiments carried out in the first half of 2001. In addition,for the life sciences, the number of macromolecular
crystallography experiments has risen notably. This is dueto a combination of the availability of five experimentalstations dedicated to macromolecular crystallography, veryrapid data collection times – frequently less than one shift- and the very successful operation of the Block AllocationGroup (BAG) scheme, designed to encourage groups ofusers to block together their multiple requests for beamtime, and the scheduling of their experiments. As anindication, the number of BAGs, initially 20 late in 1998,rose to 38 by the second scheduling period in 2001.
Requests for beam time, which is scheduled in shifts of 8hours, totalled 24 824 shifts or 198 592 hours for the year,of which 11 281 shifts or 90 248 hours (45%) wereallocated; the distribution of shifts by scientific area isshown in Table 12.
The first half of 2001 saw 2 051 visits by scientists to theESRF under the user programme, to carry out 530experiments. This dramatic rise in the number of usersvisits since 1999 reflects the increase in the number ofexperiments carried out overall, and in particular multiplevisits by macromolecular crystallography BAG teams. Thebreakdown of experiments carried out, by scientific area, isshown in Figure 197.
14701146
1996 1997 1998 1999 2000 2001
Years
Num
ber o
f pro
posa
ls/U
sers
6000
5000
4000
3000
2000
1000
0
Applications for beamtime
Experiment sessions
User visits
15821089
518
1259
656
1380
766
1394
915
5049
1777
23762726
3361
LS B
lock
allo
catio
n sc
hem
e
Scientific field Total shifts Total shiftsrequested allocated
Chemistry 2 724 1 270Hard condensed matter:• Electronic and magnetic prop. 4 678 1 494• Structures 5 330 2 131Materials engineering & environmental matters 2 609 1 294Life sciences 4 062 2 268Methods & instrumentation 1 169 571Soft condensed matter 2 019 1 090Surfaces & interfaces 2 233 1 163
Totals 24 824 11 281
Table 12: Number of shifts of beam time requested andallocated for user experiments, year 2001.
Fig. 196: Numbers of applications for beam time, experimentscarried out, and user visits, 1996 to 2001. N.B. final numbersof experiments and user visits for 2001 were not available atthe time of going to press.
Fig. 197: Shifts scheduled for experiments, from February toJuly 2001, by scientific area.

2001 HIGHLIGHTSESRF
Facts and Figures
133
The number of users in each experimental teamaveraged 3.9 persons, and they stayed for some 3 days.Users responding to questionnaires indicate that theyparticularly appreciate the assistance they receive fromscientists and support staff on beamlines, and smoothadministrative arrangements, in addition to the qualityboth of the beam and of the experimental stations.Facilities on site, such as preparation laboratories, a
library, a canteen, and the guesthouse, also make animportant contribution to the quality of user support.
On the beamlines, beam time losses tended to occurbecause of occasional difficulties with the beamlinecomponents or with samples. Such beam time losses,however, remained below 5% of the total shifts scheduledfor experiments during the period.
Administration and Finance
kEuro
Expenditure
MachinePersonnel 4,577.6Recurrent 2,187.6
Operating costs 1,844.2Other recurrent costs 343.5
Capital 2,958.7Machine developments 2,958.7
Beamlines, experiments and in-house research
Personnel 17,948.2Recurrent 6,486.2
Operating costs 3,859.0Other Recurrent costs 2,627.2
Capital 6,512.9Beamline developments 4,457.2Beamline refurbishment 2,055.8
Technical and administrative supportsPersonnel 13,255.1Recurrent 7,924.8Capital 3,949.6
Unexpended committed fundsFunds carried forward to 2001 379.0
Total 66,179.8
kEuro
Income
2000 Members’ contributions 61,589.4Funds carried forward from 1999 73.6
Other incomeScientific Associates 1,764.5Sale of beam time 665.5Other sales 269.6Scientific collaboration and Special projects 820.7Income covering expenditure in connection with activities from 3rd parties 581.0Financial discounts 4.5Bank loans 103.3Other 307.7
Total 66,179.8
Expenditure and income 2000
kEuro
Expenditure
MachinePersonnel 4,421Recurrent 2,012
Operating costs 1,535Other recurrent costs 534
Capital 3,533Machine developments 3,533
Beamlines, instruments, experiments and in-house research
Personnel 19,091Recurrent 6,558
Operating costs 3,770Other Recurrent costs 2,777
Capital 6,764Beamline developments 4,746Beamline refurbishment 2,018
Technical and administrative supportsPersonnel 13,355Recurrent 8,396Capital 4,688
Industrial and commercial activityPersonnel 361Recurrent 86
Total 69,265
kEuro
Income
2001 Members’ contributions 62,513Funds carried forward from 2000 379
Other incomeScientific Associates 1,948Sale of beam time 940Other sales 276Scientific collaboration and Special projects 859Income covering expenditure in connectionwith activities from 3rd parties 696Financial discounts 5Bank loans 15Miscellaneous income 1,634
Total 69,265
Revised expenditure and income budget for 2001

HIGHLIGHTS 2001 134ESRF
Facts and Figures
kEuro
PERSONNEL
ESRF staff 34,255.6External temporary staff 121.3Other personnel costs 1,404.0
RECURRENT
Consumables 6,237.5Services 8,144.8Other recurrent costs 2,216.3
CAPITAL
Buildings, infrastructure 1,486.6Lab. and Workshops 690.1Machine incl. ID’s and Fes 2,958.7Beamlines, Experiments 6,512.9Computing Infrastructure 1,561.5Other Capital costs 211.5
Unexpended committed fundsFunds carried forward to 2001 379
Total 66,179.8
Cadres Non cadres PhD students Total
Staff on regular positions
Machine 24 44 1 69
Beamlines, instruments andexperiments 184 75.5 25 284.5
General technical services 44.6 76.1 120.7
Directorate, administrationand central services 21.3 49.8 71.1
Sub-total 273.9 245.4 26 545.3
Other positions
Short term contracts 6 25.9 31.9
Scientific collaborators 2 2
Staff under “contrats dequalification” (apprentices) 14 14
European Union grants 3 3
Temporary workers 2.9 2.9
Absences of staff(equivalent full time posts) –21.5
Total 287.8 285.3 26 599.1
Absences of staff(equivalent full time posts) –23.7
Total with absences 575.4
1999 2000 2001 2002
2001 manpower(posts filled on 30/09/2001)
Financial resources in 1999, 2000, 2001and 2002, by programme
(current prices in MEuro for the respective years)
Expenditure 2000by nature of expenditure
kEuro
PERSONNEL
ESRF staff 35,637External temporary staff 79Other personnel costs 1,512
RECURRENT
Consumables 6,331Services 8,499Other recurrent costs 2,279
CAPITAL
Buildings, infrastructure 2,757Lab. and Workshops 457Machine incl. ID’s and Fes 3,476Beamlines, Experiments 6,764Computing Infrastructure 1,310Other Capital costs 164
Total 69,265
Revised budget for 2001by nature of expenditure
80
70
60
50
40
30
20
10
0
(in
ME
uro
)
Machine
Experiments
Technical, Administrative Support
1999 2000 2001 2002
Financial resources in 1999, 2000, 2001and 2002, by nature of expenditure
(current prices in MEuro for the respective years)
80
70
60
50
40
30
20
10
0
(in
ME
uro
)
Personnel
Recurrent
Capital

2001 HIGHLIGHTSESRF
Facts and Figures
135
Organisation chart of the ESRF(as of January 2002)
CouncilChairman: R. Comès3 delegates perContracting Party
Administrative andFinance CommitteeChairman: H. Weijma
Science Advisory CommitteeChairman: J. Bordas
Review Committees
ChemistryChairwoman: L. McCuskerHard condensed matterElectronic and magnetic propertiesChairman: G. van der LaanHard condensed matterStructuresChairman: D. ShechtmanMaterials engineering andEnvironmental mattersChairman: W. ReimersLife sciencesChairman: K. WilsonMethods and instrumentationChairman: J. HrdySoft condensed matterChairman: A.J. RyanSurfaces and interfacesChairman: R. Johnson
DirectorGeneral
W.G. Stirling
Services relatedto DG:InformationIndustrial liaisonInternal auditorSafety
MACHINE Theory and application softwarePower suppliesInsertion devicesFront-endsRadio frequencyDiagnosticsOperationSecretariat
MachineDirector:P. Elleaume
TECHNICALSERVICES
Mechanical engineeringBuildings and infrastructureSurvey and alignmentVacuumSecretariat
Head:P. Thiry
COMPUTINGSERVICES
ElectronicsSoftware engineeringMISSystems and communicationSecretariat
Head:W.D. Klotz
ADMINISTRATION PersonnelFinanceCommercial andcentral services
Director ofAdministration:W.E.A. Davies
Joint ILL/ESRFMedical services
Joint ILL/ESRFLibrary
EXPERIMENTS Beamline groups:• Surfaces and
interfaces• Materials science
and engineering• X-ray absorption and
magnetic scattering• Dynamics and
electronic structure
Theory group
Research Director:F. Sette
Beamline groups:• Soft condensed matter• Macromolecular
crystallography• X-ray imaging
Optics group
Research Director:P.F. Lindley
Technical beamlinesupport:• Instrument support• Scientific software• Beamline instrument
Software support• Mechanics service• Labs and services• Industrial beamline
ID27
User office
CRG liaison
Building manager
Secretariat

Chief EditorD. Cornuéjols, ESRF information officerEditorG. Admans, ESRF information officerLayoutPixel ProjectPrintingImprimerie du Pont de Claix
© ESRF • February 2002
Information OfficeESRFBP220 • 38043 Grenoble • FranceTel. (33) 4 76 88 20 25 • Fax. (33) 4 76 88 24 18http://www.esrf.fr
We gratefully acknowledge the help of:J. Baruchel, N. Brookes, F. Comin, J. Doucet,
A. Fitch, A. Freund, G. Grübel, M. Krisch,Å. Kvick, and T. Metzger.