Embed Size (px)
Citation preview

Introducing ENWORKS
By Todd Holden, Programme Director

Objectives of the Partnership
Since 2001…….
• To raise quality standards and achieve consistency
• To plug the gaps where support has been unavailable
• To improve communications and marketing
• To work towards a common vision
• To avoid duplication
• To learn from good practice and evaluate success

ENWORKS Partnership
The Partnership Board includes representatives from:
Northwest Regional Development AgencyEnvironment Agency Robinson Keane North West Chambers of Commerce North West Universities Association United UtilitiesBrother UKGroundwork North WestGovernment Office North WestEnvirolink NorthwestCumbria Rural Enterprise AgencyFederation of Small BusinessesInstitute of Directors

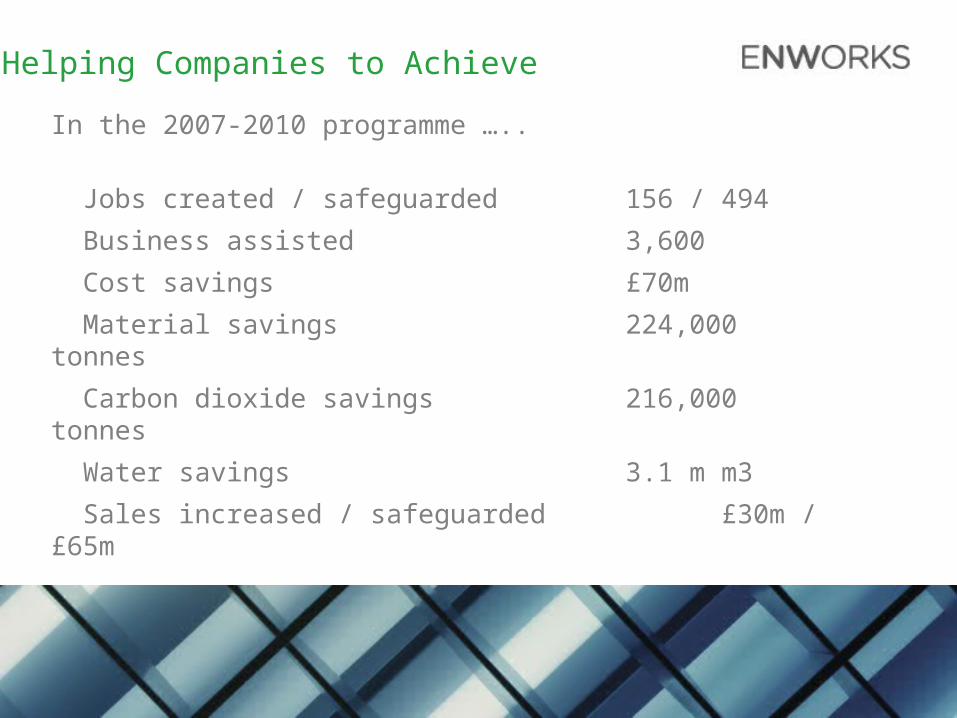
Helping Companies to Achieve
In the 2007-2010 programme …..
Jobs created / safeguarded 156 / 494
Business assisted 3,600
Cost savings £70m
Material savings 224,000 tonnes
Carbon dioxide savings 216,000 tonnes
Water savings 3.1 m m3
Sales increased / safeguarded £30m / £65m

Achieved savings
Savings from opportunities with zero capital cost
-
1,000,000
2,000,000
3,000,000
4,000,000
5,000,000
6,000,000
Behaviouralchange
Clean design Premises Processimprovement
Specification/
procurement
New ETS Unknown
Resource Reduction Methods
Ann
ual s
avin
gs (£
)

North West – CO2 Savings

New opportunity
• Name: Embedding Resource Efficiency in Key Sectors
• Duration: October 2009 – December 2012
• Value: £9,993,000
• Key Metrics: Jobs, Sales, People Trained
• Key Impacts: Costs Savings (Energy, Water, Materials, Waste diverted from landfill)
• Scope: Resource Efficiency
Environmental Risk
Sustainable Procurement
…Cluster specific activity

Improving Your Resource Efficiency
We deliver support in Corporate Responsibility and Resource Efficiency to businesses of all sizes from all sectors.
• Information services• Telephone helpline• Seminars and training• Legal compliance• Networking• Risk management• Climate change mitigation / adaptation
• Audits and reviews• Opportunity identification• On-Site support• Opportunity implementation• Links to other support• Online Resource Efficiency Toolkit

What we will achieve
Jobs created / safeguarded 240 / 500
Business assisted 1,250
Cost savings £60 million
Material savings 170,000 tonnes
Carbon dioxide savings 255,000 tonnes
Water savings 2,050,000 tonnes
Sales increased / safeguarded £25m / £60m

The effects of other metrics on activity and impact
Target = number of businesses advised
Activity = light touch, one off interventions
training events, basic site visit
no triage
Impact = difficult to measure
likely to be minimal

The effects of other metrics on activity and impact
Target = jobs and sales
Activity = ‘Corporate Responsibility’ support
environmental policy, legal compliance
Impact = little or no efficiency savings

• Eco design of products and packaging
• On site facilitation / change management
• On site technical advice
• Monitoring & measurement
• Research, options analysis
• Audit / review of practices
• Opportunity identification & quantification
• Sustainable procurement
• Business continuity / risk
• Legal compliance
• Environmental policies
• Customer demands
If Metrics = Saved£, CO2, materials, water If Metrics = Created
Jobs & Sales

Market Failure – NW Business Survey
• Only 26% have heard the term resource efficiency
• 80% think resource efficiency is important to their business
• Just 33% have taken action to increase their resource efficiency
• ~30% turned off lights, changed bulbs, increased recycling
• ~75% anticipate no return on investment
• Only 20% plan future improvements in resource efficiency
• 71% have not looked for support
• Common perception is that new equipment & capital investment is always necessary… Efficiency is under-rated

Data Analysis
Challenging perceptions:
• ~75% of NW businesses think that resource efficiency improvements will deliver no return on investment
• Analysing the capital cost associated with improvement actions
Annual cost savings Achieved = £27m
• 58% (£13.4m) achieved with no capital cost
• 72% of opportunities (1844/2576)

Types of market failure
• Common property
• Public goods
• Externalities (positive and negative)
• Imperfect and asymmetric information
• Increasing returns
• Market power
…Complex issues often require complex solutions.

Have you ever..?

General population (100%)
No action taken (67%)
Action taken (33%)
Plan to take action (20%)
• 26% heard of term Resource Efficiency• 82% think it’s a good idea• 54% haven’t changed how they use resources in the recession• 71% haven’t sought advice• 6% couldn’t find what they wanted• 51% believe no barriers to RE• Cost perception
• 33% couldn’t see any benefit from improving their resource efficiency
• 14% plan to take action
• Lack focus
• 85% saw a business benefit• 64 - 75% investment hasn’t resulted in cost reductions• 37% have increased recycling• 33% plan to continue with resource efficiency• Lack focus
• 23% / 46% say resource efficiency is part of their business plan• Lack focus• Low investment• Perception of low return

Perceptions
• Not relevant
• Threat not opportunity
• Resource efficiency = utility management
• Need to invest in equipment to save energy
• Investment will not reduce costs
• Time consuming

Challenging perceptions on Efficiency
• £100 million annual savings identified
• £27 million of these are achieved
• 92% are achieved through a reduction in resource use
• 72% of opportunities achieved with no capital cost
• 58% of cost savings achieved with no capital cost
• Of those achieved with capital cost…
• 57% have payback period less than 1 year
• 75% have payback period less than 2 years